comparison of cartridge and membrane solid-phase ... · using ion chromatography. the authors also...
TRANSCRIPT

AD-A260 177
Comparison of Cartridge andMembrane Solid-Phase Extraction
-e With Salting-Out Solvent Extraction forPreconcentration of Nitroaromaticand Nitramine Explosives from WaterThomas F. Jenkins, Paul H. Miyares, Karen F. Myers,Erika F. McCormick and Ann B. Strong December 1992
DTIC44S ELECTEJAN2 91IN1l D
93-01733

AbstractSalting-out solvent extraction (SOE) was compared with cartridge and mem-brane solid phase extraction (SPE) for preconceniration of nitroaromatic andnitramine explosives from water, prior to reversed-phase high performanceliquid chromatographic analysis (RP-HPLC). The procedures were comparedinitially using reagent grade water fortified with TNT, RDX, HMX and nine otheranalytes at concentrations below what could be determined without precon-centration and the results were used to estimate analyte recovery and the lowconcentration detection capability, as characterized by the Certified ReportingLimit (CRL). CRLs for the three procedures were comparable with valuesgenerally in the range of 0.05 to 0.30 ig/L. Percentage recoveries for the threeprocedures were generally greater than 90%, except for those of HMX and RDXobtained by the membrane-SPE procedure. A second comparison among thethree procedures was obtained on 58 groundwater samples from the Rockeyesite at the Naval Surface Warfare Center, Crane, Indiana. Results from a directanalysis procedure were compared to those from the three preconcentrationtechniques to estimate percent recovery of HMX, RDX and TNT for real samples.Recoveries were greater than 80% except for HMX and RDX by the membrane-SPE method. Both SPE procedures exhibited background interferences, whichthe authors attribute to matrix interaction with the SPE polymers. Usability of thethree procedures in a production-oriented laboratory was evaluated withemphasis on solvent consumption, waste production and sample processingtime. The cartridge-SPE was judged to be the least rugged of the threeprocedures.
For conversion of SI metric units to U.S./British customary units of measurementconsult ASTM Standard E380, Metric Practice Guide, published by theAmerican Society for Testing and Materials, 1916 Race St., Philadelphia, Pa.19103.
This report is printed on paper that contains a minimum of 50% recycledmaterial.
Special Report 92-25 M
US Army Corpsof EngineersCold Regions Research &Engineering Laboratory
Comparison of Cartridge andMembrane Solid-Phase ExtractionWith Salting-Out Solvent Extraction forPreconcentration of Nitroaromaticand Nitramine Explosives from WaterThomas F. Jenkins, Paul H. Miyares, Karen F. Myers,Erika F. McCormick and Ann B. Strong December 1992
Accesion For
NTIS CRA&I _ __DTIC TABUnannounced 0Justification
By ".. ......
Distribution I
Availability Codes
IAva and or
DTIC QUALITY InSCTED 3
Prepared forU.S. ARMY TOXIC AND HAZARDOUS MATERIALS AGENCYREPORT CETHA-TS-CR-92064andU.S. ARMY ENGINEER WATERWAYS EXPERIMENT STATION
Approved for pubtc release; dirbutn Is unlmited.

PREFACE
This report was prepared by Dr. Thomas F. Jenkins and Paul H. Miyares, ResearchChemists, Geochemical Sciences Branch, Research Division, U.S. Army Cold RegionsResearch and Engineering Laboratory (CRREL) and by Karen F. Myers, Research Biologist,and Erika F. McCormick and Ann B. Strong, Research Chemists, Environmental Laboratory,U.S. Army Engineer Waterways Experiment Station (WES). Funding for this research wasprovided jointly by the U.S. Army Toxic and Hazardous Materials Agency, AberdeenProving Ground, Maryland (R-90, Multi-Analytical Services), Martin H. Stutz, ProjectMonitor, and the U.S. Army Waterways Experiment Station, Vicksburg, Mississippi (AF 25)Ann B. Strong, Project Monitor.
Dr. C.L. Grant, Professor Emeritus, University of New Hampshire, and Marianne E.Walsh of CRREL are acknowledged for technical review of the manuscript. The authorsacknowledge the assistance of Alan Hewitt (CRREL) for analyzing several groundwatersusing ion chromatography. The authors also wish to acknowledge Roy Wade (WES) for fieldcollection of all groundwaters, S. Paige Pitts and Allyson H. Lynch (WES) for their technicalassistance in groundwater extractions, and Linda K. Stevenson (WES) for sample log-in anddata management.
This publication reflects the personal views of the authors and does not suggest or reflectthe policy, practices, programs, or doctrine of the U.S. Army or Government of the UnitedStates. The contents of this report are not to be used for advertising or promotional purposes.Citation of brand names does not constitute an official endorsement or approval of the useof such commercial products.
-• ,
-, . -
ii

CONTENTSPage
P reface ....................................................................................................................................... iiIntroduction ................................................................................................................... I
Solid-phase extraction ...................................................................................................... 2SPE using Empore extraction disks ................................................................................ 4Salting-out solvent extraction (SOE) ............................................................................... 4Comparisons of SPE and SOE .......................................................................................... 5Objective .............................................................................................................................. 5
Experimental ............................................................................................................................ 6Conduct of study ............................................................................................................... 6Salting-out solvent extraction/nonevaporative preconcentration
procedure ................................................................................................................... 6Cartridge solid-phase extraction .................................................................................... 6M embrane solid-phase extraction .................................................................................. 6RP-HPLC analysis .............................................................................................................. 7Preparation of standards and samples .......................................................................... 9
Results and discussion ........................................................................................................... 9Preliminary experiments- SOE ....................................................................................... 9Preliminary experiments- Cartridge SPE .................................................................. 10Certified reporting limit test ......................................................................................... 11Comparison using groundwater samples ................................................................... 13Second colum n confirmation ......................................................................................... 18Practical considerations ................................................................................................ 18
Conclusions and recomm endations .................................................................................. 20Literature cited ........................................................................................................................ 21Appendix A: Results of 4-day USATHAM A certification test ....................................... 23Abstract ..................................................................................................................................... 33
ILLUSTRATIONS
Figure1. Chemical strvctures of TNT and RDX ........................................................................ 12. LC-18 chromatograms for blank sample preconcentration by
salting-out, cartridge-SPE and membrane-SPE methodsat CRREL ................................................................................................................ 11
3. LC-18 chromatograms for 2X sample preconcentrated bysalting-out, cartridge-SPE and membrane-SPE methodsat CRREL ................................................................................................................ 12
4. Graphical illustration of CRL procedure ................................................................ 125. LC-18 chromatograms for sample 20649 from Rockeye site,
Naval Surface Warfare Center, preconcentrated by salting-out,cartridge-SPE and membrane-SPE methods at W ES ......................................... 15
6. LC-18 chromatograms for sample 20670 from Rockeye Site, NavalSurface Warfare Center, preconcentrated by salting-out,cartridge-SPE and membrane-SPE methods at W ES......................................... 15
7. LC-18 chromatograms for sample 20641 from Rockeye site, NavalSurface Warfare Center, preconcentrated by salting-out, cartridge-SPE and membrane-SPE methods at W ES ......................................................... 16
m.,

Page
8. LC-18 chromatograms for sample 20648 from Rockeye site, NavalSurface Warfare Center, preconcentrated by salting-out, cartridge-SPE and membrane-SPE methods at WES ........................................................ 16
9. Comparison of LC-18 chromatograms from sample 20645 fromCrane-Rockeye Naval Weapons Center preconcentrated by membrane-
SPE and the extract from an uncleaned membrane-SPE unit .......................... 1710. Comparison of LC-18 chromatograms from sample 20645 from
Crane-Rockeye Naval Weapons Center preconcentrated bycartridge-SPE and the extract from uncleaned Porapak R ............................... 18
11. LC-8/LC-CN chromatograms for sample from Rockeye Site, NavalSurface Warfare Center, preconcentrated by salting-out, cartridge-SPE and membrane-SPE methods at WES ........................................................ 19
TABLES
Table
1. Proposed drinking water criteria for nitroaromatics and nitramines .................... 12. Octanol/water partition coefficients (Mow) for nitroaromatics
and nitram ines .......................................................................................................... 23. Methylene chloride/water partition coefficients (Kp) ............................................. 24. Composition of various resins used for solid phase extraction of
explosives from w ater .............................................................................................. 35. Comparison of certified reporting limits for solid-phase extractiot
procedure and salting-out solvent extraction procedures ...................................... 46. Percent recoveries for nitroaromatics and nitramines obtained by
Winslow et al. (1991) using SPE and SOE ........................................................... 57. Retention times for various analytes using two RP-HPLC
separations ................................................................................................................ 78. Retention times for direct water analysis conducted at WES ................................. 79. Preparation of test sam ples ........................................................................................ 810. Results of stirring time study for salting-out extraction ...................................... 911. Results of stirring time study for nonevaporative preconcentration
step .............................................................................................................................. 1012. Characteristics of Porapak R and HayeSep R SPE polymers .............................. 1013. Polymer/water partition coefficients .................................................................... 1014. Certified reporting limits for various preconcentration techniques .................. 1115. Overall percent recovery from Certified Reporting Limit Test .......................... 1316. Y interceps for regression lines for spiked versus found concentrations
in 4-day C RL test ................................................................................................... 1317. Comparison of results for direct analysis of groundwater samples from
the Rockeye Site at the Naval Surface Warfare Center, Crane,Indiana, with the three preconcentration methods ........................................... 14
18. Results of regression analysis of the straight analysis versus thethree preconcentration methods for groundwater samples fromRockeye Site, Naval Surface Warfare Center ...................................................... 14
iv

Comparison of Cartridge and Membrane Solid-Phase ExtractionWith Salting-Out Solvent Extraction for Preconcentration of
Nitroaromatic and Nitramine Explosives from Water
THOMAS F. JENKINS, PAUL H. MIYARES, KAREN F. MYERS,ERIKA F. MCCORMICK AND ANN B. STRONG
INTRODUCTION compounds at trace levels in water. To detect thesecompounds at the sub-part-per-billion concentra-
Classically, batch liquid-liquid extraction (LLE) tion, the first step in these methods has beenhas been used to extract trace organic analytes from preconcentration of the analytes using an extrac-water prior to analytical determination. The suc- tion process.cess of this approach depends upon favorable sol- Classical LLE of these analytes has been re-vent/water partition coefficients (Kp) for the ported. For example, Spanggord et al. (1982) re-analytes of interest. Since many organic pollutants ported extraction of TNT and many of its manufac-of environmental concern are relatively nonpolar, turing impurities from water using diethyl ether.batch extraction with an immiscible organic sol- Phillips et al. (1983) used methylene chloride tovent has been successful. extract nitroaromatics from biosludge. Belkin et al.
TNT (2,4,6-trinitrotoluene) and RDX (hex- (1985) developed a simple method for extractingahydro-1,3,5-trinitro-l,3,5-triazine) (Fig. 1), along nitroaromatics from water using toluene. Belkinwith several of their manufacturing impurities and repurted, however, that poor extraction efficiencyenvironmental degradation products, have beenobserved in groundwater at a number of Army Table 1. Proposed drinking water criteria for nitro-installations (Pugh 1982,Rosenblatt 1986,Spaulding aromatics and nitramines.and Fulton 1988, Maskarinec et al. 1986, Layton etal. 1987). Health Advisories have been issued by Proposed drinking
the EPA for many of these compounds (Table 1), water limit
with drinking water criteria at sub-part-per-billion Compound (pg/L) Reference
concentrations. For this reason, there has been a HMX 4W EPA 1988a
great deal of interest by the Army in developinganalytical methods to enable determination of these RDX 2.0* EPA 1988b
TNT 2.0* EPA 1989CH3 NO2I 2,4-DNT 50** EPA 19920%2 N N02 N" )0.1 Etnier 1987
N N
O N N. No2 2,6-DNT 40"" EPA 1992
NO2 02 N N O2 0.007 Etnier 1987
1,3-DNB 1.0" EPA 1991TNT RDX
* EPA Lifetime Health Advisory NumberFigure 1. Chemical structures ofTNTand RDX. ** EPA number for increased cancer risk of 1.0 x 10⁻⁶.

Table 2. Octanoliwater partition coefficients (Kow) for nitro-
aromatics and nitramines.
Compound Ký. Reference
HMX 1.15 Jenkins, 1989RDX 7.31 Jenkins, 19892,4,6-trinitrobenzaldehyde 14.4 Jenkins, 19891,3,5-trinitrobenzene 15.1 Hansch and Leo, 19791,3-dinitrobenzene 30.9 Hansch and Leo, 1979Tetryl 44.6 Jenkins, 1989 Table 3. Methylene chloride/water par-Nitrobenzene 70.8 Hansch and Leo, 1979 tition coefficients (Ip).2,4,6-trinitrotoluene 72.0 Jenkins, 19894-amino-2,6-dinitrotoluene 81.5 Jenkins, 1989 Compound K, (CH-2C2/water)2-amino-4,6-dinitrotoluene 87.2 Jenkins, 19892,4-dinitrotoluene 95.5 Hansch and Leo, 1979 HMX 12.52,6-dinitrotoluene 104 Jenkins, 1989 RDX 59.6Benzene 135 Hansch and Leo, 1979 1,3,5-trinitrobenzene 299o-nitrotoluene 200 Hansch and Leo, 1979 1,3-dinitrobenzene 356p-nitrotoluene 234 Hansch and Leo, 1979 Nitrobenzene 352m-nitrotoluene 282 Hansch and Leo, 1979 2,4,6-trinitrotoluene 632Toluene 490 Hansch and Leo, 1979 2,4-dinitrotoluene 681
was found for RDX using toluene. Hable et al. Solid-phase extraction(1991) extended Belkin's method and found that As early as 1974, Junk et al. demonstrated thegood extraction efficiency for RDX and HMX utility of resins such as XAD-2 and XAD-4 for the(octahydro-1,3,5,7-tetranitro-1,3,5,7-tetrazocine) extraction of organic compounds from water.could be obtained using isoamyl acetate. Unfortu- Anspach et al. (1982) evaluated 13 commerciallynately, while good extraction efficiency was also available resins for their ability to sorb/desorbobtained for the nitroaromatics using this solvent, eight explosives (TNT, 2,4-DNT, 2,6-DNT, RDX,unacceptably high interferences were introduced tetryl, PETN, nitroglycerine and picric acid). Thethat could not be easily removed. Thus Hable et al. materials tested included several styrene-di-(1991) used two separate extractions and two sepa- vinylbenzene co-polymers, several acrylic esters,rate determinations for nitroaromatics and several carbonaceous materials, a polyvinyl-nitramines, respectively. pyrrolidone, a polyvinylpyrridine, an acrylonitrile
The reason for the difficulty in obtaining good divinylbenzene copolymer, a C-18 reversed-phaseextraction efficiency, particularly for RDX and silica, an activated carbon, and a reversed-phaseHMX, is their high polarity. This can be seen when cyanopropyl bonded material. Overall, Anspach etcomparingtheoctanol/waterpartitioncoefficients al. (1982) concluded that resins containing(Ko(,) fora number of nitroaromatics and nitramines polyvinylpyrrolidone and polyvinylpyrridineof interest (Table 2). K,, values for HMX and RDX (Porapak R and S, respectively) generally outper-are 1.15 and 7.31, respectively, indicating the corn- formed the other materials for preconcentration ofpounds are quite polar and will be difficult to the nitroaromatics, nitramines, nitrate esters andextract from water using nonpolar solvents. Sol- picric acid. Results for tetryl were the exceptionvent/water partition coefficients using methylene and in this case the styrene-divinylbenzene ap-chloride (Table 3), the solvent specified in many peared to be superior. Maskarinec et al. (1984)EPA procedures, are also low for HMX and RDX. compared the extraction efficiency of XAD-4 (aTherefore methylene chl6ride is not an efficient styrene-divinylbenzene polymer), Porapak R andextraction solvent for these compounds either. Porapak S with classical LLE using methylene chlo-
Because of the difficulty in obtaining good ex- ride and found improved recovery for HMX usingtraction efficiency for HMX and RDX with conven- the resins relative to LLE. Maskarinec and Anspach,tional batch LLE, several alternative procedures however, both reported the presence of trouble-were developed. The most successful of these have some background impurities that interfered withbeen the use of solid phase extraction (SPE) and UV detection after RP-HPLC separation. The com-salting-out liquid-liquid extraction (SOE). position of a number of the resins that have been
2
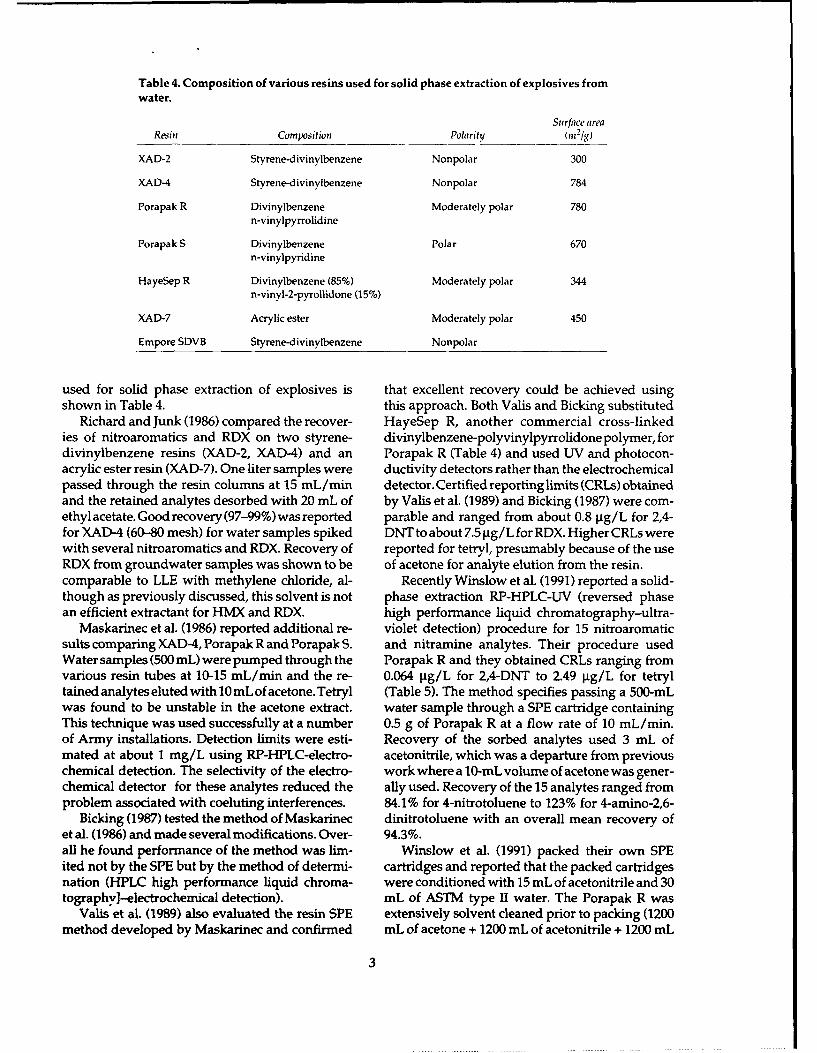
Table 4. Composition of various resins used for solid phase extraction of explosives fromwater.
Surface areaResin Composition Polarity (n,21g)
XAD-2 Styrene-divinylbenzene Nonpolar 300
XAD-4 Styrene-divinylbenzene Nonpolar 784
Porapak R Divinylbenzene Moderately polar 780n-vinylpyrrolidine
Porapak S Divinylbenzene Polar 670n-vinylpyridine
HayeSep R Divinylbenzene (85%) Moderately polar 344n-vinyl-2-pyrollidone (15%)
XAD-7 Acrylic ester Moderately polar 450
Empore SDVB Styrene-divinylbenzene Nonpolar
used for solid phase extraction of explosives is that excellent recovery could be achieved usingshown in Table 4. this approach. Both Valis and Bicking substituted
Richard and Junk (1986) compared the recover- HayeSep R, another commercial cross-linkedies of nitroaromatics and RDX on two styrene- divinylbenzene-polyvinylpyrrolidone polymer, fordivinylbenzene resins (XAD-2, XAD-4) and an Porapak R (Table 4) and used UV and photocon-acrylic ester resin (XAD-7). One liter samples were ductivity detectors rather than the electrochemicalpassed through the resin columns at 15 mL/min detector. Certified reporting limits (CRLs) obtainedand the retained analytes desorbed with 20 mL of by Valis et al. (1989) and Bicking (1987) were com-ethyl acetate. Good recovery (97-99%)was reported parable and ranged from about 0.8 pg/L for 2,4-for XAD-4 (60-80 mesh) for water samples spiked DNTto about 7.5 gg/L for RDX. Higher CRLs werewith several nitroaromatics and RDX. Recovery of reported for tetryl, presumably because of the useRDX from groundwater samples was shown to be of acetone for analyte elution from the resin.comparable to LLE with methylene chloride, al- Recently Winslow et al. (1991) reported a solid-though as previously discussed, this solvent is not phase extraction RP-HPLC-UV (reversed phasean efficient extractant for HMX and RDX. high performance liquid chromatography-ultra-
Maskarinec et al. (1986) reported additional re- violet detection) procedure for 15 nitroaromaticsuits comparing XAD-4, Porapak R and Porapak S. and nitramine analytes. Their procedure usedWater samples (500 mL) were pumped through the Porapak R and they obtained CRLs ranging fromvarious resin tubes at 10-15 mL/min and the re- 0.064 Vg/L for 2,4-DNT to 2.49 lgg/L for tetryltained analyteseluted with 10 mL of acetone. Tetryl (Table 5). The method specifies passing a 500-mLwas found to be unstable in the acetone extract. water sample through a SPE cartridge containingThis technique was used successfully at a number 0.5 g of Porapak R at a flow rate of 10 mL/min.of Army installations. Detection limits were esti- Recovery of the sorbed analytes used 3 mL ofmated at about 1 mg/L using RP-HPLC-electro- acetonitrile, which was a departure from previouschemical detection. The selectivity of the electro- work where a 10-mL volume of acetone was gener-chemical detector for these analytes reduced the ally used. Recovery of the 15 analytes ranged fromproblem associated with coeluting interferences. 84.1% for 4-nitrotoluene to 123% for 4-amino-2,6-
Bicking (1987) tested the method of Maskarinec dinitrotoluene with an overall mean recovery ofet al. (1986) and made several modifications. Over- 94.3%.all he found performance of the method was lim- Winslow et al. (1991) packed their own SPEited not by the SPE but by the method of determi- cartridges and reported that the packed cartridgesnation (HPLC high performance liquid chroma- were conditioned with 15 mL of acetonitrile and 30tography]-electrochemical detection). mL of ASTM type II water. The Porapak R was
Valis et al. (1989) also evaluated the resin SPE extensively solvent cleaned prior to packing (1200method developed by Maskarinec and confirmed mL of acetone + 1200 mL of acetonitrile + 1200 mL
3

Table 5. Comparison of certified reporting limits for the solid-phase extraction procedure(Winslow et al. 1991) and salting-out solvent extraction procedures (Miyares and Jenkins 1990,1991).
CRL (pg/L)Solid-phase Salting-out extraction
Compound extraction Miyares and Miyares andWinslow (1991) Jenkins (1990) Winslow (1991) Jenkins (1991)
HMX 0.30 - 0.45 0.27RDX 0.29 0.84 0.64 0.261,3,5-TNB 0.45 0.26 0.75 0.131,3-DNB 0.15 0.11 0.38 0.09Tetryl 2.49 - 4.07 -NB 0.65 - 4.4 -
2,4,6-TNT 0.64 0.11 0.57 0.0114-Am-DNT 1.57 0.060 3.98 0.0542-Am-DNT 0.16 0.035 0.86 0.0562,6-DNT 0.074 0.31 0.123 0.0062,4-DNT 0.064 0.021 0.088 0.0072-NT 0.41 - 2.11 -
4-NT 0.62 2.073-NT 1.4 2.03
of methanol for each 75-cm 3 batch of Porapak R)*. cas. Initial tests using membranes containing C18If this cleaning procedure is used and a 75-cm 3 indicated poor recoveries (i.e., poor extraction effi-batch of Porapak R can fill about 40 tubes, the total ciencies) for HMX and RDX. 3M Corporation re-solvent usage for cleaningand conditioningis more cently developed Empore disks containing sty-than 100 mL of solvent per cartridge (or per water rene-divinylbenzene particles. Markell& tested thesesample). disks for extraction efficiency of nitroaromatics
Winslow et al. (1991) and Valis et al. (1989) both and nitramines from ground and surface watersused cross-linked divinyl benzene-polyvinyl- and found recoveries ranging from 49-122%.pyrolidone resins for preconcentration of explo-sives but gave no explanation of the high efficien- Salting-out solvent extraction (SOE)cies reported (Table 5). The high recoveries for SOE for polar organic analytes was first re-HMX and RDX are surprising and cannot be ex- ported by Leggett et al. (1990) and Miyares andplained by hydrophobic effects since their octanol/ Jenkins (1990). For SOE (version 1) a 130-g portionwater partition coefficients are 1.15 and 7.31, re- of NaCl is added to a 400-mL water sample in a 500-spectively. This efficiency is probably due to for- mL separatory funnel and shaken until the NaClmation of strong donor-acceptor complexes be- has completely dissolved. Once dissolved, a 100-tween HMX and RDX and the functionality of the mL volume of acetonitrile (ACN) is added and thepolymer as described by Freeman et al. (1976). sample is shaken for 5 minutes. The sample is
allowed to stand for 30 minutes to permit phaseSPE using Empore extraction disks separation and the upper ACN layer is retained.
A new type of SPE extraction was introduced by After Kuderna-Danish concentration and dilutionHagen et al. (1990), the Empore extraction disk. with water, the preconcentrated extract is analyzedThese disks are formed from a porous membrane of by RP-HPLC-UV. Miyares and Jenkins (1990) re-PTFE fibrils embedded with chromatographic par- ported recoveries ranging from 89% to 137% forticles. They are designed to be used with a vacuum eight nitroaromatic and nitramine analytes, withfilter flask and are claimed to maintain acceptable CRLs ranging from 0.021 for 2,4-DNT, to 0.84 gg/extraction efficiencies at maximum flow rates an L for RDX (Table 5).order of magnitude greater than is acceptable for More recently, Miyares and Jenkins (1991) re-most SPE cartridges. The first membranes avail- ported an improved salting-out extraction proce-able contained particles of the reversed phase sili- dure (SOE version 2) where 248 g of NaC1 is dis-
* M.G. Winslow, ESE, Gainsville, Florida, personal com- t C.G. Markell, 3M Corporation, St. Paul, Minnesota,munication, 1992. personal communication, 1992.
4

solved in a 760-mL water sample in a 1-L volumet- Table 6. Percent recoveries for nitroaromatics andric flask and 170-mL of ACN added. The solution is nitramines obtained by Winslow et al. (1991) usingstirred for 30 minutes. The ACN phase (about 23 SPE and SOE.mL) is removed with a Pasteur pipet and the re- % Recovery (mean jgddevmaining solution is extracted with an additional 10 1
mL of ACN. The two ACN extracts are combined Compound SPE SOE
and evaporated to about 0.5 mL using a Kudema- HMX 97.8 ± 4.1 91.8 ± 5.5Danish evaporator. The sample is diluted with RDX 95.5 ± 6.6 86.7 ± 6.2water up to about 2.0 mL, allowed to reflux briefly 1,3,5-TNB 84.7 ± 16.0 70.8 ± 18.6to allow further reduction of the ACN and then 1,3-DNB 971 ± 6.5 83.9 ± 8.6combined with 3.00 mL of water. The resulting Tetryl 91.1 ± 11.6 80.1 ± 14.5
NB 92.7 ± 7.0 81.5 ± 9.1extract is analyzed by RP-HPLC-UV. Certified Re- 24,-N968±1.8.4±412,4,6-TNT 96.8 ± 12.6 89.4 ± 14.1
porting Limits for this method (Table 5) ranged 4-Am-DNT 123 ± 18.3 126 ± 19.1from 0.006 mg/L for 2,6-DNT to 0.271 pg/L for 2-Am-DNT 92.2 ± 12.4 78.4 ± 11.2HMX. Recoveries ranged from 63.0% for 1,3,5- 2,6-DNT 90.3 ± 11.0 83.6 ± 12.8trinitrobenzene to 118% for HMX. 2,4-DNT 85.2 ± 9.1 76.7 ± 9.9
One drawback to this procedure is the need to 2-NT 91.9 ± 8.0 76.6 ± 7.34-NT 84.1 ± 10.0 75.1 ± 7.1
preconcentrate the 33-mL ACN extract. Kuderna- 3-NT 90.8 ± 12.6 77.3 ± 11.1Danish evaporation of ACN is slow, requiring thatthe extract be heated for an extended period. Sincemany explosive analytes are thermally unstable,this procedure is less than ideal. In addition, evapo- interferences from compounds leached from therative preconcentration is felt by many, including resin were observed at the absorbances needed tothe authors, to be a major source of quantitative detect these lower concentrations. The HayeSep Runcertainty in trace organic analysis. cartridges were precleaned by passing 50 mL of
Recently a new procedure was published for acetonitrile through the resin cartridges at 10 mL/preconcentrating ACN extracts without using min followed by 100 mL of reagent grade water atevaporation (Jenkins and Miyares 1991). This pro- lOmL/min.Thistreatmentappears tobeinadequatecedure is based on favorable partitioning of or- if very low concentrations (< I gg/L) are to beganic solutes between salted-out ACN and salt determined.water. To use this procedure, the appropriate vol-ume of ACN (a small excess above the solubility) is Objectiveadded to a known volume of salt water in a volu- The objective of the work described here was tometric flask and the solution stirred vigorously, obtain a direct comparison of the cartridge SPEAfter equilibration, the phases are allowed to sepa- method of Winslow et al. (1991) and the membranerate and the small-volume ACN phase residing in SPE method of Markell* with the improved SOEthe narrow neck of the volumetric flask is removed method of Miyares and Jenkins (1991) utilizing theusing a Pasteur pipet. Use of this procedure to nonevaporative preconcentration procedure ofpreconcezitrate the ACN extract from the salting- Jenkins and Miyares (1991). Aqueous test solutionsout extraction is an attractive option. of nitroaromatics and nitramines prepared in
groundwater without the use of organic solventsComparisons of SPE and SOE allowed a realistic comparison at concentrations of
Winslow et al. (1991) compared their SPE method analytes below the proposed drinking water crite-with the SOE method (version 1) of Miyares and ria(Table 1). Methods were also compared in termsJenkins (1990). Winslow obtained slightly better of solvent requirements, waste production andCRLs (Table 5) and better recoveries (Table 6) using processing time. In addition all three proceduresSPE. Winslow also concluded that the SPE proce- were tested with a set of groundwater samplesdure was less time consuming than the SOE. from a military toxic waste site known to be con-
Miyares and Jenkins (1991) attempted a direct taminatedwithnitroaromaticand nitramineexplo-comparison between their improved SOE method sives.(version 2) and the SPE method of Valis et al. (1989).The concentrations of the nitroaromatics andnitramines were an order of magnitude lower than * C.G. Markell, 3M Corporation, St. Paul, Minnesota,tested by Winslow et al. (1991) or Valis (1989), and personal communication, 1992.
5

EXPERIMENTAL minutes. Again the phases were allowed to sepa-rate for 10 minutes and the resulting ACN phase
Conduct of study was added to the 10-mL graduated cylinder. TheThis study was conducted jointly by the U.S. resulting extract, about 5-6 mL, was than diluted
Army Cold Regions Research and Engineering 1:1 with reagent grade water prior to analysis.Laboratory (CRREL), Hanover, New Hampshire,and the U.S. Army Engineer Waterways Experi- Cartridge solid-phase extractionment Station (WES), Vicksburg, Mississippi. Pre- This procedure was taken from Winslow et al.liminaryexperimentsandCertifiedReportingLimit (1991). Porapak R (80/100 mesh) was obtained(CRL) tests were conducted at CRREL. Tests using from Supelco. In order to reduce solvent consump-groundwater samples from the Rockeye site at the tion, we precleaned this bulk material by SoxhletNaval Surface WarfareCenter, Crane, Indiana, were extraction using ACN. Two 300-mL portions ofconducted at WES. The RP-HPLC instrumentation ACN were each used for a period of I day per 75used at the two laboratories is specified below. cm 3 portion of polymer. After precleaning, the
material was air dried briefly and then oven driedSalting-out at 105'C for 2 hrs.solvent extraction/nonevaporative Empty 3-mL extraction cartridges were fittedpreconcentration procedure with 20-tm frits at the bottom and packed with 0.5
This method was based on the salting-out sol- g of the precleaned Porapak R. Another frit wasvent extraction procedure reported by Miyares and placed on top to retain the material and help mini-Jenkins (1991) (SOE version 2) in combination with mize channeling. The cartridges were placed on athe nonevaporative preconcentration technique Visiprep Solid-Phase Extraction Manifold (Supelco)reported by Jenkins and Miyares (1991). A 251.3-g and conditioned by eluting with 30 mL of ACN byportion of reagentgrade sodium chloridewas added gravity flow followed by 50 mL of reagent gradeto a 1-L volumetric flask. A 770-mL sample of water water at 10 mL/min. A 500-mL aliquot of eachwas measured with a 1-L graduated cylinder and water sample was measured with a 1-L graduatedadded to the flask. A stir bar was added and the cylinder and pulled through a cartridge at about 10contents stirred at maximum speed (rpm) until the mL/min.salt was completely dissolved. A 164-mL aliquot of The cartridges were eluted by passing a 5-mLACN (measured with a 250-mL graduated cylin- aliquot of ACN through the cartridge at about 2der) was added while the solution is being stirred mL/min and the eluate collected in a I0-mL gradu-and stirring was continued for 15 minutes. The ated cylinder. The resulting extract, about 5 mL,stirrer was turned off and the phases allowed to was diluted 1:1 with reagent grade water prior toseparate for 10 minutes. The ACN phase (about 8 analysis.mL) was removed and 10 mL of fresh ACN added.The flask was again stirred for 15 minutes, fol- Membrane solid-phase extractionlowed by 10 minutes for phase separation. The The 47-mm Empore styrene-divinyl benzeneACN was removed and combined with the initial disks were precleaned by soaking each disk in aextract. The inclusion of a few drops of salt water at 250-mL beaker containing a layer of glass beads (5this point is unimportant. The extract was placed in mm) and 50 mL of ACN. Each membrane wasa 100-mL volumetric flask and 84 mL of salt water soaked for 24 hours, then washed off with ACN(325 g NaC1 per 1000 mL of water) was added. A stir and transferred to a second beaker of ACN. Mem-bar was placed in the flask and the contents stirred branes were each subjected to four 24-hour periodsfor 15 minute- After allowing the phases to sepa- of soaking in fresh ACN. Each disk was rinsed withrate for 10 minutes, the ACN phase was carefully ACN, then centered on a 47-mm vacuum filterremoved using a Pasteur pipet and placed in a 10- apparatus. A 20-mL portion of ACN was addedmL graduated cylinder. (At this stage the amount and allowed to soak into the disk for 3 minutes. Theof water transferred with the ACN must be mini- vacuum was then turned on and most of (but notmized because *he water contains a high concentra- all) the solvent pulled through the disk. A 50-mLtion of NaCl that produces a large peak at the aliquot of reagent grade water was then added andbeginning of tne chromatogram where it could the vacuum was turned on, pulling the waterinterfere with HMvIX determination.) An additional through the membrane. Just before the last of this1.0-mL aliquot of ACN was then added to the water was pulled through the membrane, thevolumetric flask and the contents stirred for 15 vacuum was stopped and the reservoir filled with
6
sample. The vacuum was then turned on again and equipped with a Rheodyne Model 7010 A samplea 500-mL aliquot of a water sample was pulled loop injector, a Spectra Physics Spectra 100 variablethrough the membrane. This took from 5 to 7 min- wavelength detector set at 254 nm, a Hewlett-utes, with resulting flow rates ranging from 70 to Packard HP 3393A digital integrator and Linear100 mL/min. Once the water was exhausted, air strip chart recorder. Primary separations used a 25-was drawn through the membrane for one minute cmx 4.6-mm LC-18 (5-jim) column eluted with 1:1to remove excess water. The vacuum was then methanol/water at a flow rate of 1.5 mL/minturneu off and the vacuum flask removed. The (Jenkins et al., 1989). Samples were introducedwater was removed from the flask and a test tube through the autosampler by overfilling a 100-pLplaced in the flask such that it fit over the funnel exit loop. If primary analysis indicated that nitro-when the flask was reattached to the fritted base. aromatic or nitramine analytes could be present,The actual size of the test tube needed depends on second column confirmation was obtained on athe brand of vacuum flask used (25 x 200 mm or 25 combined LC-8/LC-CN column (Miyares andx 250 mm). A 5-mL aliquot of ACN was added to Jenkins 1991). Retention times for the variousthe reservoir, the ACN allowed to soak into the nitroaromatic and nitramine analytes using thesemembrane for 3 minutes and then the vacuum was two separations are shown in Table 7.applied to pull the ACN through the membraneinto the test tube. The resulting extract was then b. WES RP-HPLC analysisremoved with a Pasteur pipet and placed in a 10- Analyses of the groundwater samples from themL graduated cylinder. An appropriate portion of Naval Surface Warfare Center were conducted inreagent grade water (< 5.0 mL) was added to the two ways at WES. First the samples were analyzedtest tube. This water was used to dilute the ACN directly by dilution 1:1 with methanol, filtrationextract 1:1 prior to analysis. through a Millex SR disposable membrane filter
and determination of a 100-tL aliquot on a LC-18RP-HPLC analysis column (Supelco 25 cm x 4.6 mm, 5 jgm) eluted with
1:1 methanol/water at a flow rate of 1.2 mL/min.CRREL RP-HPLC analysis This analysis was conducted on a Waters HPLC
All analyses were conducted using reversed- consisting of a 600 MS System Controller, a 700phase HPLC. Samples were analyzed on a modular Satellite WISP injector, and a 991 MS Photodiodesystem composed of a Spectra Physics 8800 pump, Array Detector set to monitor in the range 220-260a Dynatech Precision Sampling LC-241 autosampler nm (calibration at 254 nm). If analytes appeared to
be present, second column confirmation was ob-tained on an LC-CN column (Jenkins et al., 1989).
Table 7. Retention times for various analytes us- Retention times obtained for the two columns areing two RP-HPLC separations. given in Table 8.
Retention time (min)Analyte LC-18* LC-8/LC-CN- Table 8. Retention times for direct water analy-
HMX 2.5 3.8 sis conducted at WES.RDX 3.8 3.4TNB 5.1 2.3 Retention time (min)DNB 6.1 3.1 Analyte LC-18" LC-CN**Tetryl 6.9 7.2TNT 8.2 4.5 HMX 3.8 16.02,6-DNT 9.6 6.3 RDX 5.4 10.22,4-DNT 9.8 5.7 TNB 7.1 6.44-Am-DNT 8.9 8.4 DNB 8.4 6.32-Am-DNT 9.1 8.0 Tetryl 9.6 12.92-NT 11.7 6.8 TNT 11.3 7.94-NT 12.6 6.9 4-Am-DNT 12.4 8.63-NT 13.5 7.5 2-Am-DNT 12.7 9.2
2,6-DNT 13.2 7.2* LC-18 (25-cm x 4.6-mm, 5-1im) column eluted with 1.5 2,4-DNT 13.4 7.5
mL/min of 1:1 (v/v) methanol/water.* LC-8 (3.3cm x4.6 mm, 3 jim) ,olumn connected in series * LC-18 column (25 cm x 4.6 mm, 5 ptm) eluted with 1:1
with a LC-CN (3.3-cm x 4.6-mm, 3-jim) column eluted (v/v) methanol/water at 1.2 mL/min.with 70.7:27.8:1.5 (v/v/v) water/methanol/tetrahy- ** LC-CN column (25 cm x 4.6 mm, 5 mim) eluted withdrofuran at 1.5 mL/min. 1:1 (v/v) methanol/water at 1.0 mL/min.
7

(CD CD - - - -.0
0
q0
o
N D rC
d-.. 00 o . . . 00. . . .
U)
tq
"00. Wo• t,1
GE 0
-2e
'i 0ýt
0.4C'QEILA G

Samples were also preconcentrated by each of various volumes of the individual stock solutionsthe three procedures described above (SOE, mem- in a 500-mL volumetric flask and diluting to vol-brane SPE and cartridge SPE). A 100-mL volume of ume with reagent grade water (Table 9). An aliquoteach preconcentrated extract diluted 1/1 with wa- of this solution was diluted using reagent gradeter was analyzed at WES on an LC-18 (Supelco 25 water to prepare the combined spike solution withcmx 4.6 mm, 5 pm) column eluted with 1:1 metha- analyte concentrations of approximately 40 pg/Lnol/water at 1.5 mL/min. These analyses were (Table 9).conducted on a Waters HPLC consisting of a 600 E Test samples (0.5 to 1OX) were prepared fromSystem Controller/Multi Solvent Delivery System, this combined solution by diluting various vol-a 712 WISP sample injector, and a 486 Tunable umes of the combined standard to 4.0 L usingAbsorbance Detector set at 254 nm. Retention times reagent grade water (Table 9).for the analytes of interest werC similar to thosepresented in Table 7. Confirmations of analyteidentities were conducted at CRREL as described RESULTS AND DISCUSSIONabove.
Preliminary experiments--SOEPreparation of One parameter in both the salting-out extractionstandards and samples (SOE) procedure (Miyares and Jenkins, 1991) (SOE
Since we felt it was important that test samples version 2) and the nonevaporative preconcentrationbe completely free of organic solvents, particularly technique that has not been systematically studiedthose to be preconcentrated using solid phase ex- is the stirring time required to reach equilibriumtraction, we prepared all test samples at CRREL in between the two phases. Times of 30 minutes anda totally aqueous matrix. This was done by prepar- 3 hours, respectively, were specified but no specificing individual aqueous analyte stock solutions by studies were conducted to optimize this param-placing a few hundred milligrams of Standard eter. To do so, we prepared an aqueous solution ofAnalytical Reference Material (SARM) of each spe- 10 of the analytes of interest (Table 10) and per-cific analyte in individual 4-L brown glass bottles, formed a salting-out solvent extraction (SOE ver-filling with reagent grade water, adding a stir bar sion 2) as specified in the Experimental section.and stirring for two days at room temperature. After 10,20 and 30 minutes, the stirrer was stopped,
Each solution was filtered through a 0.45-pmr the phases allowed to separate, and an aliquot ofnylon-66 membrane (Supelco) into a clean brown the ACN extract analyzed (Table 10). Results indi-glass bottle. Aliquots of each solution were then cate that transfer of the analytes to the ACN phaseanalyzed against standardspreparedinacetonitrile was complete within the initial 10-minute stirringto estimate the concentration of analyte in each period. Stirring in this experiment was conductedaqueous stock solution. at the maximum speed (rpm) of our magnetic stir-
A combined standard with analyte concentra- rer. This created a vortex throughout the flask andtions of about 200 lig/L was prepared by adding intimate contact between the phases. Because the
degree of phase contact could be somewhatdifferent from unit to unit, we recommend a
Table 10. Results of stirring time study for salting-out extrac- 15-minute stirring time at maximum speed.tion (version 2). A similar experiment was conducted to opti-
mize the stirring time for the reverse processInitial aqueous Concentration in ACN extract used in the nonevaporative preconcentrationconcentration (pg/L) of the ACN extract. In principle, the reverse
Analyte (gIL) 10 rain 20 min 30 rain process should attain equilibrium at the sameHMX 27.3 2520 2410 2530 rate as observed above. Nevertheless, we de-RDX 26.7 1840 1810 1860 cided to confirm this experimentally. To do so,TNB 24.6 2270 2200 2290 a 18-mL aliquot of an ACN standard contain-DNB 26.3 2120 2060 2140 ing analytes (Table 11) was added to a 100-mLTetryl 26.1 2940 2820 2990 vng a lts able 81 wa o a 10 -TNT 25.3 2710 2600 2760 volumetric flask containing 84 mL of salt wa-2-AmDNT 27.8 2480 2400 2510 ter (325 g NaC1 per 1000 mL of water) and the2,4-DNT 20.6 2000 1930 2030 contents stirred for 10, 20 and 30 min. Afterp-NT 32.7 3090 2950 3100 each time increment, a small aliquot of them-NT 30.3 2930 2790 2940 extract was removed and analyzed as usual
9

Table 11. Results of stirring time study for nonevaporative preconcen-tration step.
Initialconcentration Concentration in ACN phase after stirring
in ACN (pl/L)
Analyte (mg!L) 10 20 riin 30 "fin 90 raii
HMX 106 628 657 590 601RDX 102 673 776 569 564TNB 107 591 598 584 591DNB 100 534 543 532 535Tetryl 102 577 585 580 569TNT 107 614 623 605 5992-ADNT 108 598 609 601 6002,4-DNT 102 618 605 562 569o-NT 102 561 571 567 560p-NT 100 560 567 557 565m-NT 101 567 562 559 565
(Table 11). While these data are somewhat less tied, and it appears that the contaminants areprecise than normal due to the need to inject small slowly leached from the interior of the polymericvolumes into a large sample loop, the results indi- material by diffusion. Thus, cleaned material cancate that equilibrium is achieved within 10 minutes appear "clean" if examined immediately after sol-for all analytes. Again, we recommend a 15-minute vent cleaning, but upon standing, the contami-stirring time at maximum speed. nants reappear. We concluded that it was not the
amount of solvent used to clean the material thatPreliminary experiments- was limiting, but rather the amount of contact timecartridge SPE with periodic solvent replacement. Soxhlet extrac-
As discussed in the Introduction, both Porapak R tion for two days using ACN proved to be ade-and HayeSep R have been used with apparent quate. Since both materials could be cleaned ad-success for preconcentration of nitroaromatic and equately, the initial cleanliness advantage ofnitramine explosives using cartridge SPE. We ob- HayeSep R was not critical.tained both materials from Supelco. Some of the To examine the other criterion, sorption capac-characteristics of both materials are presented in ity, we measured polymer/water partition coeffi-Table 12. cients for various nitroaromatics and nitramines
We were uncertain as to which of these materi- on both HayeSep R and Porapak R. This was doneals would be the best choice for our application. by accurately weighing out 131 mg of the previ-Two criteria were important in this regard: sorp- ously cleaned and dried material of interest into ation capacity and material cleanliness. With respect clean 40-mL Teflon-capped glass vial and addingto the latter, ACN extracts of both materials were 20.00 mL of aqueous solution containing a series ofobtained and analyzed by both RP-HPLC and GC/ nitroaromatics and nitramines. The vials wereMS. The HayeSep R material was much cleaner shaken on a wrist action shaker for 72 hours. Con-than Porapak R, although both contained contami- centrations of the various sorbates in aqueous solu-nants that would interfere with RP-HPLC analysisfor nitroaromatic and nitramine explosives. A vari-ety of cleaning techniques and solvents were exam- Table 13. Polymer/water partition coefficients.
log K•,Table 12. Characteristics of Porapak R and HayeSep R
SPE polymers. Sorbate HayeSep R Porapak R
Parameter HayeSep R Porapak R HMX 2.15 2.40
RDX 3.10 3.10
Mesh size 80/100 80/100 TNB 4.65 4.29
Specific surface area (m2/g) 344* 450/600* DNB 4.74 4.482,6-DNT 5.55 5.38
* Information provided by Lydia Nolan, Supelco, Inc., 1992. 2-Am-DNT 4.99 4.86
10

tion (solutions prepared without use of organic Saling-out Blanksolvent) were measured before and after equili- S oBbration with each polymer and the concentration ofsorbates on the polymer obtained by difference.The partition coefficients (KP) in g/g were thencalculated (Table 13). HMX is the least well sorbedby these materials. Of the two polymers, HMX issorbed somewhat better by Porapak R but overallthere is very little difference. Tests with other ma-terials such as Porapak Q (styrene-divinylbenzene Membrane SPE Blank
polymer) and LC-18 (octadecyl bonded reversed (Empore SDVB)
phase silica) indicate that these materials havelower polymer/water partition coefficients and 0
thus are even poorer choices. Thus Porapak R was oselected for use in cartridge SPE because it did sorb <
HMX to a greater extent and allowed a directcomparison of the study conducted by Winslow etal. (1991).
Catrlidge SPE Blank
Certified reporting limit test (Porapak R)
conduct a 4-day Certified Reporting Limit Test asdescribed in USATHAMA (1990). This test pro-vides a means to compare the performance of thethree preconcentration methods with regard to lowconcentration detection capability, percent recov-ery, interferences and overall precision. 0 5 10 15 20
The test was conducted by preparing the test Retention Time (min)
solutions at various concentrations, designated Figure 2. LC-18 chromatograms for blank sample precon-blank, 0.5X, X, 2X, 5X and lox (Table 9), on each of centration by salting-out, cartridge-SPE and membrane-four days, where X represents a concentration near SPE methods at CRREL.the detection limit. An aliquot of each solution waspreconcentrated using the salting-out, cartridge-SPE and membrane-SPE procedures described in (Hubaux and Vos 1970). A graphical illustration of
the Experimental section. The extracts on a given this procedure is presented in Figure 4. CRLs for
day were randomized prior to analysis at CRREL each analyte using salting-out, cartridge-SPE and
using the RP-HPLC method described in the Ex- membrane-SPE are presented in Table 14.
perimental section.Examples of the chromatograms we obtained Table 14. Certified reporting limits for various pre-
for the blank and 2X samples for each of the three concentration techniques.preconcentration methods are shown in Figures 2and 3, respectively. The determined concentra- CRL (pg/L)
tions for each extract are presented in the Tables Analyte Salting-out Cartridge-SPE Membrane-SPEA1-A33. To obtain the CRL for each analyte using HMX 0.19 0.21 0.33each preconcentration technique, the found vs. RDX 0.13 0.27 0.12spiked concentrations over the four days are plot- TNB 0.052 0.042 0.051
ted and a linear least-squares regression model DNB 0.081 0.032 0.036
with intercept is fitted. Confidence intervals about Tetryl 0.20 0.24 0.83TNT 0.086 0.068 0.13
the regression lines are obtained at the 90% con- 2-Am-DNT 0.10 0.046 0.055fidence level (5% a risk, 5% b risk). A horizontal line 2,4-DNT 0.083 0.085 0.044is drawn from the intersection of the upper confi- o-NT 0.13 0.10 0.20
dence band and the y-axis until it intersects the p-NT 0.22 0.12 0.23*
lower confidence band. A vertical line is dropped r-NT 0.21 0.13
to the x-axis and the intersection defined as the CRL * One outlier removed for this analyte/method combination.
11

Sating-out Overall the CRLs for a given analyte are quitem 2X Sample similar for all three preconcentration techniques.
None of the procedures are consistently superior0 ,, to the others in low concentration detection ca-
a pability. CRL values range from a low of 0.032ti 'i g. •. •.g/L for DNB using cartridge SPE, to a high of
O Q E 0.83 gg/L for tetryl using membrane-SPE. All
values for HMX, RDX, TNT, 2,4-DNT and 1,3-DNB are below the proposed drinking water
i I limit for these compounds. While 2,6-DNT wasnot tested, it is very unlikely that a CRL as low as
2X Sample the proposed value of 0.007 pg/L would be
obtained. The only CRL value that appears to bez out of line is the 0.83 gg/L value of tetryl using
X |membrane-SPE. Inspection of the data indicatesS -this high CRL is due to low recovery on one of the
Z / " four days (TableA27).'L E The regression line obtained from the plot of
found vs. spiked concentrations was also exam-_j ined for curvature using lack-of-fit testing. A
linear relationship adequately described the dataC SPE (Porapak R) at the 95% confidence level for all the analytes-2X Sample using all three procedures with the exception ofz p-NT by the cartridge SPE method. The slopes of
these linear regression lines are measures of theti . overall percent recoveries of these analytes using
each preconcentration method. Recoveries (TableN .15), in general, are quite good (near a theoretical
value of 100%). Measured recoveries for the salt-ing-out procedure range from 93-119%. Like-wise recoveries for cartridge-SPE and membrane-
0 5 10 15 SPE range from 83--133% and 81-116%, respec-Retention Time (min) tively.
The y-intercept values from the regressionFigure 3. LC-18 chromatograms for 2X sample precon- equations were tested to determine if they werecentrated by salting-out, cartridge-SPE and membrane- significantly different from 0 at the 95% confi-SPE methods at CRREL. dence level. Statistically significant intercept val-
JFc
COD - Proposed Criterion of DetectionCRL = Certified Reporting ULmit
S COD I ICRL
0 Figure 4. Graphical illustration of CRLTaken Concentration MT) procedure.
12
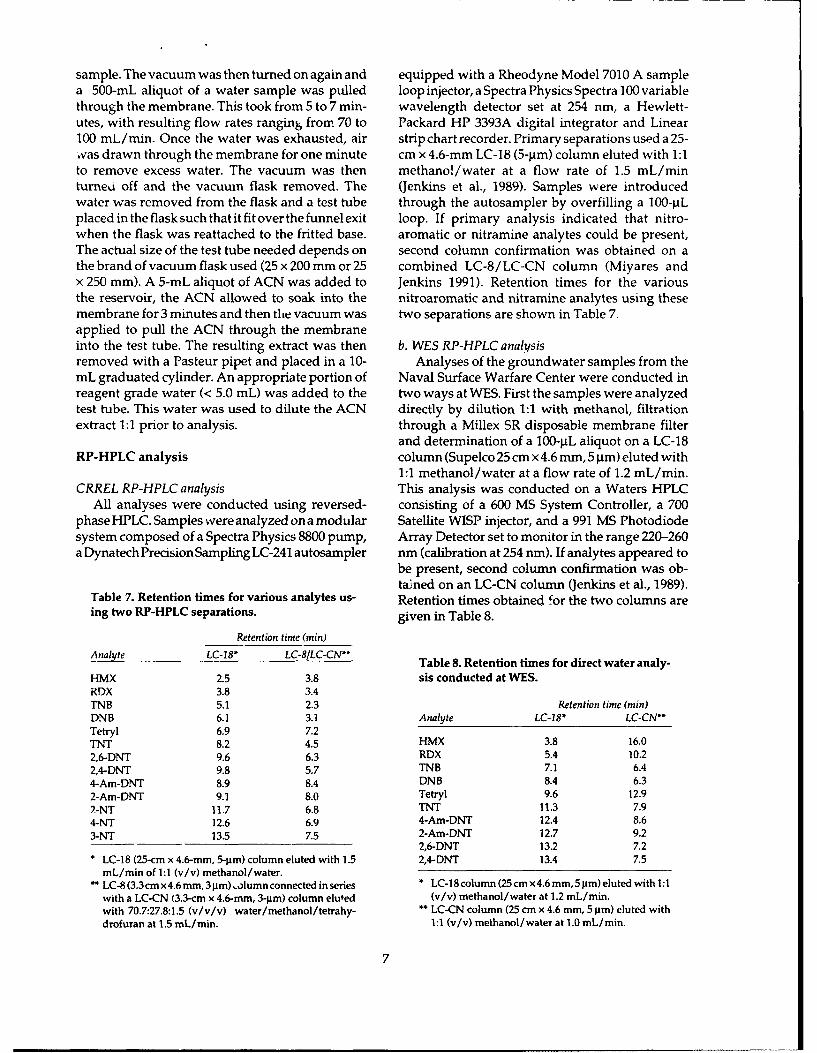
ues are presented in Table 16. These values are centrated using the three procedures (SOE, car-quite low for all three procedures. Except for RDX tridge-SPE and membrane-SPE) and analyzed atby the cartridge SPE procedure, these values are WES as described above. Table 17 summarizes thelower than the CRLs for that specific compound. results for samples where the concentrations of atThus positive interferences are not generally of least one nitroaromatic or nitramine analyte waspractical importance for any of these preconcentra- high enough to be obtained using the direct method.tion techniques. The intercept for RDX using car- Since the concentrations obtained by the directtridge SPE was 0.35 and the CRL was 0.27 gg/L. In analysis are subject to fewer sources of error thanthis case, a positive interference was found and was those obtained using preconcentration, we are treat-consistently noted in the chromatograms of the ing these values as "true" values for purposes ofblank sample (Table A2). This interference was also comparison. We can then compare the results fromobserved for the membrane-SPE for RDX. These the various preconcentration techniques relative towere the only analyte/method combinations where these "true" values.found values were consistently observed for the Examination of Table 17 indicates that all threeblank sample. For the membrane, the blank values preconcentration procedures did a fairly good jobobtained for RDX were slightly below the CRL of obtaining results similar to those from the directobtained for RDX. analysis. Regression analysis was conducted on the
results obtained for HMX, RDX and TNT by theComparison using direct method vs. the three preconcentration tech-groundwater samples niques. The theoretical relationship expected is y =
Since all three preconcentration techniques per- 1.OX, if there is no bias. The slope (i), y-intercept (b)formed adequately using spiked reagent water and square of the correlation coefficient (r2 ) forsamples, a further test was conducted using ground each analysis are presented in Table 18. Clearly thewater samples from the Rockeye site at the Naval slopes obtained for the membrane-SPE methodSurface Warfare Center. Samples were collected indicate this method recovered less of HMX andusing a Grundo Rediflo 2 stainless steel submers- RDX than the other two procedures. A lower recov-ible pump at about 100 mL/min after the well was ery for HMX is consistent with the results obtaineddeveloped and allowed to recharge. Four liters of on the spiked reagent water samples at CRREL.groundwater from each well was shipped to WES However, a slope of 0.491 (49.1% recovery) is muchin glass ICHEM bottles. All of the groundwater poorer than the 81% recovery obtained on thesamples collected were analyzed by the direct spiked water samples at CRREL. There are severalmethod at WES (Jenkins et al. 1988). A subset of 58 possible explanations for this lower recovery. Theof these groundwater samples were also precon- concentration of HMX in the groundwater samples
Table 15. Overall percent recovery and relative stan- Table 16. Y intercepts for regression lines for spiked vs.dard deviation (RSD) from Certified Reporting Limit found concentrations in 4-Day CRL test.Test.
% Recovery* (% RSD) Y Intercept (pugIL)
Analyte Salting-out Cartridge-SPE Membrane-SPE Analyte Salting-out Cartridge-SPE Membrane-SPE
HMX 106 (10.5) 107(9.6) 81(14.0) HMX 0.123 0.148 0.149RDX 106(8.7) 116(22.0) 116(11.1) RDX 0.052 0.350 0.053TNB 119(7.6) 133(8.7) 116(10.3) TNB 0.029 NS* 0.022DNB 102(6.6) 115(2.6) 103(6.5) DNB NS 0.009 NSTetryl 93(16.4) 83(32.8) 83(46.4) Tetryl 0.045 NS NSTNT 105(7.6) 111 (7.5) 97(10.5) TNT 0.032 0.053 0.0492-Am-DNT 102(9.1) 113(4.1) 103(8.9) 2-Am-DNT 0.040 0.015 NS2,4-DNT 101 (5.8) 109(6.8) 94 (6.6) 2,4-DNT 0.024 0.032 NSo-NT 102(9.1) 107(8.1) 92(15.6) o-NT 0.046 NS 0.055p-NT % (18.1) 104"* (6.6) 89 (18.0) p-NT 0.080 ** NStm-NT 97(12.4) 100(7.3) 86(17.2) m-NT 0.054 NS 0.100
* Slope of regression line of spiked concentration vs. found * NS-Intercept not significantly different from 0 at the 95%
concentration x 100. confidence level.** Lack-of-fit test indicates data not adequately described by ** Linear model was not adequate to describe spiked vs. found
linear relationship at the 95% confidence level, relationship at the 95% confidence level.t One outlier removed for this analyte/method combination. t One outlier removed for this analyte/method combination.
13

Table 17. Comparison of results for direct analysis of groundwater samples fromthe Rockeye site at the Naval Surface Warfare Center, Crane, Indiana, with thethree preconcentration methods.
Concentration (pjg/L)Sample Method* HMX RDX TNB TNT 4A
20649 Direct 151 135 33 9.6SPE-M 98 121 32 11.2SPE-C 156 147 34 12.2SOE 161 138 38 13.7
20650 Direct 119 82 9.0SPE-M 60 64 7.6SPE-C 107 85 9.2SOE 98 66 10.3
20660 Direct 26SPE-M 23SPE-C 24SOE 21
20661 Direct 70 37SPE-M 74 55SPE-C 98 58SOE 93 56
20662 Direct 26 160 42SPE-M 19 176 51SPE-C 17 138 34SOE 22 154 46
20663 Direct 281 94 21 65SPE-M 153 89 22 75SPE-C 214 109 26 78SOE 232 90 26 78
20667 Direct 318 618 19.2 284 166SPE-M 199 488 19.5 317 216SPE-C 356 666 19.6 328 239SOE 319 558 18.6 320 217
Membrane-SPE (SPE-M), Cartridge-SPE (SPE-C) and Salting-out (SOE).
Table 18. Results of regression analysis of the straight analysis versus the three preconcentration methodsfor groundwater samples from Rockeye site, Naval Surface Warfare Center.
Analyte
HMX RDX TNTMethod m* b* r2 " m b r 2 m b r2
Membrane-SPE 0.491 17.5 0.947 0.769 18.6 0.988 1.12 -1.4 0.999Cartridge-SPE 0.873 10.4 0.935 1.07 -0.8 0.994 1.17 -4.6 0.997SOE 0.812 16.9 0.967 0.892 7.9 0.996 1.12 0.6 1.000Membrane-SPE 0.491 17.5 0.947 0.769 18.6 0.988 1.12 -1.4 0.999Cartridge-SPE 0.873 10.4 0.935 1.07 -0.8 0.994 1.17 -4.6 0.997SOE 0.812 16.9 0.967 0.892 7.9 0.996 1.12 0.6 1.000
* m---sopeb--Y intercept
14
Salting-out
Satung-out
xP
-Z9
_- Cartridge-SPE
CartndWoSPE
Membrane-SPE
X
ýý I I I -L L - I I ILI0 4 8 12 16 20 0 4 8 12 16 20
Fetention Time (min) Retention Time (min)
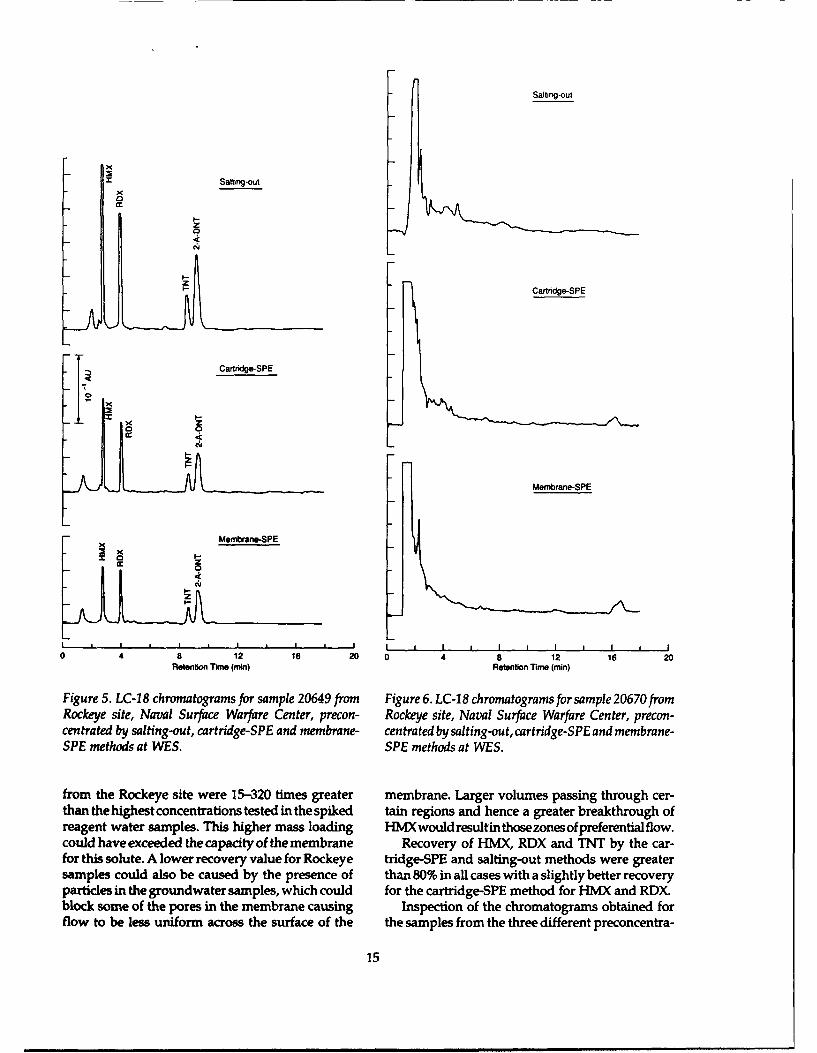
Figure 5. LC-18 chromatograms for sample 20649 from Figure 6. LC-18 chromatograms for sample 20670fromRockeye site, Naval Surface Warfare Center, precon- Rockeye site, Naval Surface Warfare Center, precon-centrated by salting-out, cartridge-SPE and membrane- centrated by salting-out, cartridge-SPE and membrane-SPE methods at WES. SPE methods at WES.
from the Rockeye site were 15-320 times greater membrane. Larger volumes passing through cer-than the highest concentrations tested in the spiked tain regions and hence a greater breakthrough ofreagent water samples. This higher mass loading HMX would resultin those zones of preferentialflow.could have exceeded the capacity of the membrane Recovery of HMX, RDX and TNT by the car-for this solute. A lower recovery value for Rockeye tridge-SPE and salting-out methods were greatersamples could also be caused by the presence of than 80% in all cases with a slightly better recoveryparticles in the groundwater samples, which could for the cartridge-SPE method for HMX and RDX.block some of the pores in the membrane causing Inspection of the chromatograms obtained forflow to be less uniform across the surface of the the samples from the three different preconcentra-
15
Salting-out
Salting-out
-- Cartridgle-SPE
CartkipSPECanride - SPE
Membrane-SPE
Membrane - SPE
Ij I i I I * I I "0 4 8 12 16 20 0 4 8 12 16 20
Retention Time (min) Retention Time (min)
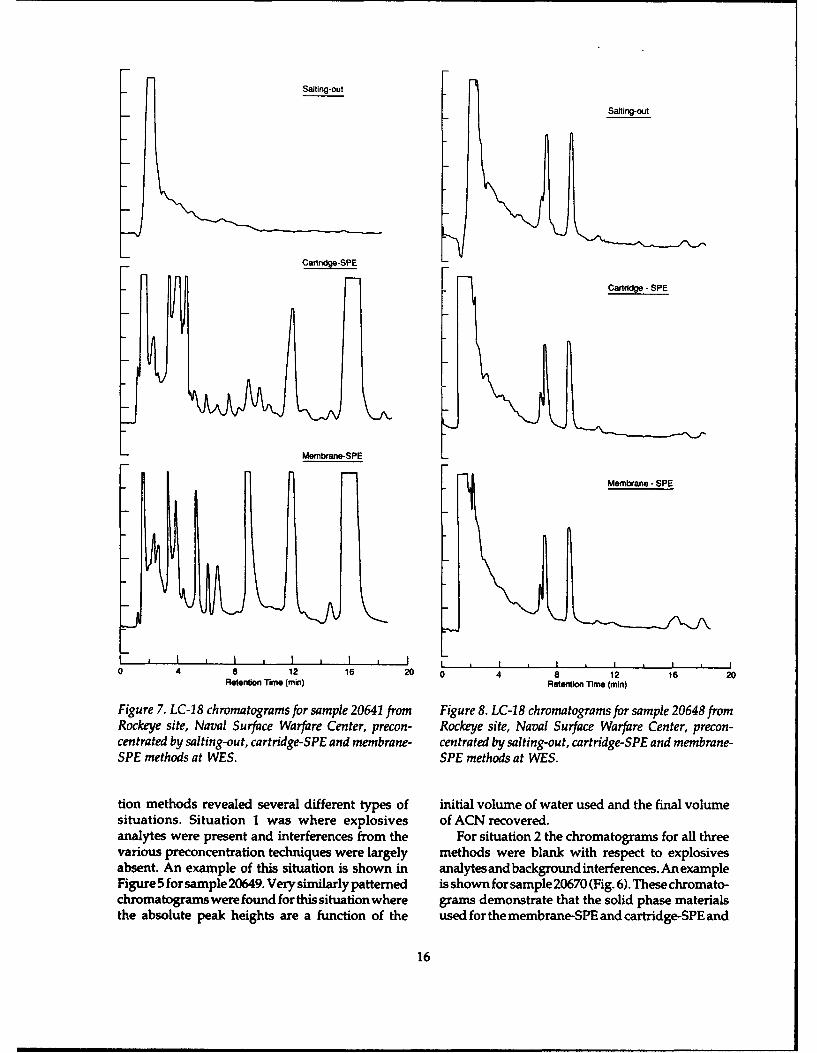
Figure 7. LC-18 chromatograms for sample 20641 from Figure 8. LC-18 chromatograms for sample 20648 fromRockeye site, Naval Surface Warfare Center, precon- Rockeye site, Naval Surface Warfare Center, precon-centrated by salting-out, cartridge-SPE and membrane- centrated by salting-out, cartridge-SPE and membrane-SPE methods at WES. SPE methods at WES.
tion methods revealed several different types of initial volume of water used and the final volumesituations. Situation 1 was where explosives of ACN recovered.analytes were present and interferences from the For situation 2 the chromatograms for all threevarious preconcentration techniques were largely methods were blank with respect to explosivesabsent. An example of this situation is shown in analytes and background interferences. An exampleFigure 5 for sample 20649. Very similarly patterned is shown for sample 20670 (Fig. 6). These chromato-chromatograms were found for this situation where grams demonstrate that the solid phase materialsthe absolute peak heights are a function of the used for the membrane-SPE and cartridge-SPE and
16

the salt and glassware used for the SOE methodwere clean with respect to UV absorbing interfer- Extract ofUncleaned Membraneences.
Situation 3 is demonstrated for sample 20641(Fig. 7). The chromatogram for the salting-outmethod is blank with respect to target analytes andinterferences, but the chromatograms for both thetwo solid phase methods, at the same attenuation,show large peaks at a number of retention timesacross the entire chromatogram. Second columnconfirmation using a combined LC-8/LC-CN col-umn (Miyares and Jenkins 1991) indicates thatnone of these peaks result from the presence ofnitroaromatic or nitramine explosives. The pres-ence of these peaks, however, would interfere withthe ability to detect nitroaromatic and nitramineanalytes at concentrations well above the CRLs. MebmneSPEThese peaks were present for 29 of the 58 ground- (sampl 2065)water samples from the Rockeye site. In each case,both the cartridge and membrane-SPE samplesshowed the same patterns of peaks while the salt-ing-out sample was blank. Since the Porapak R andthe membranes were cleaned separately and thePorapak R cartridges used for sample 20641 andsample 20670 were packed from material cleanedin the same batch, we do not believe these peakswere a result of poorly cleaned material. Either thesamples contained some nonexplosives analytes I I I I I I I- jthat were not preconcentrated by the salting-out 0 4 8 12 16 20method, or something present in these samples Retention Time (min)
interacted with the solid phases to either degrade Figure 9. Comparison of LC-18 chromatograms fromthe polymer or release contaminants from within Figure29.5Compan of Naval Woatoas fromthe olyer b swllig th poymermatix.sample 20645 from Crane-Rockeye Naval Weapons Cen-the polym er by sw elling the polym er m atrix.te rc n n ra dby m b a e-P a dth ex at
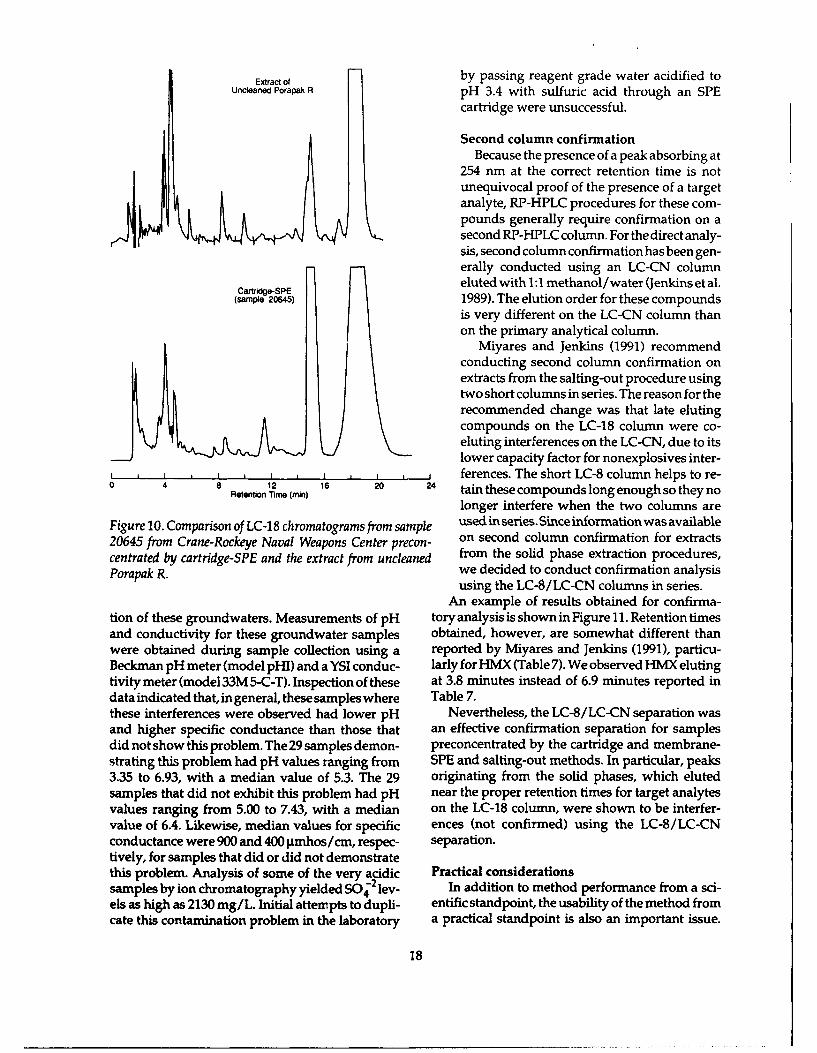
Previous experience indicates that salting-out ter preconcentrated by membrane-SPE and the extractextraction is very efficient at recoveringall types of froman uncleaned membrane-SPE unit.organic analytes (Jenkins and Miyares 1991). Fig-ure 8 shows chromatograms from the three meth-ods obtained on sample 20648 where equivalent To determine if these large peaks in the chro-preconcentration of nonexplosive compounds was matograms from both SPE methods were originat-found. For this reason, we do not believe that poor ing from the polymers, an uncleaned membranerecovery by the SOE procedure is responsible for used for SPE was leached with acetonitrile andthe lack of these interferences in the SOE extracts. analyzed by RP-HPLC. This chromatogram andWe did note, however, that the volume of the chromatogram for the membrane-SPE pre-acetonitrile recovered in the SOE method, from concentrate from sample 20645 are shown in Figurethose samples where this phenomenon was ob- 9. The similar chromatographic patterns suggestserved, was an average of 1.2 mL greater (5.3 mL vs. that these peaks are coming from the membranes4.1 mL) than for those samples where this phenom- themselves. A similar experiment using uncleanedenon was not observed. Thus either these samples Porapak R gave identical results (Fig. 10). Thus wecontained some component that, after salt was conclude that these large peaks are eluting from theadded, further reduced the solubility of acetonitrile solid phases as a result of some component presentwhen compared to other samples, or the samples in a number of these groundwater samples.contained acetonitrile or some other similar sol- To pursue this question, we gathered as muchvent. information as we could regarding the composi-
17
Extract of by passing reagent grade water acidified toUncdeaned Porapak R pH 3.4 with sulfuric acid through an SPE
cartridge were unsuccessful.
Second column confirmationBecause the presence of a peak absorbing at
254 nm at the correct retention time is notunequivocal proof of the presence of a targetanalyte, RP-HPLC procedures for these com-pounds generally require confirmation on asecond RP-HPLC column. For the direct analy-sis, second column confirmation has been gen-
erally conducted using an LC-CN columnCartrige-SPEeluted with 1: 1 methanol /water (Jenkins et al.
(sam~e 20Ws) 1989). The elution order for these compounds
is very different on the LC-CN column thanon the primary analytical column.S~Miyares and Jenkins (1991) recommend
conducting second column confirmation onextracts from the salting-out procedure usingtwo short columns in series. The reason for therecommended change was that late elutingcompounds on the LC-18 column were co-eluting interferences on the LC-CN, due to itslower capacity factor for nonexplosives inter-
, I , I I _ ferences. The short LC-8 column helps to re-0n4 8 12 1m 20 24 tain these compounds long enough so they no
Retention Time (mai)
longer interfere when the two columns are
Figure 10. Comparison of LC-18 chromatograms from sample used in series. Since informationwas available20645 from Crane-Rockeye Naval Weapons Center precon- on second column confirmation for extractscentrated by cartridge-SPE and the extract from uncleaned from the solid phase extraction procedures,Porapak R. we decided to conduct confirmation analysis
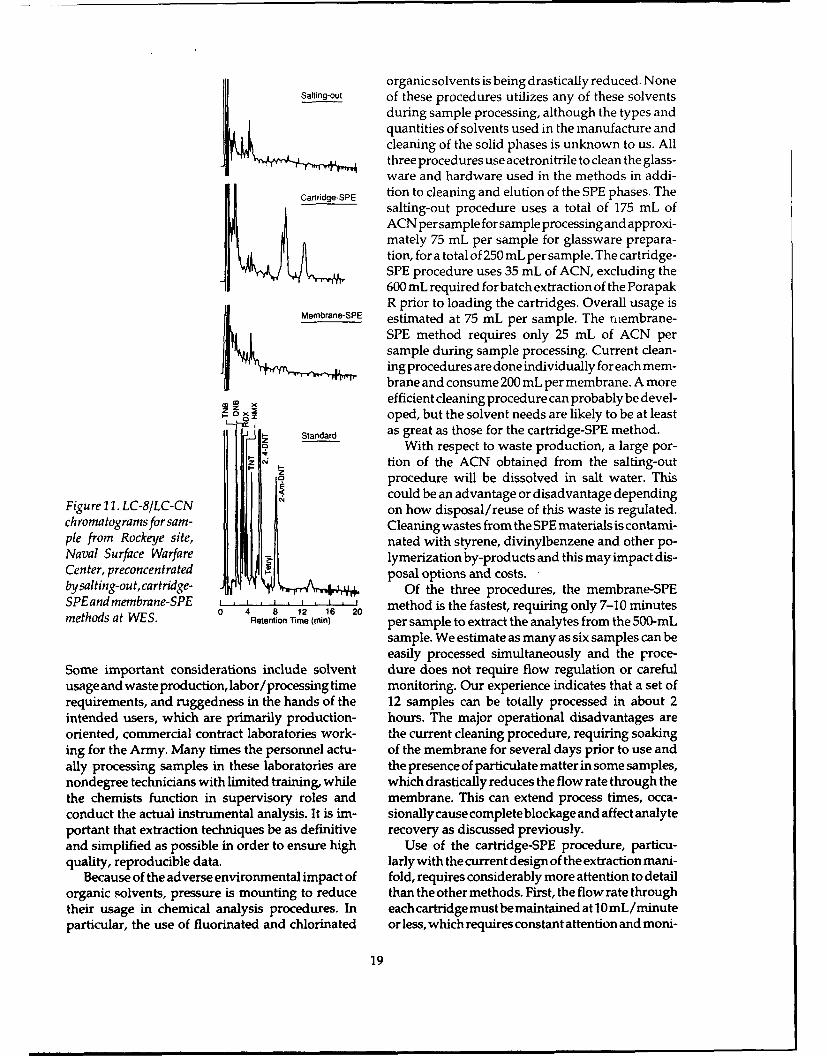
using the LC-8/LC-CN columns in series.An example of results obtained for confirma-
tion of these groundwaters. Measurements of pH tory analysis is shown in Figure 11. Retention timesand conductivity for these groundwater samples obtained, however, are somewhat different thanwere obtained during sample collection using a reported by Miyares and Jenkins (1991), particu-Beckman pH meter (model pHI) and a YSI conduc- larly for HMX (Table 7). We observed HMX elutingtivity meter (model 33M 5-C-T). Inspection of these at 3.8 minutes instead of 6.9 minutes reported indata indicated that, in general, these samples where Table 7.these interferences were observed had lower pH Nevertheless, the LC-8/LC-CN separation wasand higher specific conductance than those that an effective confirmation separation for samplesdid not show this problem. The 29 samples demon- preconcentrated by the cartridge and membrane-strating this problem had pH values ranging from SPE and salting-out methods. In particular, peaks3.35 to 6.93, with a median value of 5.3. The 29 originating from the solid phases, which elutedsamples that did not exhibit this problem had pH near the proper retention times for target analytesvalues ranging from 5.00 to 7.43, with a median on the LC-18 column, were shown to be interfer-value of 6.4. Likewise, median values for specific ences (not confirmed) using the LC-8/LC-CNconductance were 900 and 400 pmhos/cm, respec- separation.tively, for samples that did or did not demonstratethis problem. Analysis of some of the very acidic Practical considerationssamples by ion chromatography yielded SO42 lev- In addition to method performance from a sci-els as high as 2130 mg/L. Initial attempts to dupli- entific standpoint, the usability of the method fromcate this contamination problem in the laboratory a practical standpoint is also an important issue.
18
organic solvents is being drastically reduced. NoneSalting-out of these procedures utilizes any of these solvents
during sample processing, although the types andquantities of solvents used in the manufacture andcleaning of the solid phases is unknown to us. Allthree procedures use acetronitrile to clean the glass-ware and hardware used in the methods in addi-
Cartridge-SPE tion to cleaning and elution of the SPE phases. Thesalting-out procedure uses a total of 175 mL ofACN per sample for sample processing and approxi-mately 75 mL per sample for glassware prepara-tion, for a total of 250 mL per sample. The cartridge-SPE procedure uses 35 mL of ACN, excluding the600 mL required for batch extraction of the PorapakR prior to loading the cartridges. Overall usage is
Membrane-SPE estimated at 75 mL per sample. The niembrane-SPE method requires only 25 mL of ACN persample during sample processing. Current clean-ing procedures are done individually for each mem-brane and consume 200 mL per membrane. A more
efficient cleaning procedure can probably be devel-. .oped, but the solvent needs are likely to be at least
Standard as great as those for the cartridge-SPE method.a With respect to waste production, a large por-
4 t-ion of the ACN obtained from the salting-outprocedure will be dissolved in salt water. ThisI could be an advantage or disadvantage depending
Figure 11. LC-8/LC-CN on how disposal/reuse of this waste is regulated.chromatogramsforsam- Cleaning wastes from the SPE materials is contami-pie from Rockeye site, nated with styrene, divinylbenzene and other po-Naval Surface Warfare . lymerization by-products and this may impact dis-Center, preconcentrated posal options and costs.bysalting-out, cartridge- Of the three procedures, the membrane-SPESPEandmembrane-SPE 4 8 1 ' 2 0 method is the fastest, requiring only 7-10 minutesmtosaWE.0 4 8 12 16 20methods at WES. Retention Time (mnin) per sample to extract the analytes from the 500-mL
sample. We estimate as many as six samples can beeasily processed simultaneously and the proce-
Some important considerations include solvent dure does not require flow regulation or carefulusage and wasteproduction, labor/processingtime monitoring. Our experience indicates that a set ofrequirements, and ruggedness in the hands of the 12 samples can be totally processed in about 2intended users, which are primarily production- hours. The major operational disadvantages areoriented, commercial contract laboratories work- the current cleaning procedure, requiring soakinging for the Army. Many times the personnel actu- of the membrane for several days prior to use andally processing samples in these laboratories are the presence of particulate matter in some samples,nondegree technicians with limited training, while which drastically reduces the flow rate through thethe chemists function in supervisory roles and membrane. This can extend process times, occa-conduct the actual instrumental analysis. It is im- sionallycausecompleteblockageandaffect analyteportant that extraction techniques be as definitive recovery as discussed previously.and simplified as possible in order to ensure high Use of the cartridge-SPE procedure, particu-quality, reproducible data. larly with the current design of the extraction mani-
Because of the adverse environmental impact of fold, requires considerably more attention to detailorganic solvents, pressure is mounting to reduce than the other methods. First, the flow rate throughtheir usage in chemical analysis procedures. In eachcartridgemustbemaintainedatl0mL/minuteparticular, the use of fluorinated and chlorinated or less, which requires constant attention and moni-
19

toring. We found that processing of more than six Problems with interferences were encounteredcartridges at a time led to confusion and the possibil- using both the cartridge-SPE and membrane-SPEity of sample spillage or cross contamination. Tutal procedures for a number of actual ground waterprocessing time for 12 samples is estimated at 3.5 to samples. These interferences appeared to be iden-4 hours. Like the membrane, particulate matter in tical to the compounds released from the solidsamples reduced flow rates through the cartridge, phases during cleaning, but were apparently re-thereby extending sample processing time. Of the leased from the SPE phases due to a matrix interac-three procedures, we judge this method to be the tion with a number of ground water samples. Themost demanding with regard to attention to detail nature of this interaction is still unclear. Theseand thus the least rugged in day-to-day usage. compounds would interfere with determination of
Experience with the salting-out procedure indi- nitroaromatic and nitramine explosives even atcated that as many as 12 samples could be easily reasonably high concentrations.processed simultaneously. We estimate a batch of All three procedures were evaluated with re-12 samples could be processed in about 3.5 to 4 spect to usability under a production laboratoryhours. Once stirring of the samples is initi' ted, they scenario. The membrane-SPE procedure is the easi-can be left unattended for 15-minute increments. est and the fastest. The cartridge-SPE and SOELittle attention to detail is needed except during procedures appeared to be about equal in timeliquid transfer steps. The major disadvantages to requirement to process a batch of 12 samples, al-this procedure is the need to measure the volume of though with some equipment improvements theeach extract, which differs by a greater amount cartridge procedure could be made somewhat morethan do the volumes of extracts from the other two efficient. We are concerned, however, about themethods, and the need to avoid transferring drops potential for cross contamination that exists usingof NaCI saturated water during the final step. the cartridge procedure with the currently avail-
able manifold design.The elimination of the need to use evaporative
CONCLUSIONS AND preconcentration with the salting-out procedure isRECOMMENDATIONS a major improvement. We believe the new proce-
dure will be more precise and less subject to errorSOE and cartridge- and membrane-SPE were in routine use than the initial method which uti-
compared with respect to their ability to lized a Kudena-Danish evaporator.preconcentrate nitroaromatic and nitramine explo- Second column confirmation was used onsives from water prior to RP-HPLC analysis. Both sample extracts from groundwater samples for allfortified reagent grade water and contaminated three methods. Current confirmation separations,groundwater samples were used in this assess- however, appeared to be inadequate for somement. analytes in extracts preconcentrated by the various
Low detection capability and overall precision methods tested. We recommend additional devel-were comparable among the three procedures. opment of separation technology for confirmationRecoveries of HMX and RDX are better using car- of target analytes.tridge-SPE and SOE than membrane-SPE. The ac- The observation of interferences apparently re-tual percent recovery of these two analytes seem to leased from the SPE phases during sample extrac-be sample specific for the membrane procedure. tion of groundwater samples is an important find-Recovery of the nitroaromatics was acceptable for ing. In the past, interferences released from theseall three procedures. SPE polymers have been attributed to differences
At present the major problems associated with in the cleanliness of these materials from batch tothe use of the SPE procedures are the inadequacy of batch. Inconsistent cleaning does not appear to bethe current cleaning procedures. While use of the the cause of the interferences we observed here.Soxhlet procedure on a batch basis for the Porapak Rather the release of interferences is a result ofR material appears to be adequate, cleaning must matrix interactions.be accomplished just before use or the contamina- In summary, the SOE, cartridge-SPE and mem-tion reappears, apparently by diffusion from the brane-SPE preconcentration techniques are all ca-interior of the polymer. The cleaning procedure we pable of providing adequate analyte preconcen-used for the membranes (sequential soaking for tration of nitroaromatics and nitramines prior toeach membrane) is cumbersomeandsolventwaste- RP-HPLC determination. Of the three, the SOEfhl. method appears to be the least prone to interfer-
20

ences. The membrane-SPE method requires the nitramines in ground and drinking water by wide-least sample processing time, but its recovery of bore capillary gas chromatography. Journal of Chro-HMX is the poorest of the three methods. The matographic Science, 29: 131-135.cartridge-SPE method requires the least solvent Hagen, D.F.,C.G.MarkellandG.A.Schmitt(1990)per sample, but its routine use with the currently Membrane approach to solid-phase extraction.available processing manifold appears prone to Analytica Chimica Acta, 236: 157-164.problems with cross contamination. Hansch, C.S. and A. Leo (1979) Substituent Con-
stants for Correlation Analysis in Chemistry and Biol-ogy. New York: Wiley.
LITERATURE CITED Jenkins, T.F. (1989) Development of an analyticalmethod for the determination of extractable
Anspach, G.L., W.E. Jones and J.F. Kitchens (1982) nitroaromatics and nitramines in soils. PhD. thesis,Evaluationofsolidsorbentsforsamplingandanaly- University of New Hampshire, Durham, Newsis of explosives from water. USATHAMA Report Hampshire.DRXTH-TE-CR-82142, Aberdeen Proving Ground, Jenkins, T.F. and P.H. Miyares (1991) Non-evapo-Maryland. rative preconcentration technique for volatile andBelkin, F., R.W. Bishop and M.V. Sheeley (1985) semi-volatile solutes. Analytical Chemistry, 63:1341-Analysis of explosives in water by capillary gas 1343.chromatography. Journal of Chromatographic Sci- Jenkins, T.F., P.H. Miyares and M.E. Walsh (1988)ence, 24: 532-534. An improved RP-HPLC method for determiningBicking, M.K.L. (1987) Evaluation of solid sorbent nitroaromatics and nitramines in water. U.S. Armytechnology. U.S. Army Toxic and Hazardous Ma- Cold Regions Research and Engineering Labora-terials Agency. Final Report Contract No. DAAG29.- tory, Special Report 88-23.81D-0100. Aberdeen Proving Ground, Maryland. Jenkins, T.F., M.E. Walsh, P.W. Schumacher, P.H.Environmental Protection Agency (1992) Miyares, C P Rauer and C.L. Grant (1989) LiquidDinitrotoluene Health Advisory. Criteria and Stan- chroma uographic method for determination of ex-dards Division, Office of Drinking Water, Wash- fractable nitroaromatic and nitramine residues inington, D.C. soil. Journal of the Association of Official AnalyticalEnvironmental Protection Agency (1991) Health Chemists, 72: 890-899.Advisory for 1,3-Dinitrobenzene, Criteria aid Stan- Junk, G.A., J.J. Richard, M.D. Grieser, D. Witiak,dards Division. Office of Drinking Water, Wash- J.L. Witiak, M.D. Arguello, H.L. Svec, J.S. Fritzington, D.C., January 1991. and G.V. Calder (1974). Use of macroreticular res-Environmental Protection Agency (1989) Trinitro- ins in the analysis of water for trace organic con-toluene Health Advisory. Office of Drinking Wa- taminants. Journal of Chromatography, 99: 745-762.ter, Washington, D.C., January 1989. Layton, D., B. Mallon, W. Mitchell, L. Hall, R.Environmental Protection Agency (1988a) Health Fish, L. Perry, G. Snyder, K. Bogen, W. Malloh, C.Advisory for HMX. Criteria and Standards Divi- Ham and P. Dowd (1987) Conventional weaponssion, Office of Drinking Water, Washington, D.C., demilitarization: A health and environmental ef-November 1988. fects data base assessment. Lawrence LivermoreEnvironmental Protection Agency (1988b) Health Laboratory AD-A220 588.Advisory for RDX. Criteria and Standards Divi- Leggett, D.C., T.F. Jenkins and P.H. Miyares (1990)sion, Office of Drinking Water, Washington, D.C., Salting-out solvent extraction for preconcentrationNovember 1988. of neutral polar organic solutes from water. Ana-Etnier, E.L. (1987) Water quality criteria for 2,4- lytical Chemistry, 62: 1355-1356.dinitrotoluene and 2,6-dinitrotoluene. Oak Ridge Maskarinec, M.P., D.L. Manning, R.W. Harvey,National Laboratory Report AD-ORNL 6312, Oak W.H. Griest and B.A. Tomkins (1984) Determina-Ridge, Tennessee. tions of munitions components in water by resinFreeman, D.H., R.M. Angeles and I.C. Poinescu adsorption and high-performance liquid chromato-(1976) High-performance liquid chromatographic graph-electrochemical detection. Journal of Chro-separation of RDX and HMX explosives on adsorp- matography, 304: 51-63.tive polymers. Journal of Chromatography, 118: 147- Maskarinec, M.P., D.L. Manning, R.W. Harvey166. (1986) Application of solid sorbent collection tech-Hable, M., C. Stem, C. Asowata and K. Williams niques and high performance liquid chromatogra-(1991) The determination of nitroaromatics and phy with electrochemical detection to the analysis
21

of explosives in water samples. Oak Ridge Na- U.S. Army Medical Bioengineering Research andtional Laboratory, Report TM-10190, Oak Ridge, Development Laboratory Technical Report 8603,Tennessee. Fort Detrick, Maryland.Miyares, P.H. and T.F. Jenkins (1990) Salting-out Spanggord, R.J., B.W. Gibson, R.G. Keck, D.W.solvent extraction method for determining low Thomas and J.J. Barkley (1982) Effluent analysis oflevels of nitroaromatics and nitramines in water. wastewater generated in the manufacture of 2,4,6-USA Cold Regions Research and Engineering Labo- tinitrotoluene. 1. Characterization study. Environ-ratory, Special Report 90-30. mental Science and Technology, 16: 229-232.Miyares, P.H. and T.F. Jenkins (1991) Improved Spaulding, R.F. and J.W. Fulton (1988) Ground-salting-outextraction/preconcentrationmethodfor water munition residues and nitrate near Grandthe determination of nitroaromatics and nitramines Island, Nebraska, USA. Journal of Contaminant Hy-in water. USA Cold Regions Research and Engi- drology, 2: 139-153.neering Laýoratory, Special Report 91-18. Valis, R.J., T.A. Bishop and K.E. Williams (1989)Phillips, J.H., R.J. Coraor and S.R. Prescott (1983) Validationofasorbent tube/high-performanceliq-Determination of nitroaromatics in biosludges with uid chromatographic procedure for the determina-gas chromatography/thermal energy analyzer. tion of eight explosives in water. U.S. Army Envi-Analytical Chemistry, 55: 889-892. ronmental Hygiene Agency (AEHA), AberdeenPugh, D.L. (1982) Milan Army Ammunition Plant Proving Ground, Maryland. Final ReportAD-A210Survey. U.S. Army Toxic and Hazardous Materials 777.Agency, Report DRXTH-FS-FR-82131. Aberdeen Winslow, M.G., B.A. Weichert, and R.D. BakerProving Ground, Maryland. (1991) Determination of low-level explosive resi-Richard, J.J. and G.A. Junk (1986) Determination dues in water by HPLC: Solid-phase extraction vs.of munitions in water using macroreticular resins, salting-out solvent extraction. In Proceedings of theAnalytical Chemistry, 58: 725-727. EPA 7th Annual Waste Testing and Quality AssuranceRobenblatt, D.H.(1986)Contaminatedsoilcleanup Symposium, July 8-12, 1991, Washington, D.C.objectives for Cornhusker Army Ammunition Plant.
22

APPENDIX A: RESULTS OF 4-DAY USATHAMA CERTIFICATIONTEST
Table Al. Results of 4-day USATHAMA certification test, HMX, by cartridge-SPE.
Target concentration Found concentration (,ug/L)Level pg/L Dayl 1 Day 2 Day 3 Day 4
0 0 0 0 0 00.SX 0.6 0.21 0.22 0.17 0.20
X 0.11 0.30 0.28 0.21 0.282X 0.23 0.40 0.39 0.29 0.405X 0.57 0.77 0.75 0.68 0.74
lox 1.14 1.29 1.31 1.23 1.33
Table A2. Results of 4-day USATHAMA certification test, RDX, by cartridge-SPE.
Target concentration Found concentration (1igIL)Level pg/L Day I Day 2 Day 3 Day 4
OX 0 0.39 0.47 0.48 0.510.5 0.05 0.44 0.39 0.38 0.61
X 0.10 0.59 0.47 0.42 0.462X 0.21 0.63 0.54 0.55 0.495X 0.52 1.02 0.92 0.98 0.90
lox 1.04 1.76 1.57 1.65 1.50
Table A3. Results of 4-day USATHAMA certification test, TNB, by cartri.dge-SPE.
Target concentration Found concentration (pg/L)Level pg/L Day I Day 2 Day 3 Day 4
OX 0 0 0 0 00.5 0.04 0.06 0.08 0.07 0.05X 0.08 0.14 0.11 0.12 0.11
2X 0.17 0.19 0.21 0.21 0.235X 0.41 0.53 0.53 0.57 0.56
loX 0.82 1.06 1.06 1.12 1.16
Table A4. Results of 4-day USATHAMA certification test, DNB, by cartridge-SPE.
Target concentration Found concentration (lugIL)Level 11/L Day I Day 2 Day 3 Day 4
OX 0 0 0 0 00.5 0.05 0.07 0.06 0.07 0.07X 0.10 0.16 0.13 0.13 0.13
2X 0.21 0.24 0.25 0.23 0.255X 0.52 0.61 0.60 0.62 0.61
lox 1.04 1.20 1.20 1.20 1.22
23
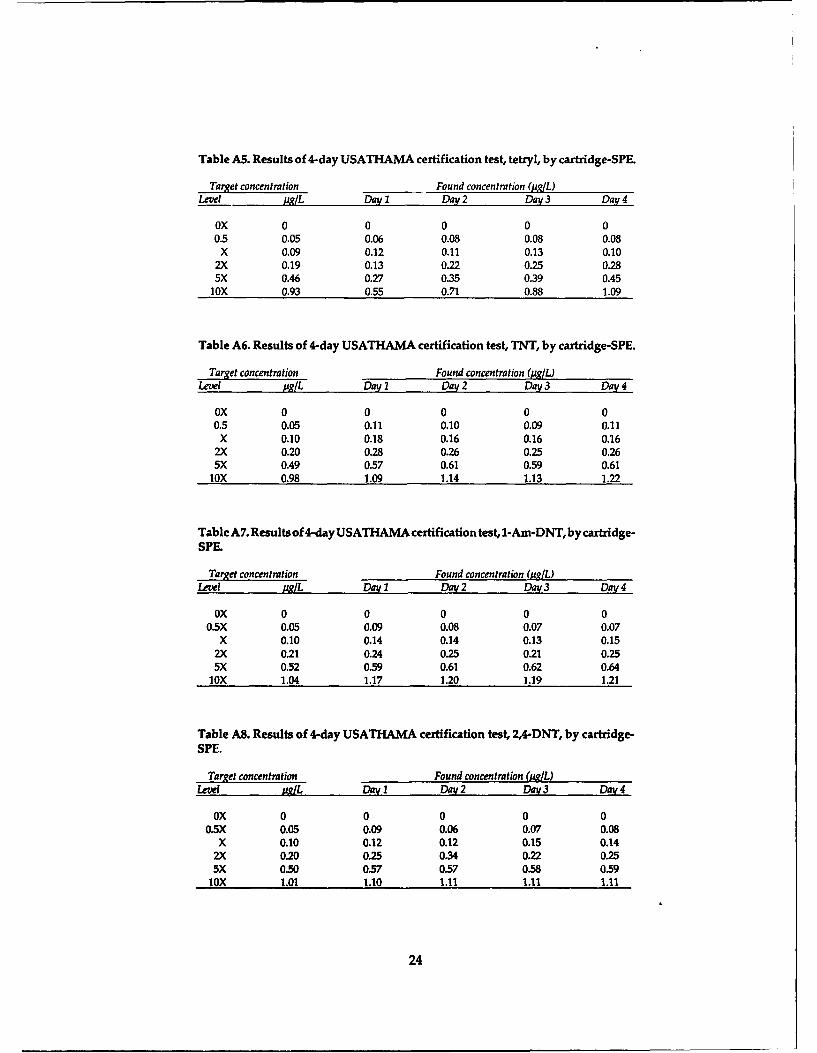
Table AS. Results of 4-day USATHAMA certification test, tetryl, by cartridge-SPE.
Target concentration Found concentration (pgIL)Level pg/L Dayl1 Day 2 Day 3 Day 4
OX 0 0 0 0 00.5 0.05 0.06 0.08 0.08 0.08
X 0.09 0.12 0.11 0.13 0.102X 0.19 0.13 0.22 0.25 0.285X 0.46 0.27 0.35 0.39 0.45
loX 0.93 0.55 0.71 0.88 1.09
Table A6. Results of 4-day USATHAMA certification test, TNT, by cartridge-SPE.
Target concentration Found concentration (pg/L)Level A/LL Day 1 Day 2 Day 3 Day 4
OX 0 0 0 0 00.5 0.05 0.11 0.10 0.09 0.11X 0.10 0.18 0.16 0.16 0.16
2X 0.20 0.28 0.26 0.25 0.265X 0.49 0.57 0.61 0.59 0.61
lox 0.98 1.09 1.14 1.13 1.22
Table A7. Results of 4-day USATHAMAcertification test, 1-Am-DNT, by cartridge-SPE.
Target concentration Found concentration (fg]L)Level ARLL Day 1 Day/2 Day 3 Dav 4
OX 0 0 0 0 00.SX 0.05 0.09 0.08 0.07 0.07
X 0.10 0.14 0.14 0.13 0.152X 0.21 0.24 0.25 0.21 0.255X 0.52 0.59 0.61 0.62 0.64
lox 1.04 1.17 1.20 1.19 1.21
Table AS. Results of 4-day USATHAMA certification test, 2,4-DNT, by cartridge-SPE.
Target concentration Found concentration (p3JL)Level URL Day I Day 2 Day 3 Day 4
OX 0 0 0 0 00.5X 0.05 0.09 0.06 0.07 0.08
X 0.10 0.12 0.12 0.15 0.142X 0.20 0.25 0.34 0.22 0.255X 0.50 0.57 0.57 0.58 0.59
lox 1.01 1.10 1.11 1.11 1.11
24

Table A9. Results of 4-day USATHAMA certification test, o-NT, by cartridge-SPE.
Target concentration Found concentration (/ug/L)Level gg/L Day 1 Day/ 2 Day 3 Day 4
OX 0 0 0 0 00.5X 0.05 0 0 0.08 0.08
X 0.11 0.13 0.15 0.17 0.132X 0.21 0.25 0.26 0.24 0.245X 0.54 0.56 0.63 0.64 0.57
lox 1.07 1.15 1.16 1.18 1.11
Table A10. Results of 4-day USATHAMA certification test, p-NT, by cartridge-SPE.
Target concentration Found concentration (li/gL)Level pg/L Day 1 Day 2 Day 3 Day 4
OX 0 0 0 0 00.5X 0.05 0 0 0 0.07
X 0.11 0.15 0.16 0.18 0.142X 0.21 0.23 0.27 0.20 0.235X 0.53 0.55 0.60 0.57 0.55
lox 1.06 1.09 1.13 1.10 1.08
Table All. Results of 4-day USATHAMA certification test, m-NT, by cartridge-SPE.
Target concentration Fomnd concentration (.ug/L)Level i,/L Dayl 1 Day 2 Dai 3 Day/4
OX 0 0 0 0 00.5X 0.06 0.09 0 0 0 il
X 0.12 0.18 0.13 0.21 0.172X 0.25 0.29 0.26 0.27 0.285X 0.62 0.64 0.64 0.66 0.67
loX 1.23 1.26 1.23 1.26 1.21
Table A12. Results of 4-day USATHAMA certification test, HMX, by SOE.
Target concentrati,, Found concentration (uIL)Level MSL Day 1 Dav 2 Dai 3 Dav 4
oX 0 0 0 0 00.5X 0.06 0.19 0.19 0.13 0.22
X 0.11 0.24 0.25 0.16 0.262X 0.23 0.39 0.40 0.30 0.385X 0.57 0.74 0.69 0.65 0.69
loX 1.14 1.25 1.30 1.21 1.33
25

Table A13. Results of 4-day USATHAMA certification test, RMX, by SOE.
Target concentration Found concentration (pg/L)Level 1ug/L Day I Day 2 Day 3 Day 4
OX 0 0 0 0 0.110.5X 0.05 0.12 0.13 0.14 0.08
X 0.10 0.15 0.17 0.17 0.112X 0.21 0.25 0.27 0.32 0.235X 0.52 0.56 0.63 0.62 0.60
lOX 1.04 1.14 1.19 1.14 1.09
Table A14. Results of 4-day USATHAMA certification test, TNB, by SOL.
Target concentration Found concentration (/ug/L)Level pg/L Day I Day 2 Day 3 Day 4
oX 0 0 0 0 00.5X 0.04 0.09 0.05 0.10 0.06
X 0.08 0.12 0.13 0.12 0.122X 0.17 0.24 0.21 0.24 0.215X 0.41 0.51 0.50 0.52 0.55
lOX 0.82 1.02 0.99 0.95 1.03
Table A15. Results of 4-day USATHAMA certification test, DNB, by SOE.
Target concentration Found concentration (&•L)Level MZ/L Day/1 Day 2 Dav 3 Dav 4
OX 0 0 0 0 00.SX 0.05 0.08 0.06 0.10 0.06
X 0.10 0.12 0.03 0.11 0.122X 0.21 0.24 0.23 0.23 0.235X 0.52 0.55 0.55 0.54 0.55
lox 1.04 1.09 1.05 1.03 1.09
Table A16. Results of 4-day USATHAMA certification test, tetryl, by SOL
Target concentration Found concentration (WIL)Level OW1L Dml! DaV2 Day3 Dw 4
OX 0 0 0 0 00.5X 0.05 0.07 0.08 0.24 0.07
X 0.09 0.13 0.12 0.13 0.122X 0.19 0.24 0.23 0.29 0.245X 0,46 0.44 0.39 0.54 0.53
lox 0.93 0.78 1.01 0.88 0.93
26

Table A17. Results of 4-day USATHAMA certification test, TNT, by SOE.
Target concentration Found concentration (pg/L)Level PglL Day I Day 2 Day 3 Day 4
OX 0 0 0 0 00.5X 0.05 0.07 0.07 0.16 0.08
X 0.10 0.13 0.09 0.12 0.152X 0.20 0.22 0.23 0.24 0.235X 0.49 0.53 0.55 0.56 0.55
lox 0.98 1.02 1.06 1.01 1.08
Table A18. Results of 4-day USATHAMA certification test, 2-Am-DNT, by SOE.
Target concentration Found concentration (lug/L)Level pg/L Day 1 Day 2 Day 3 Day 4
OX 0 0 0 0 00.5X 0.05 0.06 0.07 0.18 0.08
X 0.10 0.14 0.17 0.11 0.152X 0.21 0.23 0.24 0.23 0.255X 0.52 0.59 0.58 0.56 0.57
lox 1.04 1.09 1.06 1.01 1.12
Table A19. Results of 4-day USATHAMA certification test, 2,4-DNT, by SOE.
Targ~et concentration Found concentration (ugiL)Leve uf/L Day Dav 2 PV 3 Day 4
OX 0 0 0 0 00.SX 0.05 0.06 0.08 0.14 0.08
X 0.10 0.11 0.06 0.11 0.132X 0.20 0.22 0.23 0.22 0.225X 0.50 0.54 0.54 0.54 0.54
lox 1.04 1.02 1.03 1.01 1.05
Table A20. Results of 4-day USATHAMA certification test, o-NT, by SOE.
Target concentration Found concentration (WIuL)Laem u/L Day I Day2 Day 3 Qg4
ox 0 0 0 0 00.5X 0.05 0.08 0.09 0.24 0.11
X 0.11 0.12 0.12 0.13 0.152X 0.21 0.25 0.24 0.24 0.255X 0.54 0.59 0.58 0.61 0.57
lox 1.07 1.14 1.11 1.12 1.10
27

Table A21. Results of 4-day USATHAMA certification test, p-NT, by SOE.
Target concentration Found concentration (pg/L)Level pg/L DayI/ Day 2 Day 3 Day 4
OX 0 0 0 0 00.5X 0.05 0.10 0.11 0.31 0.15
X 0.11 0.16 0.19 0.11 0.202X 0.21 0.26 0.22 0.19 0.305X 0.53 0.61 0.58 0.54 0.64
loX 1.06 1.06 1.06 1.19 1.25
Table A22. Results of 4-day USATHAMA certification test, m-NT, by SOE.
Target concentration Found concentration (pgfL)Level pJg/L Day I Day 2 Day 3 Day 4
OX 0 0 0 0 00.5X 0.06 0.10 0.11 0.26 0.15
X 0.12 0.16 0 0.17 0.202X 0.25 0.21 0.28 0.29 0.305x 0.62 0.68 0.64 0.66 0.64
lox 1.23 1.22 1.22 1.19 1.25
Table A23. Results of 4-day USATHAMA certification test, HMX, by membrane-SPE.
Target concentration Found concentration (tq/L)Level ug/L Dav 1 Dail2 Dav 3 Day 4
ox 0 0 0 0 00.5X 0.06 0.23 0.20 0 0.22
X 0.11 0.26 0.27 0.21 0.282X 0.23 0.34 0.35 0.24 0.365X 0.57 0.57 0.60 0.56 0.62
lox 1.14 1.03 0.98 0.97 0.99
Table A24. Results of 4-day USATHAMA certification test, RDX, by membrane-SPE.
Target concentration Found concentration (OIWL)Level WIL Dpa Day2 Da 3 Day4
ox 0 0.09 0.09 0.10 00.5X 0.05 0.09 0.14 0.15 0
X 0.10 0.14 0.23 0.21 0.182X 0.21 0.31 0.31 0.28 0.315X 0.52 0.64 0.67 0.70 0.60
lox 1.04 1.26 1.24 1.28 1.28
28

Table A25. Results of 4-day USATHAMA certification test, TNB, by membrane-SPE.
Target concentration Found concentration (/ug/L)Level /ug/L Day I Day 2 Day 3 Day 4
OX 0 0 0 0 00.5X 0.04 0.07 0.08 0.06 0.07
X 0.08 0.07 0.13 0.11 0.122X 0.17 0.19 0.21 0.23 0.215X 0.41 0.51 0.48 0.55 0.50
loX 0.82 0.90 0.94 1.00 1.02
Table A26. Results of 4-day USATHAMA certification test, DNB, by membrane-SPE.
Target concentration Found concentration (g/yL)Level p9/L Day 1 Day 2 Day 3 Day 4
0x 0 0 0 0 00.5X 0.05 0.06 0.07 0.06 0.06
X 0.10 0.11 0.14 0.11 0.132X 0.21 0.22 0.23 0.25 0.225X 0.52 0.59 0.52 0.56 0.56
lox 1.04 1.14 1.05 1.09 1.05
Table A27. Results of 4-day USATHAMA certification test, tetryl, by membrane-SPE.
Target concentration Found concentration (AgIL)Level pgiL DMY 1 Day 2 Day 3 Day 4
ox 0 0 0 0 0o.SX 0.05 0.05 0.07 0.07 0.05
x 0.09 0.06 0.14 0.09 0.122X 0.19 0.08 0.20 0.21 0.235X 0.46 0.24 0.69 0.56 0.41
lox 0.93 0.34 0.82 0.91 0.98
Table A28. Results of 4-day USATHAMA certification test, TNT, by membrane-SPE.
Target concentration Found concentration (g/L)LeI uIsL Day 1 DaV 2 Da 3 Day 4
ox 0 0 0 0 0O.MX 0.05 0.07 0.11 0.10 0.05
X 0.10 0.12 0.15 0.16 0.122X 0.20 0.22 0.24 0.28 0.235X 0.49 0.51 0.42 0.56 0.41
lox 0.98 1.00 0.98 1.01 0.98
29
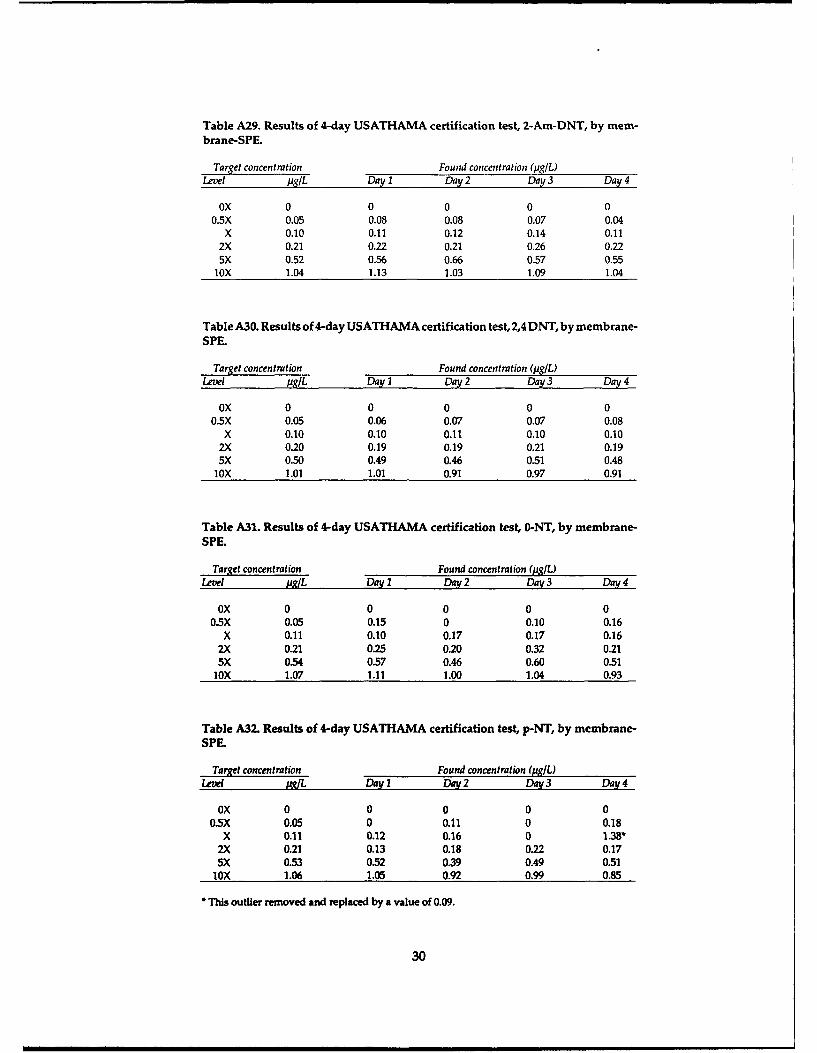
Table A29. Results of 4-day USATHAMA certification test, 2-Am-DNT, by mem-brane-SPE.
Target concentration Found concentration (pg/L)Level ju/L Day I Day 2 Day 3 Day 4
ox 0 0 0 0 00.5X 0.05 0.08 0.08 0.07 0.04
X 0.10 0.11 0.12 0.14 0.112X 0.21 0.22 0.21 0.26 0.225X 0.52 0.56 0.66 0.57 0.55
lox 1.04 1.13 1.03 1.09 1.04
Table A30. Results of 4-day USATHAMA certification test, 2,4 DNT, by membrane-SPE.
Target concentration Found concentration (pg/L)Level Pg/L Day I Day 2 Day/3 Day 4
ox 0 0 0 0 0O.Sx 0.05 0.06 0.07 0.07 0.08
x 0.10 0.10 0.11 0.10 0.102X 0.20 0.19 0.19 0.21 0.195X 0.50 0.49 0.46 0.51 0.48
lox 1.01 1.01 0.91 0.97 0.91
Table A31. Results of 4-day USATHAMA certification test, 0-NT, by membrane-SPE.
Target concentration Found concentration (pg/L)Levi p•IL Day I Day 2 Day 3 Day 4
ox 0 0 0 0 00.5X 0.05 0.15 0 0.10 0.16
x 0.11 0.10 0.17 0.17 0.162X 0.21 0.25 0.20 0.32 0.215X 0.54 0.57 0.46 0.60 0.51
lox 1.07 1.11 1.00 1.04 0.93
Table A32. Results of 4-day USATHAMA certification test, p-NT, by membrane-SPE.
Target concentration Found concentration (pqIL)LeIel MIL Day I Day 2 DaV 3 Day 4
OX 0 0 0 0 00.-X 0.05 0 0.11 0 0.18
X 0.11 0.12 0.16 0 1.38*2X 0.21 0.13 0.18 0.22 0.175X 0.53 0.52 0.39 0.49 0.51
lOX 1.06 1.05 0.92 0.99 0.85
This outlier removed and replaced by a value of 0.09.
30
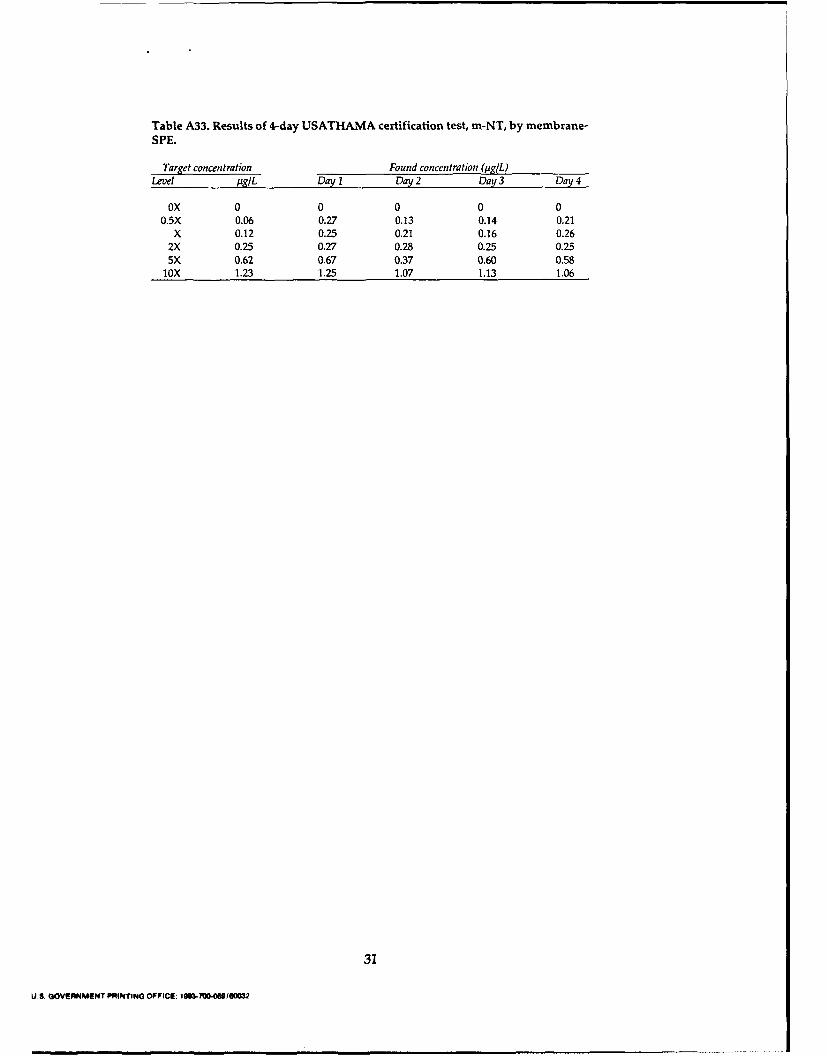
Table A33. Results of 4-day USATHAMA certification test, m-NT, by membrane-SPE.
Target concentration Found concentration (pug/L)Level ug/L Day I Day 2 Day 3 Day 4
OX 0 0 0 0 00.5X 0.06 0.27 0.13 0.14 0.21
X 0.12 0.25 0.21 0.16 0.262X 0.25 0.27 0.28 0.25 0.255X 0.62 0.67 0.37 0.60 0.58
lox 1.23 1.25 1.07 1.13 1.06
31
U.S. GOVERNMENT PRI1NTING OFFICE: 1g3-7I00O-MSISOM32
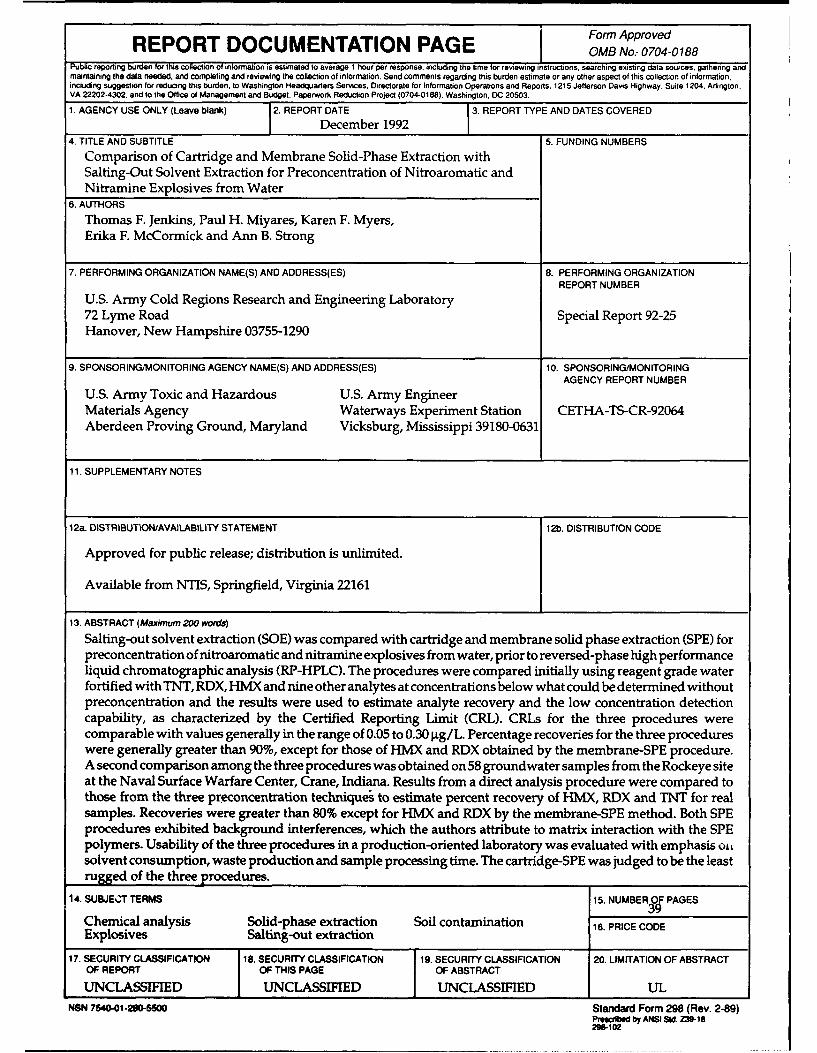
S Formn ApprovedREPORT DOCUMENTATION PAGE OFB Nom 07Ap -o188
Public reporting burden for this collection of information is estimated to average 1 hour per response, including the time for reviewing instructions, searching existing data sources. gathering andmaintaining the data needed, and completing and reviewing the collection of information. Send comments regarding this burden estimate or any other aspect of this collection of information,including suggestion for reducing this burden, to Washington Headquarters Services, Directorate for Information Operations and Reports. 1215 Jefferson Davis Highway, Suite 1204, Arlington,VA 22202-4302. and to the Office of Management and Budget, Paperwork Reduction Project (0704-0188), Washington, DC 20503.
1. AGENCY USE ONLY (Leave blank) 12. REPORT DATE 3. REPORT TYPE AND DATES COVEREDI December 19924. TITLE AND SUBTITLE 5. FUNDING NUMBERS
Comparison of Cartridge and Membrane Solid-Phase Extraction withSalting-Out Solvent Extraction for Preconcentration of Nitroaromatic andNitramine Explosives from Water
6. AUTHORS
Thomas F. Jenkins, Paul H. Miyares, Karen F. Myers,Erika F. McCormick and Ann B. Strong
7. PERFORMING ORGANIZATION NAME(S) AND ADDRESS(ES) 8. PERFORMING ORGANIZATION
REPORT NUMBER
U.S. Army Cold Regions Research and Engineering Laboratory72 Lyme Road Special Report 92-25Hanover, New Hampshire 03755-1290
9. SPONSORING/MONITORING AGENCY NAME(S) AND ADDRESS(ES) 10. SPONSORING/MONITORINGAGENCY REPORT NUMBER
U.S. Army Toxic and Hazardous U.S. Army EngineerMaterials Agency Waterways Experiment Station CETHA-TS-CR-92064Aberdeen Proving Ground, Maryland Vicksburg, Mississippi 39180-0631
11. SUPPLEMENTARY NOTES
12a. DISTRIBUTION/AVAILABILITY STATEMENT 12b. DISTRIBUTION CODE
Approved for public release; distribution is unlimited.
Available from NTIS, Springfield, Virginia 22161
13. ABSTRACT (Maximum 200 words)
Salting-out solvent extraction (SOE) was compared with cartridge and membrane solid phase extraction (SPE) forpreconcentration of nitroaromatic and nitramnine explosives from water, prior to reversed-phase high performanceliquid chromatographic analysis (RP-HPLC). The procedures were compared initially using reagent grade waterfortified with TNT, RDX, HMX and nine other analytes at concentrations below what could be determined withoutpreconcentration and the results were used to estimate analyte recovery and the low concentration detectioncapability, as characterized by the Certified Reporting Limit (CRL). CRLs for the three procedures werecomparable with values generally in the range of 0.05 to 0.30 g~g/L. Percentage recoveries for the three procedureswere generally greater than 90%, except for those of HMX and RDX obtained by the membrane-SPE procedure.A second comparison among the three procedures was obtained on 58 groundwater samples from the Rockeye siteat the Naval Surface Warfare Center, Crane, Indiana. Results from a direct analysis procedure were compared tothose from the three preconcentration techniques to estimate percent recovery of HMX, RDX and TNT for realsamples. Recoveries were greater than 80% except for HMX and RDX by the membrane-SPE method. Both SPEprocedures exhibited background interferences, which the authors attribute to matrix interaction with the SPEpolymers. Usability of the three procedures in a production-oriented laboratory was evaluated with emphasis ofisolvent consumption, waste production and sample processing time. The cartridge-SPE was judged to be the leastrugged of the three procedures.
14. SUBJECT TERMS 15. NUMBER OF PAGES39
Chemical analysis Solid-phase extraction Soil contamination 16. PRICE CODEExplosives Salting-out extraction
17. SECURITY CLASSIFICATION 18. SECURITY CLASSIFICATION 19. SECURITY CLASSIFICATION 20. LIMITATION OF ABSTRACT
OF REPORT OF THIS PAGE OF ABSTRACT
UNCLASSIFIED UNCLASSIFIED UNCLASSIFIED ULNSN 7540"01-280-SS00 Standard Form 298 (Rev. 2-89)
Premlbod by ANSI f. Z39-1S2.-1o2