comparison of calculated and experimental cascade ... · pdf filecomparison of calculated and...
TRANSCRIPT

NASA Technical Memorandum 87167
Comparison of Calculated and ExperimentalCascade Performance for Controlled-DiffusionCompressor Stator Blading(NASA-TU-87167) COMPARISON OF CALCULATED N86-16219AND EXPEBIHENTAL CASCADE PEEfOBMANCE FORCONTROLI/ED-DIfFUSION CGHPRESSOE STATORBLADING (NASA) 22 p HC AOVH* A01 CSCL 21E Uuclas
G3/07 05210
Nelson L. SangerLewis Research CenterCleveland, Ohio
and
Raymond P. ShreeveNavel Postgraduate SchoolMonterey, California
Prepared for theInternational Gas Turbine Conference and Exhibitsponsored by the American Society of Mechanical EngineersDusseldorf, West Germany, June 8-12, 1986
NASA
https://ntrs.nasa.gov/search.jsp?R=19860006749 2018-05-12T07:11:33+00:00Z
COMPARISON OF CALCULATED AND EXPERIMENTAL CASCADE PERFORMANCE FORCONTROLLED-DIFFUSION COMPRESSOR STATOR BLADING
Nelson L. SangerNational Aeronautics and Space Administration
Lewis Research CenterCleveland, Ohio 44135
and
Raymond P. ShreeveNaval Postgraduate SchoolTurbopropulsion LaboratoryMonterey, California 93940
ABSTRACT :
The mid-span section of a previously reportedcontrolled-diffusion compressor stator has been experi-mentally evaluated -in cascade. Measurements were takenover a range of incidence angles for blade chordReynolds numbers from 470 000 to 690 000. Blade chordlength was 12.7 cm, aspect ratio was 2.0, and soliditywas 1.67." Measurements included conventional cascadeperformance parameters as well as blade surface pres-sures. Computations were made for the inviscid flowfield,-surface boundary layers, and loss for several ofthe blade -inlet 'angle conditions, and compared againstcorresponding data.
NOMENCLATURE •••••:• . •
AVDR Axial Velocity-Density Ratio (Eq. 1)
Cp surface pressure coefficient (Eq. 8)
Cr local-to-reference pressure (Eq. 4)
c- blade chord
i - incidence angle (air angle - blade metal angle)
k local-to-reference mass flux (Eq. 3)
P total pressure
p static pressure
q dynamic pressure
Re Reynolds number based on chord
s blade spacing
V Velocity
x/c fraction of chord
B air angle
Y stagger angle (Fig. 5) . ,
p density . •
a blade solidity ... :. ,,,-,
$ blade camber angle . .•
u loss coefficient (Eq. 2) . • •. .
Subscripts
1 inlet plane
2 outlet plane
REF reference conditions
t stagnation conditions . .i ; •
INTRODUCTION .. ', - - . ..:...,"
In a paper presented at a recent International Ga'sTurbine Conference, the design of a controlled diffusioncompressor stator using an automated design procedurebased on numerical optimization was described (\). Thecontrolled diffusion stator was a redesign of the firststage stator of the NASA Two-Stage Fan (2_). The orig-inal design was hignly successful, demonstrating a firststage peak adiabatic efficiency of 87 percent, and aradial distribution of loss across the stator which was. ,remarkably low. The purpose of the redesign was todevelop and demonstrate the feasibility of an automateddesign process using numerical optimization methods.Although significant performance improvement from analready excellent stator design was not expected, atleast equivalent performance was expected. In addition,the redesigned stator was intended to provide a researchvehicle for the new controlled diffusion class of,Dlad ing.
As described in Ref. 1, the controlled diffusionstator was designed using a series of computationalanalysis methods coupled by a numerical optimizationprocedure. The blade snapes were specified by a
geometry code extracted from the NASA throughflow com-pressor design program (3_). Blade section mean linesand thickness distributions were described by severalpolynomial curves. The potential flow.about,each two .dimensional blade section was calculated by the TSONICcode developed by Katsanis (4). Surface boundarylayers were calculated using the McNally BLAYER code(5), and the optimization procedure used to couple all-oT the aerodynamic and geometric codes together was theCOPES/CONMIN code (6,7).
The mid-span section of the blade has been builtand tested in a cascade wind-tunnel at the NavalPostgraduate School. Although inlet Mach numbers (0.2)in this subsonic tunnel are less than the design level(0.68), experiments can be conducted at realisticReynolds numbers (500 000 to 700 000) on relativelylarge scale blading (12.7 cm chord), on which detailedsurface pressures can be obtained. Furthermore, sincethe computational codes used to design the blading werequasi-three-dimensional and steady state, it is ofinterest to obtain experimental data in a similar flowenvironment, as well as in the real, unsteady, fullytnree-dimensional environment of the compressor stage.The data obtained in cascade provide an excellentopportunity to assess the accuracy of the flow codesnot only at the design point, but also at off-designconditions. In this report, data obtained over thefull range of incidence angle (including flow visual-ization data), are compared against the calculatedresults from several flow codes.
EXPERIMENTAL PROGRAM
Description of the Test FacilityThe arrangement of the cascade wind tunnel facility
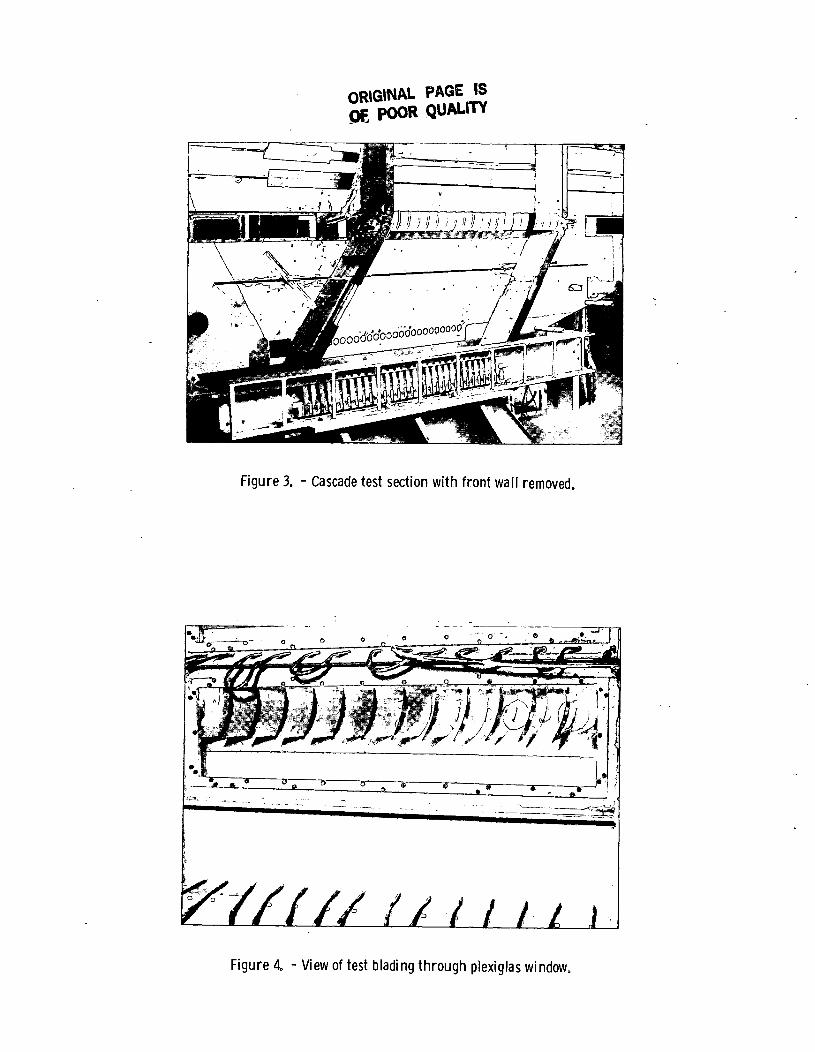
is snown in Fig. 1. The tunnel is supplied by a 700 HPclower in the basement of the building through anarrangement of sound baffles and turning vanes. Theair enters the tunnel through two, two-dimensional bell-mouth contractions in series which produce a 152.4 by25.4 cm (60 by 10 in.) section just above floor level.Trie 25.4 cm width is maintained between heavy sidewalls, between which an adjustable test section isformed as shown in Fig. 2. The blades of the testcas'cade are mounted in a rack which can be moved alongtne (fixed) back wall. The front wall is readilyremoved by overhead crane to:give access to test •_section and instrumentation (Fig. 3). The air angleinto the test cascade is governed by the setting of theadjustable lower end walls and the 59 inlet guide(or turning) vanes. The adjustable upper (exit) endwalls are individually adjusted during operation toangles required to produce uniform" static pressure atthe wall in the blade-to-blade direction. Static pres-sure taps are provided at 5.08 cm intervals in theDlade-to-blade direction at vertical (axial) distancesof 41.28 cm upstream and 16.51 cm downstream of thecenter of the test blades. Spanwise and blade-to-bladeprobe traverses are provided at 31.12 cm verticallyupstream and 27.31 cm vertically downstream of the samereference. Plexiglass windows in the removable wall atthe test blading facilitate the use of flow visualiza-tion techniques (Fig. 4).
Unusual features of the facility are the largescale, the large number of test blades (20, at 7.62 cmspacing) and the technique for controlling inlet airangle. Considerable facility development and testexperience (8-L3) preceded the present test program.Upstream flow uniformity, periodicity and steadiness,and acceptable axial velocity-density values withoutresort to boundary layer suction, were achieved as aresult of the initial design features and subsequentexperimental programs. Turbulence intensity, measured
across five turning vane pitches at blade mid-height,was 2 percent.
Test BladeThe blade shape is represented in cascade in Fig. 5.
The mean line is represented by two segments, each des-crioed oy polynomial curves. A symmetrical thicknessdistribution is built on the meanline. This thicknessis made up of a front segment and a rear segment, eachrepresented by a separate polynomial. The polynomialcoefficients were arrived at through an optimizationprocess described in Ref. 1. A summary of the sectiongeometrical properties is given in Table I.
Instrumentation and Data AcquisitionThe instrumentation is summarized in Table II. The
flow survey probes were calibrated using Zebner's sur-face approximation method (Ref. 15) with computer pro-grams given in Ref. 16.
A Hewlett-Packard HP3052 Data Acquisition systemincorporating an HP9845A desktop computer and NPS/TPLHG-78K Scanivalve Controller were used to acquire pres-sure and temperature data. Flow survey probes and tun-nel reference pressures were connected to one 48 portScanivalve and blade surface pressures and referencereadings to another. Measurement uncertainties aregiven in Table III. Tunnel wall statics were displayedand observed on a 50 tube, water manometer.
The china clay technique was used as described inRef. 13. Surface patterns were recorded in color usinga movie camera, and transition and separation .distanceswere scaled from projected frames. The observations •-'made with china clay were first 'calibrated.1, by appli- .cations of the technique to both a sharp and a roundedleading edge flat plate model set into the cascade inplace of the test blading (Ref. 13).
Turbulence intensity measurements were taken with -afull micron tungsten wire. The wire was calibratedusing King's Law over fourteen points from a tunneldynamic pressure of 0 to 39.4 cm of water. The corre-lation coefficient was 0.995.
Testing Procedure and Data ReductionSeven inlet air flow angles from 24 to 46° were
selected and set in turn. At each angle setting similarprocedures were followed. With the tunnel set to thedesired inlet dynamic pressure (either 33 or 20 cm ofwater) tail boards and IGVs were adjusted to give near-uniform wall static pressures both upstream and down-stream of the test blading. Blade-to-blade probe sur-veys were then conducted over four adjacent blade spacesabout the center blade. Probe data and reference datawere recorded at 0.64 cm intervals over the outerspaces, and 0.25 cm intervals over the central spaces.The lower probe trailed the upper by 3.84 cm throughouttne traverse procedure. A spanwise probe survey wasthen conducted at 1.27 cm intervals at the upper stationwith tne probe located at about 2.5 cm from the suctionside of the center blade. The survey procedure wasrepeated with the lower probe at approximately 2.5 cmfrom tne pressure side of the central blade. The bladesurface pressures and reference data were then recordedwitn tunnel reference data.
China clay observations were made for similar set-tings of tne cascade at a dynamic pressure of approxi-mately 9.3 cm of water. The somewhat reduced velocitywas necessary since higher velocities give too rapid adrying rate, and difficulty in recording and interpre-ting tne drying patterns. Blade static pressure distri-butions were recorded when china clay observations weremade. These data could be compared with data alreadyrecorded at two higher Reynolds Number.
In the reduction of the probe survey data, afterreduction to velocity, pressure and flow angle at eachpoint, the data were referenced to quantities derivedfrom tne tunnel plenum to atmospheric pressure (drivingpotential). As shown in Ref. 9 and 10, this permitsintegration of the measurements over the blade-to-bladedisplacement to obtain the Axial Velocity-Density Ratio(AVDR) and loss coefficient such that small variationsin supplyconditions during the survey have littleeffect. The AVDR was calculated using the definition
ADVR
cos
P p,V1 cosJo
and the loss coefficient using the definition
Ptl - (2)
where bars denote mass-averaged values.
Defining local-to-reference mass flux as
. _ PV cos al\ — iJ
prefvref
and local-.to-reference pressure as
PCrrref
(3)
(4)
then Eqs. (1) and (2) become, respectively,
AVDR = Jo" k^ ds'2 Ub2 (5)
and
_ jf kl Crtl ds - AVM jf k2 Crt2
r ki Crtids * (6)
which is, equivalently,
- Crti ~ V A V D R J Crt2u _ _ _
• c"rtl-c"rlProbe data were reduced using Eq.(3) to (6), usingoverlapping quadratic interpolation to carry out thenumerical integrations to obtain AVDR and losscoefficient.
Surface pressures were reduced to pressurecoefficients using the definition
Cp =P - P1 (8)
To verify accuracy, the reference upstream conditionswere derived in tnree different ways, namely: as themass average of the blade-to-blade probe surveys; fromthe ensemble average of stagnation pressure readingsand derived static pressure values during blade-to-bladeprooe surveys; and as derived from the fixed Prandtlprobe measurements. .
CALCULATION METHODS
Inviscid Flow SolutionThe inviscid flow about the blade section in the
two-dimensional, blade-to-blade plane has been calcu-lated by two methods: the method described.by Katsanis,TSONIC (4), and the panel method developed by McFarland(17_) • The TSONIC program solves the stream functionequation by finite difference techniques for the sub-sonic, compressible flow regime. -It is necessary tospecify as input the fluid properties, inlet total tem-perature and density, weight flow, blade geometry, inletand outlet flow angle, finite difference mesh, and ameridional distribution of streamtube height. ,In thework presented herein, a linear distribution of stream-tube height was utilized so as to match the measuredaxial velocity-density ratio.
Because the nature of the equations dictates that"the solution be of the boundary value type," the outletflow angle must be specified on the downstream boundary.In tnese calculations, measured exit angle was used.
Tne TSONIC code uses a uniform mesh and, therefore,mesh packing in regions where more definition is desiredis not permitted. To better define the calculated flowproperties in the leading edge region, McFarland's ,panelcode (17_) was used. The code is a surface singularitymethod which solves the inviscid, irrotational, compres-sible blade-to-blade flow equations on a surface ofrevolution. Streamsheet thickness can be incorporatedas a function of meridional distance. The governingequations are linearized by approximating compressi-bility effects, and solved using an integral technique(panel method). Up to 98 panel elements are possible.Computational time for a typical case is under 4 CPUseconds on an IBM 3033 computer. The method is limitedto subsonic flow and is less accurate for low solidityDlade rows. The same input data set used for TSONICcan be used for the panel code. Because of user freedomto distribute panel elements, excellent definition inthe leading edge region can be obtained.
Boundary Layer and Loss CalculationsBlade surface boundary layers were calculated using
the program developed by McNally (5). In addition tothe surface velocities, required input includes upstreamflow conditions, fluid properties, and blade surfacegeometry. Among the output provided Dy the program arethe conventional integral thicknesses, form factors,wall friction coefficient, and momentum thicknessReynolds number.
The program uses integral methods to solve tne two-dimensional, compressible laminar and turbulent boun-dary layer equations in an arbitrary pressure gradient.Cohen and Resnotko's method (18) is used for the lami-nar boundary layer, transition is predicted by theSchlichting-Ulrich-Granville method (19J, and Sasmanand Cresci's metnod (20) is used for the turbulentboundary layer.
A boundary layer which is initially laminar mayproceed through normal transition to a turbulent boun-dary layer, or it may undergo some form of laminarseparation before becoming turbulent. To provideflexibility'for analyzing this behavior, severalprogram options are available to the user. Thecalculations may proceed from a laminar boundary layer
througn transition to a turbulent boundary layer.However, if laminar separation is predicted beforetransition, the turbulent calculations may be startedby specifying a factor by which "the last calculatedvalue of momentum thickness is multiplied (this factoris commonly chosen to be 1.0 to satisfy conservation ofmomentum). This new momentum thickness and a valuefor form factor based on the last calculated momentumtnickness Reynolds number are used as initial valuesfor the turbulent calculations. In no case is aninitial turbulent boundary layer allowed which has amomentum thickness Reynolds number less than 320 (21).Laminar separation is predicted when skin frictionbecomes zero. Prediction of turbulent separation isinexact. A separation criterion common to compressorblade analyses which use integral boundary layermethods is the incompressible form factor, Hi. Valuesof 1.8 to 2.6 nave been proposed and used in the past(22J. In this report, critical values will be inferredfrom comparisons with data.
Total pressure loss coefficients were calculatedusing Stewart's method (£3). Required input includesupstream flow conditions, fluid properties, displace-ment and momentum thickness at the trailing edge, bladespacing, trailing edge thickness, and exit velocityand flow angle. There is no satisfactory method forcalculating loss when the boundary layer is separated,and a combination of analytic art and empiricism isgenerally used. In this report, for off-design caseswhere turbulent separation occurs, tne displacementand momentum thicknesses at the location of criticalform factor are assumed to remain constant to the bladetrailing edge. These values are then used in the losscalculations from that point. Expected accuracy dimin-ishes as incidence angle increases or decreasessignificantly from the design point.
RESULTS AND DISCUSSION
Experimental ObservationsSince the cascade facility is somewhat unconven-
tional, the quality of the flow is discussed beforeresults are presented.
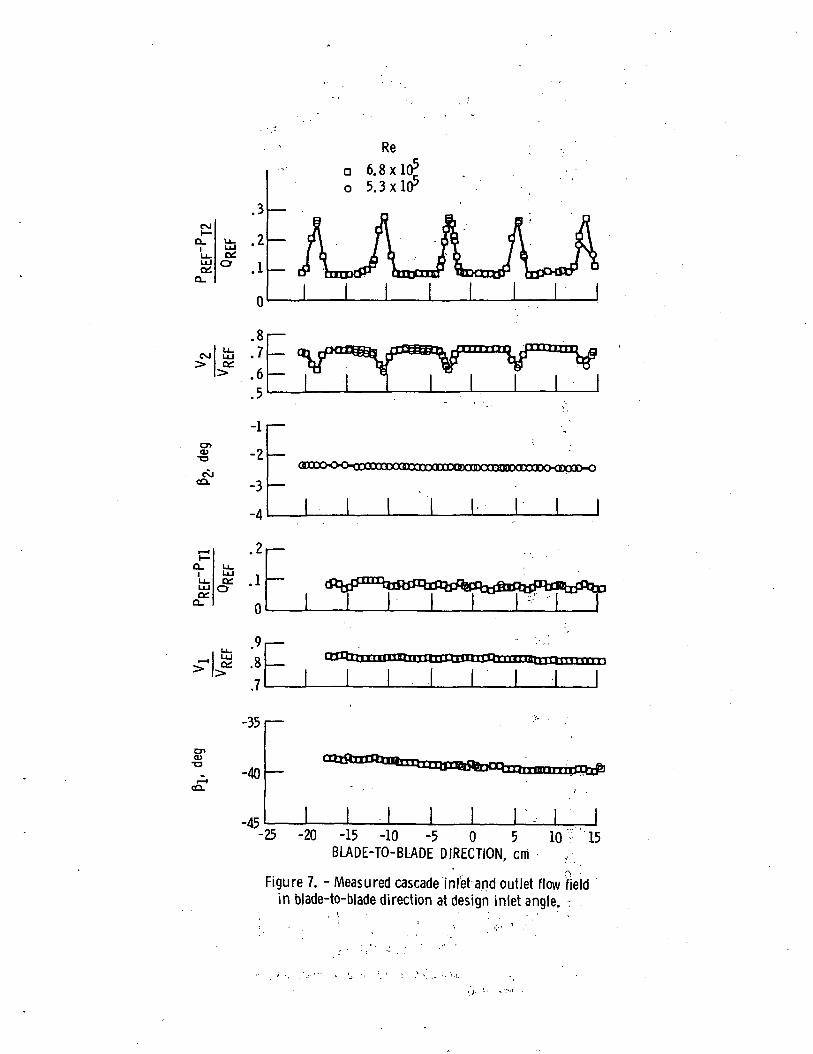
Flow quality. Data were obtained at inlet airangles ranging from 25 to 46°. Care was taken at eachsetting to verify that the inlet pressure and velocity,and the outlet pressure were acceptably uniform, andthat two-dimensional flow conditions with streamlinecontraction prevailed to the downstream measurementplane. Surveys of upstream and downstream flows forall test conditions are documented in detail inRef. 14'. In Figs. 6 and" 7 are shown, for illustration,the results of spanwise and blade-to-blade probe sur-veys, respectively, at the design air-inlet angle of39 . In Fig. 6 it can be seen that the flow remainsnearly uniform over the center 40 percent of the blade.
In Fig. 7, showing the blade-to-blade conditions,the variation which appears almost as noise on theinlet stagnation pressure profile is what remains ofthe wakes produced by the turning vanes. The peak-to-peak variation seen in Fig. 7 is about +1.4 percent ofthe reference dynamic pressure, or +1.1 percent of thecascade inlet dynamic pressure. Thus, the inlet velo-city was uniform to within 1.2 percent, and these smallvariations were accounted for by mass-averaging inevaluating both AVDR and losses. The inlet flow anglewas uniform to within 0.5° over the central four bladepassages which were surveyed.
In viewing the downstream flow distributions inFig. 7, it should be noted that data were taken atclose intervals (0.25 cm) for integration over one
blade passage, -and over coarse intervals (0.62 cm) forthe other three. All data points are shown connectedoy straight lines. The minor departure from strictlyrepetitive conditions seen in the first (left-hand)blade interval was observed in all data sets. Inte-gration to obtain blading performance was thereforecarried out over the third blade interval. Periodicitywithin the blade passages was verified using corre-sponding pressure taps on three instrumented blades.
The quality of the test conditions did not changesignificantly except at theotwo extreme angles tested.At the lowest air angle (25°), the inlet uniformitydecreased fractionally as a result of operating theinlet turning vanes considerably off design, while thephysical separation of the wakes was increased becauseof the less oblique wall angle. At the highest angle(46°), the uniform core of the spanwise profile wasreduced from 40 to 20 percent of span as a result ofincreased wall and passage viscous effects associatedwith increased loading.
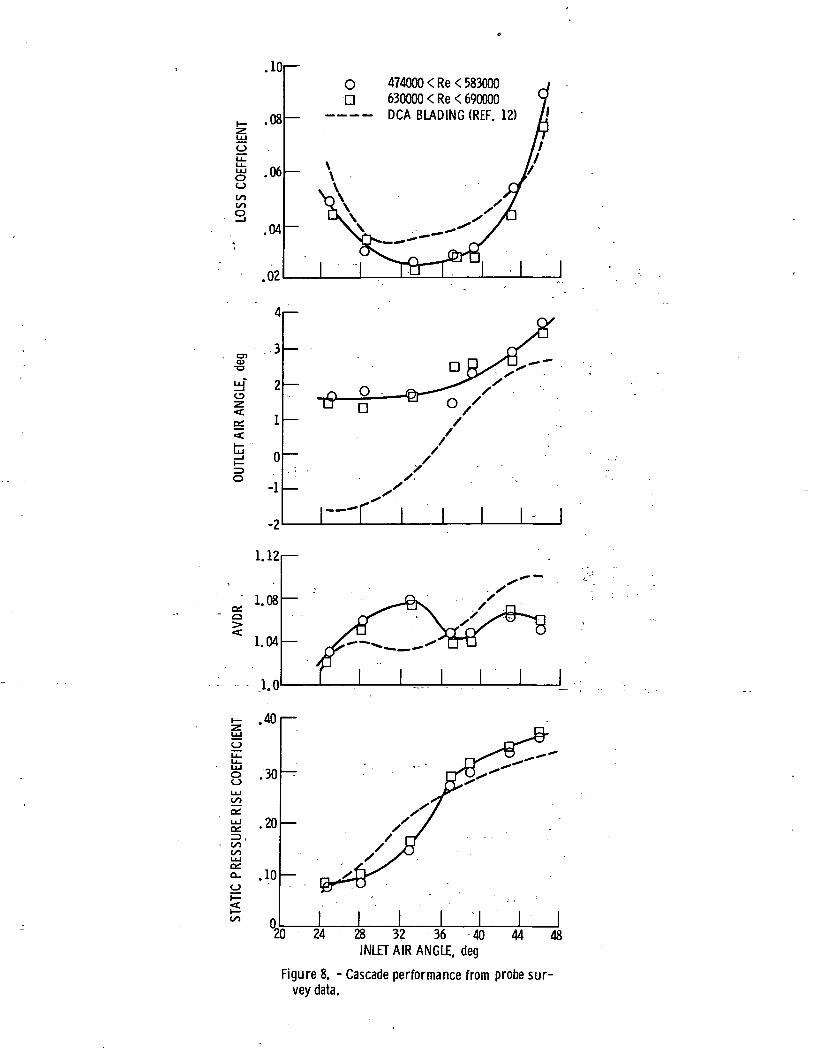
Overall performance. The results obtained for thecascade performance based on survey probe measurementsare shown in Fig. 8. Also shown for comparison arethe corresponding curves for data obtained by HimesU2) for the equivalent cascade of DCA blades. Somedifferences are noted. First, the loss coefficientfor the controlled diffusion blade was measured to beless than that for the DCA olade at the design point,and over the useful range of air inlet angle. Thedata for loss coefficient were well behaved and showedno discernible effect of Reynolds number, except(perhaps) at the nighest air inlet angles.
Tnere were measurable differences in behavior atair inlet angles less than design. The outlet airangle did not change significantly for the CD blade,and ranged from 1/2 to 3° greater than measured forthe DCA blade. Larger values of AVDR were also meas-ured, although at angles approaching and exceeding thedesign value, the AVDR was measured to be lower thanfor the DCA cascade.
The AVDR is largely a consequence of the behaviorof the end wall boundary layers in passing through thecascade, and the reason for the high value at 33 .inlet air angle is not clear. However, a much reducedstatic pressure rise was also registered, and this wasconfirmedjby; manometer readings of the distributionsof wall static pressures. In fact, the pressure riseacross the cascade dropped very abruptly with reducedair inlet angle, the drop being associated with thedetection of leading edge separation on the pressureside of the blade. Subsequent examination of all theinformation obtained in the tests-pointed to a need toobtain more information in the range of inlet flowangles between 30 and 36°.
Vortex Shedding. When testing at the three lowestair inlet angles, pure, highly audible tones were heardas the tunnel'was brought up to the required test con-ditions. The tones occurred at discrete settings ofthe plenum pressure, and the frequency increased (1080,1960, 2380, 2790, 3080 Hz) as the inlet velocity atwhich it occurred increased (approximately 30, 34.5,42, 48.5, 56 m/sec). Vortex shedding in the bluntblade wake was suspected when the Strouhal number basedon trailing edge thickness was found to be 0.17 (whentne tones occurred). An experiment was conducted toverify this explanation. The bluntness was removed bytaping metal shim-stock to produce sharp trailing edgeson all blades. The tones then did not occur. Theremoval of the shim-stock from one blade resulted inthe reoccurrence of tones, but very faintly.

Vortex shedding in turbomachinery blade wakes hasbeen observed or suspected in several turbomachineryresearch experiments (24 to ̂ 8). However, the occur-rence in the present case was particularly graphicDecause the frequencies were in the audible range and,despite the tunnel background noise level, some had theclarity of pure organ tones.
In high speed compressors and turbines, these reso-nant frequencies can be over 100 kHz and therefore toohigh to be detected by other than the highest responsetransducers (see Ref. 28, for example). The issue ofvortex shedding must be raised when attempting to obtaincomparisons of data with analyses which aim at the cor-rect modeling of the flow. Whether any special treat-ment of the trailing edge flow is required when vortexshedding occurs, compared to when it does not, requiresthat a more detailed study be conducted than was pos-sible in the present series of tests.
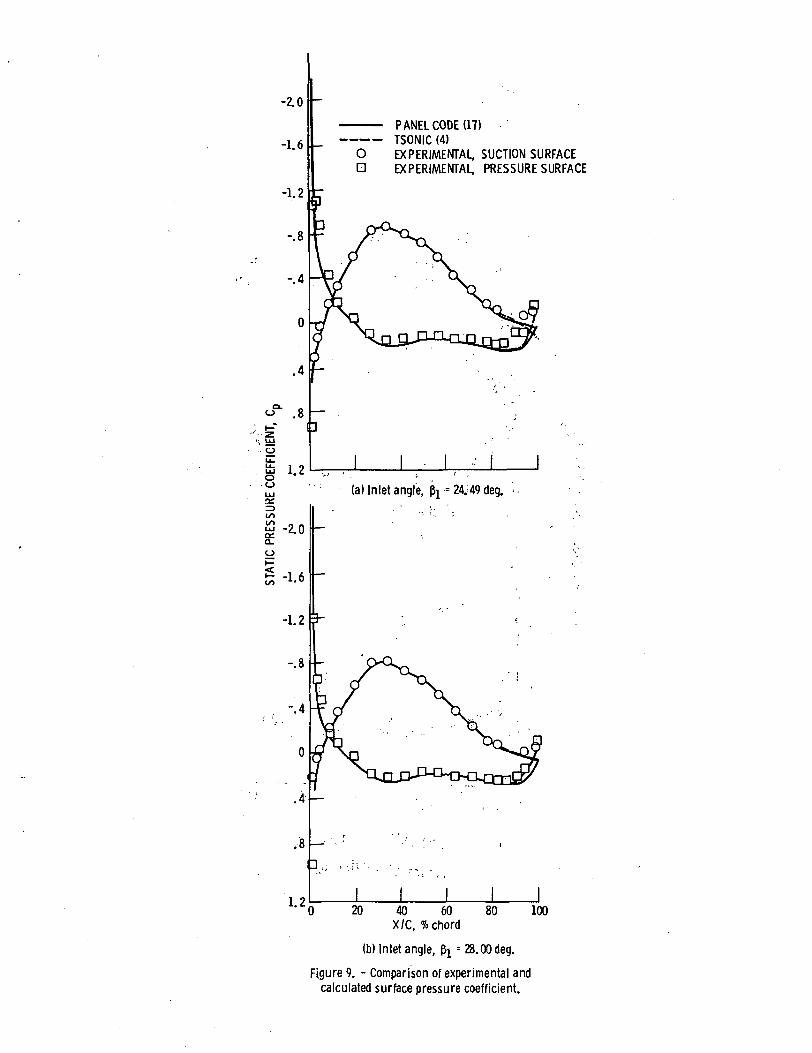
Comparison of Calculated and Experimental Results- Inviscid flow computations, presented as static
pressure coefficient versus percent of chord are com-pared with experiment in Fig. 9. The solid line repre-sents panel code calculations and the dashed linerepresents TSONIC results.
Tnere is very little difference between TSONIC andpanel code calculations, except in the trailing edgeregion. Even there, the differences are minor, and aredue to differences in the way each code models thetrailing edge. No inviscid code will calculate theflow accurately near the trailing edge of a blade rowbecause real, viscous effects are the most prominent intnat region. For blades with round trailing edges, andparticularly for the present case with a blade having arelatively large trailing edge diameter, the Kutta con-dition does not truly apply. Some artifice must beused, and code developers employ different methods.
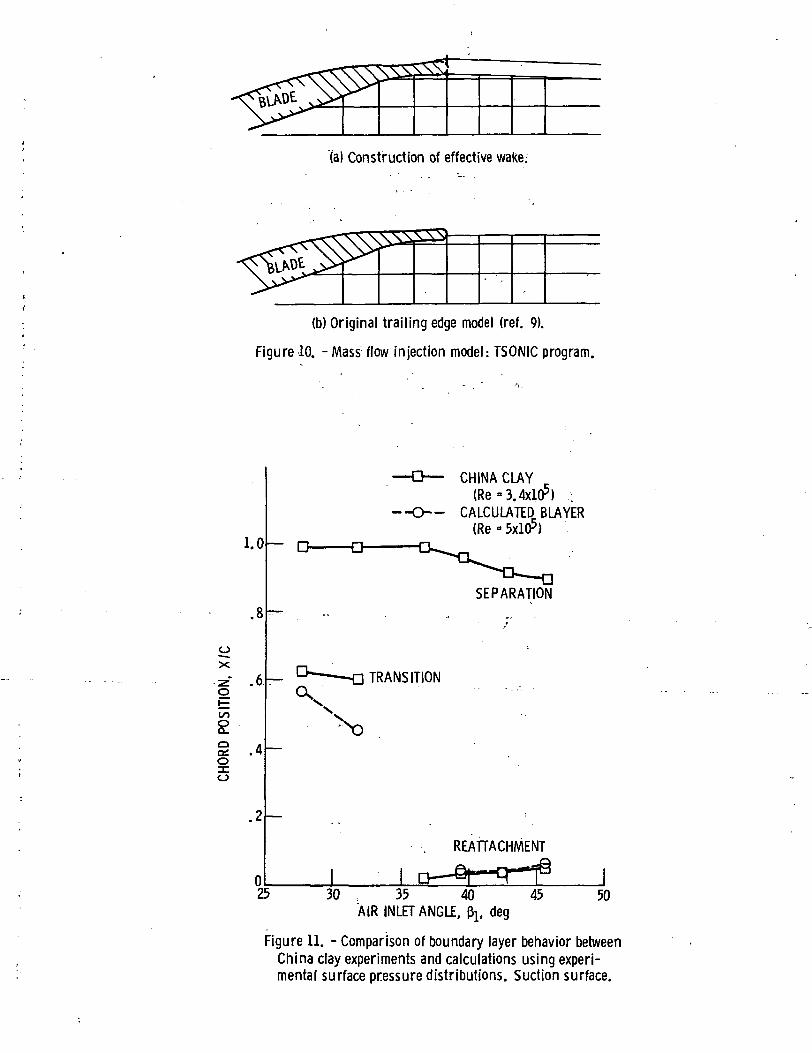
In TSONIC, Katsanis has used a mass injection orwake simulation model (!_) sketched in Fig. 10. Tangentsare formed at the intersection of the trailing edgecircle and the blade surface, and extended to the ver-tical line which forms a tangent with the trailing edgecircle (Fig. 10). The "wake" is then extended down-stream with an orientation determined by the downstreamwhirl boundary condition. Pressure is allowed to varyacross the simulated wake. This modelling removes thetrailing edge circle and the attendant accelerationsand decelerations associated with curvature. The usermay vary exit angle until "closure" of the pressuredistribution occurs at the trailing edge to simulate aKutta condition, or tne user may specify an exit angle(such as an experimentally measured angle) and acceptthe crossing of suction and pressure surface pressuresnear the trailing edge, as in the present calculations.
McFarland sets the downstream static pressure bycontinuity considerations. He then forces the surfacepressures on both surfaces to meet this pressure at thetrailing edge by an interpolation process involving thelast tnree panel elements on each surface. To achievesatisfactory results in the trailing edge region, itwas found necessary in these calculations to use all 98panel elements, and to pack points in the trailing edge(FTE set equal to 1.05).
Both methods are artificial. But inviscid flow, initself, is artificial, and comparisons w i l l always dif-fer from the real flow in regions where viscous effectsare strong.
Experimental measurements are generally in goodagreement witn both methods of calculation. Viscouseffects near the trailing edge begin to appear (as adivergence between calculation and measurement) at thedesign point (Betal = 38.91) and increase as incidenceincreases. Tne last pressure tap on each surface is in
a region of curvature and reflects the decreased pres-sure (increased velocity) there, particularly at lowerinlet angles where suction surface boundary layers arerelatively thin. Corresponding trailing edge accelera-tions do not appear in the calculations because thetrailing edge has been modeled to remove them.
Measured pressures compare very well with the cal-culations in the leading edge region. Because of meshlimitations, TSONIC did not pick up any leading edgeacceleration/decelerations upstream of 3 percent chord,and therefore was quite limited in boundary layer cal-culations. The panel code provided quite adequateresolution. A point of concern to code users has alwaysbeen tne calculated leading edge pressure spikes, andthey are evident here even at the design point (Betal =38.91). The excursions can be large and are mathematic-ally consistent. How much of such an excursion isactually felt by tne real flow will determine the natureof the boundary layer behavior. It appears from themeasured data that the flow does experience a largeproportion of the calculated leading edge velocity dif-fusion.
Two principal boundary layer calculations were made,one set using data from low Reynolds number tests tocompare against flow visualization experiments performedat low Reynolds number (340 000), and one set usingcalculated pressure distributions corresponding tohigher Reynolds number tests (670 000). Tne latterresults were used to calculate loss coefficient to com-pare against measured loss.
Cnina clay flow visualization experiments were runon the suction surface of the blade over the full rangeof incidence angles, but at a low Reynolds number to .accommodate drying times of the solvent. The resultsare presented in Fig. 11. The axial position at whichlaminar separation-turbulent reattachment, transition,and turbulent separation is plotted against the inletflow angle condition. The figure shows the existenceof a laminar boundary layer to about 60 percent of chordat the two lowest flow angles. As incidence angle wasincreased, an abrupt change occurred and a laminarseparation with turbulent reattachment was producedvery near the leading edge (2 to 5 percent chord) atall of the higher inlet angles.
The boundary layer calculations were made usingexperimental surface pressures as input, and resultsare also plotted on Fig. 11. In all cases, laminarseparation with turbulent reattachment was predicted,rather than pure transition. The calculated laminarseparation point is reasonably close to experiment forBetal = 28.00, but disagrees by about 15 percent chordat Betal = 32.87. The calculated trends appear to bemore valid because as incidence angle is increased, theadverse pressure gradient on the suction surface becomessteeper. Since laminar separation is strongly influ-enced by pressure gradient, earlier separation would beexpected at Betal = 32.87. At the higher inlet anglesthere is good agreement between experiment and calcula-tion. The adverse gradient near the leading edge isvery steep and produces almost immediate laminar separ-ation. Due to the magnitude of the adverse pressuregradient in most cases, and the Reynolds number levels,the laminar separation bubbles are presumed to be short.
The experimental static pressure distributionsalready reflect turbulent separation, i.e., reducedadverse pressure gradients in tne separated region nearthe trailing edge. Using these reduced gradients asinput to a boundary layer calculation is not likely toresult in prediction of turbulent separation, and didnot for these calculations. It should also be notedthat tne experimental turbulent separation^locationsshown in Fig. 11 for Betal = 28, 32 and 36° are-more

likely to be a localized drying phenomenon than aseparation.
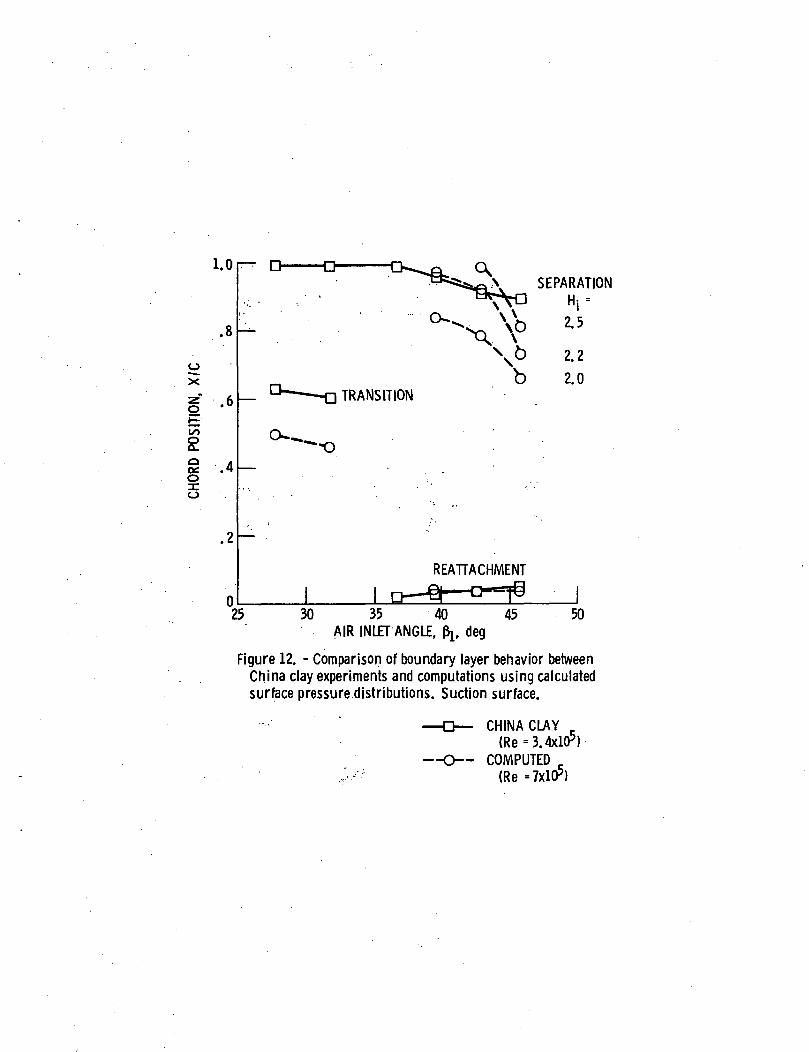
Boundary layer calculations on both surfaces wereconducted for the highest Reynolds number case over thefull range of incidence angles using calculated surfacepressures as input. The calculated laminar and turbulentseparation locations are shown on Fig. 12, using thechina clay results as reference. Predicted laminarseparation locations occur earlier for both Betal = 28and 32.87, but agree with china clay results at thehigner inlet angles. No turbulent separationis predicted for the two lowest inlet angles, but ispredicted for all inlet angles 38° and greater. Assum-ing separation to occur at critical incompressible formfactors of 2.0, 2.2, and 2.5, the corresponding loca-tions are plotted as percent chord in Fig. 12. Thebest correlation witn flow visualization data is givenby Hi = 2.2. For the steep adverse gradient at Betal= 45.96, a flow visualization separation location of90 percent chord does not appear consistent. The 73percent chord value, corresponding to Hi = 2.2 agreesbetter with the flattening of the pressure distributionshown in Fig. 9(f).
Total pressure loss coefficients were calculatedusing Stewart's method (23_), and are compared withexperimentally measured values in Fig. 13. Attemptingto calculate loss at off-design conditions using anintegral boundary layer method and a one-dimensionalloss model is a dubious enterprise. The calculationsobviously break down at the two extremes of inlet angle(solid line). But agreement is remarkably good at theother incidence angles. For cases in which turbulentseparation is predicted, the values of displacement andmomentum thickness corresponding to Hi = 2.2 wereassumed to .remain constant to the trailing edge of theDlade where the loss model was applied.
One notable point of disagreement is at the designinlet angle of 38.91. A recalculation of the boundarylayer beginning at about 4 percent of chord beginningwith a laminar boundary layer produces loss predictionsin agreement with measurements (dashed line, Fig. D).To accomplish this it would be necessary for the boun-dary layer to have relaminarized in the reaccelerationregion between 4 and 25 percent of chord (Fig. 9(d)).Although no evidence of this is evident fronuthe chinaclay experiments, this appears to be the only way themeasured loss values could be reconciled with computa-tions.
Tne boundary layer calculations for the lowest inletangle (24.49) were particularly troublesome on thepressure surface due to the excessively steep adversepressure gradient. Laminar separation followed by tur-bulent separation was predicted. The boundary layercalculations can be continued through modestly highform factors, and values of displacement and momentumthickness were obtained at the trailing edge. But,with such a steep pressure gradient, turbulent separa-tion would not be unexpected, and due to the muchrelaxed pressure gradient at 30 percent of chord, tur-bulent reattachment could be envisioned. Using thisspeculative approach, a loss coefficient comparable toexperimental measurements was achieved by reattachingthe turbulent boundary layer at 30 percent chord with adisplacement and momentum thickness equivalent to afourfold increase over values at predicted turbulentseparation (dashed line, Fig. 13). Using such methodsto predict loss at far off-design conditions is clearlyspeculative. More sophisticated modeling is requiredor, at least, an extensive data base is necessary topermit consistent empirical enhancement.
SUMMARY OF RESULTS
The mid-span section of a controlled diffusionstator was tested in a two-dimensional cascade.Measurements over a wide range of incidence angles wereobtained. A quite acceptable minimum loss coefficientlevel of 0.0241 was measured, a value lower than thanmeasured on the reference double circular arc blade.Operating range was slightly better than for the OCAblade.
Measurements of surface pressure compare wellagainst results computed by the TSONIC and panel codesover tne full incidence angle range. Integral boundarylayer calculations using the McNally code showed gen-erally good agreement with flow visualization data whenmeasured surface pressures were used as input. Whencomputed inviscid surface pressures were used as input,laminar separation was predicted with less accuracy.Correlations between computed boundary layers and flowvisualization data produced a critical incompressibleform factor value for turbulent separation of 2.2 forthis set of data. Loss calculations using the Stewartloss model provided remarkably good agreement except,as expected, at the extremes of the incidence anglerange.
ACKNOWLEDGMENTS
The authors would like to acknowledge the assistanceof Eric McFarland for his aid with the panel code, andAllan McGuire of The Naval Postgraduate School for hisefforts in obtaining the china clay and other data.The experimental program was funded by NASA LewisResearch Center, and partially by Naval Air SystemsCommand, Code 310E.
REFERENCES
1. Sanger, N.L., "The Use of Optimization Techniquesto Design Controlled-Diffusion Compressor Blading,"Journal of Engineering for Power, Vol. 105,April 1983, pp 256-264.
2. Urasek,. D.C., Gorrell, W.T., and Cunnan, W.S.,"Performance of Two-Stage Fan Having Low-Aspect-Ratio, First Stage Rotor Blading," NASA TP-1493,Aug. 1979.
3. Crouse, J.E., and Gorrell, W.T., "Computer Programfor Aerodynamic and Blading Design for MultistageAxial-Flow Compressors," NASA TP-1946, Dec. 1981.
4. Katsanis, T., "Fortran Program for CalculatingTransonic Velocities on a Blade-to-BTade StreamSurface of a Turbomachine," NASA TN D-5427, 1969.
5. McNally, W.O., "Fortran Program for CalculatingCompressible Laminar and Turbulent Boundary Layersin Arbitrary Pressure Gradients," NASA TN D-5681,1970.
6. Vanderplaats, G.N., "CONMIN a Fortran Program forConstrained Function Minimization, User's Manual,"NASA TM X-62282, 1973.
7. Vanderplaats, G.N., "COPES a Fortran ControlProgram for Engineering Synthesis," NavalPostgraduate School, 1980.
8. Moebius, R.C., "Analysis and Testing to Improve theFlow from the Plenum of a Subsonic Cascade WindTunnel," M.S. thesis Naval Postgraduate School,.Monterey, CA, 1980.
9. Duval, David A., "Evaluation of a Subsonic CascadeWind Tunnel for Compressor Blade Testing," M.S.thesis, Naval Postgraduate School, Monterey, CA,1980.

10. Cina, Frank S., "Subsonic Cascade Wind Tunnel Tests 21.Using a Compressor Configuration of OCA Blades,"M.S. thesis, Naval Postgraduate School, Monterey,CA, 1981.
11. Molloy, William 0., "Preliminary Measurements and 22.Code Calculations of Flow Through a Cascade of OCABlading at a Solidity of 1.67," M.S. thesis, NavalPostgraduate School, Monterey, CA, 1982.
12. Himes, Stephen J., "Report of Tests of a Compressor 23.Configuration of OCA Blading," M.S. thesis, NavalPostgraduate School, Monterey, CA, 1983.
13. McGuire, Alan G., "Determination of Boundary LayerTransition and Separation on Compressor Blades in aLarge Subsonic Cascade," M.S. 'thesis, Naval 24.Postgraduate School, Monterey, CA.1983.
14. Koyuncu, Y., "Report of Tests of a CompressorConfiguration of CD Blading," M.S. thesis, NavalPostgraduate School, Monterey, CA, 1984. 25.
15. Zebner, H., "Procedure and Computer Program forApproximation of Data (With Application to MultipleSensor Probes)," Naval Postgraduate SchoolContractor Report, NPS67-80-001CR, Monterey, CA,1980.
16. Neuhoff, F., "Computer Software for the Calibration 26.of Pneumatic and Temperature Probes," NavalPostgraduate School, Turbopropulsion LaboratoryTechnical Note 82-03, Monterey, CA, 1982.
17. McFarland, E.R., "A Rapid Blade-To-Blade Solution 27.for Use in Turbomachinery Design," J. of Engineeringfor Gas Turbines and Power, vol. 106, No. 2,April 1984, pp. 376-382.
18. Cohen, C.B., and Reshotko, E., "The CompressibleLaminar Boundary Layer With Heat Transfer and 28.Arbitrary Pressure Gradient," NACA TR-1294, 1956.
19. Scnlichting, H., "Origin of Turbulence II,"Boundary Layer Theory, 7th ed., McGraw-Hill, NewYork, 1979,pp 489-554.
20. Sasman, P.K., and Cresci, R. J., "CompressibleTurbulent Boundary Layer with Pressure Gradient andHeat Transfer," AIAA Journal, Vol. 4, No. 1,Jan. 1966, pp. 19-25.
Preston, J.H., "The Minimum Reynolds Number for aTurbulent Boundary Layer and the Selection of aTransition Device," J. of Fluid Mechanics, Vol. 4,No. 1, Jan 1958, pp. 373-384.Von Doenhoff, A.E., and Tetervin, N._, "Determina-tion of General Relations for the Behavior ofTurbulent Boundary Layers," NACA Wartime ReportL-382, 1943.Stewart, W.L., "Analysis of.Two-DimensionalCompressible-Flow Loss Characteristics Downstreamof Turbomachine Blade Rows in Terms of BasicBoundary-Layer Characteristics," NACA TN 3515,July 1955.Heinemann, H.J. and Butefiscn, K. A., "Determinationof the Vortex Shedding Frequency of Cascades withDifferent Trailing Edge Thicknesses," AGARD-CP277,1977. . - . - _ .Heinemann, H.J., Lawaczeck, 6. and Butefisch,K. A., "von Karman Vortices and Their FrequencyDetermination in the Wakes of Profiles in the Sub-and Transonic Regimes," IUTAM Symposium TransonicumII, Springer Verlag, Berlin/Heidelberg/New York,pp. 75-82, 1976.Ng, W.F., and Epstein, A.H., "Unsteady Losses inTransonic Compressors," J. of Engineering for GasTurbines and Power, Vol. 107, April 1985,pp. 345-353.Hathaway, M.D., Gerts, J., Epstein, A. andStrazisar, A.J., "Rotor Wake Characteristics of aTransonic Axial Flow Fan," AIAA-85-1133, presentedat the AIAA/SAE/ASME/ASEF 21st Joint PropulsionConference, Monterey, CA, July 8-10, 1985.Neuhoff, F., Shreeve, R.P., and Fottner, L.,"Evaluation of the Blade-to-Blade Flow from a HighSpeed Compressor Rotor," Paper submitted forpresentation at the 31st ASME International GasTurbine Conference, Dusseldorf, June 1986.
TABLE I - BLADE AND CASCADE GEOMETRY
Camber, deg *1.09Max thickness, percent chord 1.0Leading edge radius, percent chord 0.9Trailing edge radius, percent chord 1.26Solidity . . . 1.67Stagger angle, deg 14.27Cascade aspect ratio 2.0Chord, cm 12.7Blade Spacing, cm 7.62

TABLE III - MEASUREMENT UNCERTAINTY
Measurement
Probe position
Flow angle (B-|)(B2)
PressuresPlenumWall staticBlade surfaceProbe
Flow fieldStagnation pressureStatic pressureVelocity
Method
Linear potentiometer
Angle potentiometerAngle potentiometer
Scanlvalve & transducerScanlvalve & transducerScanlvalve & transducerScanlvalve & transducer
Calibrated probe
Uncertainty
±0.02 cm
±.2 deg±.5 deg
±.05 cm water±.05 cm water+.05 cm water±.05 cm water
±.05 cm water±.2 cm water±.5 percent

Figure 1. - Cascade wind tunnel test facility.
STATIC PORTS -^\
\ 41.28 cm
LOWER WALL-^. \ADJUSTABLE
PWu
ADJUSTABLE UPPER WALLS ->
hUPPER TRAVERSE
PILOT-STATIC PROBE
LOWER TRAVERSE
LOWER WALLSTATIC PORT
PLENUM TOTAL PRESSURE TUBE
Figure 2. -Test section instrumentation and physical dimensions.
ORIGINAL PAGE ISPOOR QUAUTY
Figure 3. - Cascade test section with front wall removed.
Figure 4 - View of test blading through plexiglas window.

7.62 cm
Figures. - Cascade geometry.

Q_IUJQ£
Q_
UJO£.
O
.4
.3
.2
.1
0)•o
evicQ.
Q_I
Of.o
T3
r—ICO.
.8
.7
.6
.5
-2
-3
-4
-5
.2
.1
0
1.0
.9
.8
.7
-35
-40
110 -5
t
10
SPAN, cm5 1
Figure 6. - Measured inlet and outlet flow fieldin the spanwise direction at design inlet angle.
CM
O_
Ct!.
cn
.3
^ .2Lul
° .1
0
.8to .7^ .6
.5
-1
-2
-3
-4
.2Q_I
Re
a 6.8x10?o 5.3 xlO5
cnO)
CO.
.9
.8
.7
-35
-40
-45-25 -20 -15 -10 -5 0 5
BLADE-TO-BLADE DIRECTION, cm10 r 15
Figure 7. - Measured cascade inlet and outlet flow fieldin blade-to-blade direction at design inlet angle. :
.10
ootoi/>o
.06
.04
.02
OD
474000 < Re < 583000630000 < Re < 690000DCA BLADING (REF. 12)
O
.3
2
1
0
-1
-2
1.12
1.08
1.04
1.0
.40
8 -30
£ .20to'toLU
£ .10o
i—r
20 24 28 32 36 40 44 48INLET AIR ANGLE, deg
Figure 8. - Cascade performance from probe sur-vey data.
-2.0 -
-1.6
-1.2
-.8
-.4
0
.4
.8
o
.4
1.2
PANEL CODE (17)TSONICI4)EXPERIMENTAL, SUCTION SURFACEEXPERIMENTAL, PRESSURE SURFACE
u_u_0oUJa;••̂
I/)t/1LU
8:o^~rfP(/>
1 9 1 1 1 ' 1 1A. C. .,, -•• .
(a) Inlet angle, Pj = 24J49 deg. -
-2.0
-1.6
-1.2
-.8
—
—
>'O^2L
1 I20 40 60 80 100
X/C, % chord
(b) Inlet angle, fy =28.00deg.
Figure 9. - Comparison of experimental andcalculated surface pressure coefficient.

- PANEL CODE (17)— TSONIC(4)
EXPERIMENTAL, SUCTION SURFACEEXPERIMENTAL, PRESSURE SURFACE
Ll_U_LUO
LLJDi
LOLU
Q_
0
.4
-1.2
- .8
(c) Inlet angle, Pj =32.95deg.
T /^
20 40 60 80X/C, % chord
100
(d) Inlet angle, fy =38.91deg.
Figure 9. - Continued.

PANEL CODE (17)TSONIC (4)EXPERIMENTAL, SUCTION SURFACEEXPERIMENTAL, PRESSURE SURFACE
20 40 60 80• X / C , % chord
(fhnlet angle, ^ = 45.96deg.
Figure9. -Concluded.
100
(a) Construction of effective wake;
(b) Original trailing edge model (ref. 9).
Figure 10. - Mass flow injection model: TSONIC program.
ox
2oCtLO
1.0
.8
CHINA CLAY
—O— CALCULATED BLAYER(Re • 5xl(P)
SEPARATION
TRANSITION
REATTACHMENT
25 30 ; 35 40AIR INLET ANGLE, &. deg
45 50
Figure 11. - Comparison of boundary layer behavior betweenChina clay experiments and calculations using experi-mental surface pressure distributions. Suction surface.
oX
CO2O£O
o
1.0
•8
.6
.4
CkSEPARATION
2.5
2.2
2.0TRANSITION
REATTACHMENT
25 30 35 40 45AIR INLET ANGLE, ft, deg
50
Figure 12. - Comparison of boundary layer behavior betweenChina clay experiments and computations using calculatedsurface pressure distributions. Suction surface.
—D— CHINA CLAY(Re=3.4xl05)
—O— COMPUTED,>5 (Re -TxlO5)

ooi/>too
.06
.04
.02
O EXPERIMENTALCALCULATED LOSSCALCULATED (SEE TEXT)
O
30 . „. 40INLET ANGLE,
:50
Figure 13. - Calculated loss (Stew-art's model)compared wjth exper-imental measurements.
1. Report No.
NASA TM-87167
2. Government Accession No. 3. Recipient's Catalog No.
4. Title and Subtitle 5. Report Date
Comparison of Calculated and Experimental CascadePerformance for Controlled-D1ffus1on CompressorStator Bladlng
6. Performing Organization Code
505-62-21
7. Author(s)
Nelson L. Sanger and Raymond P. Shreeve8. Performing Organization Report No.
E-2805
10. Work Unit No.
9. Performing Organization Name and Address
National Aeronautics and Space AdministrationLewis Research CenterCleveland, Ohio 44135
11. Contract or Grant No.
12. Sponsoring Agency Name and Address
National Aeronautics and Space AdministrationWashington, D.C. 20546
13. Type of Report and Period Covered
Technical Memorandum
14. Sponsoring Agency Code
15. Supplementary Notes
Prepared for the International Gas Turbine Conference and Exhibit sponsored bythe American Society of Mechanical Engineers, Ousseldorf, West Germany,June 8-12, 1986. Nelson L. Sanger, NASA Lewis Research Center; Raymond P.Shreeve, Naval Postgraduate School, Monterey, California.
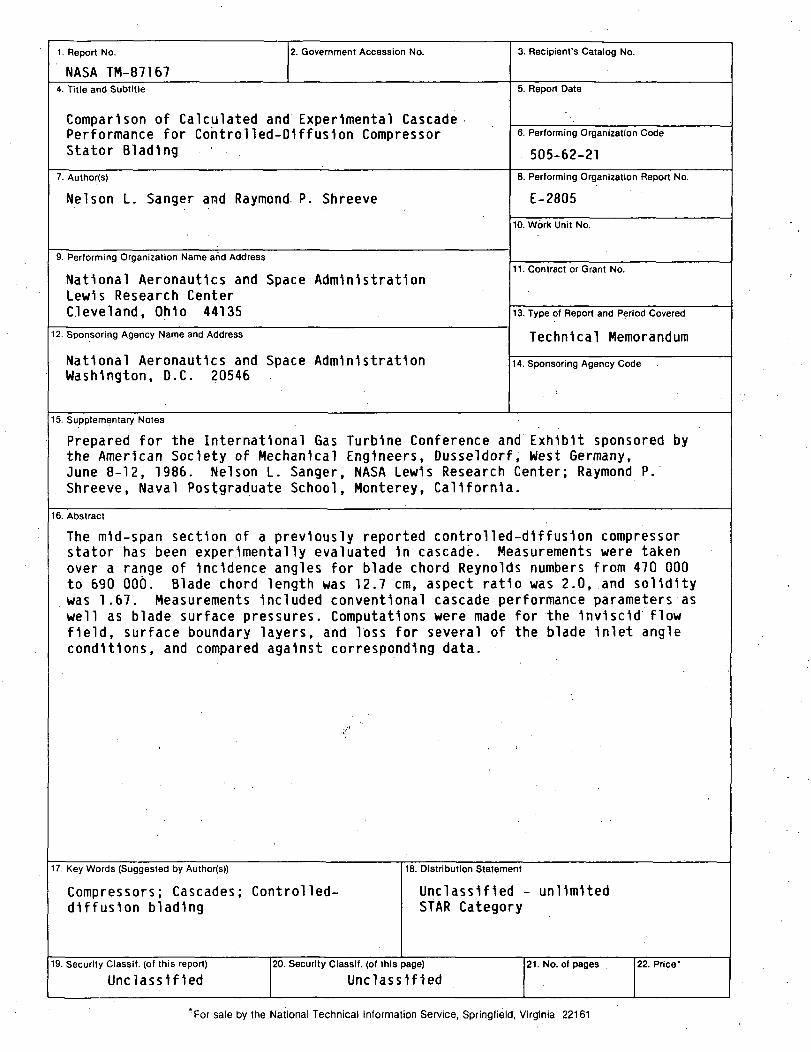
16. Abstract
The mid-span section of a previously reported controlled-dlffuslon compressorstator has been experimentally evaluated 1n cascade. Measurements were takenover a range of Incidence angles for blade chord Reynolds numbers from 470 000to 690 000. Blade chord length was 12.7 cm, aspect ratio was 2.0, and soliditywas 1.67. Measurements Included conventional cascade performance parameters aswell as blade surface pressures. Computations were made for the 1nv1sc1d flowfield, surface boundary layers, and Toss for several of the blade Inlet angleconditions, and compared against corresponding data.
17. Key Words (Suggested by Author(s))
Compressors; Cascades; Controlled-dlffuslon bladlng
18. Distribution Statement
Unclassified - unlimitedSTAR Category
19. Security Classif. (of this report)
Unclassified20. Security Classif. (of this page)
Unclassified21. No. of pages 22. Price*
*For sale by the National Technical Information Service, Springfield, Virginia 22161

National Aeronautics andSpace Administration
Lewis Research CenterCleveland. Ohio 44135
Official BusinessPenalty for Private Use $300
SECOND CLASS MAIL
ADDRESS CORRECTION REQUESTED
Postage and Fees PaidNational Aeronautics andSpace AdministrationNASA-451
1WNSA