comparison of aortic valve area obtained by …dspace.sctimst.ac.in/jspui/bitstream/123456789... ·...
TRANSCRIPT
COMPARISON OF AORTIC VALVE AREA OBTAINED BY CONTINUITY EQUATION AND PLANIMETRY USING
INTRAOPERATIVE 2 DIMENSIONAL AND 3 DIMENSIONAL ECHOCARDIOGRAPHY IN AORTIC STENOSIS.
Thesis submitted for the partial fulfilment for the requirement of the Degree of DM (Cardiothoracic and Vascular Anaesthesia)
BY
DR PRASHANTH P BHASKAR
DM CARDIOTHORACIC AND VASCULAR ANAESTHESIA RESIDENT
2016 – 2018
DEPARTMENT OF CARDIAC ANAESTHESIOLOGY
SREE CHITRA TIRUNAL INSTITUTE FOR MEDICAL SCIENCES AND TECHNOLOGY, THIRUVANANTHAPURAM,
KERALA
INDIA - 695011

DECLARATION
I hereby declare that this thesis titled, “COMPARISON OF AORTIC
VALVE AREA OBTAINED BY CONTINUITY EQUATION AND
PLANIMETRY USING INTRAOPERATIVE 2 DIMENSIONAL AND 3
DIMENSIONAL ECHOCARDIOGRAPHY IN AORTIC STENOSIS” has been
prepared by me under the capable supervision and guidance of Dr. Rupa Sreedhar, Professor and Head of the Department, Division of Cardiothoracic and Vascular
Anesthesiology (CVTA), Sree Chitra Tirunal Institute for Medical Sciences &
Technology (SCTIMST), Thiruvananthapuram, Kerala.
Date:
Place: Thiruvananthapuram
Dr. Prashanth P Bhaskar
DM Cardiothoracic and Vascular
Anesthesiology Resident,
Department of Anesthesiology,
SCTIMST, Thiruvananthapuram
CERTIFICATE
This is to certify that the thesis titled, “COMPARISON OF AORTIC
VALVE AREA OBTAINED BY CONTINUITY EQUATION AND
PLANIMETRY USING INTRAOPERATIVE 2 DIMENSIONAL AND 3
DIMENSIONAL ECHOCARDIOGRAPHY IN AORTIC STENOSIS” has been
prepared by Dr. Prashanth P Bhaskar, DM Cardiothoracic and Vascular
Anesthesiology Resident, Division of Cardiothoracic and Vascular Anesthesiology, at
Sree Chitra Tirunal Institute for Medical Sciences & Technology,
Thiruvananthapuram. He has shown keen interest in preparing this project.
GUIDE: CO GUIDE:
Dr Rupa Sreedhar Dr Shrinivas Gadhinglajkar
Professor of CVTA, Professor of CVTA,
SCTIMST, Thiruvananthapuram. SCTIMST, Thiruvananthapuram.
CERTIFICATE
This is to certify that this thesis titled, “COMPARISON OF AORTIC
VALVE AREA OBTAINED BY CONTINUITY EQUATION AND
PLANIMETRY USING INTRAOPERATIVE 2 DIMENSIONAL AND 3
DIMENSIONAL ECHOCARDIOGRAPHY IN AORTIC STENOSIS.” has been
prepared by Dr. Prashanth P Bhaskar, DM Cardiothoracic and Vascular
Anaesthesiology Resident, Division of Cardiothoracic and Vascular Anaesthesiology,
at Sree Chitra Tirunal Institute for Medical Sciences & Technology,
Thiruvananthapuram. He has shown keen interest in preparing this project.
Place: Thiruvananthapuram
Date :
Dr Rupa Sreedhar
Professor and Head of the Department of Anaesthesia (HOD) and Division of Cardiothoracic & Vascular Anesthesiology,
SCTIMST, Thiruvananthapuram
ACKNOWLEDGEMENTS
I express my heartfelt praises and thanks to God for his shower of blessings
throughout my research work. It is with gratitude that I submit this dissertation to the
Almighty. I take this opportunity to thank all those who have contributed in many ways
towards the completion of this thesis.
First and foremost, I would like to express my deep sense of gratitude to my guide
Dr. Rupa Sreedhar, Professor and HOD Cardiac Anaesthesiology, SCIMST who framed
the idea of this project and was a great source of inspiration and tirelessly guided me
throughout this herculean effort. She is an academician and clinician par excellence who
never fail to inspire students associated with her. I am truly honoured to have her as my
guide and I have no words to express my sincere thanks and gratitude.
It gives me immense pleasure on this occasion to thank Dr. Shrinivas G for his
assistance during all the stages of my study. He always found time to clarify my doubts
and gave valuable insights related to this project.
I offer my sincere acknowledgement and gratitude to Dr Thomas Koshy, Dr P K
Dash, Dr Suneel, Dr Unnikrishnan K P, Dr Subin Sukesan and Dr Saravana Babu,
Division of Cardiothoracic and Vascular Anaesthesia, for creating a congenial atmosphere
at the workplace to enable me to complete this thesis by providing me all the requisite
infrastructure of the Institute.
I am also deeply indebted to all faculty members of the department who constantly
supported and encouraged me during the past 3 years.
I am thankful to my fellow residents for their constant help and support
throughout the study.
I am also deeply thankful to the statistician, Mr Jayakumar who helped out to
carry the statistical analysis for my project.
I express my gratitude and sincere thanks to all the patients, who willingly agreed
to be a part of the study.

I would be failing in my duty if I did not thank my parents and in-laws for their
love, care and encouragement which cannot be defined in words. My parents remained as
my constant motivation and backed all my crucial decisions, without which I would not be
who I am today.
My wife, Dr Nivedita was the person who inspired me to pursue the DM course.
She stood with me whenever I needed her. Above everything, I am proud of my better half
seeing the way she cares, nourishes and loves our “bundle of joy”. My love for her cannot be
defined in words.
Dr Prashanth P Bhaskar
CONTENTS
Page No
INTRODUCTION 1
REVIEW OF LITERATURE 4
AIMS AND OBJECTIVES 21
MATERIALS AND METHODS 23
STATSITICAL ANALYSIS 35
RESULTS 37
DISCUSSION 56
CONCLUSION 64
BIBLIOGRAPHY 67
ANNEXURES 78
Abbreviations
Observation Chart
Patient information sheet & consent form
TAC clearance form
IEC clearance form
Plagiarism Report
Master Chart

Introduction
1
INTRODUCTION
Introduction
2
INTRODUCTION
Severe Aortic Stenosis (AS) is defined as a valve area less than 1.0 cm2 or
mean aortic pressure gradient more than 40 mm Hg.1 However, there are often
discrepancies between planimetry, continuity equation-based aortic valve areas
(AVA). The accuracy of AVA measured using the continuity equation depends
primarily on the precise measurement of the left ventricular outflow tract (LVOT) 2.
Until now, the LVOT area has been calculated as, π (LVOT dimension /2)2, assuming
that LVOT has a circular shape. However, LVOT could actually be elliptical. 3, 4.
The hemodynamic calculations in echocardiography frequently involves
measurement of LVOT stroke volume. The shape of LVOT is presumed to be circular
for the estimation of cross sectional area. However, many recent studies based on 3D
echocardiography have demonstrated that the LVOT shape may be elliptical (other
than circular) on many occasions6, 7. Because of the differences observed on 2D and
3D echocardiography, the LVOT area –based hemodynamic calculations differ
between the modalities. One such example would be the calculation of aortic valve
area in patients with aortic stenosis using continuity equation. In cases of patients with
coronary artery disease (CAD) and moderate to severe AS, these differences may
affect intraoperative clinical decision making (Coronary artery bypass grafting
(CABG) + AVR or CABG alone).
Computed tomography (CT) and magnetic resonance imaging (MRI) of the
aortic root have established that the shape of LVOT may be circular or elliptical [4,5,9-
13].Studies involving 3D Trans Esophageal Echocardiography(TEE) imaging of aortic
root have reported that the LVOT may be elliptical in shape having major and minor
Introduction
3
axes, rather than being circular in shape as has been presumed conventionally[6,7,].The
3D data allow the generation of an en-face view of the LVOT without any geometric
assumptions to delineate the exact contour of LVOT from which the precise Cross
Sectional Area(CSA) may be derived . Planimetry of an en-face view may yield a
relatively larger LVOT area than estimations based on measurement of minor axis
with 2D echocardiography 7. Hence, 2D echocardiographic measurements result in
smallest LVOT area8, which in turn may overestimate the severity of AS when AVA
is measured by continuity equation14, 15.
Aortic Valve Replacement (AVR) is reasonable for patients with moderate AS
who are undergoing other cardiac surgery (II a Class of recommendation) 16. Hence,
accurate estimation of AVA is necessary to take decision regarding the requirement
for combined surgery.
The purpose of this intraoperative study is to compare the aortic valve area
and LVOT geometry assessed by two dimensional (2D) and three-dimensional (3D)
transesophageal echocardiography (TEE) and its impact on evaluating severity of AS.
Review of Literature
4
REVIEW OF LITERATURE
Review of Literature
5
REVIEW OF LITERATURE
NECESSITY FOR ACCUARTE MEASUREMENT OF AVA
Degenerative aortic stenosis (AS) is one of the most common
valvular heart diseases in the elderly population requiring valve
replacement.17, 18 The indication for surgery is based on symptoms and the
severity of AS.1 The severity of AS can be assessed by calculating the
valve orifice using catheter-based invasive measurements or
echocardiography. Transthoracic echocardiography is the currently most
used tool as the standard for AS quantification based on the determination
of flow-dependent variables and the effective aortic valve area (AVA).
Quantification of AS should include measurement by both techniques.
The symptomatic status of the patient is also crucial in assessing the
necessity for valve surgery. The evaluation of LVOT area with 3D-TEE
would be of great importance, especially when patients with AS who
have discrepancy regarding the severity of AS assessed using different
methods - mean pressure gradient, continuity equation-based AVA, and
planimetry based AVA. The patients classified as severe aortic stenosis
using 2-dimensional continuity equation-based methods or planimetry
could actually be reclassified into moderate AS by 3D-TEE. Hence, the
correct assessment of the severity of AS using 3D-TEE might result in

Review of Literature
6
fewer patients being erroneously diagnosed as having severe AS and thus
avoiding unnecessary operations or procedures.8 HISTORICAL PERSPECTIVE
The severity of AS was originally established by measurements
obtained from cardiac catheterization and clinical outcomes based on
these measurements.19-23 Aortic valve area (AVA) was calculated by
Gorlin’s formula (AVA=cardiac output / heart rate× systolic ejection
period ×44.3 × square root of mean gradient). Severe AS was defined by
AVA <0.75 cm2, based on the observation that significant hemodynamic
changes occurred when the aortic orifice was less than one-quarter of its
normal size.24 In a study by Braunwald et al, it was found that AS patients
with a mean gradient (MG) greater than 50 mm Hg had poor outcomes,
and this MG value was considered highly specific in identifying severe
AS.25 Rapaport et al. demonstrated that outcomes were poorer when the
AVA was less than 1 cm2 than when it was more than 1 cm2.26
The measurements for AS severity were extended to
echocardiography with the assumption that AVA measured by Doppler
and catheterization were equivalent. In general, simultaneously
performed cardiac catheterization and echo techniques show a good
correlation in AVA measurement.27-29 AVA measured by catheterization
tends to be slightly larger than the Doppler-measured AVA.30-33
Review of Literature
7
ECHOCARDIOGRAPHIC VALVULAR MEASUREMENTS AND
POTENTIAL LIMITATIONS
Echocardiography identifies aortic valve (AV) anatomy including
bicuspid valves, rheumatic valvular disease, and degenerative
sclerotic/calcified aortic valves (AVs). The presence of restricted valve
mobility and the degree of calcification correlate with the severity of AS.
These findings may be obvious in M-mode as well as in two-dimensional
(2D) echo. The valve area can be directly measured by planimetry of the
cross-sectional area (CSA) in either transthoracic echocardiography
(TTE) in the parasternal short-axis, or transesophageal (TEE) in mid-
esophageal short-axis views. However, planimetry methods have
limitations. Proper measurements require the cross-sectional plane to be
perpendicular to the vertical axis of the LVOT at the level of the valve
tips during midsystole.34
Compared to TTE, TEE provides improved image quality due to close
proximity of esophagus and cardiac structures including aortic valve.
Also, unlike TTE there is no hindrance due to lung or bony interface
between probe and cardiac structures.
Review of Literature
8
In a number of cases, if the valve is heavily calcified, the valve
orifice may not be easily measurable. The degree of stenosis is most
commonly assessed by Doppler techniques. If the Doppler-based
hemodynamic assessment does not correlate with the anatomic findings,
the reasons for discrepancy should be determined. The major potential
technical sources of errors in echo/Doppler techniques include errors in
measurements of LVOT diameter, LVOT VTI, and peak velocity across
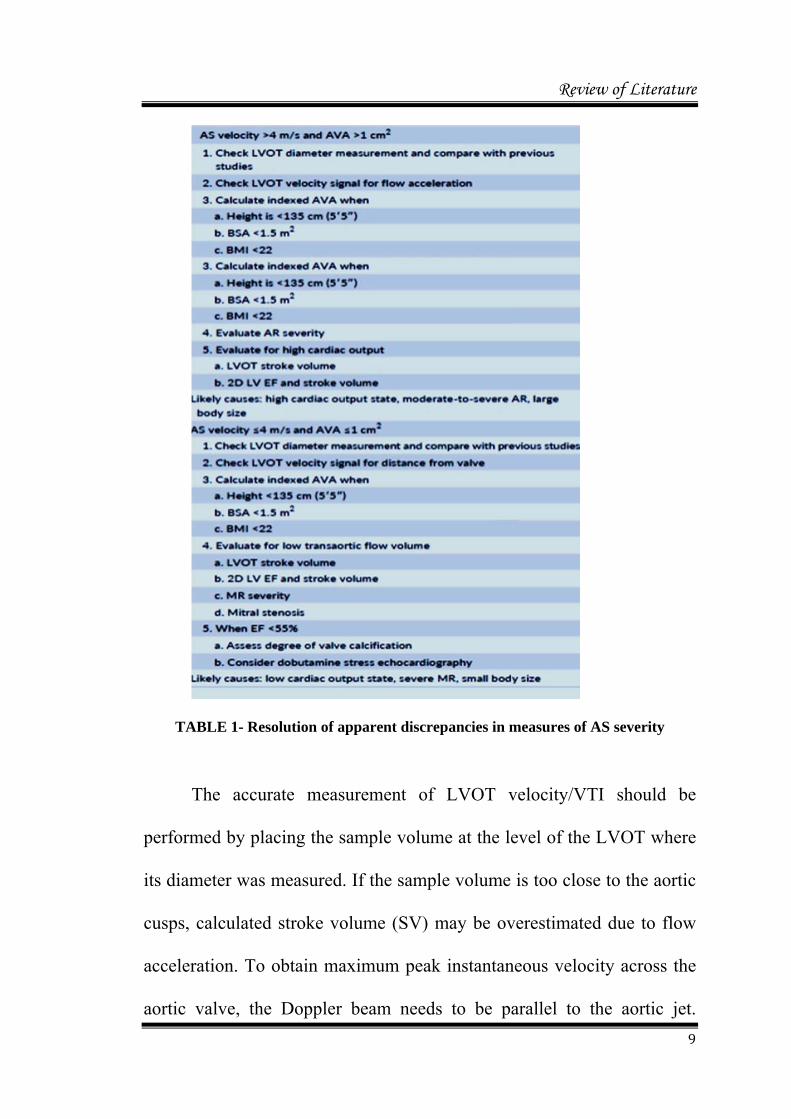
the AV. (Table 1). An accurate measurement of LVOT is crucial in
assessing AVA by the continuity equation and is the most common
source of error in AVA calculation by 2D.2 LVOT diameter should be
measured at 0.5–1 cm proximal to the lowest hinge point of the aortic
cusps. Any errors in LVOT measurement will be squared in the
continuity equation, and underestimation of the LVOT will result in a
smaller AVA.35-37
Review of Literature
9
TABLE 1- Resolution of apparent discrepancies in measures of AS severity
The accurate measurement of LVOT velocity/VTI should be
performed by placing the sample volume at the level of the LVOT where
its diameter was measured. If the sample volume is too close to the aortic
cusps, calculated stroke volume (SV) may be overestimated due to flow
acceleration. To obtain maximum peak instantaneous velocity across the
aortic valve, the Doppler beam needs to be parallel to the aortic jet.
Review of Literature
10
Contamination of continuous-wave Doppler signal from mitral
regurgitation jet may overestimate the severity of AS. Any increase in
angulation between the Doppler beam and the aortic jet will result in an
underestimation of the jet velocity. When using TTE, the velocity
measurements obtained from at least three different views (apical, right
parasternal, and suprasternal) are recommended to obtain the highest peak
velocity for AS.
Continuity Equation (CE) is a physiological method for valve area
estimation based on the law of conservation in hydrodynamics. It is valid
in a pulsatile chamber such as heart where the flow is equal through a
stenotic valve as well as the left or right outflow tract in a single cardiac
cycle. The method was initially used by Skjaerpe et al 27 in 1985 to
quantify aortic valve area in cohorts with combined Aortic Stenosis (AS)
and Aortic Regurgitation (AR). They tested its reliability in comparison
to Gorlin’s formula.
The AVA obtained using the continuity equation represents the
physiologic effective orifice area (EOA), where the blood flow
accelerates and forms the vena contracta. AVA derived from planimetry
represents geometric orifice area (GOA). Generally, GOA is always
greater than EOA. In the normal aortic valves, the flow jet forming vena
contracta occurs adjacent, and downstream to GOA.38 The ratio of EOA
Review of Literature
11
and GOA is known as the contraction coefficient. The contraction
coefficient depends on the three-dimensional shape of the valve leaflets,
and it is significantly lower for flat valves compared to doming valves.39
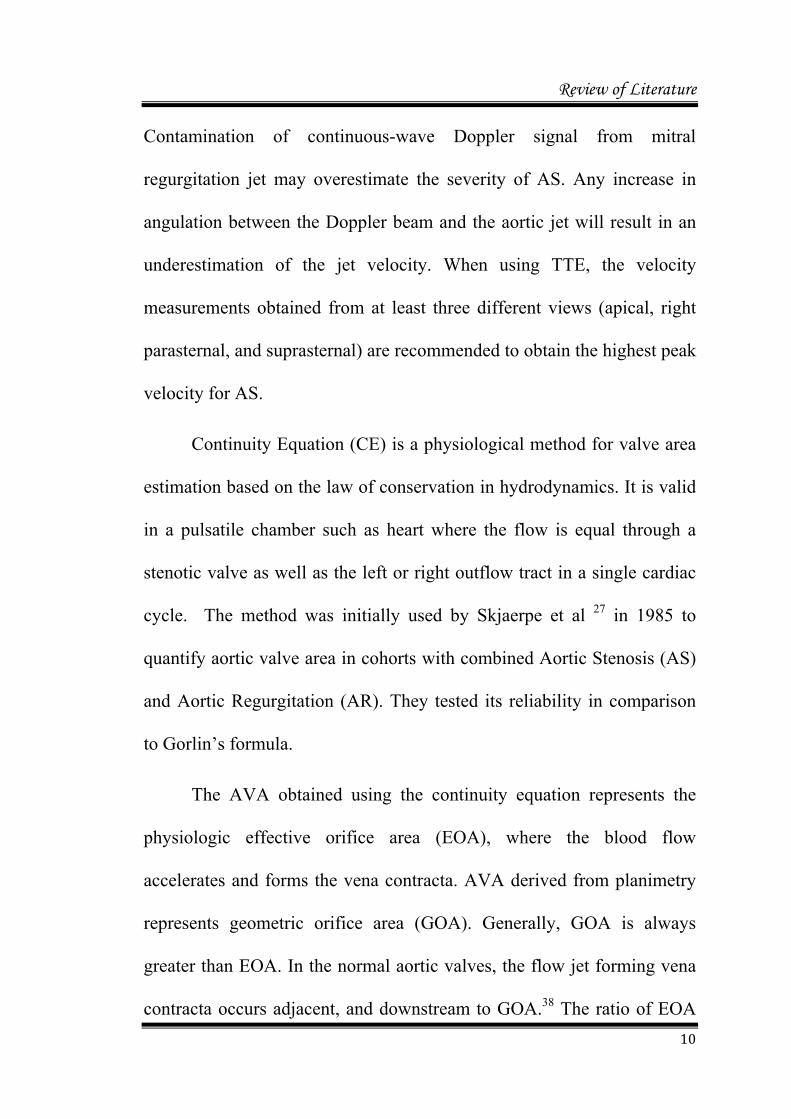
In severe AS, where the aortic valve plane is relatively flat, the flow jet
continues to accelerate and forms vena contracta after it passes through
the restrictive orifice (GOA). This phenomenon, therefore, sometimes
causes vena contracta-based EOA distal to and smaller than the GOA
(Figure 1).40
F I G U R E 1: Effect of valve shape on geometric orifice area (GOA)
and effective orifice area (EOA). With more gradually narrowed orifice,
GOA=EOA (A). With more abrupt narrowing and a flatter valve, the flow
jet continues to accelerate and contract distal to restrictive orifice causing
EOA to be less than GOA (B).
In some patients, baseline echocardiographic measurements
obtained may indicate severe stenosis yet they remain asymptomatic.

Review of Literature
12
Exercise stress test may help in unmasking symptoms. Abnormal
response to exercise could be due to poor left ventricular contractile
reserve, increased transvalvular gradient, and/or increased valvulo-arterial
impedance during excersise.41 In some small studies, an increase in MG
of at least 20 mm Hg with exercise predicted poor outcomes in severe
AS.42,43 Additional exercise-related indices predicting poor outcome
include abnormal blood pressure response (<20 mm Hg increase), ST-
segment abnormalities, and ventricular arrhythmia.43-46
Resting pulmonary hypertension (systolic pulmonary arterial
pressure >50 mm Hg) in patients with severe AS is not only associated
with poor prognosis, 47, 48 but also is an independent predictor of hospital
mortality and postoperative major adverse cardiovascular events.49
GUIDELINES IN DEFINING AORTIC STENOSIS SEVERITY
Guidelines in defining the severity of AS have continued to evolve
over time. In their initial guidelines, the American College of Cardiology
(ACC) and the American Heart Association (AHA) recommended that
severe AS be defined primarily as AVA ≤1 cm2.50 Later, revised 2006
guidelines defined severe AS by MG >40 mm Hg, maximal aortic jet
velocity >4 m/s, and AVA <1 cm2.1 The European Association of
Echocardiography (EAE) and the American Society of Echocardiography
Review of Literature
13
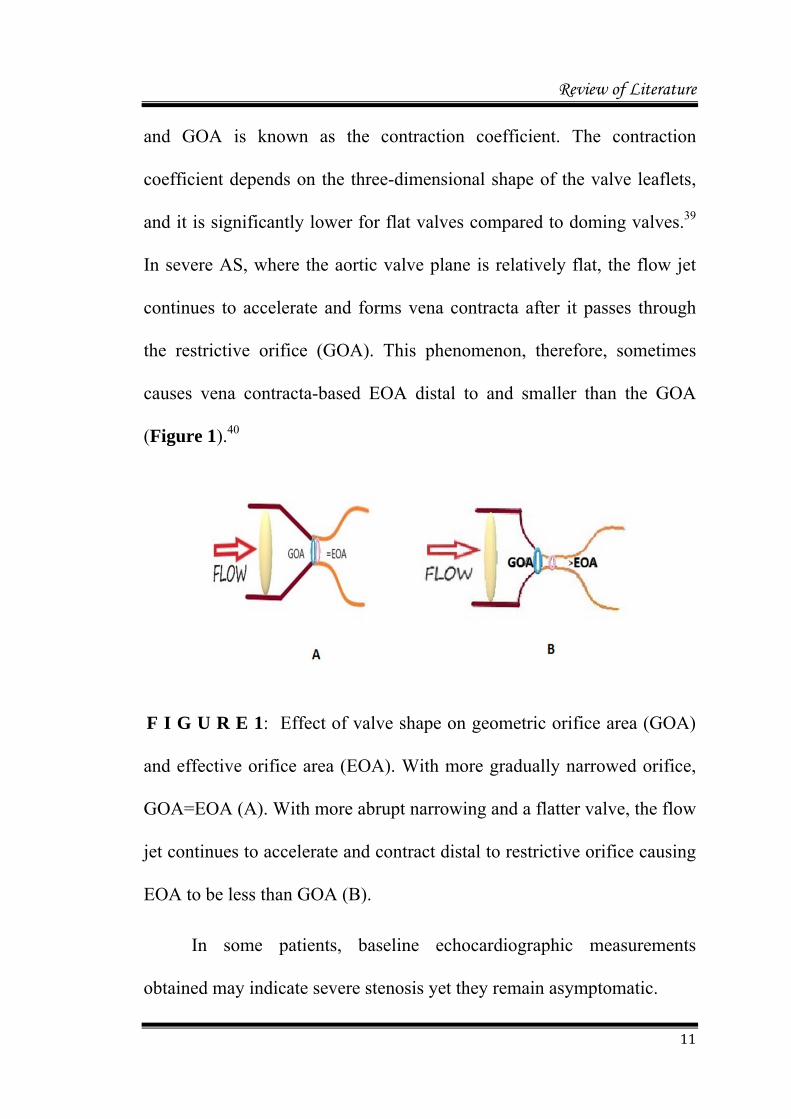
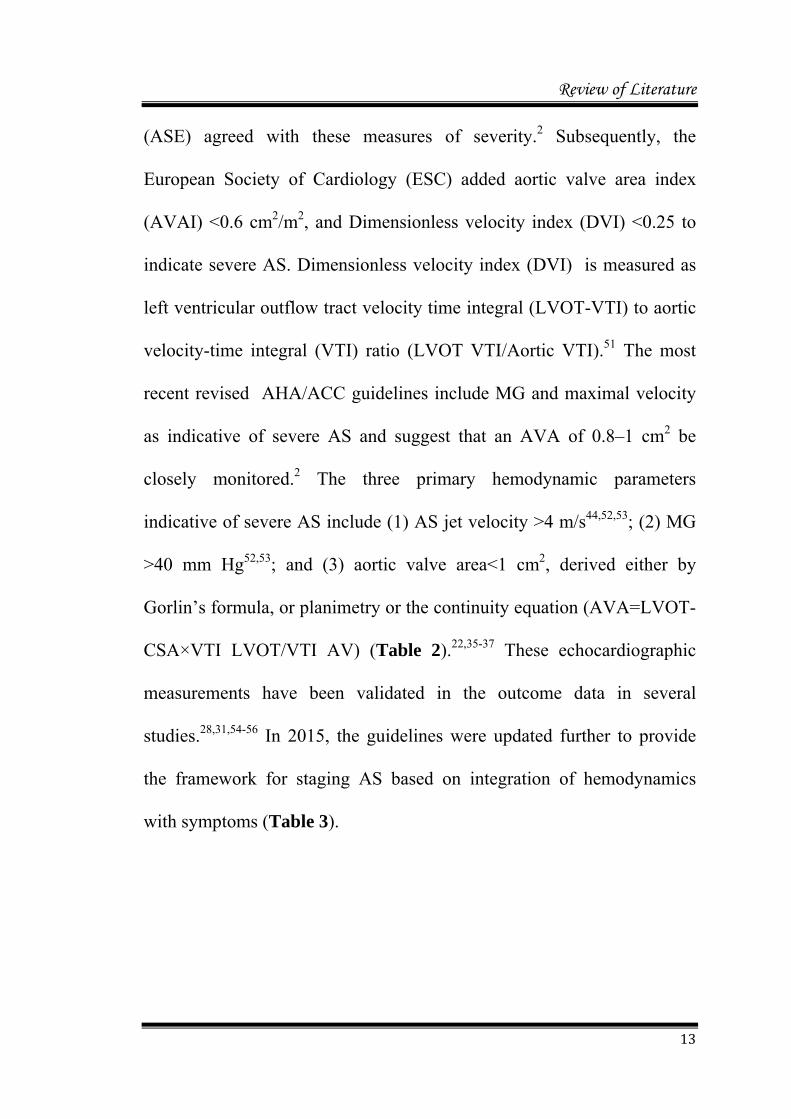
(ASE) agreed with these measures of severity.2 Subsequently, the
European Society of Cardiology (ESC) added aortic valve area index
(AVAI) <0.6 cm2/m2, and Dimensionless velocity index (DVI) <0.25 to
indicate severe AS. Dimensionless velocity index (DVI) is measured as
left ventricular outflow tract velocity time integral (LVOT-VTI) to aortic
velocity-time integral (VTI) ratio (LVOT VTI/Aortic VTI).51 The most
recent revised AHA/ACC guidelines include MG and maximal velocity
as indicative of severe AS and suggest that an AVA of 0.8–1 cm2 be
closely monitored.2 The three primary hemodynamic parameters
indicative of severe AS include (1) AS jet velocity >4 m/s44,52,53; (2) MG
>40 mm Hg52,53; and (3) aortic valve area<1 cm2, derived either by
Gorlin’s formula, or planimetry or the continuity equation (AVA=LVOT-
CSA×VTI LVOT/VTI AV) (Table 2).22,35-37 These echocardiographic
measurements have been validated in the outcome data in several
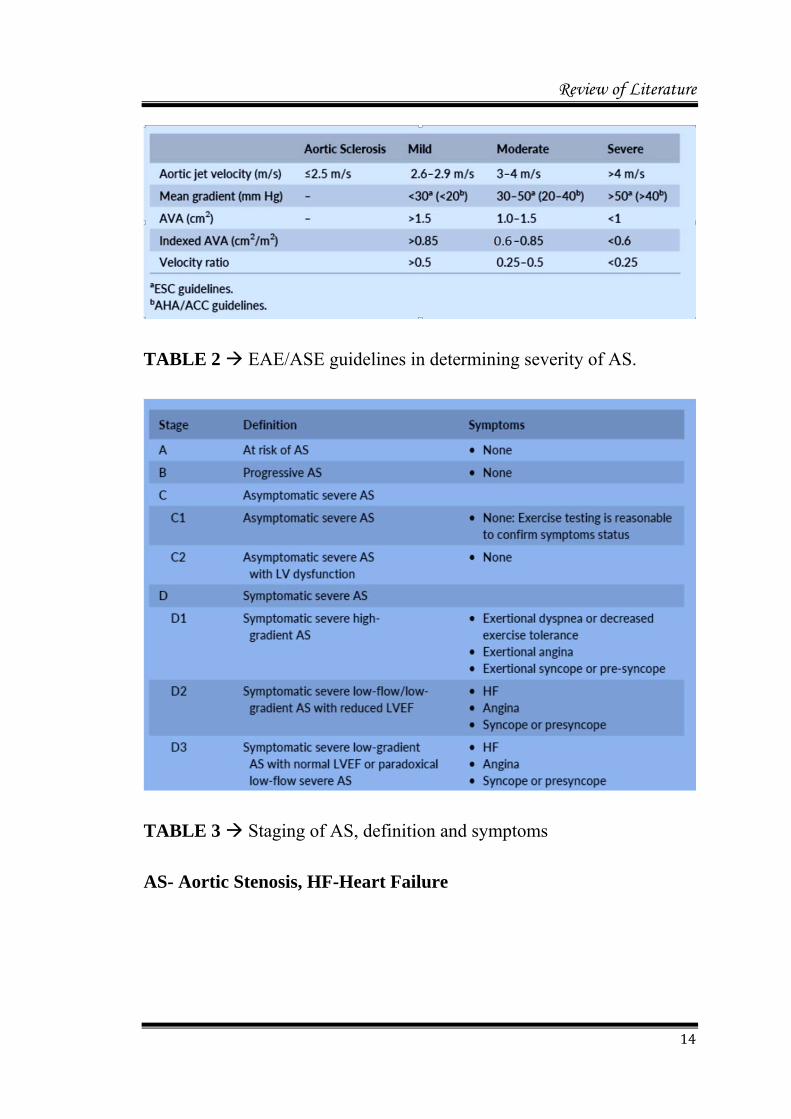
studies.28,31,54-56 In 2015, the guidelines were updated further to provide
the framework for staging AS based on integration of hemodynamics
with symptoms (Table 3).
Review of Literature
14
TABLE 2 EAE/ASE guidelines in determining severity of AS.
TABLE 3 Staging of AS, definition and symptoms
AS- Aortic Stenosis, HF-Heart Failure
Review of Literature
15
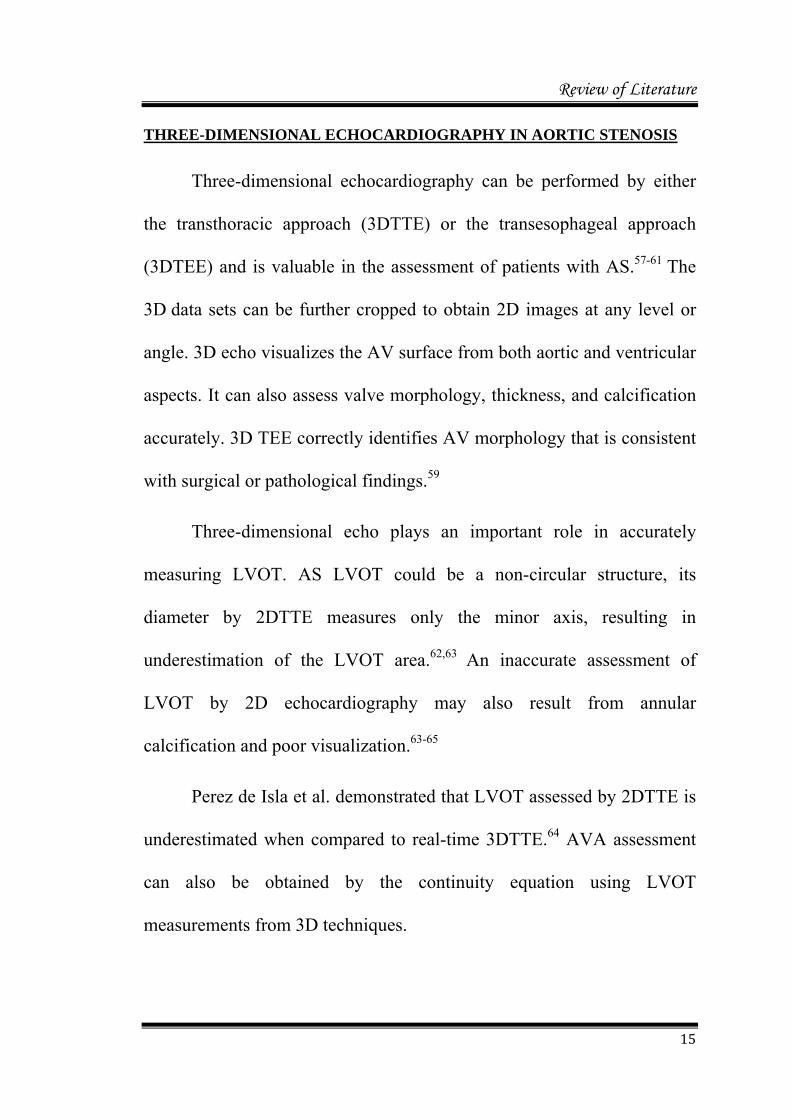
THREE-DIMENSIONAL ECHOCARDIOGRAPHY IN AORTIC STENOSIS
Three-dimensional echocardiography can be performed by either
the transthoracic approach (3DTTE) or the transesophageal approach
(3DTEE) and is valuable in the assessment of patients with AS.57-61 The
3D data sets can be further cropped to obtain 2D images at any level or
angle. 3D echo visualizes the AV surface from both aortic and ventricular
aspects. It can also assess valve morphology, thickness, and calcification
accurately. 3D TEE correctly identifies AV morphology that is consistent
with surgical or pathological findings.59
Three-dimensional echo plays an important role in accurately
measuring LVOT. AS LVOT could be a non-circular structure, its
diameter by 2DTTE measures only the minor axis, resulting in
underestimation of the LVOT area.62,63 An inaccurate assessment of
LVOT by 2D echocardiography may also result from annular
calcification and poor visualization.63-65
Perez de Isla et al. demonstrated that LVOT assessed by 2DTTE is
underestimated when compared to real-time 3DTTE.64 AVA assessment
can also be obtained by the continuity equation using LVOT
measurements from 3D techniques.
Review of Literature
16
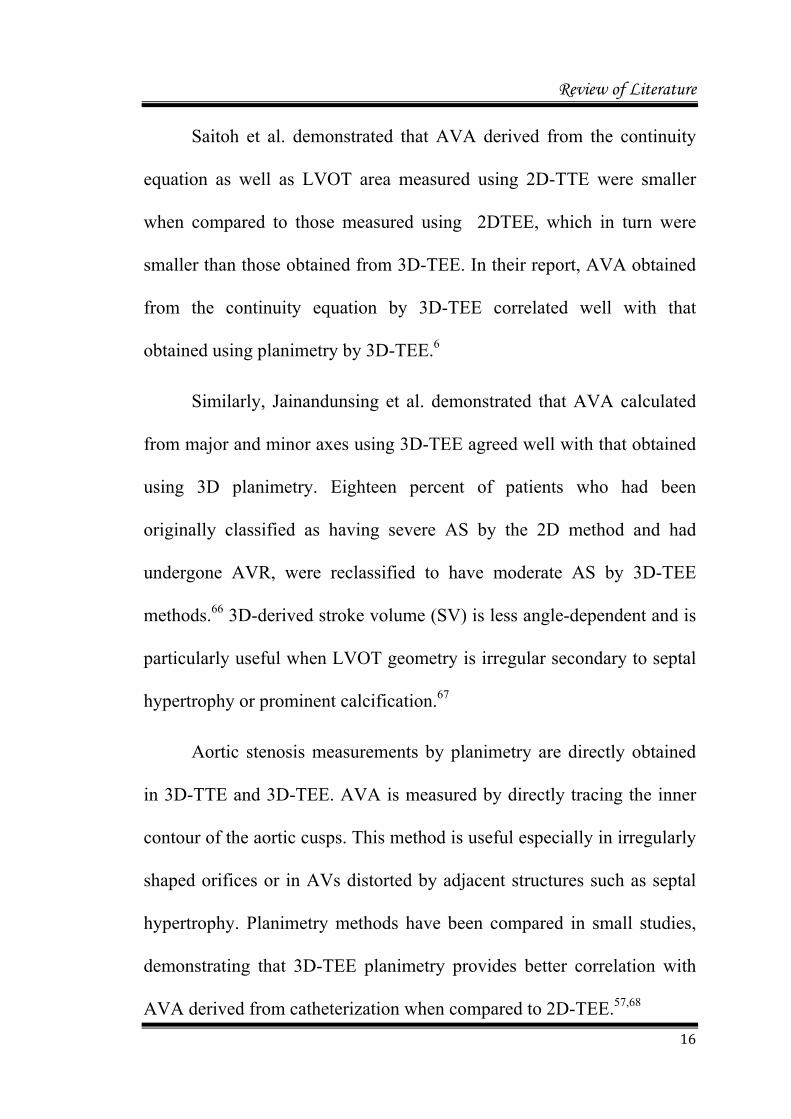
Saitoh et al. demonstrated that AVA derived from the continuity
equation as well as LVOT area measured using 2D-TTE were smaller
when compared to those measured using 2DTEE, which in turn were
smaller than those obtained from 3D-TEE. In their report, AVA obtained
from the continuity equation by 3D-TEE correlated well with that
obtained using planimetry by 3D-TEE.6
Similarly, Jainandunsing et al. demonstrated that AVA calculated
from major and minor axes using 3D-TEE agreed well with that obtained
using 3D planimetry. Eighteen percent of patients who had been
originally classified as having severe AS by the 2D method and had
undergone AVR, were reclassified to have moderate AS by 3D-TEE
methods.66 3D-derived stroke volume (SV) is less angle-dependent and is
particularly useful when LVOT geometry is irregular secondary to septal
hypertrophy or prominent calcification.67
Aortic stenosis measurements by planimetry are directly obtained
in 3D-TTE and 3D-TEE. AVA is measured by directly tracing the inner
contour of the aortic cusps. This method is useful especially in irregularly
shaped orifices or in AVs distorted by adjacent structures such as septal
hypertrophy. Planimetry methods have been compared in small studies,
demonstrating that 3D-TEE planimetry provides better correlation with
AVA derived from catheterization when compared to 2D-TEE.57,68
Review of Literature
17
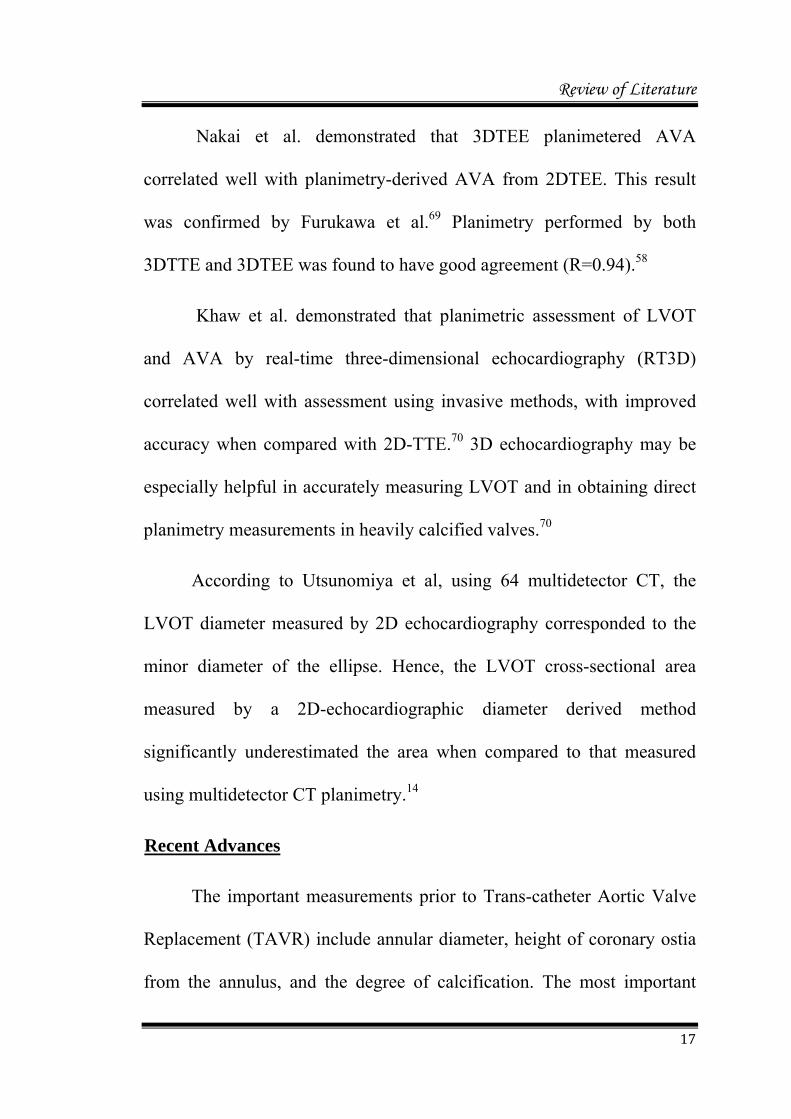
Nakai et al. demonstrated that 3DTEE planimetered AVA
correlated well with planimetry-derived AVA from 2DTEE. This result
was confirmed by Furukawa et al.69 Planimetry performed by both
3DTTE and 3DTEE was found to have good agreement (R=0.94).58
Khaw et al. demonstrated that planimetric assessment of LVOT
and AVA by real-time three-dimensional echocardiography (RT3D)
correlated well with assessment using invasive methods, with improved
accuracy when compared with 2D-TTE.70 3D echocardiography may be
especially helpful in accurately measuring LVOT and in obtaining direct
planimetry measurements in heavily calcified valves.70
According to Utsunomiya et al, using 64 multidetector CT, the
LVOT diameter measured by 2D echocardiography corresponded to the
minor diameter of the ellipse. Hence, the LVOT cross-sectional area
measured by a 2D-echocardiographic diameter derived method
significantly underestimated the area when compared to that measured
using multidetector CT planimetry.14
Recent Advances
The important measurements prior to Trans-catheter Aortic Valve
Replacement (TAVR) include annular diameter, height of coronary ostia
from the annulus, and the degree of calcification. The most important
Review of Literature
18
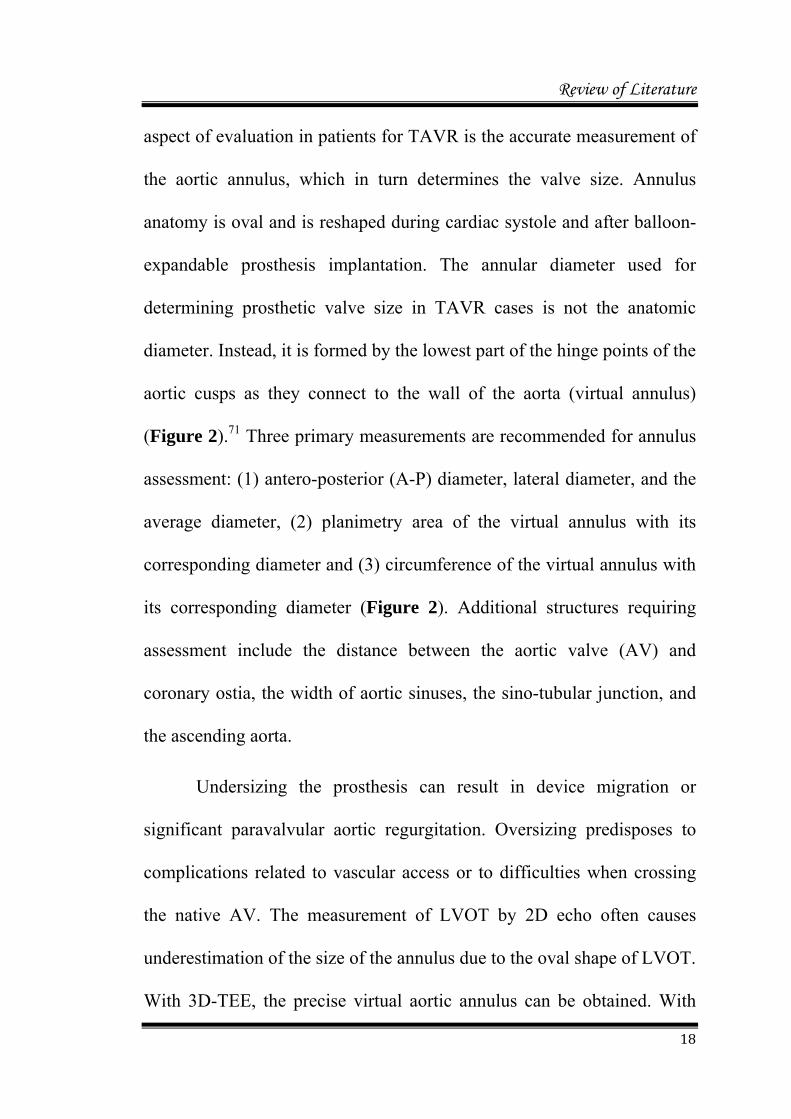
aspect of evaluation in patients for TAVR is the accurate measurement of
the aortic annulus, which in turn determines the valve size. Annulus
anatomy is oval and is reshaped during cardiac systole and after balloon-
expandable prosthesis implantation. The annular diameter used for
determining prosthetic valve size in TAVR cases is not the anatomic
diameter. Instead, it is formed by the lowest part of the hinge points of the
aortic cusps as they connect to the wall of the aorta (virtual annulus)
(Figure 2).71 Three primary measurements are recommended for annulus
assessment: (1) antero-posterior (A-P) diameter, lateral diameter, and the
average diameter, (2) planimetry area of the virtual annulus with its
corresponding diameter and (3) circumference of the virtual annulus with
its corresponding diameter (Figure 2). Additional structures requiring
assessment include the distance between the aortic valve (AV) and
coronary ostia, the width of aortic sinuses, the sino-tubular junction, and
the ascending aorta.
Undersizing the prosthesis can result in device migration or
significant paravalvular aortic regurgitation. Oversizing predisposes to
complications related to vascular access or to difficulties when crossing
the native AV. The measurement of LVOT by 2D echo often causes
underestimation of the size of the annulus due to the oval shape of LVOT.
With 3D-TEE, the precise virtual aortic annulus can be obtained. With
Review of Literature
19
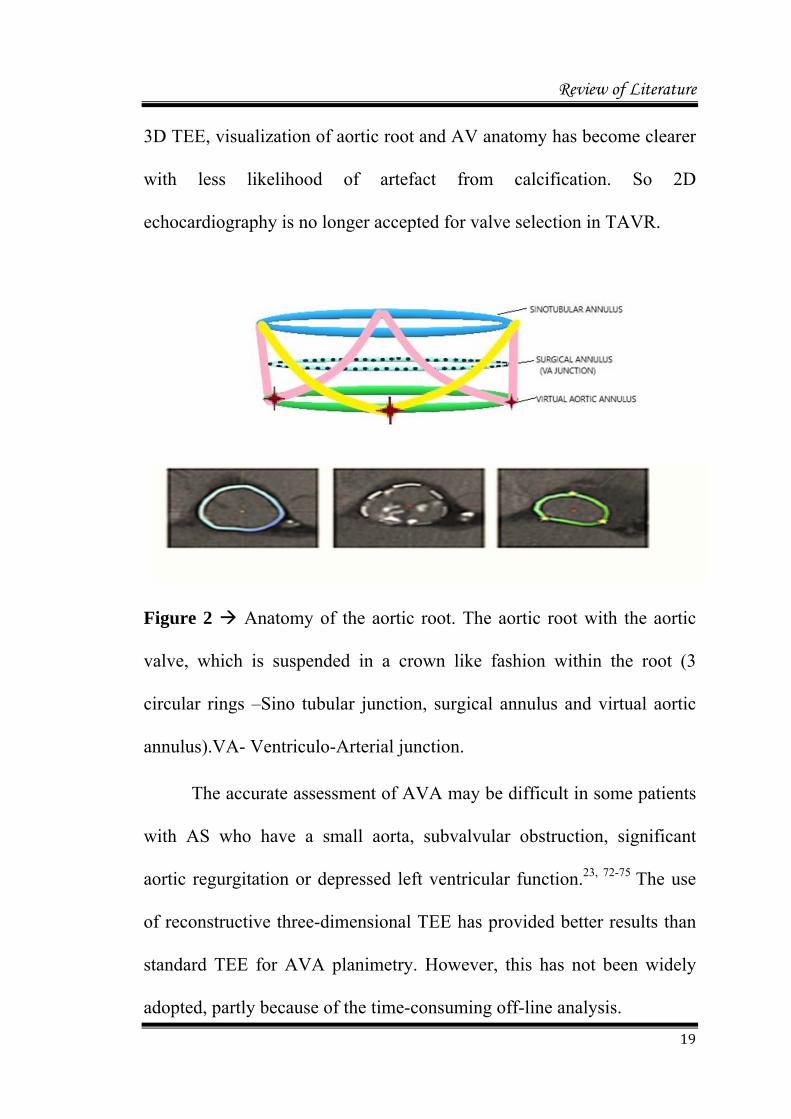
3D TEE, visualization of aortic root and AV anatomy has become clearer
with less likelihood of artefact from calcification. So 2D
echocardiography is no longer accepted for valve selection in TAVR.
Figure 2 Anatomy of the aortic root. The aortic root with the aortic
valve, which is suspended in a crown like fashion within the root (3
circular rings –Sino tubular junction, surgical annulus and virtual aortic
annulus).VA- Ventriculo-Arterial junction.
The accurate assessment of AVA may be difficult in some patients
with AS who have a small aorta, subvalvular obstruction, significant
aortic regurgitation or depressed left ventricular function.23, 72-75 The use
of reconstructive three-dimensional TEE has provided better results than
standard TEE for AVA planimetry. However, this has not been widely
adopted, partly because of the time-consuming off-line analysis.
Review of Literature
20
When 3D TTE with matrix array probe was gaining growing
interest, 3D TEE was still in infancy with multiplane probe using
rotational approach. Earlier 3D TEE probe created images after lengthy
acquisition time and processing, and were not free from artefacts. Real
time 3D image visualisation was not feasible with early era TEE probes.
Real time matrix array technology in 3D TEE (3D MTEE) came into use
by 2008.
Normal aortic valve leaflet is having a complex three dimensional
shape, which is further complicated in diseased leaflet especially with
calcification and with procedures like valvotomy. Such asymmetric
leaflets are difficult to profile using any technique which is based on 2D
planar assumption. With the evolution of 3D technology, specifically
Real Time 3D(RT3D) technology using matrix array probe there was a
growing interest to apply this technique for studying the aortic leaflets in
AS.
There is scarcity of literature for intraoperative comparison of 3D
TEE in AS with other methods. There are only a few prospective studies
available in the intra-operative pre-AVR period comparing 3D-TEE with
2D-TEE.
Aims and Objectives
21
AIMS AND OBJECTIVES
Aims and Objectives
22
AIMS AND OBJECTIVES
The AVA in patients with AS was measured using 4 methods, namely 2D planimetry,
2D-CE, 3D planimetry and 3D-CE.
Hypothesis
Considering 3D planimetry as the reference method for AVA measurement, we
hypothesised that there was no difference in the AVA measured by other 3 methods in
comparison with the reference method.
Primary Objective:
1. To compare the Aortic valve area obtained by continuity equation and
planimetry using intraoperative 3D TEE with that obtained by 2D TEE.
2. To compare the AVA obtained by other 3 methods with the 3D planimetry
(reference method).
Secondary Objectives
1. To assess the geometry of LVOT using 3D TEE.
2. To compare Aortic antero-posterior annular diameter in best views imaged on
2D and 3D echocardiography.
Materials and Methods
23
MATERIALS AND METHODS
Materials and Methods
24
MATERIALS AND METHODS
STUDY DESIGN
This prospective observational study was conducted in a tertiary referral
center, University-level hospital, which performs 750 to 1000 CABG and 300 to 400
valve cases yearly. Our study was approved by the Technical Advisory Committee
(TAC) and Institutional Ethics Committee (IEC).
[TAC registration no- SCT-/S/2016/543]
[IEC registration no- SCT/IEC/1001/DEC-2016]
Adult patients with AS with or without CAD, undergoing elective AVR or
AVR with CABG were recruited as our study subjects.
Study Group
Number of patients (n) = 40
Inclusion criteria:
1) Adult patients with AS, without associated significant other valvular heart
disease or coronary artery disease.
2) Optimal 2D and 3D-TEE images for analysis.
Exclusion criteria
1) Patient refusal.
2) Contraindication to TEE probe placement like esophageal strictures,
esophageal varices, esophageal tumours, gastric ulcer, previous
esophagectomy, esophageal diverticulum, tracheoesophageal fistula, previous
Materials and Methods
25
bariatric surgery, hiatus hernia, large descending thoracic aortic aneurysm,
unilateral vocal cord paralysis, post�radiation therapy.
3) Emergency and re-do surgeries.
4) Patients with severe significant other valvular disease and coronary artery
disease.
Study Protocol:
1) After obtaining approval from IEC, patients were enrolled in the study during the
pre-anesthetic evaluation.
2) Patients were educated about the study in the presence of a witness. The witness
could question the patient as to whether he/ she had really understood details of
the proposed study. An informed consent form was signed by patient or relative of
the patient as per the Institute protocol.
3) An adult-size TEE probe was inserted after induction of anesthesia and a
comprehensive cardiac examination was done using a RT-3D-TEE probe and
ultrasound machine. (Philips iE 33, Philips Ultrasound, Bothell, USA).
4) Comprehensive cardiac examination included the necessary views required for
management of the patient.
5) All views necessary for measurement of AVA and LVOT area were acquired as a
part of comprehensive examination. 3D analysis was performed using off-line
3DQ software.
Materials and Methods
26
2D Echocardiography protocol:
The patients underwent a complete 2D TEE imaging, including color and spectral
doppler study.
Echocardiographic measurements were obtained in compliance with the
guidelines published by the American Society of Echocardiography (ASE).
The 2D images were acquired by echocardiographers trained in multiplane 2D-
TEE evaluation. The aortic valve was examined in multiple image projections.
Echo data which was stored in the hard disc of iE 33 ultrasound system was
retrieved in compact disks (CDs) or hard disks and kept with the Principal
Investigator.
2D Planimetry AVA
2D planimetry was performed using X-plane technique. Required frequency
and gain adjustments were done to image the aortic valve in AV short and long
axis views. X-plane technique was specifically used to localise the tip of the AV
for the accurate measurement of AVA. 2D valve area was measured in mid systole
using AV-short axis (SAX) zoomed view.
Materials and Methods
27
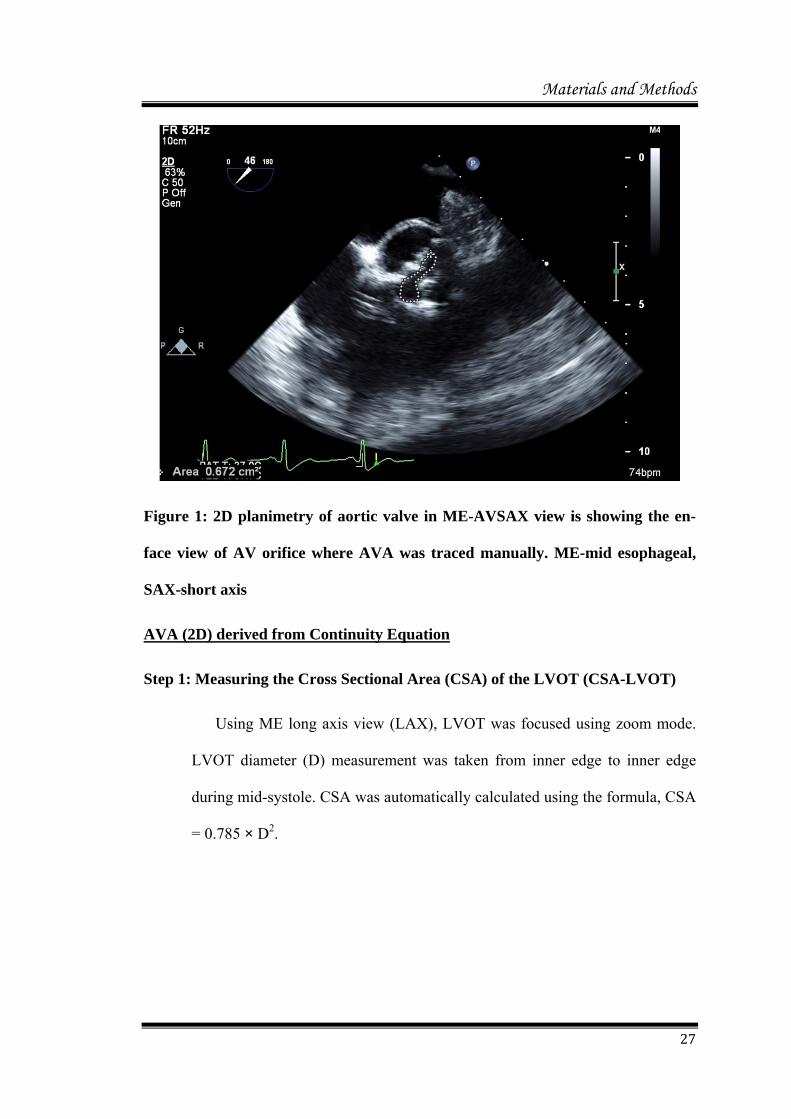
Figure 1: 2D planimetry of aortic valve in ME-AVSAX view is showing the en-
face view of AV orifice where AVA was traced manually. ME-mid esophageal,
SAX-short axis
AVA (2D) derived from Continuity Equation
Step 1: Measuring the Cross Sectional Area (CSA) of the LVOT (CSA-LVOT)
Using ME long axis view (LAX), LVOT was focused using zoom mode.
LVOT diameter (D) measurement was taken from inner edge to inner edge
during mid-systole. CSA was automatically calculated using the formula, CSA
= 0.785 × D2.
Materials and Methods
28
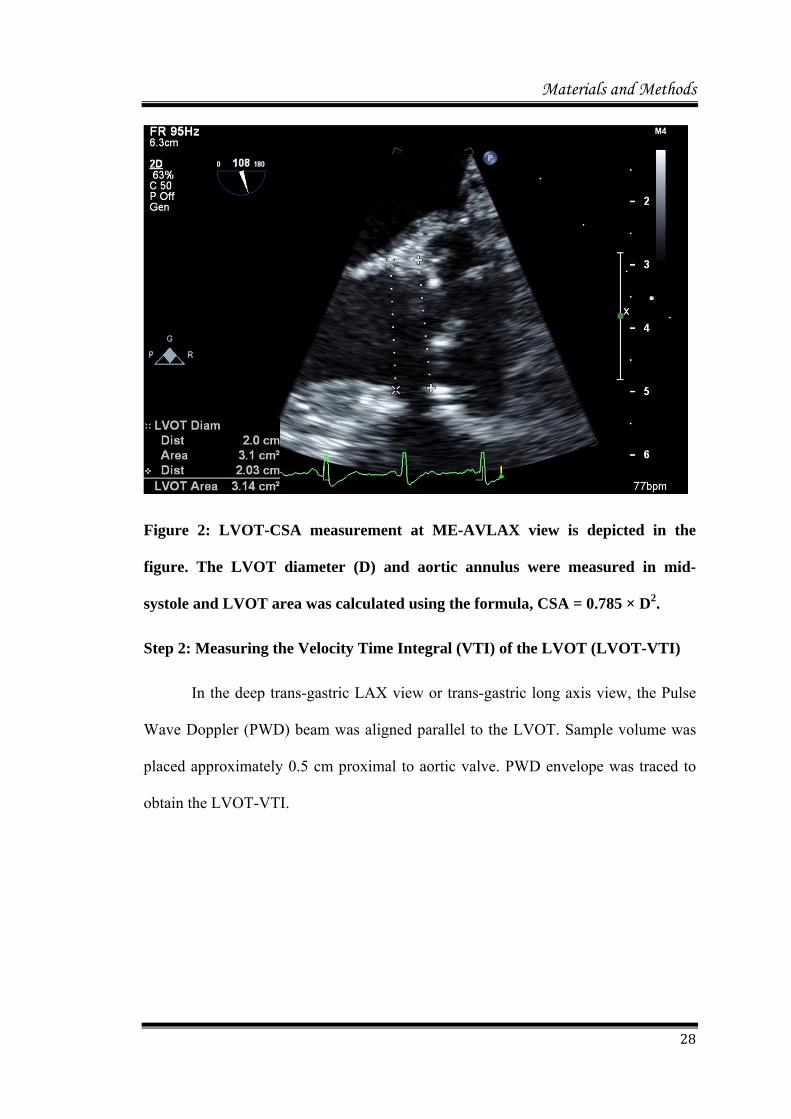
Figure 2: LVOT-CSA measurement at ME-AVLAX view is depicted in the
figure. The LVOT diameter (D) and aortic annulus were measured in mid-
systole and LVOT area was calculated using the formula, CSA = 0.785 × D2.
Step 2: Measuring the Velocity Time Integral (VTI) of the LVOT (LVOT-VTI)
In the deep trans-gastric LAX view or trans-gastric long axis view, the Pulse
Wave Doppler (PWD) beam was aligned parallel to the LVOT. Sample volume was
placed approximately 0.5 cm proximal to aortic valve. PWD envelope was traced to
obtain the LVOT-VTI.
Materials and Methods
29
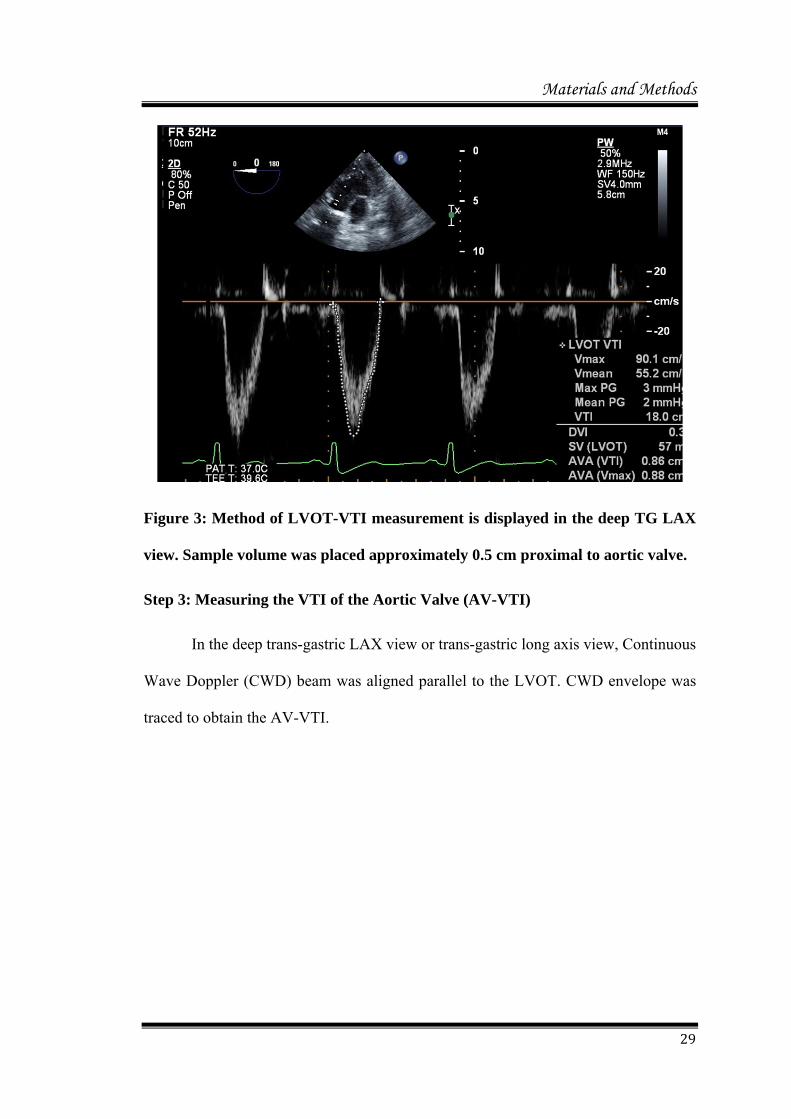
Figure 3: Method of LVOT-VTI measurement is displayed in the deep TG LAX
view. Sample volume was placed approximately 0.5 cm proximal to aortic valve.
Step 3: Measuring the VTI of the Aortic Valve (AV-VTI)
In the deep trans-gastric LAX view or trans-gastric long axis view, Continuous
Wave Doppler (CWD) beam was aligned parallel to the LVOT. CWD envelope was
traced to obtain the AV-VTI.
Materials and Methods
30
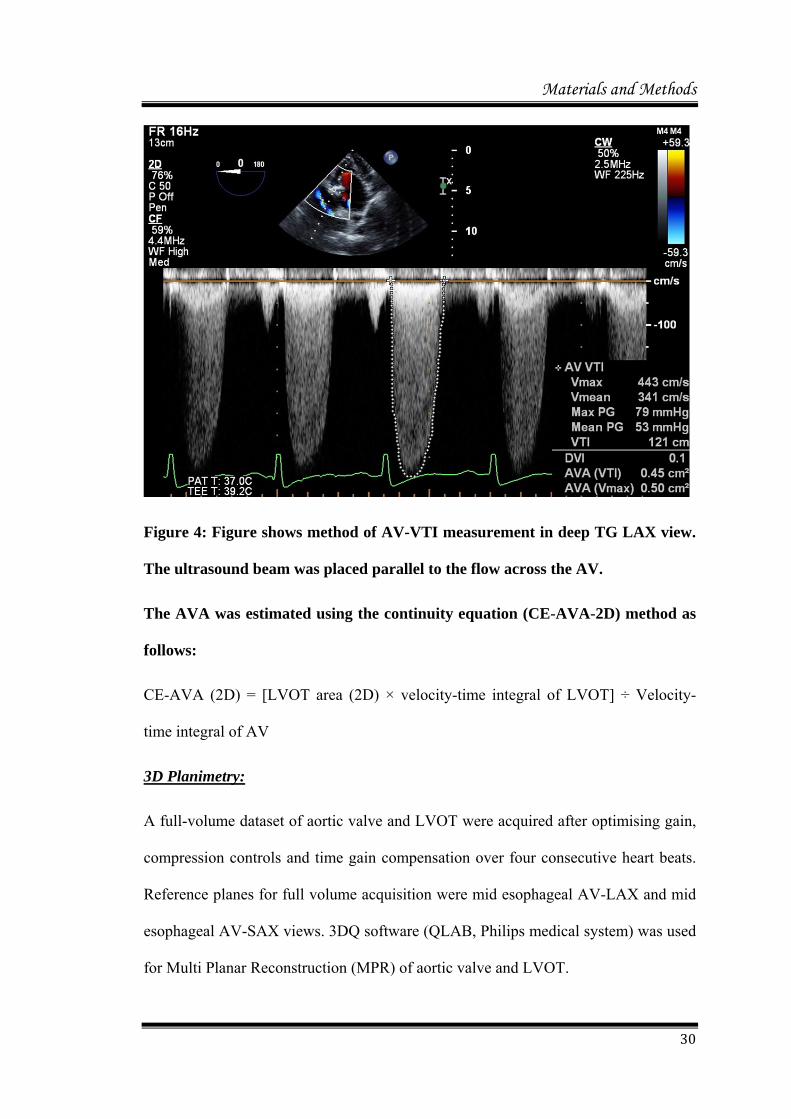
Figure 4: Figure shows method of AV-VTI measurement in deep TG LAX view.
The ultrasound beam was placed parallel to the flow across the AV.
The AVA was estimated using the continuity equation (CE-AVA-2D) method as
follows:
CE-AVA (2D) = [LVOT area (2D) × velocity-time integral of LVOT] ÷ Velocity-
time integral of AV
3D Planimetry:
A full-volume dataset of aortic valve and LVOT were acquired after optimising gain,
compression controls and time gain compensation over four consecutive heart beats.
Reference planes for full volume acquisition were mid esophageal AV-LAX and mid
esophageal AV-SAX views. 3DQ software (QLAB, Philips medical system) was used
for Multi Planar Reconstruction (MPR) of aortic valve and LVOT.
Materials and Methods
31
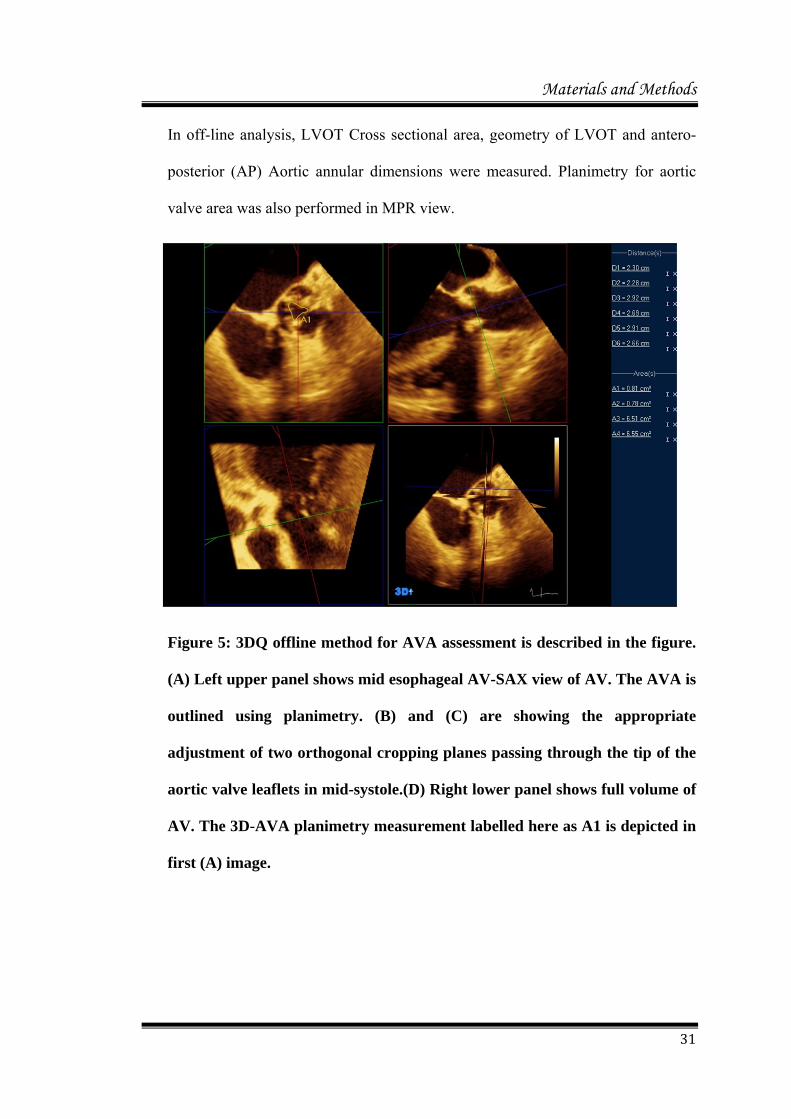
In off-line analysis, LVOT Cross sectional area, geometry of LVOT and antero-
posterior (AP) Aortic annular dimensions were measured. Planimetry for aortic
valve area was also performed in MPR view.
Figure 5: 3DQ offline method for AVA assessment is described in the figure.
(A) Left upper panel shows mid esophageal AV-SAX view of AV. The AVA is
outlined using planimetry. (B) and (C) are showing the appropriate
adjustment of two orthogonal cropping planes passing through the tip of the
aortic valve leaflets in mid-systole.(D) Right lower panel shows full volume of
AV. The 3D-AVA planimetry measurement labelled here as A1 is depicted in
first (A) image.
Materials and Methods
32
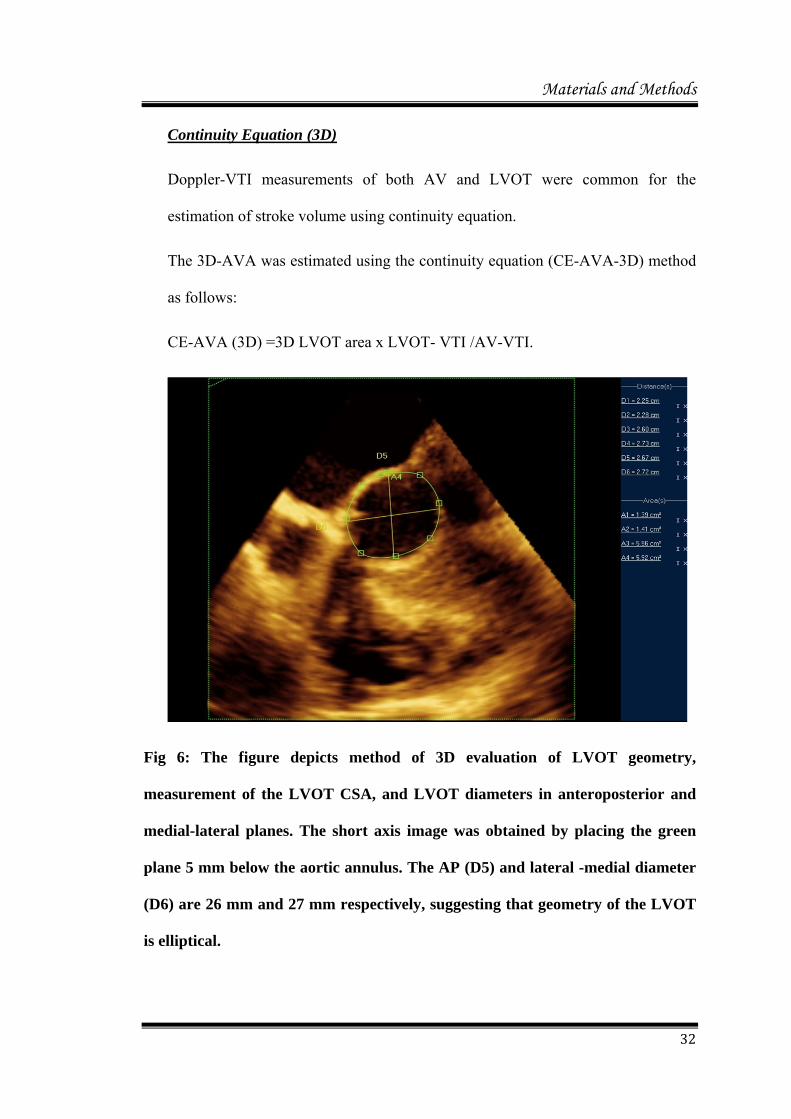
Continuity Equation (3D)
Doppler-VTI measurements of both AV and LVOT were common for the
estimation of stroke volume using continuity equation.
The 3D-AVA was estimated using the continuity equation (CE-AVA-3D) method
as follows:
CE-AVA (3D) =3D LVOT area x LVOT- VTI /AV-VTI.
Fig 6: The figure depicts method of 3D evaluation of LVOT geometry,
measurement of the LVOT CSA, and LVOT diameters in anteroposterior and
medial-lateral planes. The short axis image was obtained by placing the green
plane 5 mm below the aortic annulus. The AP (D5) and lateral -medial diameter
(D6) are 26 mm and 27 mm respectively, suggesting that geometry of the LVOT
is elliptical.
Materials and Methods
33
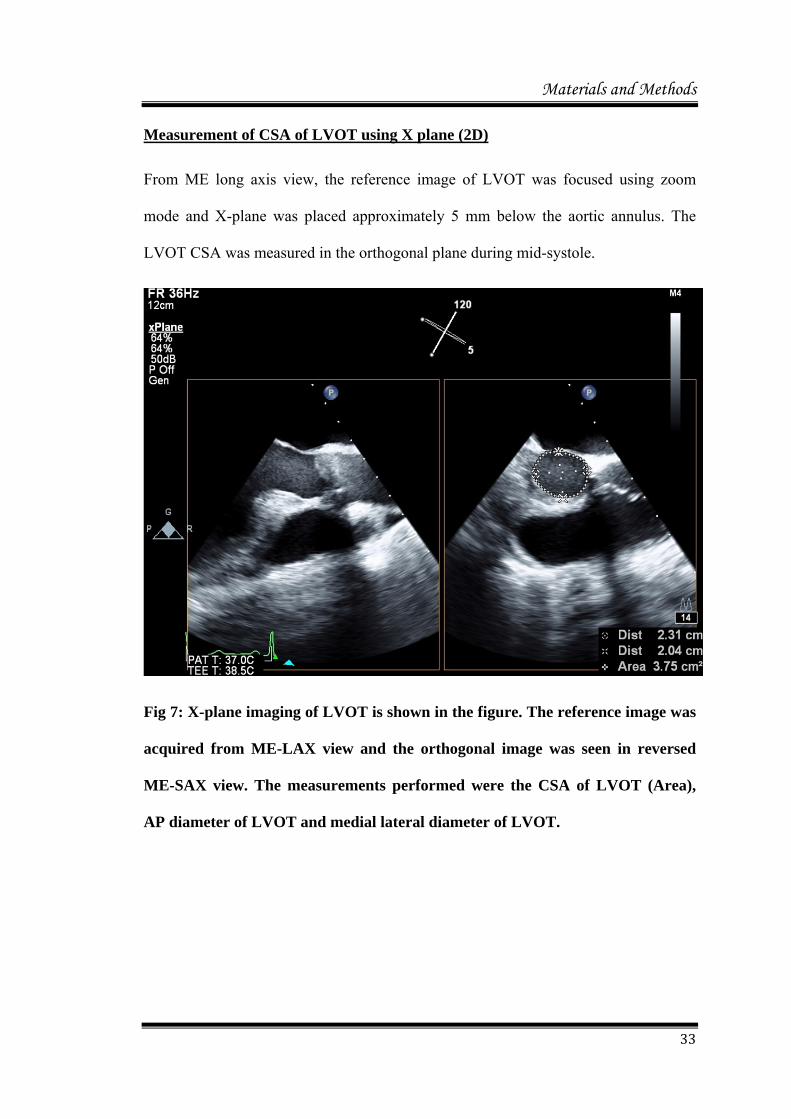
Measurement of CSA of LVOT using X plane (2D)
From ME long axis view, the reference image of LVOT was focused using zoom
mode and X-plane was placed approximately 5 mm below the aortic annulus. The
LVOT CSA was measured in the orthogonal plane during mid-systole.
Fig 7: X-plane imaging of LVOT is shown in the figure. The reference image was
acquired from ME-LAX view and the orthogonal image was seen in reversed
ME-SAX view. The measurements performed were the CSA of LVOT (Area),
AP diameter of LVOT and medial lateral diameter of LVOT.
Materials and Methods
34
Study Groups:
Single group in which all the parameters were evaluated by different observers
separately.
Observations:
Please refer to Annexure page 2
Outcome parameters:
We obtained AVA by continuity equation (using 2D LVOT area and 3D LVOT area),
2D planimetry, and 3D planimetry which were compared among each other. The
inter-observer variability was also calculated for the same.
Statistical Analysis
35
STATISTICAL ANALYSIS
Statistical Analysis
36
STATISTICAL ANALYSIS
Statistical analysis was done using SPSS software version 22 and Graph pad
prism 5.2. Continuous variables are expressed as mean ± standard deviation (SD).
Comparison of measurements between two groups was performed using Student’s
paired t test and Wilcoxon signed rank test. If the data did not follows the normal
distribution, then we applied the non-parametric test, Wilcoxon signed rank test.
Linear regression analysis was used to assess the relationship between 2D-AVA and
3D-AVA, and correlation coefficients were expressed as R values. Bland—Altman
analysis was performed to assess agreement between the two methods, and the limits
of agreement were defined as mean ± 1.96 SD of the average differences between
the methods. Interobserver variations were assessed as Inter class correlation
coefficients (ICC) with linear regression analysis and mean differences. A p-value <
0.05 was considered statistically significant.
We calculated the sample size anticipating a difference of 0.2 cm2 between the
areas measured using 2D and 3D TEE, with a significance level of 0.01 and power of
90%. Required sample size was 37, which was rounded to 40 patients.77

Results
37
RESULTS

Results
38
RESULTS
Feasibility of the study
46 consecutive patients fulfilling inclusive criteria were enrolled in the study.
3D AVA area assessment was feasible in 45 patients (97%). 1 patient had excessive
calcium which hampered the offline assessment due to poor image quality. 2D
assessment was practical only in 42 patients (91%). Among the 4 patients in whom
2D TEE planimetry failed due to heavy calcification or distortion of the leaflets, one
was the patient who had inadequate 3D image. Satisfactory AV-VTI was not profiled
in 2 other patients and hence they were excluded from the study resulting in CE
method being successful in 40 patients (87%).
Population
Our study population included 40 patients with AS all the methods for valve
area assessment remained feasible. Mean age of the study population was 57±8 years.
25 among the total patients were males. 26 patients presented with NYHA class II
symptoms and 14 were having class III symptoms. One (2.5%) patient was in atrial
fibrillation. 30 patients had grade I Left ventricular diastolic dysfunction (LV-DDF), 5
had grade II LV-DDF and 2 patients had grade III LV-DDF on pre-operative TTE.
RV function was normal in 35 patients. 4 patients had mild and 1 had moderate RV
dysfunction. 37 patients had mild mitral regurgitation (MR), 3 had moderate MR, 11
had mild aortic regurgitation (AR), 29 had moderate AR and 27 patients were
diagnosed with mild tricuspid regurgitation (TR). Peak and mean gradients in pre-op
2D TTE were 94 ± 30 mm Hg and 56 ± 17 mmHg respectively.
Results
39
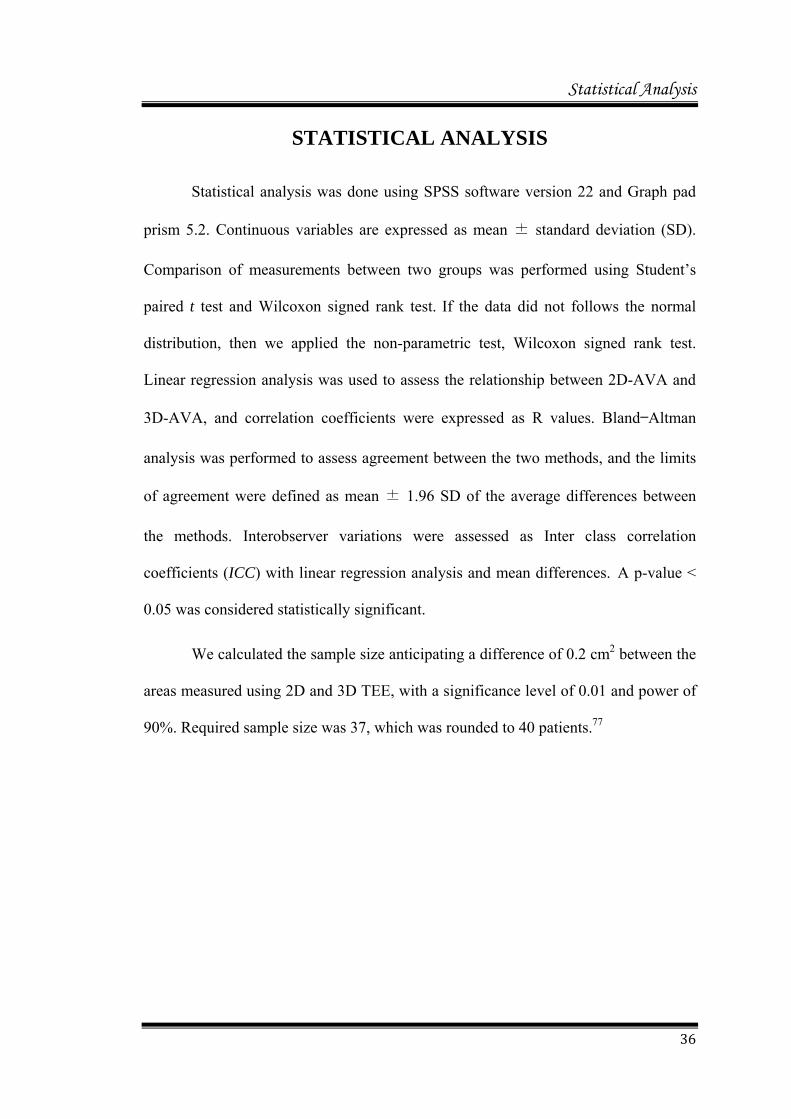
Demographic and echocardiographic parameters of all patients are summarised in
Table 4.
Table 4: Demographic & Echocardiographic parameters
Male 25 (62%)
Female 15 (28%)
Age (yrs) 58 ± 8
Weight (kgs) 63 ± 10
NYHA
Class II 26 (65%)
Class III 14 (35%)
Atrial Fibrillation 1 (2.5%)
LV diastolic dysfunction
Normal 3 (7.5%)
Grade I 30 (75%)
Grade II 5 (12.5%)
Grade III 2 (5%)
Mild MR 28 (70%)
Mild AR 11 (27.5%)
Mild TR 27 (67.5%)
Data expressed as mean±SD or as n (%)
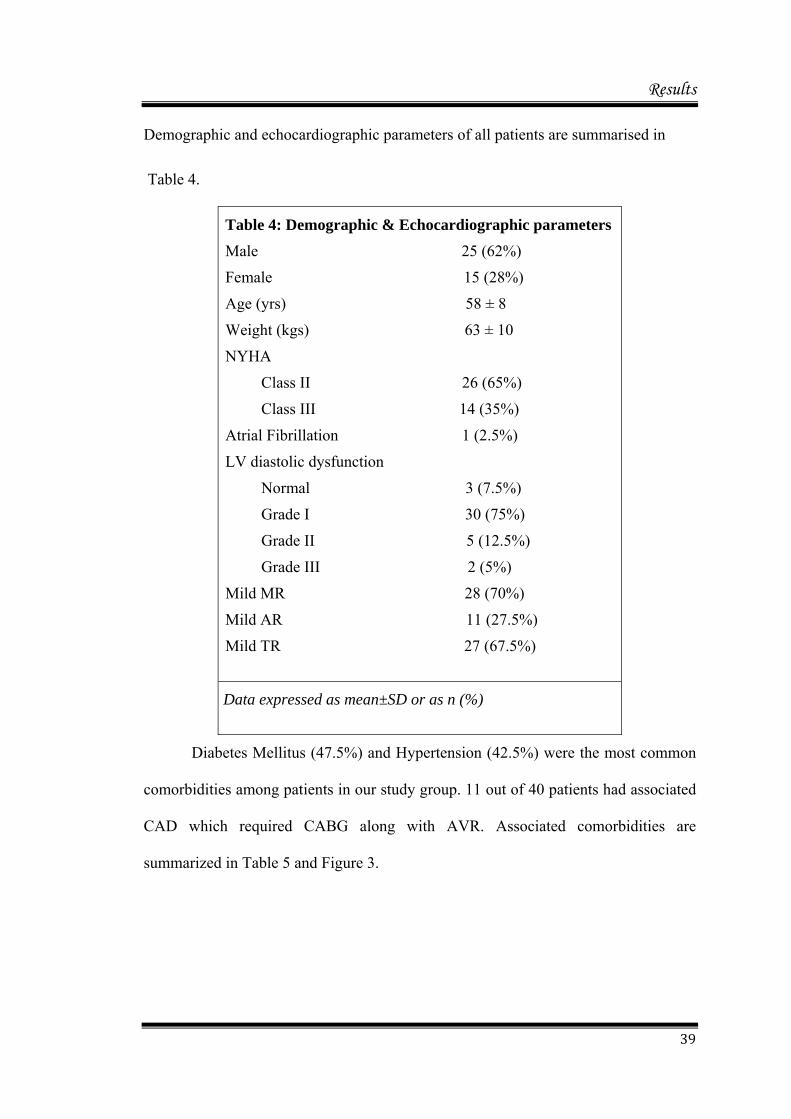
Diabetes Mellitus (47.5%) and Hypertension (42.5%) were the most common
comorbidities among patients in our study group. 11 out of 40 patients had associated
CAD which required CABG along with AVR. Associated comorbidities are
summarized in Table 5 and Figure 3.
Results
40
Comorbidity Number of
Patients Percentag
e
Diabetes Mellitus 19 47.5
Hypertension 17 42.5
Dyslipidemia 10 25.0
Hypothyroidism 2 5.0
Chronic Kidney Disease 1 2.5
Psychiatric Illness 3 7.5
Bronchial Asthma/Chronic Obstructive Pulmonary Disease
7 17.5
Coronary Artery Disease 11 27.5
Table 5: Percentage of Comorbidities in study population
Figure 3: Percentage of Comorbidities in study population
DM-Diabetes Mellitus, HTN-Hypertension, CAD-Coronary Artery Disease,
DLP-Dyslipidemia, BA-Bronchial Asthma, COPD-Chronic Obstructive
Pulmonary Disease, CKD-Chronic Kidney Disease.
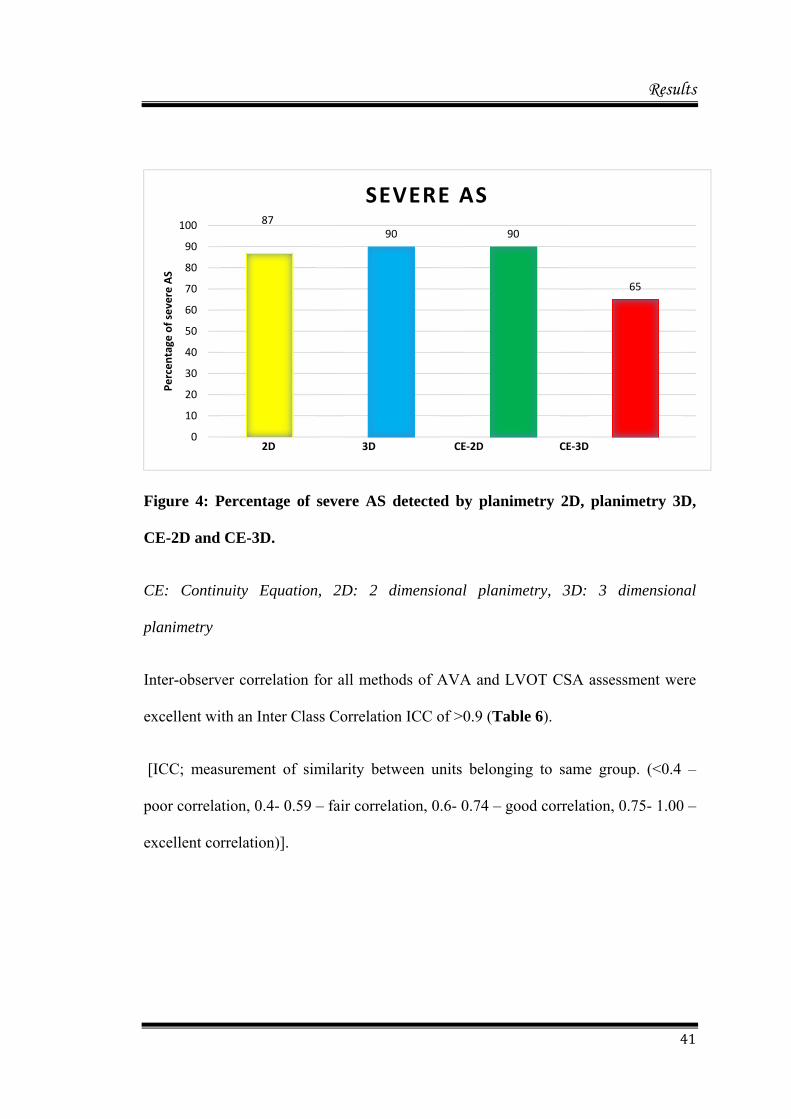
Percentage of severe AS (< 1 cm2) detected by planimetry 2D, planimetry 3D,
CE-2D and CE-3D were 87%, 90%, 90%, and 65% respectively (Figure 4).
05101520253035404550
47.5 42.5
27.5 25
17.5
7.5 5
2.5
Percentage
Co‐morbidities
Results
41
Figure 4: Percentage of severe AS detected by planimetry 2D, planimetry 3D,
CE-2D and CE-3D.
CE: Continuity Equation, 2D: 2 dimensional planimetry, 3D: 3 dimensional
planimetry
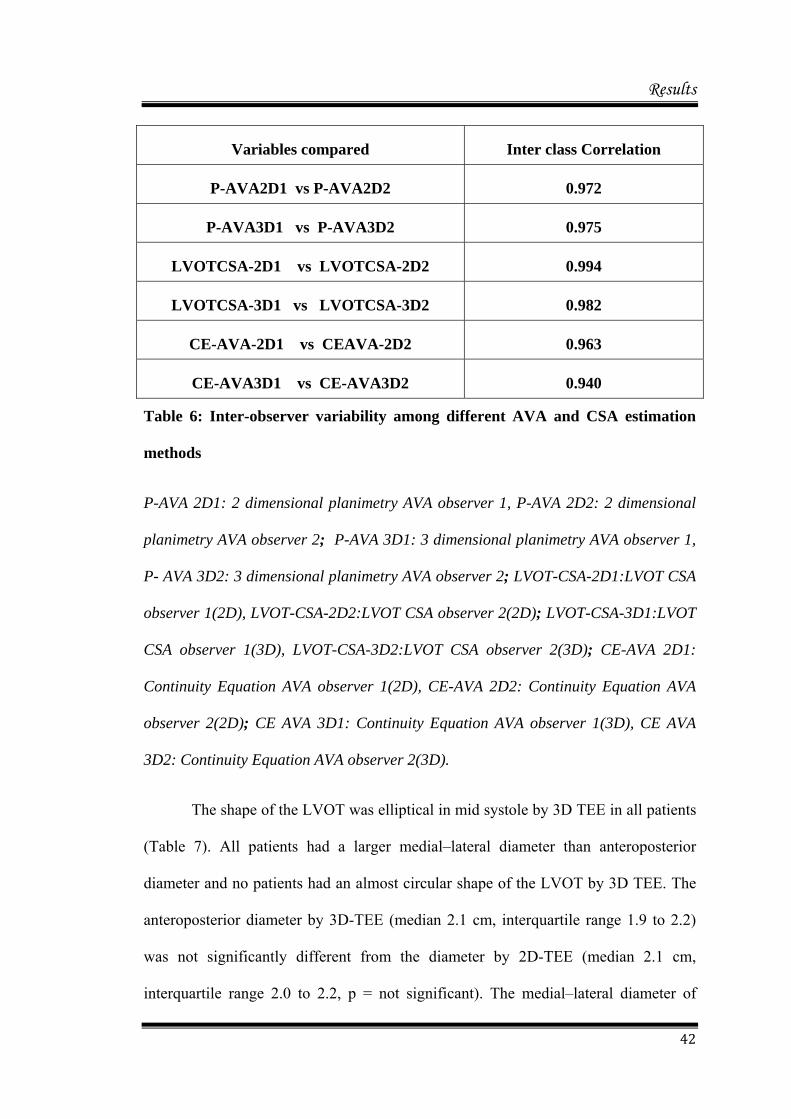
Inter-observer correlation for all methods of AVA and LVOT CSA assessment were
excellent with an Inter Class Correlation ICC of >0.9 (Table 6).
[ICC; measurement of similarity between units belonging to same group. (<0.4 –
poor correlation, 0.4- 0.59 – fair correlation, 0.6- 0.74 – good correlation, 0.75- 1.00 –
excellent correlation)].
87 90 90
65
0
10
20
30
40
50
60
70
80
90
100
Percentage
of severe AS
2D 3D CE‐2D CE‐3D
SEVERE AS
Results
42
Variables compared Inter class Correlation
P-AVA2D1 vs P-AVA2D2 0.972
P-AVA3D1 vs P-AVA3D2 0.975
LVOTCSA-2D1 vs LVOTCSA-2D2 0.994
LVOTCSA-3D1 vs LVOTCSA-3D2 0.982
CE-AVA-2D1 vs CEAVA-2D2 0.963
CE-AVA3D1 vs CE-AVA3D2 0.940
Table 6: Inter-observer variability among different AVA and CSA estimation
methods
P-AVA 2D1: 2 dimensional planimetry AVA observer 1, P-AVA 2D2: 2 dimensional
planimetry AVA observer 2; P-AVA 3D1: 3 dimensional planimetry AVA observer 1,
P- AVA 3D2: 3 dimensional planimetry AVA observer 2; LVOT-CSA-2D1:LVOT CSA
observer 1(2D), LVOT-CSA-2D2:LVOT CSA observer 2(2D); LVOT-CSA-3D1:LVOT
CSA observer 1(3D), LVOT-CSA-3D2:LVOT CSA observer 2(3D); CE-AVA 2D1:
Continuity Equation AVA observer 1(2D), CE-AVA 2D2: Continuity Equation AVA
observer 2(2D); CE AVA 3D1: Continuity Equation AVA observer 1(3D), CE AVA
3D2: Continuity Equation AVA observer 2(3D).
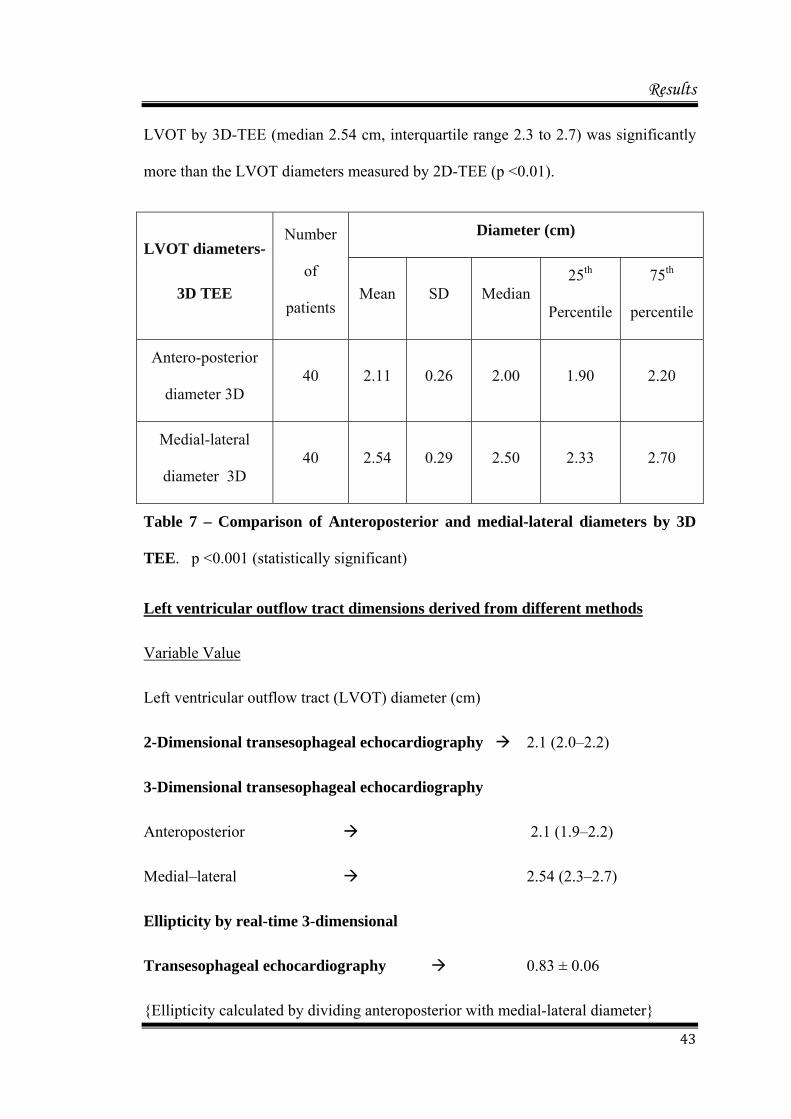
The shape of the LVOT was elliptical in mid systole by 3D TEE in all patients
(Table 7). All patients had a larger medial–lateral diameter than anteroposterior
diameter and no patients had an almost circular shape of the LVOT by 3D TEE. The
anteroposterior diameter by 3D-TEE (median 2.1 cm, interquartile range 1.9 to 2.2)
was not significantly different from the diameter by 2D-TEE (median 2.1 cm,
interquartile range 2.0 to 2.2, p = not significant). The medial–lateral diameter of
Results
43
LVOT by 3D-TEE (median 2.54 cm, interquartile range 2.3 to 2.7) was significantly
more than the LVOT diameters measured by 2D-TEE (p <0.01).
LVOT diameters-
3D TEE
Number
of
patients
Diameter (cm)
Mean SD Median 25th
Percentile
75th
percentile
Antero-posterior
diameter 3D 40 2.11 0.26 2.00 1.90 2.20
Medial-lateral
diameter 3D 40 2.54 0.29 2.50 2.33 2.70
Table 7 – Comparison of Anteroposterior and medial-lateral diameters by 3D
TEE. p <0.001 (statistically significant)
Left ventricular outflow tract dimensions derived from different methods
Variable Value
Left ventricular outflow tract (LVOT) diameter (cm)
2-Dimensional transesophageal echocardiography 2.1 (2.0–2.2)
3-Dimensional transesophageal echocardiography
Anteroposterior 2.1 (1.9–2.2)
Medial–lateral 2.54 (2.3–2.7)
Ellipticity by real-time 3-dimensional
Transesophageal echocardiography 0.83 ± 0.06
{Ellipticity calculated by dividing anteroposterior with medial-lateral diameter}
Results
44
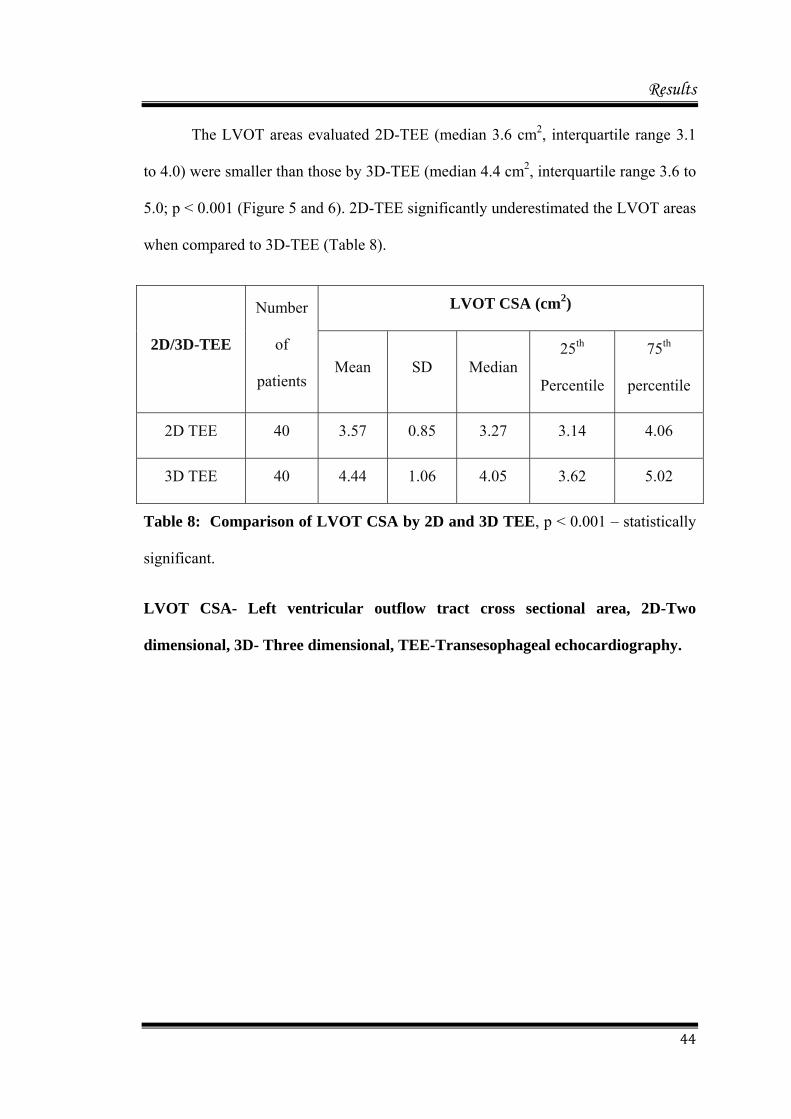
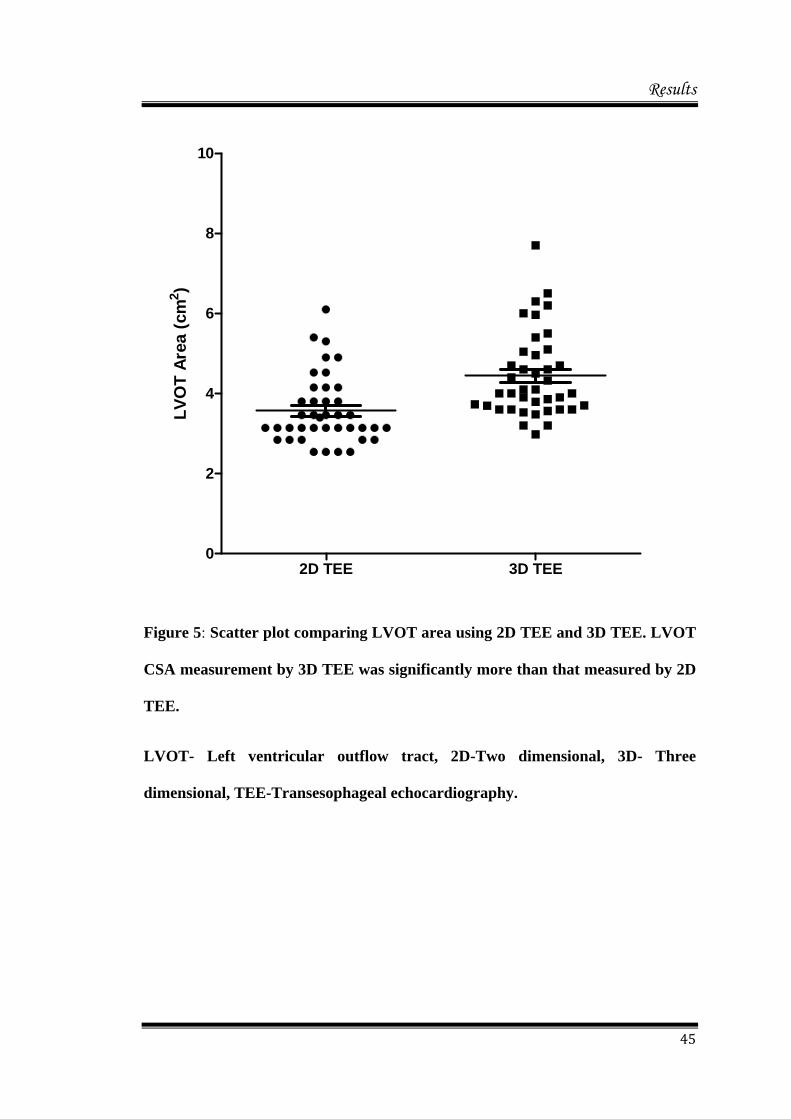
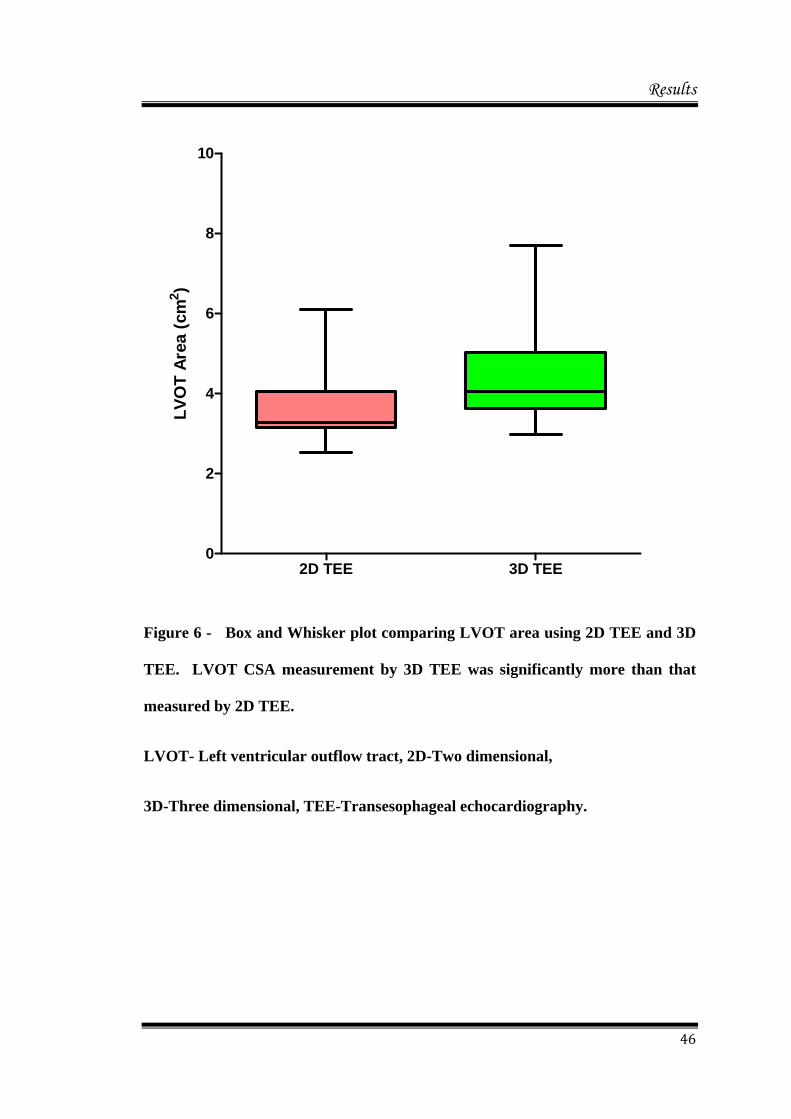
The LVOT areas evaluated 2D-TEE (median 3.6 cm2, interquartile range 3.1
to 4.0) were smaller than those by 3D-TEE (median 4.4 cm2, interquartile range 3.6 to
5.0; p < 0.001 (Figure 5 and 6). 2D-TEE significantly underestimated the LVOT areas
when compared to 3D-TEE (Table 8).
2D/3D-TEE
Number
of
patients
LVOT CSA (cm2)
Mean SD Median 25th
Percentile
75th
percentile
2D TEE 40 3.57 0.85 3.27 3.14 4.06
3D TEE 40 4.44 1.06 4.05 3.62 5.02
Table 8: Comparison of LVOT CSA by 2D and 3D TEE, p < 0.001 – statistically
significant.
LVOT CSA- Left ventricular outflow tract cross sectional area, 2D-Two
dimensional, 3D- Three dimensional, TEE-Transesophageal echocardiography.
Results
45
2D TEE 3D TEE0
2
4
6
8
10
LV
OT
Are
a (c
m2 )
Figure 5: Scatter plot comparing LVOT area using 2D TEE and 3D TEE. LVOT
CSA measurement by 3D TEE was significantly more than that measured by 2D
TEE.
LVOT- Left ventricular outflow tract, 2D-Two dimensional, 3D- Three
dimensional, TEE-Transesophageal echocardiography.
Results
46
2D TEE 3D TEE0
2
4
6
8
10
LV
OT
Are
a (c
m2 )
Figure 6 - Box and Whisker plot comparing LVOT area using 2D TEE and 3D
TEE. LVOT CSA measurement by 3D TEE was significantly more than that
measured by 2D TEE.
LVOT- Left ventricular outflow tract, 2D-Two dimensional,
3D-Three dimensional, TEE-Transesophageal echocardiography.

Results
47
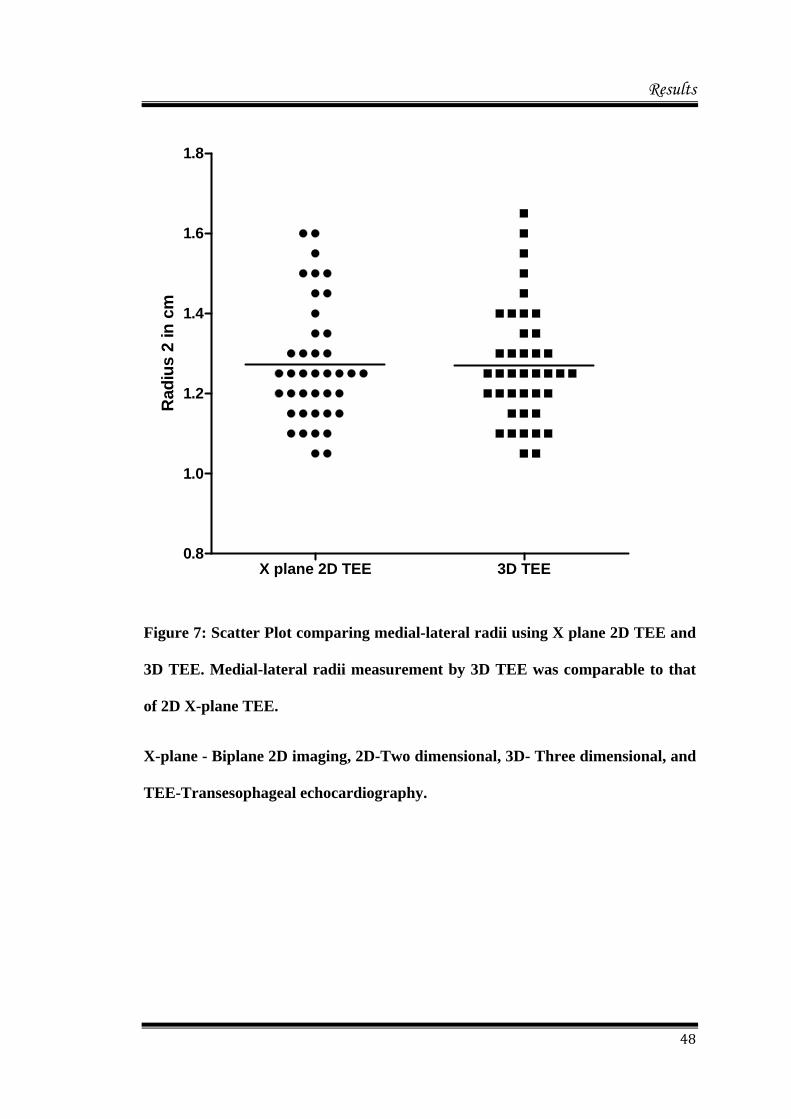
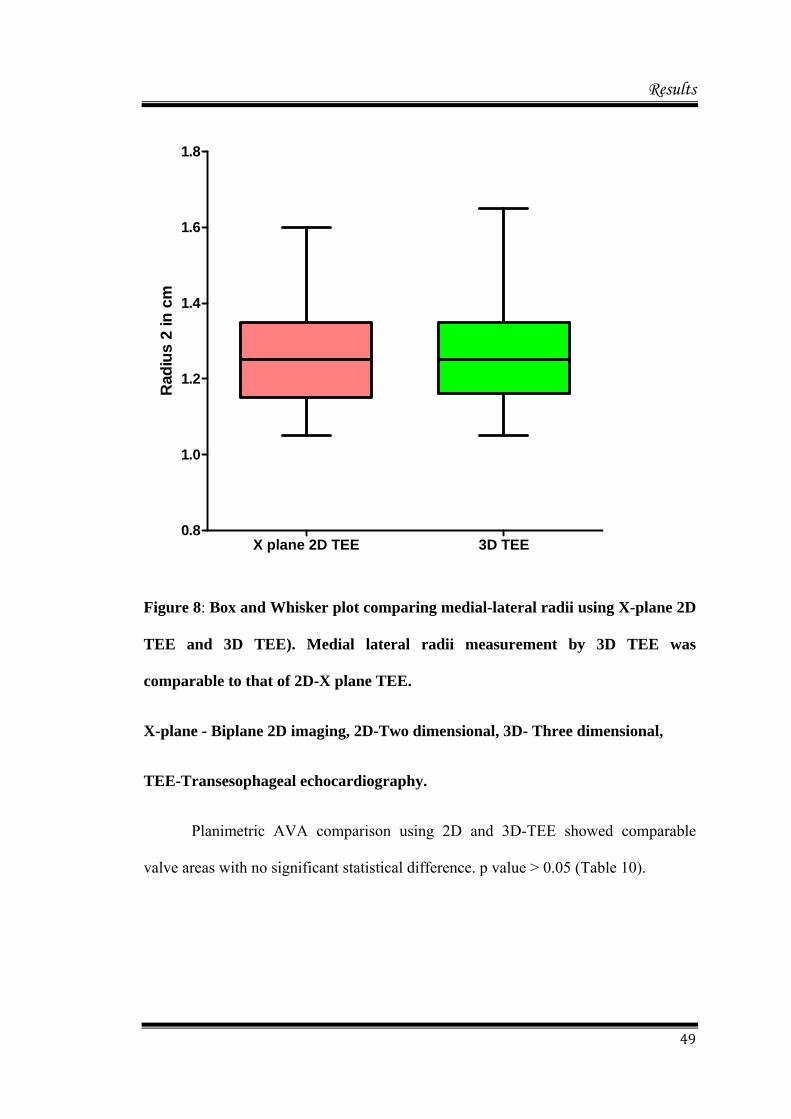
The medial–lateral diameter of LVOT by 3D-TEE (median 2.54 cm,
interquartile range 2.3 to 2.7) was almost comparable with X-plane LVOT diameters
(median 2.58 cm, interquartile range 2.32 to 2.78)measured by 2D-TEE (p =0.817).
This is documented in Table 9 as well as Figure 7 and 8.
Observation
Number
of
patients
Medial-lateral Diameter (cm)
Mean SD Median 25th
Percentile
75th
percentile
X plane 2D
TEE 40 2.54 0.30 2.5 2.3 2.7
3D TEE 40 2.58 0.42 2.5 2.32 2.78
Table 9: Comparison of medial-lateral diameter of LVOT by 2D X-plane and
3D TEE, p= 0.81(Statistically insignificant).
X plane - Biplane 2D imaging, 2D-Two dimensional, 3D- Three dimensional, and
TEE-Transesophageal echocardiography.
Results
48
X plane 2D TEE 3D TEE0.8
1.0
1.2
1.4
1.6
1.8R
adiu
s 2
in c
m
Figure 7: Scatter Plot comparing medial-lateral radii using X plane 2D TEE and
3D TEE. Medial-lateral radii measurement by 3D TEE was comparable to that
of 2D X-plane TEE.
X-plane - Biplane 2D imaging, 2D-Two dimensional, 3D- Three dimensional, and
TEE-Transesophageal echocardiography.
Results
49
X plane 2D TEE 3D TEE0.8
1.0
1.2
1.4
1.6
1.8R
adiu
s 2
in c
m
Figure 8: Box and Whisker plot comparing medial-lateral radii using X-plane 2D
TEE and 3D TEE). Medial lateral radii measurement by 3D TEE was
comparable to that of 2D-X plane TEE.
X-plane - Biplane 2D imaging, 2D-Two dimensional, 3D- Three dimensional,
TEE-Transesophageal echocardiography.
Planimetric AVA comparison using 2D and 3D-TEE showed comparable
valve areas with no significant statistical difference. p value > 0.05 (Table 10).

Results
50
Observation Number
of patients
AVA (cm2)
Mean SD Median 25th
Percentile 75th
percentile
Planimetry AVA-2D
40 0.74 0.21 0.74 0.57 0.88
Planimetry AVA-3D
40 0.72 0.21 0.70 0.54 0.87
TABLE: 10. Comparison of planimetric AVA by 2D and 3D-TEE, p=0.176
(Wilcoxon signed rank test), statistically insignificant.
AVA-Aortic valve area, 2D-Two dimensional, 3D-Three dimensional.
Comparison of Planimetric AVA (2D) with Continuity Equation AVA (2D)
showed p-value of 0.037 which was statistically significant (Table 11). This
difference in result probably occurred due to the measurement of effective orifice area
(EOA) by continuity equation and geometric orifice area (GOA) by planimetry.
Observation Number
of patients
AVA (cm2)
Mean SD Median 25th
Percentile 75th
percentile
Planimetry AVA -2D
40 0.74 0.21 0.74 0.57 0.88
CE-AVA 2D 40 0.68 0.24 0.66 0.47 0.84
TABLE: 11. Comparison of planimetric AVA by 2D and CE- AVA by 2D,
p=0.037(Wilcoxon signed rank test), statistically significant.
CE: Continuity Equation, AVA-Aortic valve area, 2D-Two dimensional, 3D-
Three dimensional.
Results
51
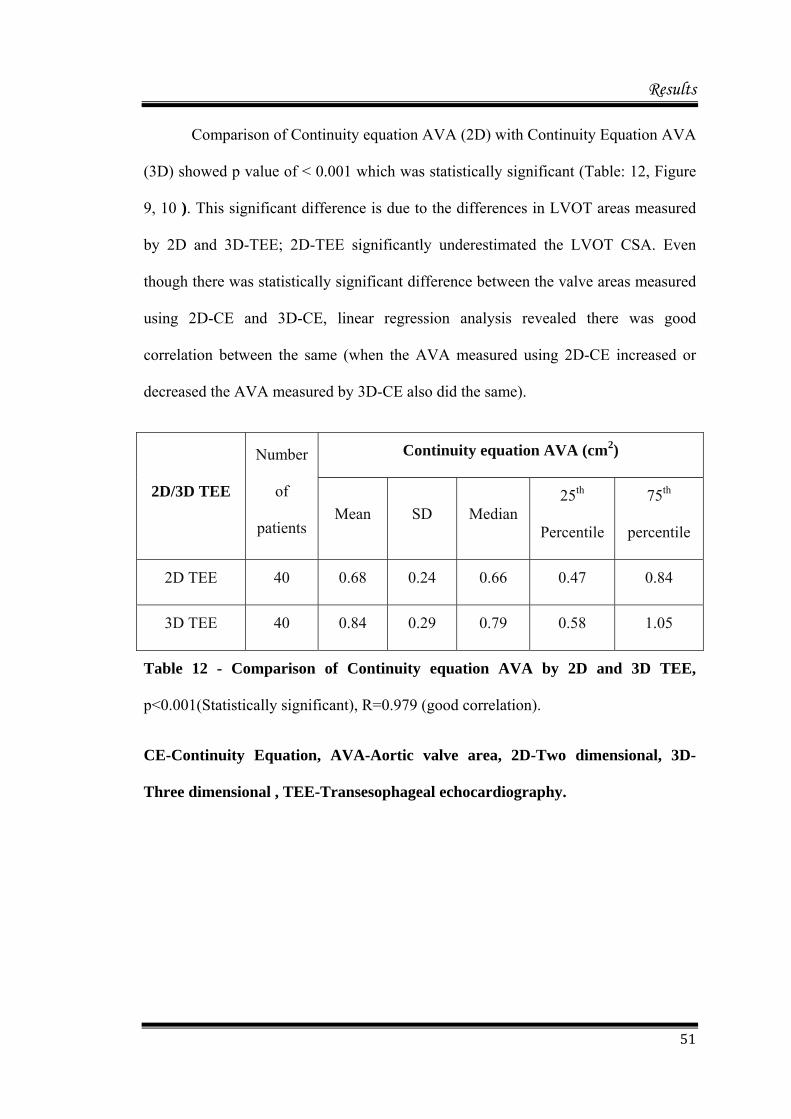
Comparison of Continuity equation AVA (2D) with Continuity Equation AVA
(3D) showed p value of < 0.001 which was statistically significant (Table: 12, Figure
9, 10 ). This significant difference is due to the differences in LVOT areas measured
by 2D and 3D-TEE; 2D-TEE significantly underestimated the LVOT CSA. Even
though there was statistically significant difference between the valve areas measured
using 2D-CE and 3D-CE, linear regression analysis revealed there was good
correlation between the same (when the AVA measured using 2D-CE increased or
decreased the AVA measured by 3D-CE also did the same).
2D/3D TEE
Number
of
patients
Continuity equation AVA (cm2)
Mean SD Median 25th
Percentile
75th
percentile
2D TEE 40 0.68 0.24 0.66 0.47 0.84
3D TEE 40 0.84 0.29 0.79 0.58 1.05
Table 12 - Comparison of Continuity equation AVA by 2D and 3D TEE,
p<0.001(Statistically significant), R=0.979 (good correlation).
CE-Continuity Equation, AVA-Aortic valve area, 2D-Two dimensional, 3D-
Three dimensional , TEE-Transesophageal echocardiography.
Results
52
2D TEE 3D TEE0.0
0.5
1.0
1.5
2.0
Co
nti
nu
ity
equ
atio
n A
VA
(cm
2)
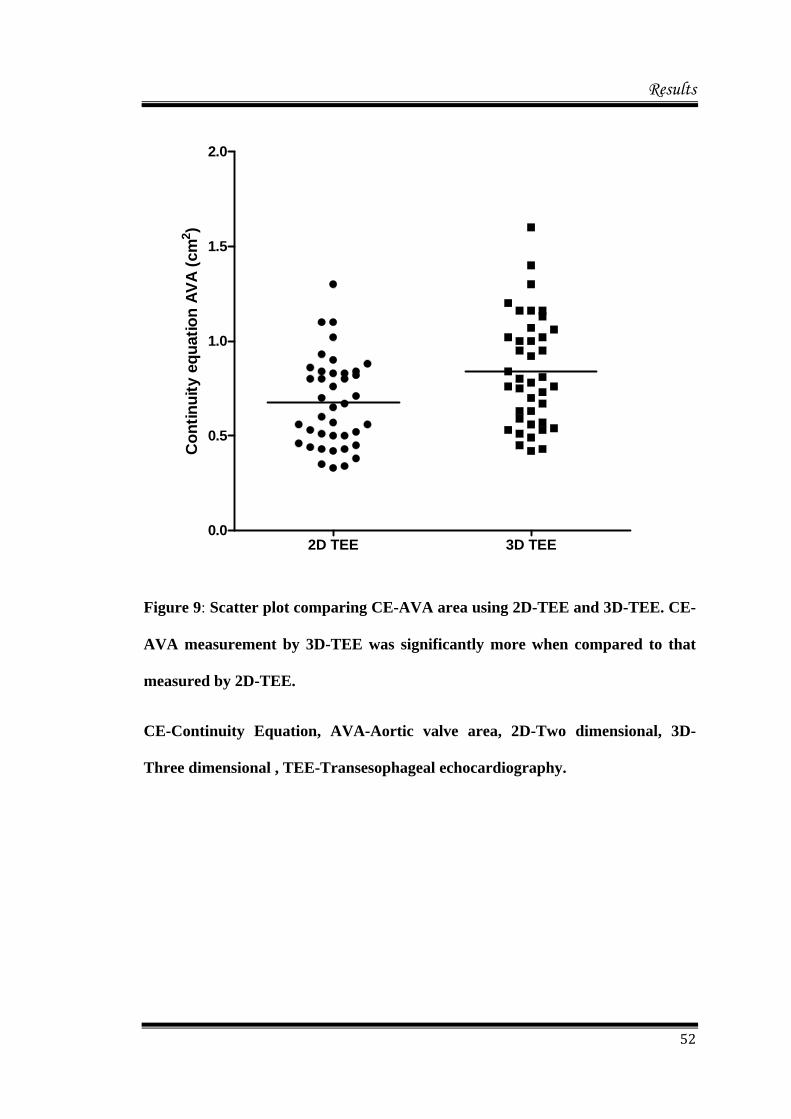
Figure 9: Scatter plot comparing CE-AVA area using 2D-TEE and 3D-TEE. CE-
AVA measurement by 3D-TEE was significantly more when compared to that
measured by 2D-TEE.
CE-Continuity Equation, AVA-Aortic valve area, 2D-Two dimensional, 3D-
Three dimensional , TEE-Transesophageal echocardiography.

Results
53
2D TEE 3D TEE0.0
0.5
1.0
1.5
2.0
Co
nti
nu
ity
equ
atio
n A
VA
(cm
2)
Figure 10 - Box and Whisker plot comparing CE-AVA area using 2D-TEE and
3D-TEE. CE-AVA measurement by 3D-TEE was significantly more when
compared to that measured by 2D-TEE.
CE-Continuity Equation, AVA-Aortic valve area, 2D-Two dimensional, 3D-
Three dimensional, TEE-Transesophageal echocardiography.
Results
54
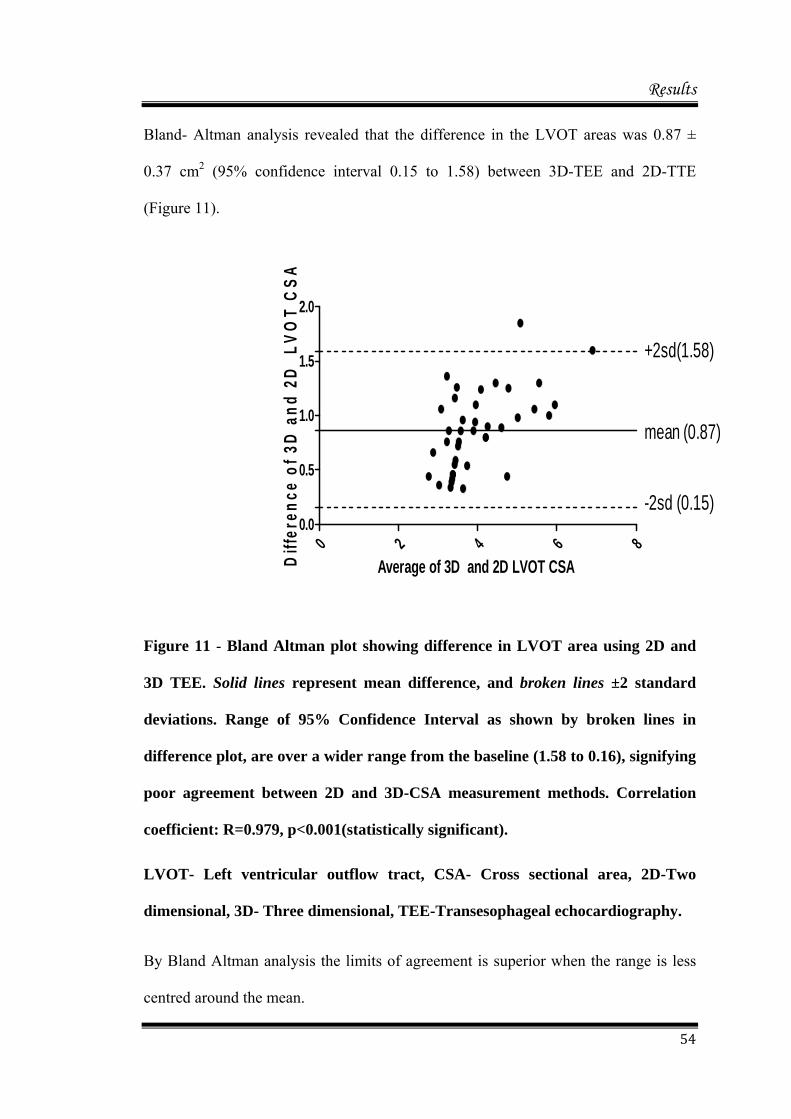
Bland- Altman analysis revealed that the difference in the LVOT areas was 0.87 ±
0.37 cm2 (95% confidence interval 0.15 to 1.58) between 3D-TEE and 2D-TTE
(Figure 11).
0 2 4 6 80.0
0.5
1.0
1.5
2.0
+2sd(1.58)
-2sd (0.15)
mean (0.87)
Average of 3D and 2D LVOT CSADiff
eren
ce o
f 3D
an
d 2
D
LV
OT
CS
A
Figure 11 - Bland Altman plot showing difference in LVOT area using 2D and
3D TEE. Solid lines represent mean difference, and broken lines ±2 standard
deviations. Range of 95% Confidence Interval as shown by broken lines in
difference plot, are over a wider range from the baseline (1.58 to 0.16), signifying
poor agreement between 2D and 3D-CSA measurement methods. Correlation
coefficient: R=0.979, p<0.001(statistically significant).
LVOT- Left ventricular outflow tract, CSA- Cross sectional area, 2D-Two
dimensional, 3D- Three dimensional, TEE-Transesophageal echocardiography.
By Bland Altman analysis the limits of agreement is superior when the range is less
centred around the mean.

Results
55
Comparison of antero-posterior aortic annulus measurement with (2D) and
(3D) methods, showed a p value of 0.24 which was statistically not significant. (Table
13)
Observation
Number
of
patients
ANNULUS
Mean SD Median 25th
Percentile
75th
percentile
2D TEE 40 21.44 1.89 21.00 20.00 22.40
3D TEE 40 21.56 1.68 21.05 20.50 22.45
Table 13 - Comparison of Aortic annulus by 2D and 3D TEE, p=0.240
(Statistically not significant).
2D-Two dimensional, 3D-Three dimensional, TEE-Transesophageal
echocardiography.
Considering the mean of all 40 patients, 2D planimetry (0.74 cm2 ± 0.21), 3D
planimetry (0.72 cm2 ± 0.29) and 2D continuity equation AVA (0.68 cm2 ± 0.24)
underestimated the AVA in comparison to 3D CE-AVA (0.84 cm2± 0.29). The
underestimation was statistically significant with a p value of < 0.05 between each
methods. Also 95% limits of agreement, as assessed by Bland –Altman method was
low for LVOT-CSA measured by 2D -TEE in comparison to 3D TEE [figure 11].
CE-AVA measured by 2D-TEE was slightly less (0.68 cm2 ± 0.24) in
comparison to AVA measured by 3D planimetry (0.71 cm2 ± 0.21), even though there
was no statistical difference between the same.

Discussion
56
DISCUSSION
Discussion
57
DISCUSSION
Ours is the first prospective study which compared AVA assessment by 3D-
TEE with X-plane 2D TEE and CE based aortic valve area measurement, in the intra-
operative period. There were no particular complications during any of the TEE
examinations. Our success rate of 2D measurement were 91%, which is comparable to
or even higher than conventional 2D planimetry done by the previous studies.6 There
was excellent inter observer agreement for all the methods of AVA measurements.
We made a comparison of peak and mean gradients done by the anaesthesiologist in
the peri-operative with the same obtained by cardiologist in the pre-operative phase
using TTE. There was a statistically significant difference between both the
measurements. It indicates that the hemodynamic alteration caused by our surgical or
anaesthetic manipulations could have influenced the measurement of gradients for AS
severity classification.
We considered 3D planimetry as the reference standard for comparison based
on interpretations from previous studies which showed superiority of 3D-TEE 98, 99
and computerised tomography (CT) 12, 13 over 2D-echocardiography. In comparison to
3D TEE, 2D TEE planimetry overestimated the AVA in our cohorts, but it was
statistically not significant.
2D-TEE often makes an oblique cut through the valve leaflets rather than at
the tip of the leaflets. Consequently, it is often technically difficult to capture the tip
of the aortic valve leaflets at their maximal systolic opening using 2D-TEE with a
fixed imaging plane.57-59 In addition, 2D-TEE has the disadvantages of more fuzzy
contours, shadow phenomena, and motion artefacts. The gain setting may affect the
Discussion
58
measured AVA, especially in severely calcified valves.59 Inability to localise the tip of
AV leaflets in severe calcific AS may be the cause for overestimation of AVA when
2D echocardiography is used. Usage of X-plane method can overcome the inability to
localise the tip, but application of the same in our study could not prevent the
overestimation of AVA in comparison to 3D-TEE.
Effective orifice area differs from geometric orifice area. It occurs distal to
actual orifice, were blood flows with maximal velocity and hence the blood column is
maximally contracted. In AS the effect is pronounced and the functionally measured
AVA should be slightly lower than anatomical AVA. This principle can be the reason
behind slightly lower AVA measured by CE-2D in comparison to 2D/3D planimetry
in our study.
The European Association of Echocardiography/American Society of
Echocardiography guidelines now advocate LVOT diameters derived from 2-
dimensional echocardiography to be used to estimate a continuity equation-based
AVA.2 However, the LVOT actually could be of elliptical shape, with a shorter
anteroposterior diameter, casting a doubt on the accuracy of a continuity equation
based AVA calculated by the assumption of a circular geometry. Our findings are
similar to that of previous studies regarding LVOT geometry, which reported an
elliptical LVOT with shorter anteroposterior diameter. 4,7,77
Additionally, the ellipticity was able to be predicted using 2-dimensional X-
plane parameters in our study. Therefore, 3D-TEE or X-plane 2D TEE should be used
to evaluate LVOT geometry prior to cases of percutaneous aortic valve implantation.
Discussion
59
Accurate assessment of LVOT geometry could affect the success of this procedure
because the apical end of the new valve is attached to the LVOT.
The accuracy of Continuity equation-based AVA is important, particularly
when severe calcification of the aortic valve makes it difficult to measure the
planimetric AVA. The continuity equation based calculation of the AVA is “flow
corrected,” in other words, it is not affected by hemodynamic variations. The greatest
source of error is the assumption of the circular shape of LVOT and this was clearly
demonstrated in our study. In fact, 4 of the patients in our series had suboptimal aortic
valve images by 2D-TEE for planimetric AVA estimation. However, we
demonstrated that the calculation of continuity equation-based AVA using 2-
dimensional echocardiography underestimated the real AVA owing to the elliptical
shape of LVOT with its shorter anteroposterior diameter. Therefore, the evaluation of
the LVOT area with 3D-TEE would be of great importance, especially when patients
with aortic stenosis have discrepancy regarding the severity of the disease when
assessed using different techniques such as measurement of mean pressure gradient,
continuity equation-based AVA, and planimetry. In our study, 1/3rd of patients found
to have severe aortic stenosis using 2-dimensional continuity equation-based methods
were reclassified as having moderate AS when assessed by 3D-TEE. The correct
assessment of the severity of aortic stenosis using 3D-TEE might result in fewer
patients being erroneously diagnosed as having severe disease. This may avoid
unnecessary operations or procedures in patients with unclear symptoms.
Recently, multidetector computed tomography and magnetic resonance
imaging also have been used to visualize the morphology and motion of the aortic
valve and precisely measure the aortic valve opening area. Planimetric AVA using
Discussion
60
multidetector computed tomography and magnetic resonance imaging have been
compared with TTE and TEE; both modalities have been shown to provide an
accurate assessment of the AVA78, 79. The planimetric LVOT area measured using
multidetector computed tomography was more than that quantified using 2D-TTE in
patients with calcified aortic valve disease. Thus, the continuity equation-based AVA
using TTE underestimated the planimetric AVA compared to multidetector CT.14
However, multidetector CT with contrast study is contraindicated in patients with
renal failure and hypersensitivity to iodine contrast, and magnetic resonance imaging
cannot be used in patients with a pacemaker or implanted cardioverter defibrillator.
Furthermore, multidetector CT without contrast study needs a flow Doppler data by
echocardiography to calculate the continuity equation-based AVA. However, 3D-TEE
can simultaneously evaluate the planimetric and continuity equation-based AVA and
provide imaging of the 3-D geometry of the LVOT. Also, unlike multidetector CT or
magnetic resonance imaging, RT 3D-TEE allows on-site or live evaluation of LVOT
geometry and AV during Transcatheter aortic valve implantation to prevent
paravalvular regurgitation after the procedure.
We, in our study, found that it was feasible to measure the LVOT area using
X-plane technique. The newer matrix array probes allow simultaneous orthogonal
plane imaging so that a secondary 2D image can be visualized simultaneously at a
plane orthogonal to the primary imaging plane.80 Further, the secondary plane can be
tilted in the vertical or lateral axis to view a structure of interest. Use of simultaneous
orthogonal plane imaging with tilt from the ME aortic valve long-axis view allows
visualization of the LVOT in its short axis. Planimetry of this 2D image, which may
not assume a circular structure, can be potentially more accurate since it is measured
Discussion
61
at the same beat at a similar point in the cardiac cycle to avoid variation in LVOT
volumes. Thus, in our study, we demonstrated the utility of simultaneous orthogonal
plane imaging to obtain a 2D short-axis view of the LVOT for calculating LVOT
CSA. There was good agreement between the 3D and the 2D X-plane planimetry
assessments of the LVOT area. Measurement is done with live imaging (X-plane) and
hence quicker compared to 3D imaging. The frame rate with 2D-TEE imaging is
higher than obtained with 3D-TEE. However as 2D-TEE calculates the LVOT CSA
assuming a circular shape, it under estimates the LVOT CSA. Whereas, X-plane 2D
TEE enables accurate visualisation of LVOT in short axis and offers better temporal
resolution thereby providing comparable measurements of LVOT-CSA with 3D TEE.
This technique can be used to measure the area when the geometry of the LVOT is in
doubt and can be accomplished more quickly than with 3D planimetry.
In our study, the anteroposterior aortic annular diameters were also compared
using 2D and 3D TEE. We found statistically insignificant difference between the
same. Measurement of the annular diameter in both the anteroposterior and medial-
lateral planes is of paramount importance during Transcatheter Aortic Valve
Implantation (TAVI) where the annular geometry and the LVOT geometry are key
factors deciding the seating of the valve and thereby decreasing the incidence of
paravalvular leaks.
One patient in our study who was worked up for TAVI and finally ended up
in surgical AVR had CT imaging of aortic root, annulus and LVOT which correlated
well with our 3D TEE and 2D X-plane findings of LVOT CSA and LVOT geometry.
The CE-derived AVA (3D) in that patient using TEE was more comparable to the
Discussion
62
planimetric-AVA derived using CT imaging, than to 3D-planimetric AVA obtained
with TEE.
To summarise, with supportive evidence from the available literature we made the
below mentioned interpretations.
(1) 2D-TEE underestimated the LVOT areas relative to 3D-TEE.
(2) LVOT shape was elliptical and transverse diameter was longer than AP diameter.
(3) The 3D-TEE yielded a larger continuity equation-based AVA than did the 2D-
TEE.
(4) The aortic AP annular diameter measured using 2D and 3D-TEE were almost
similar and the difference was statistically insignificant.
(5) Continuity equation-based AVA by 2D-TEE underestimated planimetric AVA by
2D (statistically significant).
(6) Although 3D planimetry AVA is considered as the reference method ref, we found
that continuity equation-derived AVA by 3D-TEE was more than that obtained with
3D planimetry and the difference is statistically significant.
Further studies are required with more subjects to support our interpretations.
Discussion
63
Limitations
1. No true standard reference technique is available to determine the LVOT area
and AVA. The essential message in our study is that the continuity equation-
based AVA derived from 3D-TEE may not be consistent with the planimetry
(3D) AVA. Except in one case, we did not have any CT or MRI data to
compare the 3D data derived AVAs.
2. Planimetry and continuity equation-based AVA, at least theoretically, cannot
be identical because the first measures the geometric orifice area and the
second measures the effective orifice area at the vena contracta, which should
result in smaller AVA values.15 The use of the circular assumption of the
LVOT geometry might have contributed in part to the underestimation of
AVA by 2-D continuity equation methods compared to the 3-D CE method.
3. A fewer number of frame-rates in 3D-TEE (19.6 ± 6.6/s) might cause an
underestimation of the AVA in relation to 2D-TEE (50 to 100/s). However,
motion of the severely calcified aortic valve can be limited compared to
normal; thus, the effect of the fewer frame-rates might not reduce the accuracy
of the planimetric AVA measurement using 3D-TEE.
4. We did not perform catheter-based measurements of AVA using Gorlin’s
formula, which is considered a gold standard for the assessment of AVA.
Conclusion
64
CONCLUSION

Conclusion
65
CONCLUSION
All methods of AVA assessment are feasible and reproducible considering the
excellent inter-observer variability among them.
1. a) 3D-TEE yielded a larger continuity equation-based AVA than did 2D-TEE
and the difference was statistically significant.
b) 3D planimetry AVA was slightly less when compared to 2D planimetry
AVA and the difference was not statistically significant.
2. The 3D CE derived AVA was significantly more when compared to AVA
derived by 3D-planimetry, 2D-planimetry, and 2D-CE and the differences
were statistically significant.
3. 3D-TEE showed that the LVOT was elliptical in shape in all the cases and its
area can be measured with direct 3D planimetry as well as with the X-plane
2D. Compared with 3D-TEE, 2D-TEE imaging underestimated the LVOT
area (because LVOT was assumed to be circular), which in turn resulted in
overestimation of the degree of AS. The use of 3D-TEE resulted in revision of
the severity grades of AS in a significant number of patients.
4. The aortic AP annular diameter measured using 2D and 3D-TEE were almost
similar and the difference was statistically insignificant.
Conclusion
66
We conclude that 3D-TEE AVA measurement using continuity equation as well
as AVA measurement using orthogonal plane imaging of LVOT CSA using X-
plane has the potential to impact intraoperative surgical decision making in
patients with Aortic Stenosis.

Bibliography
67
BIBLIOGRAPHY

Bibliography
68
BIBLIOGRAPHY
1. Bonow RO, Carabello BA, Chatterjee K, de Leon AC Jr, Faxon DP, Freed MD,
Gaasch WH, Lytle BW, Nishimura RA, O’Gara PT, O’Rourke RA, Otto CM, Shah
PM, Shanewise JS, Smith SC Jr, Jacobs AK, Adams CD, Anderson JL, Antman EM,
Fuster V, Halperin JL, Hiratzka LF, Hunt SA, Lytle BW, Nishimura R, Page RL,
Riegel B. ACC/AHA guidelines for the management of patients with valvular heart
disease: a report of the American College of Cardiology/American Heart
Association Task Force on Practice Guidelines (writing committee to revise the 1998
guidelines for the management of patients with valvular heart disease) developed in
collaboration with the Society of Cardiovascular Anesthesiologists endorsed by the
Society for Cardiovascular Angiography and Interventions and the Society of
Thoracic Surgeons. J Am Coll Cardiol 2006; 2006:e1– e148.
2. Baumgartner H, Hung J, Bermejo J, Chambers JB, Evangelista A, Griffin BP, Iung
B, Otto CM, Pellikka PA, Quiñones M; American Society of Echocardiography,
European Association of Echocardiography. Echocardiographic assessment of valve
stenosis: EAE/ASE recommendations for clinical practice. J Am Soc Echocardiogr.
2009; 22:1–23.
3. Doddamani S, Bello R, Friedman MA, Banerjee A, Bowers JH Jr, Kim B,
Vennalaganti PR, Ostfeld RJ, Gordon GM, Malhotra D, Spevack DM.
Demonstration of left ventricular outflow tract eccentricity by real time 3D
echocardiography: implications for the determination of aortic valve area.
Echocardiography. 2007; 24:860–866.
4. Doddamani S, Grushko MJ, Makaryus AN, Jain VR, Bello R, Friedman MA,
Ostfeld RJ, Malhotra D, Boxt LM, Haramati L, Spevack DM. Demonstration of left
ventricular outflow tract eccentricity by 64-slice multi-detector CT. Int J Cardiovasc
Imaging. 2009;25:175–181.
Bibliography
69
5. Burgstahler C, Kunze M, L€offler C, Gawaz MP, Hombach V, Merkle N.
Assessment of left ventricular outflow tract geometry in non-stenotic and stenotic
aortic valves by cardiovascular magnetic resonance. J Cardiovasc Magn Reson.
2006; 8: 825–9.
6. Saitoh TT, Shiota MM, Izumo MM, et al. Comparison of left ventricular outflow
geometry and aortic valve area in patients with aortic stenosis by 2-dimensional
versus 3-dimensional echocardiography. Am J Cardiol. 2012; 109: 1626–31.
7. Otani K, Takeuchi M, Kaku K, et al. Assessment of the aortic root using real-time
3D transesophageal echocardiography. Circ J. 2010; 74: 2649–57.
8. Mahmood F, Fritsch M, Maslow A. Unanticipated mild-to moderate aortic stenosis
during coronary artery bypass graft surgery: scope of the problem and its
echocardiographic evaluation. J Cardiothorac Vasc Anesth. 2009; 23: 869–77.
9. Bouvier EE, Logeart DD, Sablayrolles J-LJ, et al. Diagnosis of aortic valvular
stenosis by multislice cardiac computed tomography. Eur Heart J. 2006; 27:3033–8.
10. Schoenhagen P, Tuzcu EM, Kapadia SR, Desai MY, Svensson LG. Three-
dimensional imaging of the aortic valve and aortic root with computed tomography:
new standards in an era of transcatheter valve repair/implantation. Eur Heart J.
2009; 30:2079–86.
11. Tops LF, Wood DA, Delgado V, et al. Noninvasive evaluation of the aortic root with
multislice computed tomography. J Am Coll Cardiol Img. 2008; 1:10-0.
12. Wood DAD, Tops LFL, Mayo JRJ, et al. Role of multislice computed tomography
in transcatheter aortic valve replacement. Am J Cardiol. 2009; 103:1295– 301.
13. Tanaka KK, Makaryus ANA, Wolff SDS. Correlation of aortic valve area obtained
by the velocity-encoded phase contrast continuity method to direct planimetry using
cardiovascular magnetic resonance. J Cardiovasc MagnReson. 2007; 9:799–805.
Bibliography
70
14. Utsunomiya H, Yamamoto H, Horiguchi J, et al. Underestimation of aortic valve
area in calcified aortic valve disease: effects of left ventricular outflow tract
ellipticity. Int J Cardiol. 2012; 157:347–53.
15. Menzel T, Mohr-Kahaly S, Wagner S, Fischer T, Bruckner A, Meyer J. Calculation
of left ventricular outflow tract area using three-dimensional echocardiography.
Influence on quantification of aortic valve stenosis. Int J Card Imaging. 1998;
14:373–9.
16. Gillinov AM, Garcia MJ. When is concomitant aortic valve replacement indicated in
patients with mild to moderate stenosis undergoing coronary revascularization? Curr
Cardiol Rep. 2005; 7: 101–4.
17. Selzer A. Changing aspects of the natural history of valvular aortic stenosis. N Engl
J Med. 1987; 317:91–8.
18. Stewart BF, Siscovick D, Lind BK, et al. Clinical factors associated with calcific
aortic valve disease. Cardiovascular Health Study. J Am Coll Cardiol. 1997;
29:630–4.
19. Turina J, Hess O, Sepulcri F, Krayenbuehl HP. Spontaneous course of aortic valve
disease. Eur Heart J. 1987; 8:471–483.
20. Horstkotte D, Loogen F. The natural history of aortic valve stenosis. Eur Heart J.
1988; 9(Suppl E):57–64.
21. Rahimtoola SH. Perspective on valvular heart disease: an update. J Am Coll Cardiol.
1989; 14:1–23.
22. Gorlin R, Gorlin SG. Hydraulic formula for calculation of the area of the stenotic
mitral valve, other cardiac valves, and central circulatory shunts. I. Am Heart J.
1951; 41:1–29.
23. Cannon SR, Richards KL, Crawford M. Hydraulic estimation of stenotic orifice
area: a correction of the Gorlin formula. Circulation. 1985; 71:1170–1178.
24. Wood P. Aortic stenosis. Am J Cardiol. 1958; 1:553–571.

Bibliography
71
25. Braunwald E, Morrow AG. Obstruction to left ventricular outflow. Current criteria
for the selection of patients for operation. Am J Cardiol. 1963; 12:53–59.
26. Rapaport E. Natural history of aortic and mitral valve disease. Am J Cardiol. 1975;
35:221–227.
27. Skjaerpe T, Hegrenaes L, Hatle L. Noninvasive estimation of valve area in patients
with aortic stenosis by doppler ultrasound and two-dimensional echocardiography.
Circulation. 1985; 72:810–818.
28. Otto CM, Pearlman AS, Comess KA, Reamer RP, Janko CL, Huntsman LL.
Determination of the stenotic aortic valve area in adults using doppler
echocardiography. J Am Coll Cardiol. 1986; 7: 509–517.
29. Nishimura RA, Tajik AJ. Quantitative hemodynamics by Doppler echocardiography:
a noninvasive alternative to cardiac catheterization. Prog Cardiovasc Dis. 1994;
36:309–342.
30. Levine RA, Jimoh A, Cape EG, McMillan S, Yoganathan AP, Weyman AE.
Pressure recovery distal to a stenosis: potential cause of gradient “overestimation”
by doppler echocardiography. J Am Coll Cardiol. 1989; 13:706–715.
31. Oh JK, Taliercio CP, Holmes DR Jr, et al. Prediction of the severity of aortic
stenosis by doppler aortic valve area determination: prospective doppler-
catheterization correlation in 100 patients. J Am Coll Cardiol. 1988; 11: 1227–1234.
32. Kitabatake A, Fujii K, Tanouchi J, et al. Doppler echocardiographic quantitation of
cross-sectional area under various hemodynamic conditions: an experimental
validation in a canine model of supravalvular aortic stenosis. J Am Coll Cardiol.
1990; 15: 1654–1661.
33. Burwash IG, Thomas DD, Sadahiro M, et al. Dependence of gorlin formula and
continuity equation valve areas on transvalvular volume flow rate in valvular aortic
stenosis. Circulation. 1994; 89:827–835.
Bibliography
72
34. Adegunsoye A, Mundkur M, Nanda NC, Hage FG. Echocardiographic evaluation of
calcific aortic stenosis in the older adult. Echocardiography. 2011; 28:117–129.
35. Baumgartner H, Kratzer H, Helmreich G, Kuehn P. Determination of aortic valve
area by doppler echocardiography using the continuity equation: a critical
evaluation. Cardiology. 1990; 77:101–111.
36. Evangelista A, Garcia-Dorado D, Garcia-Dorado D, Garcia del Castillo H,
Gonzalez-Alujas T, Soler-Soler J. Cardiac index quantification by doppler
ultrasound in patients without left ventricular outflow tract abnormalities. J Am Coll
Cardiol. 1995; 25:710–716.
37. Otto CM, Pearlman AS. Doppler echocardiography in adults with symptomatic
aortic stenosis. Diagnostic utility and cost-effectiveness. Arch Intern Med. 1988;
148:2553–2560.
38. Garcia D, Kadem L. What do you mean by aortic valve area: geometric orifice area,
effective orifice area, or gorlin area? J Heart Valve Dis. 2006; 15:601–608.
39. Gilon D, Cape EG, Handschumacher MD, et al. Effect of three-dimensional valve
shape on the hemodynamics of aortic stenosis: three-dimensional echocardiographic
stereo lithography and patient studies. J Am Coll Cardiol. 2002; 40:1479–1486.
40. Bach DS. Echo/doppler evaluation of hemodynamics after aortic valve replacement:
principles of interrogation and evaluation of high gradients. JACC Cardiovascular
Imaging. 2010; 3:296–304.
41. Lancellotti P, Karsera D, Tumminello G, Lebois F, Pierard LA. Determinants of an
abnormal response to exercise in patients with asymptomatic valvular aortic stenosis.
Eur J Echocardiogr. 2008; 9:338–343.
42. Lancellotti P, Lebois F, Simon M, Tombeux C, Chauvel C, Pierard LA. Prognostic
importance of quantitative exercise doppler echocardiography in asymptomatic
valvular aortic stenosis. Circulation. 2005; 112:I377–I382.
Bibliography
73
43. Marechaux S, Hachicha Z, Bellouin A, et al. Usefulness of exercise-stress
echocardiography for risk stratification of true asymptomatic patients with aortic
valve stenosis. Eur Heart J. 2010; 31:1390–1397.
44. Otto CM, Burwash IG, Legget ME, et al. Prospective study of asymptomatic
valvular aortic stenosis. Clinical, echocardiographic, and exercise predictors of
outcome. Circulation. 1997; 95:2262–2270.
45. Amato MC, Moffa PJ, Werner KE, Ramires JA. Treatment decision in asymptomatic
aortic valve stenosis: role of exercise testing. Heart. 2001; 86:381–386.
46. Das P, Rimington H, Smeeton N, Chambers J. Determinants of symptoms and
exercise capacity in aortic stenosis: a comparison of resting haemodynamics and
valve compliance during dobutamine stress. Eur Heart J. 2003; 24:1254–1263.
47. Cooper R, Ghali J, Simmons BE, Castaner A. Elevated pulmonary artery pressure.
An independent predictor of mortality. Chest. 1991; 99:112–120.
48. McHenry MM, Rice J, Matlof HJ, Flamm MD Jr. Pulmonary hypertension and
sudden death in aortic stenosis. Br Heart J.1979; 41:463–467.
49. Carnero-Alcazar M, Reguillo-Lacruz F, Alswies A, Villagran-Medinilla E, Maroto-
Castellanos LC, Rodriguez-Hernandez J. Short-and mid-term results for aortic valve
replacement in octogenarians. Interact Cardiovasc Thorac Surg. 2010; 10:549–554.
50. Bonow RO, Carabello B, de Leon AC, et al. ACC/AHA guidelines for the
management of patients with valvular heart disease. Executive summary. A report of
the american college of cardiology/American heart association task force on practice
guidelines (committee on management of patients with valvular heart disease). J
Heart Valve Dis.1998; 7:672–707.
51. Vahanian A, Alfieri O, Andreotti F, et al. Guidelines ESCCfP, Joint Task Force on
the Management of Valvular Heart Disease of the European Society of C, European
Association for Cardio-Thoracic S. Guidelines on the management of valvular heart
disease (version 2012): the joint task force on the management of valvular heart
Bibliography
74
disease of the European society of cardiology (esc) and the European association for
cardio-thoracic surgery (EACTS). Eur J Cardiothorac Surg. 2012; 42:S1–S44.
52. Currie PJ, Seward JB, Reeder GS, et al. Continuous-wave doppler
echocardiographic assessment of severity of calcific aortic stenosis: a simultaneous
doppler-catheter correlative study in 100 adult patients. Circulation. 1985; 71:1162–
1169.
53. Smith MD, Kwan OL, DeMaria AN. Value and limitations of continuous-wave
doppler echocardiography in estimating severity of valvular stenosis. JAMA. 1986;
255:3145–3151.
54. Pellikka PA, Sarano ME, Nishimura RA, et al. Outcome of 622 adults with
asymptomatic, hemodynamically significant aortic stenosis during prolonged follow-
up. Circulation. 2005; 111:3290–3295.
55. Rosenhek R, Klaar U, Schemper M, et al. Mild and moderate aortic stenosis. Natural
history and risk stratification by echocardiography. Eur Heart J. 2004; 25:199–205.
56. Zoghbi WA, Farmer KL, Soto JG, Nelson JG, Quinones MA. Accurate noninvasive
quantification of stenotic aortic valve area by doppler echocardiography.
Circulation. 1986; 73:452–459.
57. Ge S, Warner JG Jr, Abraham TP, et al. Three-dimensional surface area of the aortic
valve orifice by three-dimensional echocardiography: clinical validation of a novel
index for assessment of aortic stenosis. Am Heart J. 1998; 136:1042–1050.
58. Blot-Souletie N, Hebrard A, Acar P, Carrie D, Puel J. Comparison of accuracy of
aortic valve area assessment in aortic stenosis by real time three-dimensional
echocardiography in biplane mode versus two-dimensional transthoracic and
transesophageal echocardiography. Echocardiography. 2007; 24:1065–1072.
59. Kasprzak JD, Nosir YF, Dall’Agata A, et al. Quantification of the aortic valve area
in three-dimensional echocardiographic data sets: analysis of orifice overestimation
resulting from suboptimal cut-plane selection. Am Heart J. 1998; 135:995–1003.
Bibliography
75
60. Handke M, Jahnke C, Heinrichs G, et al. New three-dimensional echocardiographic
system using digital radiofrequency data–visualization and quantitative analysis of
aortic valve dynamics with high resolution: methods, feasibility, and initial clinical
experience. Circulation. 2003; 107:2876–2879.
61. Handke M, Schafer DM, Heinrichs G, Magosaki E, Geibel A. Quantitative
assessment of aortic stenosis by three-dimensional anyplane and three-dimensional
volume-rendered echocardiography. Echocardiography. 2002; 19:45–53.
62. Saura D, de la Morena G, Flores-Blanco PJ, et al. Aortic valve stenosis planimetry
by means of three-dimensional transesophageal echocardiography in the real clinical
setting: feasibility, reliability and systematic deviations. Echocardiography. 2015;
32:508–515.
63. Poh KK, Levine RA, Solis J, et al. Assessing aortic valve area in aortic stenosis by
continuity equation: a novel approach using real-time three-dimensional
echocardiography. Eur Heart J. 2008; 29:2526–2535.
64. Perez de Isla L, Zamorano J, Perez de la Yglesia R, et al. [quantification of aortic
valve area using three-dimensional echocardiography]. Rev Esp Cardiol. 2008;
61:494–500.
65. Cai Q, Ahmad M. Three-dimensional echocardiography in valvular heart disease.
Echocardiography. 2012; 29:88–97.
66. Jainandunsing JS, Mahmood F, Matyal R, et al. Impact of three-dimensional
echocardiography on classification of the severity of aortic stenosis. Ann Thorac
Surg. 2013; 96:1343–1348.
67. Gutierrez-Chico JL, Zamorano JL, Prieto-Moriche E, et al. Real-time three
dimensional echocardiography in aortic stenosis: a novel, simple, and reliable
method to improve accuracy in area calculation. Eur Heart J. 2008; 29:1296–1306.
68. Goland S, Trento A, Iida K, et al. Assessment of aortic stenosis by three-dimensional
echocardiography: an accurate and novel approach. Heart. 2007; 93:801–807.
Bibliography
76
69. Furukawa A, Abe Y, Tanaka C, et al. Comparison of two-dimensional and real-time
three-dimensional transesophageal echocardiography in the assessment of aortic
valve area. J Cardiol. 2012; 59:337–343.
70. Khaw AV, von Bardeleben RS, Strasser C, et al. Direct measurement of left
ventricular outflow tract by transthoracic real-time 3d-echocardiography increases
accuracy in assessment of aortic valve stenosis. Int J Cardiol. 2009; 136:64–71.
71. Sinning JM, Vasa-Nicotera M, Chin D, et al. Evaluation and management of
paravalvular aortic regurgitation after transcatheter aortic valve replacement. J Am
Coll Cardiol. 2013; 62:11–20.
72. Bartunek J, De Bacquer D, Rodrigues AC, et al. Accuracy of aortic stenosis severity
assessment by Doppler echocardiography: importance of image quality. Int J Card
Imaging. 1995; 11:97–104.
73. Rahimtoola SH. Severe aortic stenosis with low systolic gradient: the good and bad
news. Circulation. 2000; 101:1892–4.
74. Segal J, Lerner DJ, Miller DC, et al. When should Doppler-determined valve area be
better than the Gorlin formula? Variation in hydraulic constants in low flow states. J
Am Coll Cardiol. 1987; 9:1294–305.
75. Donal E, Novaro GM, Deserrano D, et al. Planimetric assessment of anatomic valve
area overestimates effective orifice area in bicuspid aortic stenosis. J Am Soc
Echocardiogr 2005; 18:1392–8. 73. Gaspar TT, Adawi SS, Sachner RR, et al. Three-
dimensional imaging of the left ventricular outflow tract: impact on aortic valve area
estimation by the continuity equation. J Am Soc Echocardiogr. 2012; 25:749–57.
76. Sample size tables for clinical studies software.
77. Ng AC, Delgado V, van der Kley F, et al. Comparison of aortic root dimensions and
geometries before and after transcatheter aortic valve implantation by 2- and 3-
dimensional transesophageal echocardiography and multislice computed
tomography. Circ Cardiovasc Imaging. 2010; 3:94 –102.
Bibliography
77
78. LaBounty TM, Sundaram B, Agarwal P, et al. Aortic valve area on 64-MDCT
correlates with transesophageal echocardiography in aortic stenosis. Am J
Roentgenol. 2008; 191:1652–1658.
79. Reant P, Lederlin M, Lafitte S, et al. Absolute assessment of aortic valve stenosis by
planimetry using cardiovascular magnetic resonance imaging: comparison with
transesophageal echocardiography, transthoracic echocardiography, and cardiac
catheterisation. Eur J Radiol. 2006; 59:276 –283.
80. Dwarakanath S, Castresana M, Behr A, et al: The feasibility of simultaneous
orthogonal plane imaging with tilt for short-axis evaluation of the pulmonic valve by
transesophageal echocardiography. Anesth Analg. 2015; 121:624-629.
Annexures
78
ANNEXURES
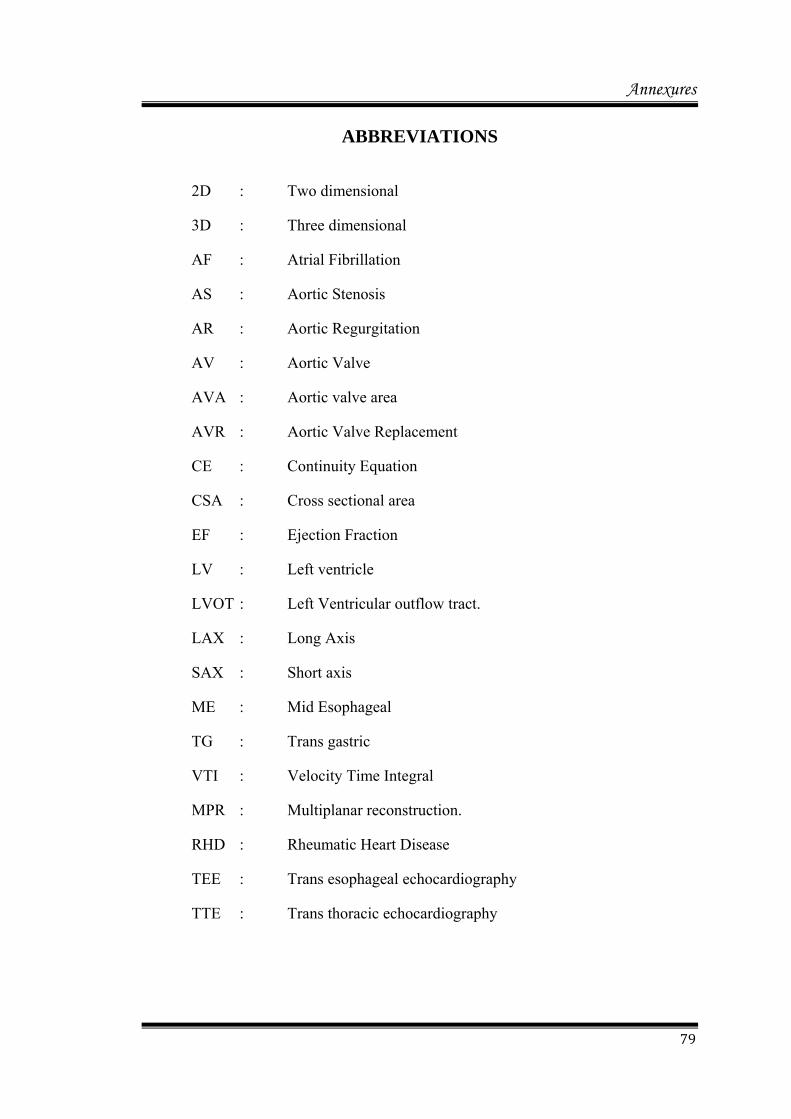
Annexures
79
ABBREVIATIONS
2D : Two dimensional
3D : Three dimensional
AF : Atrial Fibrillation
AS : Aortic Stenosis
AR : Aortic Regurgitation
AV : Aortic Valve
AVA : Aortic valve area
AVR : Aortic Valve Replacement
CE : Continuity Equation
CSA : Cross sectional area
EF : Ejection Fraction
LV : Left ventricle
LVOT : Left Ventricular outflow tract.
LAX : Long Axis
SAX : Short axis
ME : Mid Esophageal
TG : Trans gastric
VTI : Velocity Time Integral
MPR : Multiplanar reconstruction.
RHD : Rheumatic Heart Disease
TEE : Trans esophageal echocardiography
TTE : Trans thoracic echocardiography

Annexures
80
Observation chart Preoperative: Name of the Patient:
Age: Weight:
Sex: Height:
Hospital number: BSA (kg/cm2) :
Diagnosis:
Preoperative assessment:
Comorbidities-
NYHA:
Heart rate and rhythm: Blood Pressure: SPO2:
Pre Op Trans Thoracic Echo (TTE):
PARAMETERS
LV EF
AV PEAK VELOCITY
PEAK GRADIENT
MEAN GRADIENT
AVA BY PLANIMETRY
HEART RATE
INTER VENTRICULAR SEPTAL THICKNESS
POSTERIOR WALL THICKNESS
LV DIASTOLIC FUNCTION
RV FUNCTION
OTHER
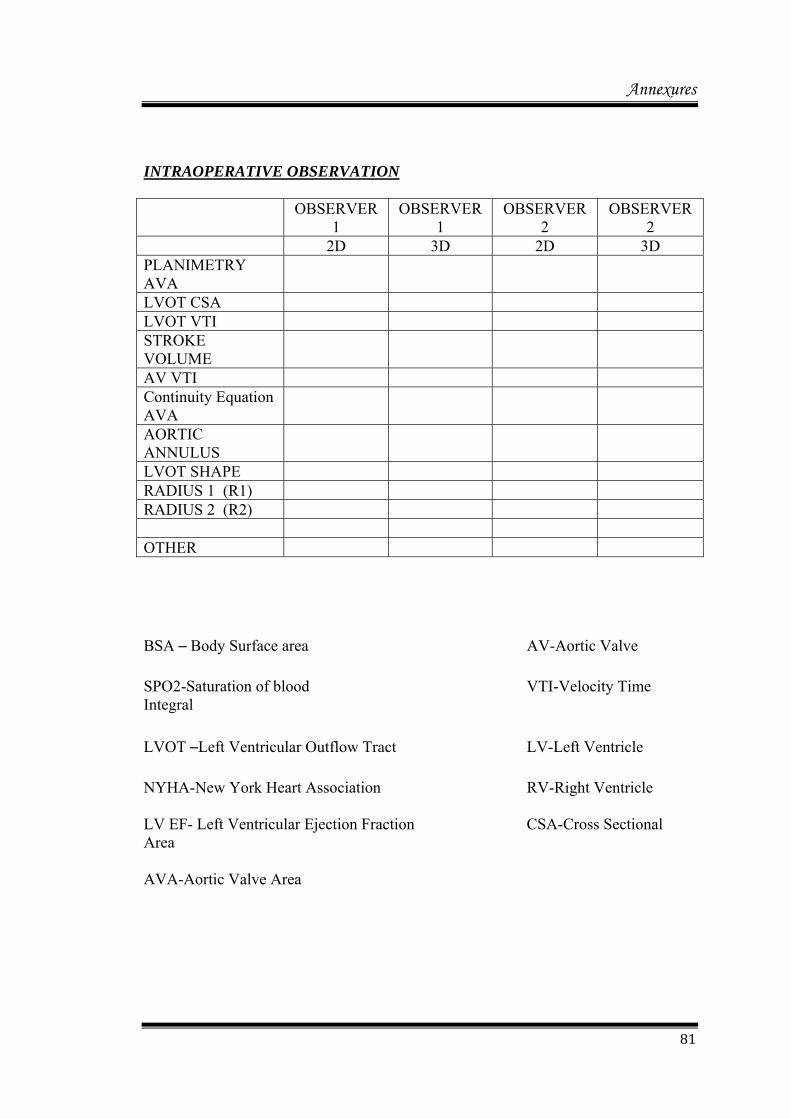
Annexures
81
INTRAOPERATIVE OBSERVATION OBSERVER
1 OBSERVER
1 OBSERVER
2 OBSERVER
2 2D 3D 2D 3D PLANIMETRY AVA
LVOT CSA LVOT VTI STROKE VOLUME
AV VTI Continuity Equation AVA
AORTIC ANNULUS
LVOT SHAPE RADIUS 1 (R1) RADIUS 2 (R2) OTHER
BSA – Body Surface area AV-Aortic Valve
SPO2-Saturation of blood VTI-Velocity Time Integral
LVOT –Left Ventricular Outflow Tract LV-Left Ventricle
NYHA-New York Heart Association RV-Right Ventricle LV EF- Left Ventricular Ejection Fraction CSA-Cross Sectional Area AVA-Aortic Valve Area

Annexures
82
Consent form
TITLE: Comparison of Aortic Valve Area Obtained By Continuity Equation and Planimetry Using Intraoperative 2 Dimensional and 3 Dimensional Echocardiography in Aortic Stenosis. Study numbers: We request you to participate in the study wherein we are planning to evaluate intraoperative echocardiographic characteristics of aortic stenosis using (2D and 3D) Trans-esophageal echocardiography. We hope to include 40 people from this hospital in this study. What is aortic stenosis? Heart valves lie at the exit of each of your four heart chambers and maintain one-way blood flow through your heart. The four heart valves make sure that blood always flows freely without obstruction in a forward direction and that there is no backward leakage . Aortic valve is one of the heart valves lying between left ventricle and aorta. The aortic valve normally opens and closes to let the blood pass away from the left ventricle to aorta. Aortic Stenosis means obstruction passage of blood from left ventricle to aorta. It occurs due to various reasons. What is Trans-esophageal echocardiography? Trans-esophageal echocardiography or TEE is a test that uses sound waves to create high-quality moving pictures of the heart and its blood vessels. This can pin point the problematic areas of the heart and helpful in assessing function of heart valves before and after valve replacement surgery. Usually echocardiography is performed via chest (transthoracic echocardiography). However, under anesthesia, transthoracic echocardiography cannot be performed during cardiac surgery as the surgeon will be operating in that area. Hence echocardiography probe is inserted via esophagus (food pipe). TEE involves a flexible tube (probe) with a transducer at its tip. The Anesthesiologist will guide the probe down your throat and into your esophagus (the passage leading from your mouth to your stomach). This will be done when you will be unconscious under anesthesia and it will not cause any discomfort to you. This approach allows your doctor to get more detailed pictures of your heart because the esophagus is directly behind the heart. What is the role of Trans-esophageal echocardiography in Aortic Stenosis? Trans-esophageal echocardiography (TEE) is a useful monitoring tool during cardiac surgery. American society of Anesthesiology and Society of cardiovascular Anesthesiologists have strongly recommended the use of intraoperative TEE in adult patients having aortic stenosis (AS). It helps to determine the cause of AS, to know how severe it is and plan the surgical procedure. Based on the TEE findings about AS, the anesthetic plan and course
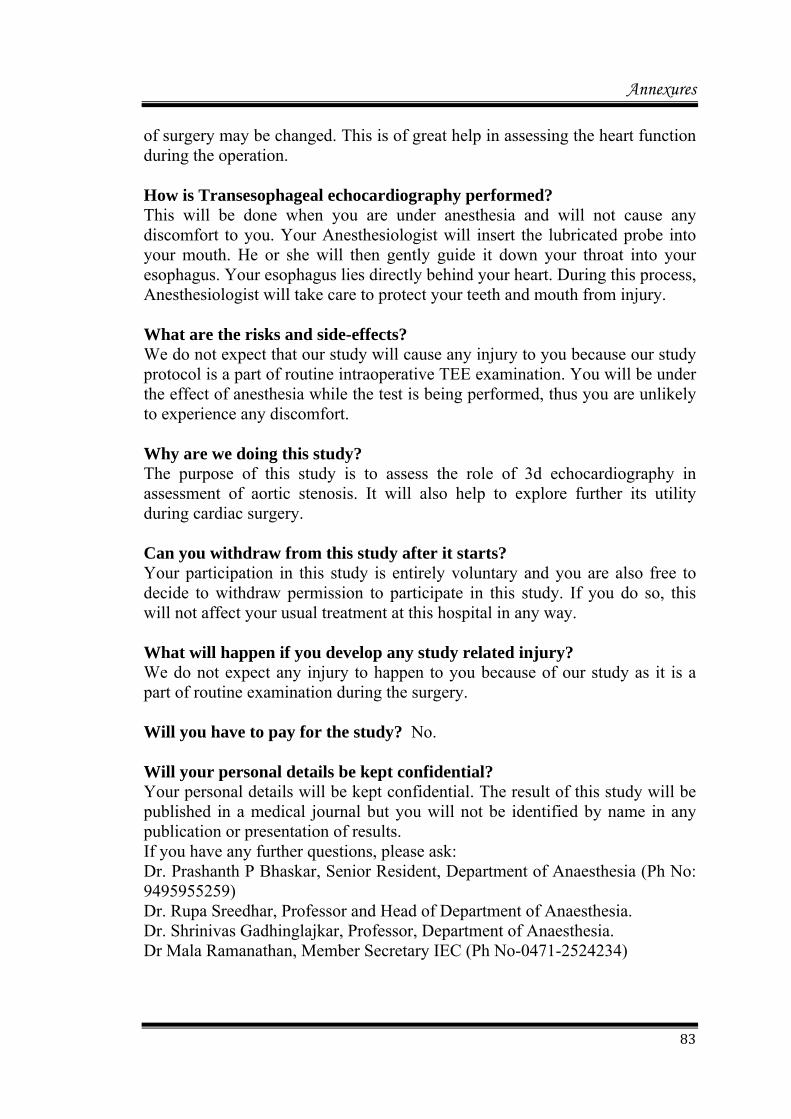
Annexures
83
of surgery may be changed. This is of great help in assessing the heart function during the operation. How is Transesophageal echocardiography performed? This will be done when you are under anesthesia and will not cause any discomfort to you. Your Anesthesiologist will insert the lubricated probe into your mouth. He or she will then gently guide it down your throat into your esophagus. Your esophagus lies directly behind your heart. During this process, Anesthesiologist will take care to protect your teeth and mouth from injury. What are the risks and side-effects? We do not expect that our study will cause any injury to you because our study protocol is a part of routine intraoperative TEE examination. You will be under the effect of anesthesia while the test is being performed, thus you are unlikely to experience any discomfort. Why are we doing this study? The purpose of this study is to assess the role of 3d echocardiography in assessment of aortic stenosis. It will also help to explore further its utility during cardiac surgery. Can you withdraw from this study after it starts? Your participation in this study is entirely voluntary and you are also free to decide to withdraw permission to participate in this study. If you do so, this will not affect your usual treatment at this hospital in any way. What will happen if you develop any study related injury? We do not expect any injury to happen to you because of our study as it is a part of routine examination during the surgery. Will you have to pay for the study? No. Will your personal details be kept confidential? Your personal details will be kept confidential. The result of this study will be published in a medical journal but you will not be identified by name in any publication or presentation of results. If you have any further questions, please ask: Dr. Prashanth P Bhaskar, Senior Resident, Department of Anaesthesia (Ph No: 9495955259) Dr. Rupa Sreedhar, Professor and Head of Department of Anaesthesia. Dr. Shrinivas Gadhinglajkar, Professor, Department of Anaesthesia. Dr Mala Ramanathan, Member Secretary IEC (Ph No-0471-2524234)
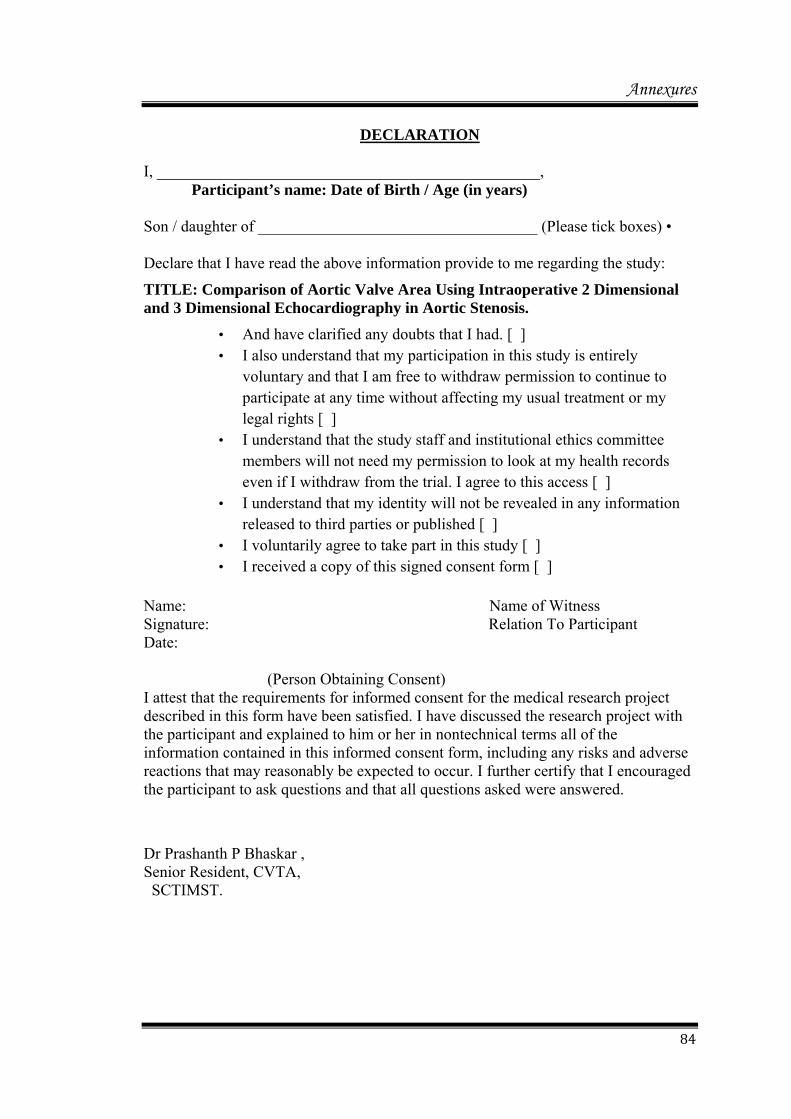
Annexures
84
DECLARATION
I, ________________________________________________, Participant’s name: Date of Birth / Age (in years) Son / daughter of ___________________________________ (Please tick boxes) • Declare that I have read the above information provide to me regarding the study:
TITLE: Comparison of Aortic Valve Area Using Intraoperative 2 Dimensional and 3 Dimensional Echocardiography in Aortic Stenosis.
• And have clarified any doubts that I had. [ ] • I also understand that my participation in this study is entirely
voluntary and that I am free to withdraw permission to continue to participate at any time without affecting my usual treatment or my legal rights [ ]
• I understand that the study staff and institutional ethics committee members will not need my permission to look at my health records even if I withdraw from the trial. I agree to this access [ ]
• I understand that my identity will not be revealed in any information released to third parties or published [ ]
• I voluntarily agree to take part in this study [ ] • I received a copy of this signed consent form [ ]
Name: Name of Witness Signature: Relation To Participant Date: (Person Obtaining Consent) I attest that the requirements for informed consent for the medical research project described in this form have been satisfied. I have discussed the research project with the participant and explained to him or her in nontechnical terms all of the information contained in this informed consent form, including any risks and adverse reactions that may reasonably be expected to occur. I further certify that I encouraged the participant to ask questions and that all questions asked were answered.
Dr Prashanth P Bhaskar , Senior Resident, CVTA, SCTIMST.
Annexures
85
k½X]{Xw
AtbmÀ«nIv Ìot\mknkn hmÂhv Gcy Afhv ാനിെമ ടിയും കൺടിന ുയി ി ഇേക ഷൻ ഉപേയാഗി ് {Sm³kv Ctkm^oK Ct¡m ImÀUntbm{Km^nbpsS 2- Unbpw 3- Unbpw D]tbmKn¨pff XmcXay ]T\w
]T\ hym]vXn
ikv{X{Inb kab¯v, {Sm³kv Ctkm^oK Ct¡m ImÀUntbm {Km^n D]tbmKn¨v AtbmÀ«nIv Ìot\mknkn hmÂhnsâ kz`mh hntijs¯¸än ]Tn¡phm\pw \nehnepff 2--Un 3-Un D]m[nIÄ sIm−v AtbmÀ«nI hmÂhv Gcy Af¡m\pw AXv X½nepff XmcXayw \S¯phm\pw Dff ]T\¯n ]¦mfnbmIm³ R§Ä Xm¦tfmSv A`yÀ°n¡p¶p. Cu ]T\¯n Bip]{Xnbn \n¶pw 40 t]sc ]s¦Sp¸n¡msa¶v {]Xo£n¡p¶p.
F´mWv AtbmÀ«nIv Ìot\mknkv?
Xm¦fpsS lrZb¯nsâ \medIfptSbpw ]pdt¯bv¡pff `mK¯mWv lrZbhmÂhpIÄ ØnXnsN¿p¶Xv. Xm¦fpsS lrZb¯nte¡v Hcp hit¯bv¡v am{Xapff cà{]hmlw \ne\nÀ¯p¶Xv Cu \mep lrZbhmÂhpIÄ càw apt¶m«v A\mbmkw Hgp¡pIbpw ]pdtIm«v Hcp tNmÀ¨bpw Csöv Dd¸phcp¯pIbpw sN¿p¶p. AtbmÀ«nI hmÂhv km[mcW CS¯v sh³{Sn¡en \n¶pw AtbmÀ«bnte¡v càw IS¶p t]mIphm³ th−n Xpd¡pIbpw AS¡pIbpw sN¿p¶p. AtbmÀ«nIv knt\mknkn sh³{Sn¡en \n¶v AtbmÀ«bnte¡v càw Hgp¡p¶Xn XSÊap−mIpIbpw X·qew apt¶m«v Hgp¡pI cà¯nsâ Afhv IpdbpIbpw sN¿p¶p.
F´mWv {Sm³kvCtkm^oKÂ Ct¡mImÀUntbm{Km^n?
{Sm³kv Ctkm^oK Ct¡m ImÀUntbm{Km^n i_vZhoNnIÄ D]tbmKn¨v lrZb¯ntâbpw cà¡pgepIfptSbpw Nen¡p¶ D¶X KpW\nehmcapff Nn{X§Ä \nÀ½n¡p¶Xn\pff Hcp ]cntim[\bmWv. CXv lrZb¯nse {]iv\_m[nX {]tZi§fn Nq−n¡mWn¡phm\pw lrZbhmÂhv amänhbv¡p¶Xn\v ap¼pw tijhpw lrZb¯nsâ {]hÀ¯\s¯ hnebncp¯m\pw klmbIcamWv. km[mcWKXnbn Ct¡m ImÀUntbm{Km^n s\©neqsSbmWv. ({Sm³kv sXmdmknIv Ct¡m ImÀUntbm{Km^n) F¶mepw ab¡en\v hnt[bamb AhØbn lrZbikv{X{Inbbn kÀP³ B ØeamWv Xpd¡p¶Xv F¶Xn\m {Sm³kv sXmdmknIv Ct¡m ImÀUntbm{Km^n sN¿m\mInÃ. AXn\m än.C.Cbn Aä¯v {Sm³kvUyqkÀ LSn¸n¨ t{]m_v A¶\mf¯neqsS IS¯p¶p. än.C.Cbn Aä¯v {Sm³UyqkÀ LSn¸n¨ hg¡apff Ipg D]tbmKn¡p¶p. A\kvtXtjytbmfPnÌv t{]m_v Xm¦fpsS sXm−bneqsS A¶\mf¯ntebv¡v IS¯p¶p. CXp sN¿p¶Xv Xm¦Ä At_m[mhØbnepw ab¡¯nepambncn¡pt¼mgmsW¶Xn\m Xm¦Ä¡v
Annexures
86
_p²naps«m¶pw tXm¶pIbnÃ. A¶\mfw lrZb¯nsâ sXm«pXmsgbmsW¶Xn\m Xm¦fpsS tUmIvSÀ¡v lrZb¯nsâ IqSpX hniZamb Nn{Xw Cu kao]\¯n\mbn e`yamIpw.
AtbmÀ«nIv Ìot\mknkn {Sm³kv sXmdmknIv Ct¡m ImÀUntbm{Km^nbpsS ]¦v F´v ?
{Sm³kv sXmdmknIv Ct¡m ImÀUntbm{Km^n lrZb ikv{X{Inb kab¯v D]Imc{]Zamb Hcp \nco£W D]IcWamWv. Atacn¡³ skmsskän Hm^v A\kvtXtjymPfnbpw skmsskän Hm^v ImÀUntbm hmkvIpeÀ A\kvtXtjymfPnÌpw {]mb]qÀ¯nbmb AtbmÀ«nI Ìnt\mknkv tcmKnIfn ikv{X{Inb kab¯v än.C.C.bpsS D]tbmKw iàambn ip]mÀi sN¿p¶p. BbXv AtbmÀ«nI Ìnt\mknknsâ ImcWw hnebncp¯m\pw AXv F{X KpcpXcamsW¶dnbm\pw ikv{X{Inbm \S]SnIÄ Bkq{XWw sN¿m\pw klmbn¡p¶p. ikv{X{Inbm kab¯v lrZb¯nsâ {]hÀ¯\w hnebncp¯p¶Xn CXv henb klmbIamWv.
{Sm³kv Cutkm^mPnb Ct¡m ImÀUntbm{Km^n F§s\bmWv sN¿p¶Xv?
CXv sN¿p¶Xv Xm¦Ä ab¡¯nembncn¡p¶Xn\m _p²nap«pIsfm¶pw tXm¶pIbnÃ. A\kvtXtjymfPnÌv Xm¦fpsS hmbneqsS Ft¡m ImÀUntbm {Km^v t{]m_v A¶\mf¯nte¡v IS¯pw. Xm¦fpsS ]Ãn\pw hmbv¡pw ]cnt¡Â¡mXncn¡m³ {]tXyIw {i²n¡pw.
Fs´Ãmw A]IS§fpw ]mÀiz^e§fpw D−mImw?
ikv{X{Inb kab¯pff än.C.C. ]cntim[\ km[mcWambpffXn\m R§fpsS ]T\¯nsâ `mKambn Hcp ]cn¡pw {]Xo£n¡p¶nÃ. ]cntim[\ \S¯pt¼mÄ Xm¦Ä ab¡¯n\v hnt[b\mbXn\m _p²naps«m¶pw A\p`hs¸SpIbnÃ.
R§Ä F´n\v ]T\w \S¯p¶p?
AtbmÀ«nIv Ìot\mknkn \nehnepff 2Un 3Un D]mXnIÄ aqeapff AtbmÀ«nI hmÂhv Gcy Afhn Hmtcm¶ntâbpw IrXyX hnebncp¯p¶Xn\mWv Cu ]T\w. lrZb ikv{X{Inbbn `mhnbn IqSpX At\zjW§Ä¡pw CXv klmbn¡pw.
]T\w Bcw`n¨ tijw Xm¦Ä¡v ]n³amdmtam?
Xm¦fpsS ]T\¯nepff ]¦mfn¯w ]qÀ®ambpw kzta[bmbpffXpw ]T\¯n \n¶pw ]n·mdm³ kzmX{´yw DffXpamWv. A§s\ sN¿p¶XpsIm−v Cu Bip]{Xnbnse Xm¦fpsS km[mcW NnInÕsb _m[n¡pIbnÃ.
Annexures
87
]T\m\p_Ônbmb A]ISap−mbm F´v kw`hn¡pw?
ikv{X{Inbm kab¯pff än.C.C. ]cntim[\ km[mcWambpffXn\m ]T\¯nsâ `mKambn Hcp]cn¡pw {]Xo£n¡p¶nÃ.
Cu ]T\¯n Xm¦Ä ]Ww apS¡Wtam?
th−
Xm¦fpsS hyàn]camb hnhc§Ä clkyambn hbv¡mtam?
]T\^e§Ä KthjW{]_Ô¯nsâ `mKambpw, Hcp sshZyimkv{X tPÀWenepw {]kn²oIcn¡psa¦nepw Xm¦fpsS t]cphnhc§Ä D−mInÃ. F¶mepw Xm¦Ä ]s¦Sp¡m³ k½Xn¨m Xm¦fpsS hnhc§Ä ]T\hpambn _Ôs¸« BfpIÄ Xm¦fpsS {]tXyI k½XanÃmsX ]cntim[nt¨¡mw.
Xm¦Ä¡v IqSpX Fs´¦nepw tNmZy§Ä Ds−¦n Zbhmbn R§tfmSv tNmZn¡pI?
tUm. {]im´v ]n. `mkvIÀ, ko\nbÀ dknUâv, Un¸mÀ«vsaâv Hm^v ImÀUntbmsXmdmknIv Bâv hmkvIpemÀ A\kvtXjy ( t^m¬: 9495955259)
tUm. cq] {io[À, s{]m^kÀ Bâv slUv, Unhnj³ Hm^v ImÀUntbmsXmdmknIv Bâv hmkvIpemÀ A\kvtXjy
tUm. {io\nhmkv, s{]m^kÀ, Unhnj³ Hm^v ImÀUntbmsXmdmknIv Bâv
hmkvIpemÀ A\kvtXjy.
tUm. മാല രാമനാഥൻ ,ഐ.ഇ.സീ -െമ ർ െസക റി (t^m¬:0471-------2524234)
Annexures
88
{]kvXmh\
Rm³ …………………………………..(]s¦Sp¡p¶ Bfnsâ t]cv, hbÊv, P\\XobXn (hÀj¯nÂ)
]T\kw_Ônbmbn F\n¡v \ÂInb hnhc§Ä hmbn¨p F¶p Rm³ {]kvXmhn¡p¶p.
]T\ioÀjIw: AtbmÀ«nIv Ìot\mknkn hmÂhv Gcy Afhv: {Sm³kv Ctkm^oK Ct¡m ImÀUntbm {Km^nbpsS 2 Unbpw 3 Unbpw D]tbmKn¨pff XmcXay ]T\w.
Fsâ FÃm kwib§fpw ]cnlcn¨p.( )
Fsâ Cu ]T\¯nepff ]¦mfn¯w ]qÀ®ambpw kzta[bm DffXmsW¶pw Fsâ NnInÕtbtbm \nbamhImi§sftbm _m[n¡msX ]T\¯n \n¶pw ]n³amdmsa¶pw Rm³ a\Ênem¡p¶p. ( )
Rm³ Cu ]T\¯n \n¶pw ]n³amdnbmepw ]T\w \S¯p¶hÀ¡pw Øm]\¯nse ss\XnI I½än AwK§Ä¡pw Fsâ BtcmKy tcJIÄ ]cntim[n¡p¶Xn\pw Fsâ A\phmZ tcJIÄ Bhiyansöv Rm³ a\Ênem¡p¶p. AXnt\mSv Rm³ tbmPn¡p¶p. ( )
Fs¶ Xncn¨dnbm\pXIp¶ hnhc§Ä H¶pw aäpffhÀ¡v \ÂIpItbm {]kn²oIcn¡pItbm sN¿pIbnsöv Rm³ a\Ênem¡p¶p. ( )
k½X]{X¯nsâ H¸n«v Hcp tIm¸n F\n¡v In«n. ( )
t]cv :
H¸v :
XobXn :
km£nbpsS t]cv :
]s¦Sp¡p¶ Bfpambpff _Ôw :
saUn¡Â dnkÀ¨v t{]mPIvän\mhiyamb k½X]{X¯n\pth− FÃm LSI§fpw Xr]vXnIcambn \nÀÆln¨ncn¡p¶psh¶v Rm³ t_m[ys¸Sp¯p¶p. ]T\ ]¦mfnbpambn KthjW]²Xnsb¸än kmt¦XntIXc ]Z§Ä D]tbmKn¨v FÃm hnhc§sf¸änbpw NÀ¨ \S¯pIbpw {]Xo£n¡mhp¶ A]IS km²yXIfpw ]mÀiz^e§fpw hniZoIcn¡pIbpw sNbvXp. ]¦mfnsb tNmZy§Ä tNmZn¡m³ t{]cn¸n¡pItbm FÃm tNmZy§Ä¡pw D¯cw \ÂIpIbpw sNbvXpsb¶pw Rm³ km£ys¸Sp¯p¶p.
k½X]{Xw hm§p¶ Bfnsâ t]cpw H¸pw :
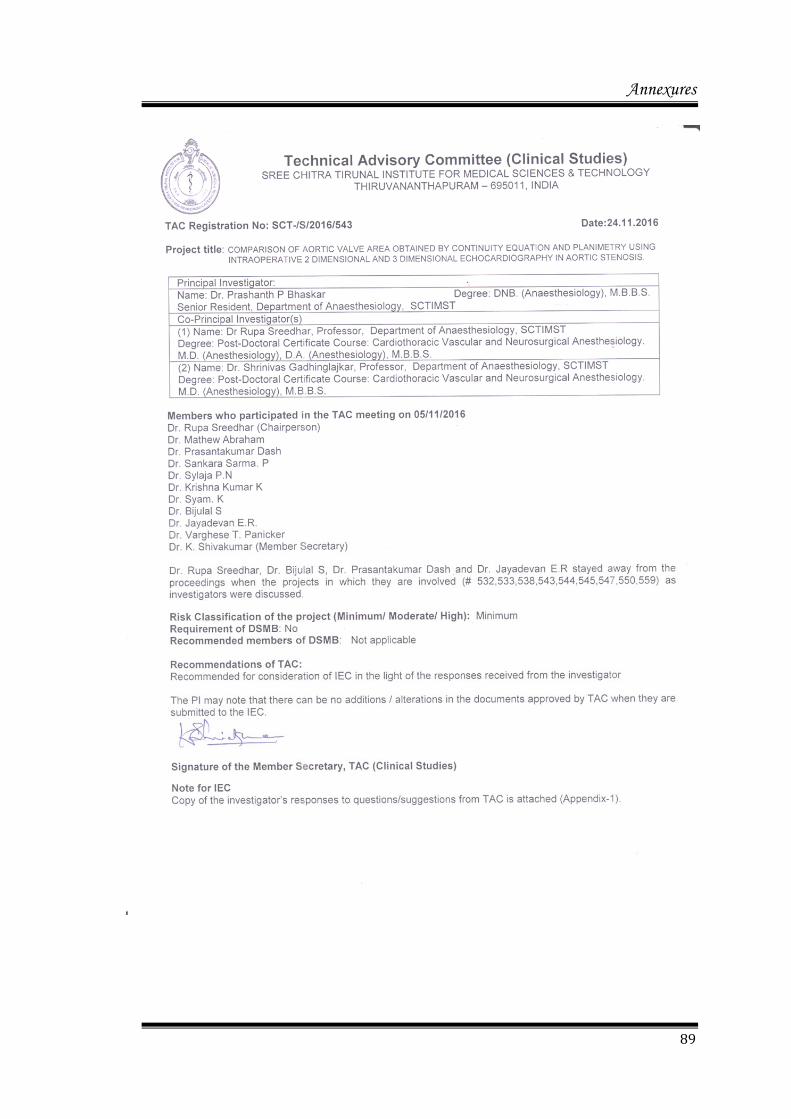
Annexures
89
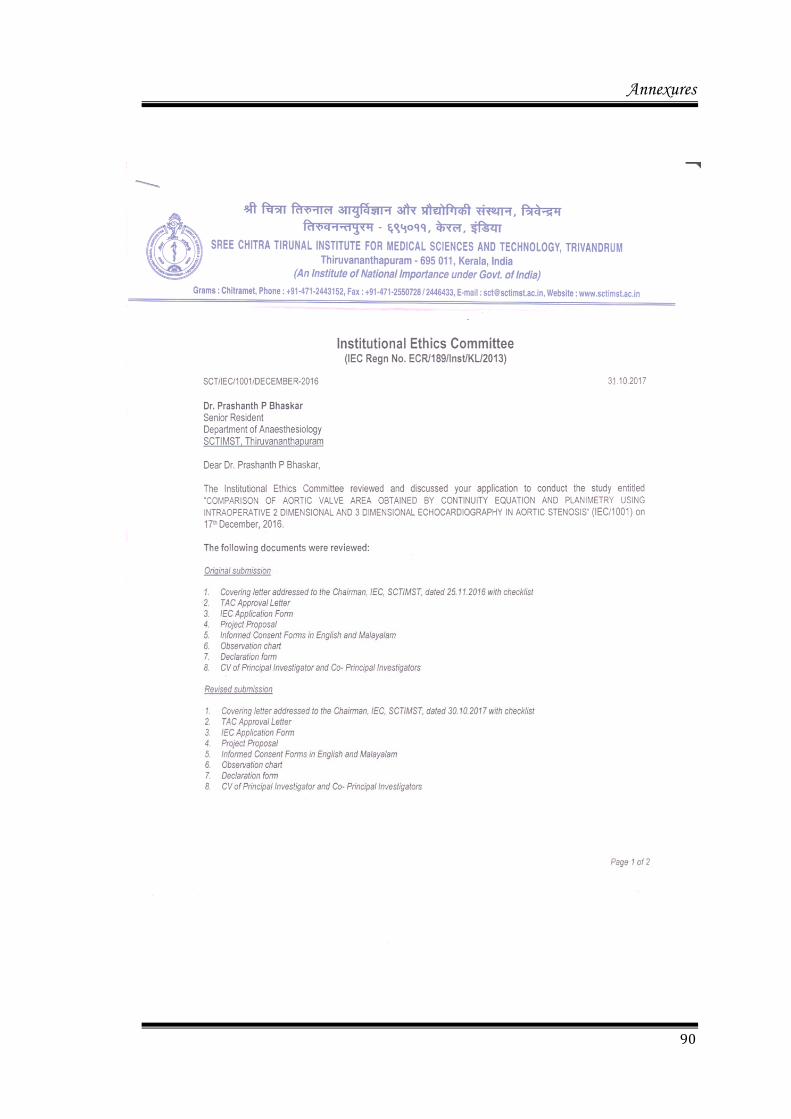
Annexures
90

Annexures
91
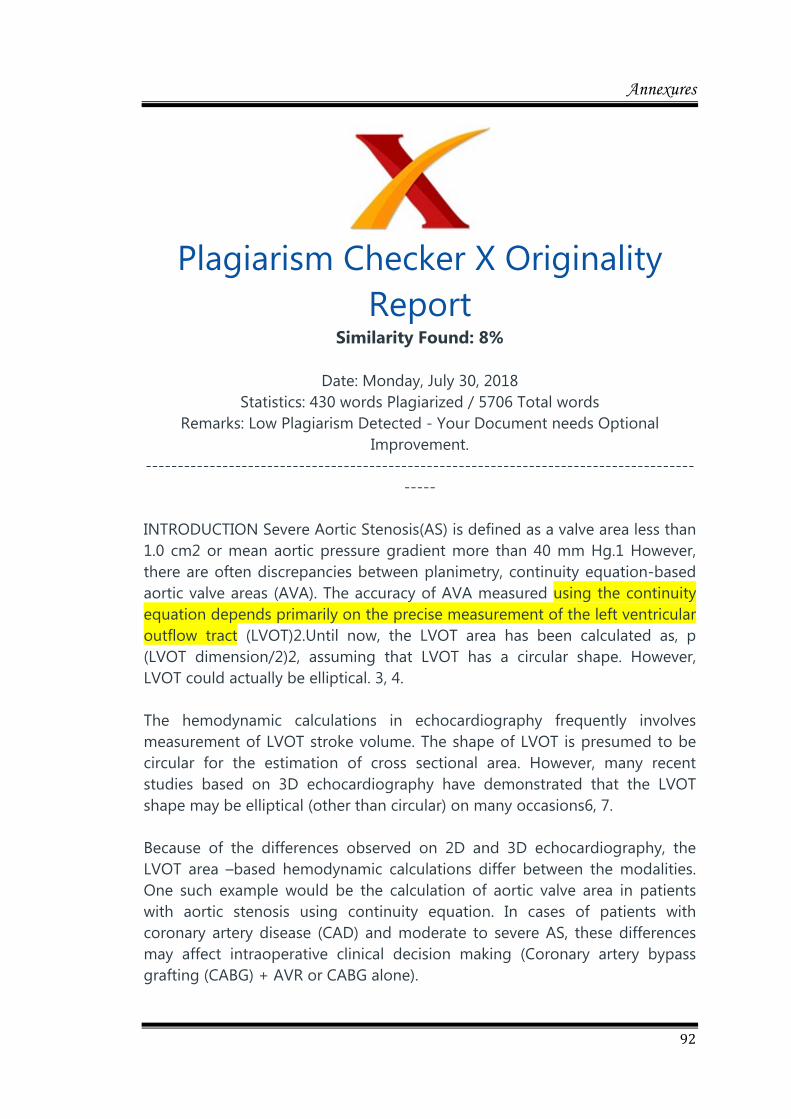
Annexures
92
Plagiarism Checker X Originality
Report Similarity Found: 8%
Date: Monday, July 30, 2018
Statistics: 430 words Plagiarized / 5706 Total words Remarks: Low Plagiarism Detected - Your Document needs Optional
Improvement. --------------------------------------------------------------------------------------
----- INTRODUCTION Severe Aortic Stenosis(AS) is defined as a valve area less than 1.0 cm2 or mean aortic pressure gradient more than 40 mm Hg.1 However, there are often discrepancies between planimetry, continuity equation-based aortic valve areas (AVA). The accuracy of AVA measured using the continuity equation depends primarily on the precise measurement of the left ventricular outflow tract (LVOT)2.Until now, the LVOT area has been calculated as, p (LVOT dimension/2)2, assuming that LVOT has a circular shape. However, LVOT could actually be elliptical. 3, 4. The hemodynamic calculations in echocardiography frequently involves measurement of LVOT stroke volume. The shape of LVOT is presumed to be circular for the estimation of cross sectional area. However, many recent studies based on 3D echocardiography have demonstrated that the LVOT shape may be elliptical (other than circular) on many occasions6, 7. Because of the differences observed on 2D and 3D echocardiography, the LVOT area –based hemodynamic calculations differ between the modalities. One such example would be the calculation of aortic valve area in patients with aortic stenosis using continuity equation. In cases of patients with coronary artery disease (CAD) and moderate to severe AS, these differences may affect intraoperative clinical decision making (Coronary artery bypass grafting (CABG) + AVR or CABG alone).
Annexures
93
Computed tomography (CT) and magnetic resonance imaging (MRI) of the aortic root have established that the shape of LVOT may be circular or elliptical [4,5,9-13].Studies involving 3D Trans Esophageal Echocardiography(TEE) imaging of aortic root have reported that the LVOT may be elliptical in shape having major and minor axes, rather than being circular in shape as has been presumed conventionally[6,7,]. Planimetry of an en-face view may yield a relatively larger LVOT area than estimations based on measurement of minor axis with 2D echocardiography 7. Hence, 2D echocardiographic measurements result in smallest LVOT area8, which in turn may overestimate the severity of AS when AVA is measured by continuity equation14, 15. Aortic Valve Replacement (AVR) is reasonable for patients with moderate AS who are undergoing other cardiac surgery (II a Class of recommendation)16. Hence, accurate estimation of AVA is necessary to take decision regarding the requirement for combined surgery. The purpose of this intraoperative study is to compare the aortic valve area and LVOT geometry assessed by two dimensional (2D) and three-dimensional (3D) transesophageal echocardiography (TEE) and its impact on evaluating severity of AS. Study Protocol: After obtaining approval from IEC, patients were enrolled in the study during the pre-anesthetic evaluation. Patients were educated about the study in the presence of a witness. The witness could question the patient as to whether he/ she had really understood details of the proposed study. An informed consent form was signed by patient or relative of the patient as per the Institute protocol. An adult-size TEE probe was inserted after induction of anesthesia and a comprehensive cardiac examination was done using a RT-3D-TEE probe and ultrasound machine.(Philips iE 33, Philips Ultrasound, Bothell, USA). Comprehensive cardiac examination included the necessary views required for management of the patient. The AVA was estimated using the continuity equation (CE-AVA-2D) method as follows: CE-AVA (2D) = [LVOT area (2D) × velocity-time integral of LVOT] ÷ Velocity-time integralof AV 3D Planimetry: A full-volume dataset of aortic valve and LVOT were acquired after optimising gain, compression controls and time gain compensation over four consecutive heart beats. Reference planes for full volume acquisition were mid esophageal AV-LAX and mid esophageal AV-SAX views.
Annexures
94
Continuity Equation (3D) Doppler-VTI measurements of both AV and LVOT were common for the estimation of stroke volume using continuity equation. The 3D-AVA was estimated using the continuity equation (CE-AVA-3D) method as follows: CE-AVA (3D) =3D LVOT area x LVOT- VTI /AV-VTI. / Fig 6: The figure depicts method of 3D evaluation of LVOT geometry, measurement of the LVOT CSA, and LVOT diameters in anteroposterior and medial-lateral planes. Observations: Please refer to Annexure page 2 Outcome parameters: We obtained AVA by continuity equation (using 2D LVOT area and 3D LVOT area), 2D planimetry, and 3D planimetry which were compared among each other. The inter-observer variability was also calculated for the same. STATISTICAL ANALYSIS Statistical analysis was done using SPSS software version 22 and Graph pad prism 5.2. Continuous variables are expressed as mean ±standard deviation(SD). Range of 95% Confidence Interval as shown by broken lines in difference plot, are over a wider range from the baseline (1.58 to 0.16), signifying poor agreement between 2D and 3D-CSA measurement methods.Correlation coefficient: R=0.979, p<0.001(statistically significant). LVOT- Left ventricular outflow tract, CSA- Cross sectional area, 2D-Two dimensional, 3D- Three dimensional, TEE-Transesophageal echocardiography. DISCUSSION Ours is the first prospective study which compared AVA assessment by 3D-TEE with X-plane 2D TEE and CE based aortic valve area measurement,in the intra-operative period. There were no particular complications during any of the TEE examinations. Our success rate of 2D measurement were91%, which is comparable to or even higher than conventional 2D planimetry done by the previous studies.6 In comparison to 3D TEE, 2D TEE planimetry overestimated the AVA in our cohorts, but it was statistically not significant. 2D-TEE oftenmakes an oblique cut through the valve leafletsrather than at the tip of the leaflets. Consequently, it is oftentechnically difficult to capture the tip of the aortic valveleaflets at their maximal systolic opening using 2D-TEE with a fixed imaging plane.57-59 In addition, 2D-TEE has thedisadvantages of more fuzzy contours, shadow phenomena,and motion artefacts.The gain setting may affect themeasured AVA, especially in severely calcified valves.59Inability to localise the tip of AV leaflets in severe calcific AS may be the cause for
Annexures
95
overestimation of AVA when 2D echocardiography is used. In AS the effect is pronounced and the functionally measured AVA should be slightly lower than anatomical AVA. This principle can be the reason behind slightly lower AVA measured by CE-2D in comparison to 2D/3D planimetry in our study. The European Association of Echocardiography/American Society of Echocardiography guidelines now advocate LVOT diameters derived from 2-dimensional echocardiography to be used to estimate a continuity equation-based AVA.2However, the LVOT actually could be of elliptical shape, with a shorter anteroposterior diameter, casting a doubt on the accuracy of a continuity equation based AVA calculated by the assumption of a circular geometry. Our findings are similarto that of previous studies regarding LVOT geometry, which reported an ellipticalLVOT with shorter anteroposterior diameter.4,7,77 Additionally, the ellipticity was able to be predicted using 2-dimensional X-plane parameters in our study. Therefore, 3D-TEE or X-plane 2D TEEshould be used to evaluate LVOT geometry prior to cases of percutaneous aortic valve implantation.Accurate assessment of LVOT geometry could affect the success of this procedure because the apical end of the new valve is attached to the LVOT. CONCLUSION All methods of AVA assessment are feasible and reproducible considering the excellent inter-observer variability among them. a) 3D-TEE yielded a larger continuity equation-based AVA than did 2D-TEE and the difference was statistically significant. b) 3D planimetry AVA was slightly less when compared to 2D planimetry AVA and the difference was not statistically significant. 2. The 3D CE derived AVA was significantly more when compared to AVA derived by 3D-planimetry, 2D-planimetry, and 2D-CE and the differences were statistically significant. 3. 3D-TEE showed that the LVOT waselliptical in shape in all the cases and its area can bemeasured with direct 3D planimetry as well as with the X-plane 2D. Compared with 3D-TEE,2D-TEE imaging underestimated the LVOT area (because LVOT was assumed to be circular), which in turn resulted in overestimation of the degree of AS. The use of 3D-TEE resulted inrevision of the severity grades of AS in a significantnumber of patients. 4.The aortic AP annular diameter measured using 2D and 3D-TEE were almost similar and the difference was statistically insignificant. We conclude that 3D-TEE AVA measurement using continuity equation as well as AVA measurement using orthogonal plane imaging of LVOT CSA using X-
Annexures
96
plane has the potential to impact intraoperative surgical decision making in patients with AS. INTERNET SOURCES: -------------------------------------------------------------------------------------- 0% - Empty 4% - https://www.sciencedirect.com/science/ar 0% - http://www.annalsthoracicsurgery.org/art 0% - http://www.annalsthoracicsurgery.org/art 0% - https://www.sciencedirect.com/science/ar 4% - https://www.sciencedirect.com/science/ar 4% - https://www.sciencedirect.com/science/ar 0% - http://www.onlinejacc.org/content/31/7/1 0% - https://www.sciencedirect.com/science/ar 0% - https://www.bing.com/aclick?ld=d36yBfPtS 4% - https://www.sciencedirect.com/science/ar 4% - https://www.sciencedirect.com/science/ar 0% - https://www.sciencedirect.com/science/ar 4% - https://www.sciencedirect.com/science/ar 4% - https://www.sciencedirect.com/science/ar 4% - https://www.sciencedirect.com/science/ar 4% - https://www.sciencedirect.com/science/ar 4% - https://www.sciencedirect.com/science/ar 4% - https://www.sciencedirect.com/science/ar 4% - https://www.sciencedirect.com/science/ar 4% - https://www.sciencedirect.com/science/ar 1% - https://www.sciencedirect.com/science/ar 1% - https://www.sciencedirect.com/science/ar 1% - https://www.sciencedirect.com/science/ar 1% - https://www.sciencedirect.com/science/ar 4% - https://www.sciencedirect.com/science/ar 4% - https://www.sciencedirect.com/science/ar 4% - https://www.sciencedirect.com/science/ar 4% - https://www.sciencedirect.com/science/ar 4% - https://www.sciencedirect.com/science/ar

SlN
o
AG
E
GE
ND
ER
WE
IGH
T
HE
IGH
T
BS
A
DIA
GN
OS
IS
DM
HT
N
DL
P
HY
PO
TH
YR
OID
CK
D
PS
Y
BA
/CO
PD
CA
D
NY
HA
PU
LS
E
RH
YT
HM
SB
P
DB
P
SP
O2
EF
1
AV
VE
L1
PG
1
MG
1
HR
SW
S1
SW
D1
PW
S1
PW
D1
LV
DF
1
RV
F1
1 58 1 59 166 1.6 BAV,SEV AS,SVD 0 0 0 0 0 0 0 1 2 60 1 120 80 100 70 4.5 98 60 60 17 15 16 12 0 0
2 63 1 67 164 1.76 BAV,SEV AS,MOD AR,MOD MR 1 1 0 0 1 1 0 0 2 70 1 146 80 100 66 4.4 87 50 70 17 15 15 13 1 0
3 63 1 53 155 1.51 CAD,CSA,DVD,SEV. AS,MILD AR 1 0 0 0 0 0 0 1 2 80 1 130 70 98 72 4.4 94 54 70 15 13 17 12 1 0
4 66 1 70 161 1.76 SEV. CAL AS, 1 1 1 0 0 0 0 0 3 60 1 140 86 98 38 3.5 54 32 60 15 13 12 10 2 2
5 60 1 71 160 1.78 BAV,SEV.AS, MILD AR 0 0 0 0 0 0 1 0 2 70 1 150 70 94 72 4 74 46 64 21 17 17 13 1 0
6 62 1 96 172 2.14 SEV. CAL AS MILD AR, MR ,PAH 0 1 1 0 0 0 1 0 3 80 1 140 84 96 54 4.2 72 49 90 15 14 14 12 1 0
7 45 2 48 153 1.41 RHD SEV AS MOD. MS/MR/AR 0 0 0 0 0 0 0 0 3 90 1 130 70 99 78 4.5 104 59 90 16 11 11 10 0 0
8 44 1 60 168 1.67 BAV, SEV CAL AS , FAIR LV 1 0 0 0 0 0 0 0 3 60 1 120 76 99 51 4.5 106 64 60 14 13 12 11 1 0
9 69 1 62 160 1.66 SEV. CAL AS, MILD AR , GD LV 1 0 0 0 0 1 0 0 2 76 1 140 74 100 70 4.5 100 52 80 19 14 16 10 2 0
10 61 2 76 156 1.78 SEV CAL AS GD LV,PRESYNCOPE 0 0 1 0 0 0 1 0 2 76 1 140 78 98 60 5.2 137 77 68 19 15 16 13 1 0
11 59 1 76 157 1.81 BAV,SEV CAL AS,GD LV 1 1 0 0 0 0 0 0 2 80 1 170 86 99 73 4 62 37 72 15 11 12 8 1 0
12 65 2 63 151 1.62 SEV CAL AS ,MILD AR,GD LV 0 1 0 0 0 0 0 0 2 66 1 160 84 100 66 4 71 42 66 18 10 16 11 1 0
13 68 2 63 155 1.64 SEV CAL AS MOD AR,GD LV 0 1 1 0 0 0 1 0 3 66 1 160 80 98 74 5 118 63 72 16 13 15 10 2 1
14 43 1 57 159 1.57 BAV SEV CAL AS,MOD AR 0 0 0 0 0 0 0 0 2 66 1 140 78 100 66 4.5 100 69 66 16 14 16 11 1 0
15 56 2 45 157 1.46 BAV SEV CALAS,MOD AR,MILD LVD 1 0 0 0 0 0 0 0 3 96 1 90 60 98 46 4 74 54 80 13 10 12 9 3 0
16 60 2 62 152 1.6 SV CAL AS NC 1 1 0 0 0 0 0 0 2 60 1 140 80 100 79 4.5 97 68 66 17 15 15 12 1 0
17 67 1 54 153 1.51 SCLERO DEG AS /MILD AR 0 1 0 0 0 0 0 0 2 70 1 160 76 98 70 4 71 36 66 14 10 14 10 1 0
18 60 1 58 167 1.63 BAV, SEV CALCIFIC AS, MILD AR 0 0 0 0 0 0 1 0 2 60 1 160 80 98 74 4.5 91 51 60 15 11 13 11 1 0
19 66 1 79 165 1.9 CAD, SVD, SEV CAL AS 1 0 0 0 0 0 1 1 2 70 1 140 76 100 65 4.5 97 64 70 15 12 14 12 2 0
20 75 1 72 166 1.82 SEV CAL AS,MOD AR,CAD 0 0 1 1 0 0 0 1 2 60 1 140 72 99 65 4.5 100 60 60 22 19 18 16 1 0
21 48 2 60 156 1.62 BAV ,SEV AS,GD LV 0 0 1 0 0 0 0 0 3 70 1 140 80 100 66 4 67 41 65 15 12 12 10 1 0
22 50 2 80 161 1.8 RHD,SEV AS,MOD AR 0 0 0 0 0 0 0 0 3 70 1 140 70 100 63 5 170 100 60 18 16 14 9 1 0
23 65 2 68 154 1.7 SEV CAL AS 1 1 0 0 0 0 0 0 2 70 1 142 80 97 67 5 160 90 64 19 14 17 13 1 0
24 49 1 52 152 1.5 SEV CAL AS MOD AR MOD MR 0 0 0 0 0 0 1 0 3 80 1 130 80 98 60 5 125 65 66 20 15 21 17 1 1
25 59 1 71 164 1.83 BAV,SEV AS,MILD AR,GD LV 0 0 1 0 0 0 0 0 2 66 1 120 78 99 61 4.5 104 60 60 25 20 21 17 1 0
26 54 2 55 156 1.54 SEV CAL AS MILD AR 0 1 0 0 0 0 0 0 3 80 1 140 74 100 66 5 134 74 70 16 13 14 11 1 0
27 51 1 61 169 1.7 SEV CAL AS MOD AR 0 0 0 0 0 0 0 0 3 70 1 160 80 100 76 4.5 97 57 70 25 20 17 13 1 0
28 60 1 49 159 1.45 SEV CAL AS, MILD AR 1 1 0 0 0 0 0 0 3 70 1 160 80 98 70 5 130 80 76 17 11 14 11 1 0
29 52 1 59 161 1.6 SEV CAL AS, MILD AR, SEV LVD 0 0 0 0 0 0 0 0 3 80 1 130 85 98 30 3.2 44 28 80 13 11 11 10 3 1
30 57 2 59 154 1.6 RHD, SEV AS, MOD MS/MR, PAH CAD, SVD 1 1 0 0 0 0 0 1 2 70 1 130 80 99 78 3.5 40 20 74 13 10 12 10 1 0
31 44 1 70 164 1.8 RHD, SEV AS, MOD MS/MR/TR, PAH 1 0 0 0 0 0 0 0 3 80 2 110 70 98 45 4 64 35 80 13 10 12 9 2 1
32 52 2 60 150 1.6 CAD, DVD, BAV, SEV AS, GOOD LV 0 1 0 0 0 0 0 1 2 66 1 140 70 99 55 4 60 40 70 14 11 12 9 1 0
33 59 1 60 160 1.65 CAD, RHD, CALCIFIC AS,CVA, GOOD LV 1 0 0 0 0 0 0 1 2 70 1 140 80 99 59 4 60 36 68 15 13 12 11 1 0
34 52 2 55 150 1.5 BAV, SEV CALCIFIC AS, MILD AR, SVD 1 1 0 0 0 0 0 1 2 80 1 130 76 98 65 5 130 80 90 16 12 12 11 0 0
35 58 2 59 154 1.6 BAV,SEV CAL AS, MILD AR, GD LV 0 1 0 0 0 0 0 0 2 70 1 130 80 99 56 4.5 92 50 70 14 10 12 10 1 0
36 71 1 65 160 1.8 SEV CAL AS, CAD,PPI GDLV 1 1 1 0 0 0 0 1 2 70 1 150 80 99 61 4.3 80 48 70 13 11 14 11 1 0
37 49 1 83 178 2 SEV CAL AS, CAD,GD LV 1 0 1 0 0 0 0 1 2 76 1 140 86 100 54 4.8 114 68 70 15 12 16 12 1 0
38 63 1 60 161 1.64 SEV CAL AS, SR, TIA 0 0 0 0 0 0 0 0 2 68 1 130 74 100 67 4.5 90 55 66 18 16 21 19 1 0
39 57 2 58 146 1.5 SEV CAL AS, MOD AR, PAH, CVA 1 1 1 1 0 1 0 0 2 68 1 160 95 95 69 4.8 116 68 66 18 14 22 18 1 0
40 48 1 66 163 1.7 SEV CAL AS, MILD AR, CAD, TVD 1 0 0 0 0 0 0 1 2 70 1 120 72 100 76 4.5 90 53 80 19 16 20 17 1 0
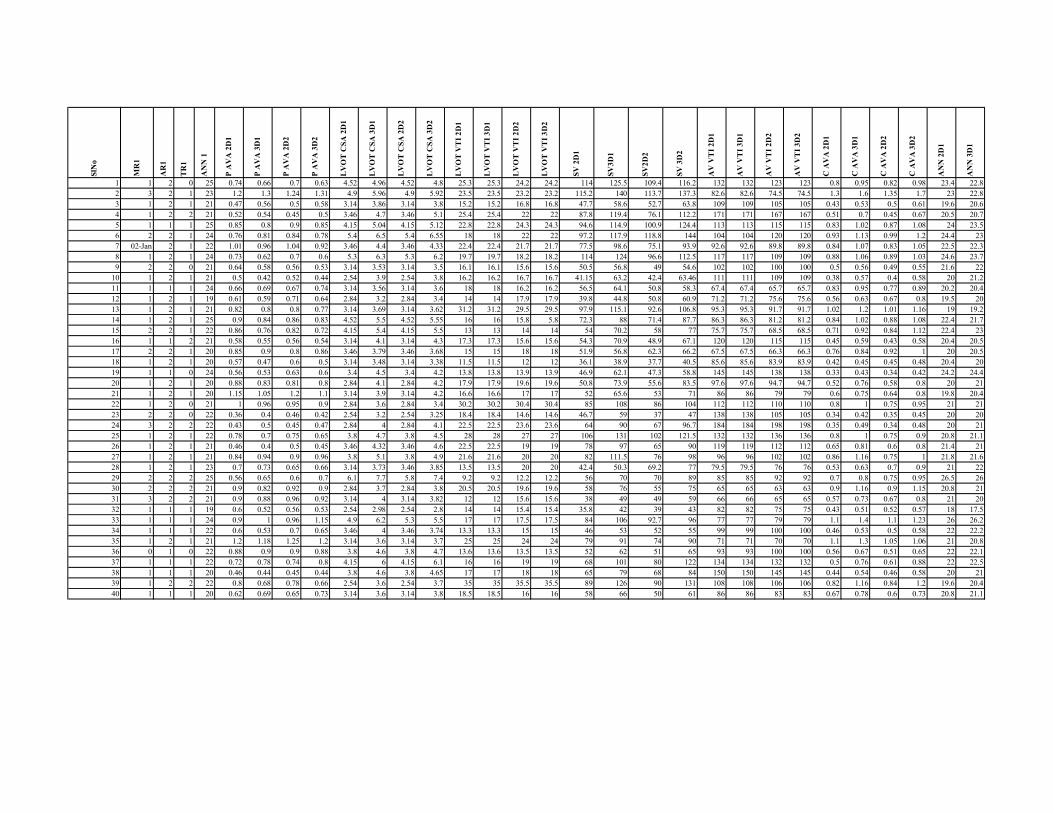
SlN
o
1
2
3
4
5
6
7
8
9
10
11
12
13
14
15
16
17
18
19
20
21
22
23
24
25
26
27
28
29
30
31
32
33
34
35
36
37
38
39
40
MR
1
AR
1
TR
1
AN
N 1
P A
VA
2D
1
P A
VA
3D
1
P A
VA
2D
2
P A
VA
3D
2
LV
OT
CS
A 2
D1
LV
OT
CS
A 3
D1
LV
OT
CS
A 2
D2
LV
OT
CS
A 3
D2
LV
OT
VT
I 2
D1
LV
OT
VT
I 3
D1
LV
OT
VT
I 2
D2
LV
OT
VT
I 3
D2
SV
2D
1
SV
3D
1
SV
2D
2
SV
3D
2
AV
VT
I 2D
1
AV
VT
I 3D
1
AV
VT
I 2D
2
AV
VT
I 3D
2
C A
VA
2D
1
C A
VA
3D
1
C A
VA
2D
2
C A
VA
3D
2
AN
N 2
D1
AN
N 3
D1
1 2 0 25 0.74 0.66 0.7 0.63 4.52 4.96 4.52 4.8 25.3 25.3 24.2 24.2 114 125.5 109.4 116.2 132 132 123 123 0.8 0.95 0.82 0.98 23.4 22.8
3 2 1 23 1.2 1.3 1.24 1.31 4.9 5.96 4.9 5.92 23.5 23.5 23.2 23.2 115.2 140 113.7 137.3 82.6 82.6 74.5 74.5 1.3 1.6 1.35 1.7 23 22.8
1 2 1 21 0.47 0.56 0.5 0.58 3.14 3.86 3.14 3.8 15.2 15.2 16.8 16.8 47.7 58.6 52.7 63.8 109 109 105 105 0.43 0.53 0.5 0.61 19.6 20.6
1 2 2 21 0.52 0.54 0.45 0.5 3.46 4.7 3.46 5.1 25.4 25.4 22 22 87.8 119.4 76.1 112.2 171 171 167 167 0.51 0.7 0.45 0.67 20.5 20.7
1 1 1 25 0.85 0.8 0.9 0.85 4.15 5.04 4.15 5.12 22.8 22.8 24.3 24.3 94.6 114.9 100.9 124.4 113 113 115 115 0.83 1.02 0.87 1.08 24 23.5
2 2 1 24 0.76 0.81 0.84 0.78 5.4 6.5 5.4 6.55 18 18 22 22 97.2 117.9 118.8 144 104 104 120 120 0.93 1.13 0.99 1.2 24.4 23
02-Jan 2 1 22 1.01 0.96 1.04 0.92 3.46 4.4 3.46 4.33 22.4 22.4 21.7 21.7 77.5 98.6 75.1 93.9 92.6 92.6 89.8 89.8 0.84 1.07 0.83 1.05 22.5 22.3
1 2 1 24 0.73 0.62 0.7 0.6 5.3 6.3 5.3 6.2 19.7 19.7 18.2 18.2 114 124 96.6 112.5 117 117 109 109 0.88 1.06 0.89 1.03 24.6 23.7
2 2 0 21 0.64 0.58 0.56 0.53 3.14 3.53 3.14 3.5 16.1 16.1 15.6 15.6 50.5 56.8 49 54.6 102 102 100 100 0.5 0.56 0.49 0.55 21.6 22
1 2 1 21 0.5 0.42 0.52 0.44 2.54 3.9 2.54 3.8 16.2 16.2 16.7 16.7 41.15 63.2 42.4 63.46 111 111 109 109 0.38 0.57 0.4 0.58 20 21.2
1 1 1 24 0.66 0.69 0.67 0.74 3.14 3.56 3.14 3.6 18 18 16.2 16.2 56.5 64.1 50.8 58.3 67.4 67.4 65.7 65.7 0.83 0.95 0.77 0.89 20.2 20.4
1 2 1 19 0.61 0.59 0.71 0.64 2.84 3.2 2.84 3.4 14 14 17.9 17.9 39.8 44.8 50.8 60.9 71.2 71.2 75.6 75.6 0.56 0.63 0.67 0.8 19.5 20
1 2 1 21 0.82 0.8 0.8 0.77 3.14 3.69 3.14 3.62 31.2 31.2 29.5 29.5 97.9 115.1 92.6 106.8 95.3 95.3 91.7 91.7 1.02 1.2 1.01 1.16 19 19.2
1 2 1 25 0.9 0.84 0.86 0.83 4.52 5.5 4.52 5.55 16 16 15.8 5.8 72.3 88 71.4 87.7 86.3 86.3 81.2 81.2 0.84 1.02 0.88 1.08 22.4 21.7
2 2 1 22 0.86 0.76 0.82 0.72 4.15 5.4 4.15 5.5 13 13 14 14 54 70.2 58 77 75.7 75.7 68.5 68.5 0.71 0.92 0.84 1.12 22.4 23
1 1 2 21 0.58 0.55 0.56 0.54 3.14 4.1 3.14 4.3 17.3 17.3 15.6 15.6 54.3 70.9 48.9 67.1 120 120 115 115 0.45 0.59 0.43 0.58 20.4 20.5
2 2 1 20 0.85 0.9 0.8 0.86 3.46 3.79 3.46 3.68 15 15 18 18 51.9 56.8 62.3 66.2 67.5 67.5 66.3 66.3 0.76 0.84 0.92 1 20 20.5
1 2 1 20 0.57 0.47 0.6 0.5 3.14 3.48 3.14 3.38 11.5 11.5 12 12 36.1 38.9 37.7 40.5 85.6 85.6 83.9 83.9 0.42 0.45 0.45 0.48 20.4 20
1 1 0 24 0.56 0.53 0.63 0.6 3.4 4.5 3.4 4.2 13.8 13.8 13.9 13.9 46.9 62.1 47.3 58.8 145 145 138 138 0.33 0.43 0.34 0.42 24.2 24.4
1 2 1 20 0.88 0.83 0.81 0.8 2.84 4.1 2.84 4.2 17.9 17.9 19.6 19.6 50.8 73.9 55.6 83.5 97.6 97.6 94.7 94.7 0.52 0.76 0.58 0.8 20 21
1 2 1 20 1.15 1.05 1.2 1.1 3.14 3.9 3.14 4.2 16.6 16.6 17 17 52 65.6 53 71 86 86 79 79 0.6 0.75 0.64 0.8 19.8 20.4
1 2 0 21 1 0.96 0.95 0.9 2.84 3.6 2.84 3.4 30.2 30.2 30.4 30.4 85 108 86 104 112 112 110 110 0.8 1 0.75 0.95 21 21
2 2 0 22 0.36 0.4 0.46 0.42 2.54 3.2 2.54 3.25 18.4 18.4 14.6 14.6 46.7 59 37 47 138 138 105 105 0.34 0.42 0.35 0.45 20 20
3 2 2 22 0.43 0.5 0.45 0.47 2.84 4 2.84 4.1 22.5 22.5 23.6 23.6 64 90 67 96.7 184 184 198 198 0.35 0.49 0.34 0.48 20 21
1 2 1 22 0.78 0.7 0.75 0.65 3.8 4.7 3.8 4.5 28 28 27 27 106 131 102 121.5 132 132 136 136 0.8 1 0.75 0.9 20.8 21.1
1 2 1 21 0.46 0.4 0.5 0.45 3.46 4.32 3.46 4.6 22.5 22.5 19 19 78 97 65 90 119 119 112 112 0.65 0.81 0.6 0.8 21.4 21
1 2 1 21 0.84 0.94 0.9 0.96 3.8 5.1 3.8 4.9 21.6 21.6 20 20 82 111.5 76 98 96 96 102 102 0.86 1.16 0.75 1 21.8 21.6
1 2 1 23 0.7 0.73 0.65 0.66 3.14 3.73 3.46 3.85 13.5 13.5 20 20 42.4 50.3 69.2 77 79.5 79.5 76 76 0.53 0.63 0.7 0.9 21 22
2 2 2 25 0.56 0.65 0.6 0.7 6.1 7.7 5.8 7.4 9.2 9.2 12.2 12.2 56 70 70 89 85 85 92 92 0.7 0.8 0.75 0.95 26.5 26
2 2 2 21 0.9 0.82 0.92 0.9 2.84 3.7 2.84 3.8 20.5 20.5 19.6 19.6 58 76 55 75 65 65 63 63 0.9 1.16 0.9 1.15 20.8 21
3 2 2 21 0.9 0.88 0.96 0.92 3.14 4 3.14 3.82 12 12 15.6 15.6 38 49 49 59 66 66 65 65 0.57 0.73 0.67 0.8 21 20
1 1 1 19 0.6 0.52 0.56 0.53 2.54 2.98 2.54 2.8 14 14 15.4 15.4 35.8 42 39 43 82 82 75 75 0.43 0.51 0.52 0.57 18 17.5
1 1 1 24 0.9 1 0.96 1.15 4.9 6.2 5.3 5.5 17 17 17.5 17.5 84 106 92.7 96 77 77 79 79 1.1 1.4 1.1 1.23 26 26.2
1 1 1 22 0.6 0.53 0.7 0.65 3.46 4 3.46 3.74 13.3 13.3 15 15 46 53 52 55 99 99 100 100 0.46 0.53 0.5 0.58 22 22.2
1 2 1 21 1.2 1.18 1.25 1.2 3.14 3.6 3.14 3.7 25 25 24 24 79 91 74 90 71 71 70 70 1.1 1.3 1.05 1.06 21 20.8
0 1 0 22 0.88 0.9 0.9 0.88 3.8 4.6 3.8 4.7 13.6 13.6 13.5 13.5 52 62 51 65 93 93 100 100 0.56 0.67 0.51 0.65 22 22.1
1 1 1 22 0.72 0.78 0.74 0.8 4.15 6 4.15 6.1 16 16 19 19 68 101 80 122 134 134 132 132 0.5 0.76 0.61 0.88 22 22.5
1 1 1 20 0.46 0.44 0.45 0.44 3.8 4.6 3.8 4.65 17 17 18 18 65 79 68 84 150 150 145 145 0.44 0.54 0.46 0.58 20 21
1 2 2 22 0.8 0.68 0.78 0.66 2.54 3.6 2.54 3.7 35 35 35.5 35.5 89 126 90 131 108 108 106 106 0.82 1.16 0.84 1.2 19.6 20.4
1 1 1 20 0.62 0.69 0.65 0.73 3.14 3.6 3.14 3.8 18.5 18.5 16 16 58 66 50 61 86 86 83 83 0.67 0.78 0.6 0.73 20.8 21.1
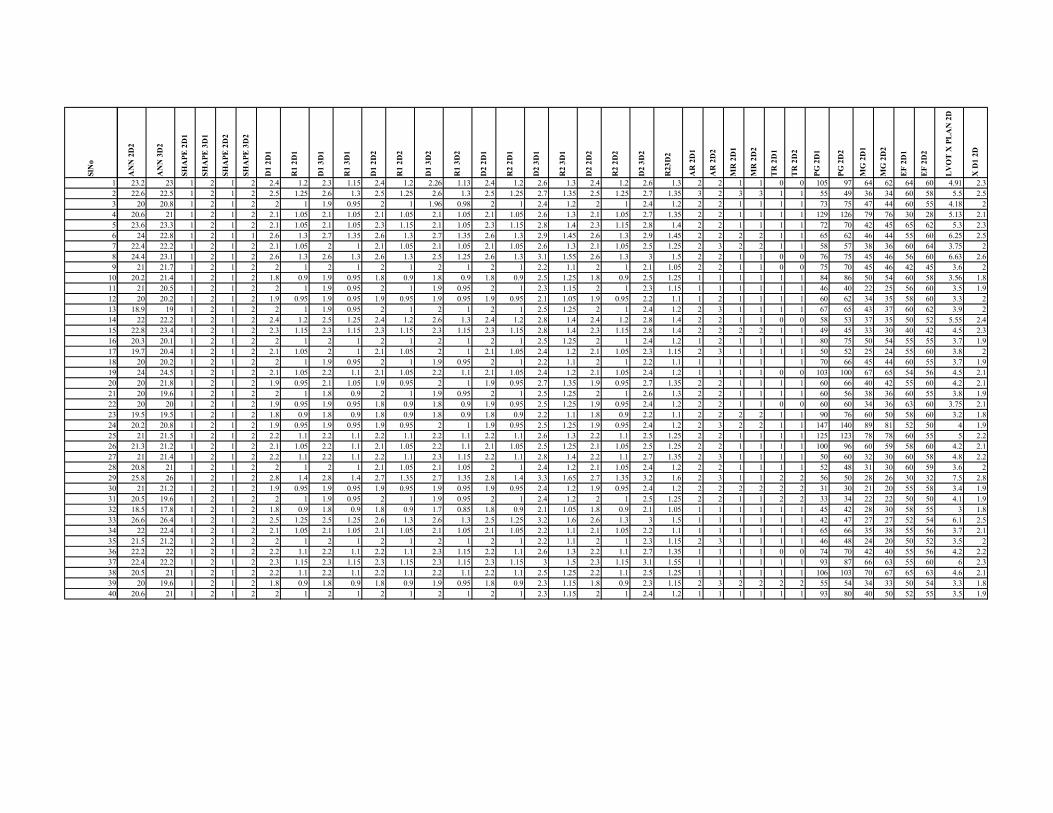
SlN
o
1
2
3
4
5
6
7
8
9
10
11
12
13
14
15
16
17
18
19
20
21
22
23
24
25
26
27
28
29
30
31
32
33
34
35
36
37
38
39
40
AN
N 2
D2
AN
N 3
D2
SH
AP
E 2
D1
SH
AP
E 3
D1
SH
AP
E 2
D2
SH
AP
E 3
D2
D1
2D
1
R1
2D
1
D1
3D
1
R1
3D
1
D1
2D
2
R1
2D
2
D1
3D
2
R1
3D
2
D2
2D
1
R2
2D
1
D2
3D
1
R2
3D
1
D2
2D
2
R2
2D
2
D2
3D
2
R23
D2
AR
2D
1
AR
2D
2
MR
2D
1
MR
2D
2
TR
2D
1
TR
2D
2
PG
2D
1
PG
2D
2
MG
2D
1
MG
2D
2
EF
2D
1
EF
2D
2
LV
OT
X P
LA
N 2
D
X D
1 2D
23.2 23 1 2 1 2 2.4 1.2 2.3 1.15 2.4 1.2 2.26 1.13 2.4 1.2 2.6 1.3 2.4 1.2 2.6 1.3 2 2 1 1 0 0 105 97 64 62 64 60 4.91 2.3
22.6 22.5 1 2 1 2 2.5 1.25 2.6 1.3 2.5 1.25 2.6 1.3 2.5 1.25 2.7 1.35 2.5 1.25 2.7 1.35 3 2 3 3 1 1 55 49 36 34 60 58 5.5 2.5
20 20.8 1 2 1 2 2 1 1.9 0.95 2 1 1.96 0.98 2 1 2.4 1.2 2 1 2.4 1.2 2 2 1 1 1 1 73 75 47 44 60 55 4.18 2
20.6 21 1 2 1 2 2.1 1.05 2.1 1.05 2.1 1.05 2.1 1.05 2.1 1.05 2.6 1.3 2.1 1.05 2.7 1.35 2 2 1 1 1 1 129 126 79 76 30 28 5.13 2.1
23.6 23.3 1 2 1 2 2.1 1.05 2.1 1.05 2.3 1.15 2.1 1.05 2.3 1.15 2.8 1.4 2.3 1.15 2.8 1.4 2 2 1 1 1 1 72 70 42 45 65 62 5.3 2.3
24 22.8 1 2 1 1 2.6 1.3 2.7 1.35 2.6 1.3 2.7 1.35 2.6 1.3 2.9 1.45 2.6 1.3 2.9 1.45 2 2 2 2 1 1 65 62 46 44 55 60 6.25 2.5
22.4 22.2 1 2 1 2 2.1 1.05 2 1 2.1 1.05 2.1 1.05 2.1 1.05 2.6 1.3 2.1 1.05 2.5 1.25 2 3 2 2 1 1 58 57 38 36 60 64 3.75 2
24.4 23.1 1 2 1 2 2.6 1.3 2.6 1.3 2.6 1.3 2.5 1.25 2.6 1.3 3.1 1.55 2.6 1.3 3 1.5 2 2 1 1 0 0 76 75 45 46 56 60 6.63 2.6
21 21.7 1 2 1 2 2 1 2 1 2 1 2 1 2 1 2.2 1.1 2 1 2.1 1.05 2 2 1 1 0 0 75 70 45 46 42 45 3.6 2
20.2 21.4 1 2 1 2 1.8 0.9 1.9 0.95 1.8 0.9 1.8 0.9 1.8 0.9 2.5 1.25 1.8 0.9 2.5 1.25 1 1 1 1 1 1 84 86 50 54 60 58 3.56 1.8
21 20.5 1 2 1 2 2 1 1.9 0.95 2 1 1.9 0.95 2 1 2.3 1.15 2 1 2.3 1.15 1 1 1 1 1 1 46 40 22 25 56 60 3.5 1.9
20 20.2 1 2 1 2 1.9 0.95 1.9 0.95 1.9 0.95 1.9 0.95 1.9 0.95 2.1 1.05 1.9 0.95 2.2 1.1 1 2 1 1 1 1 60 62 34 35 58 60 3.3 2
18.9 19 1 2 1 2 2 1 1.9 0.95 2 1 2 1 2 1 2.5 1.25 2 1 2.4 1.2 2 3 1 1 1 1 67 65 43 37 60 62 3.9 2
22 22.2 1 2 1 2 2.4 1.2 2.5 1.25 2.4 1.2 2.6 1.3 2.4 1.2 2.8 1.4 2.4 1.2 2.8 1.4 2 2 1 1 0 0 58 53 37 35 50 52 5.55 2.4
22.8 23.4 1 2 1 2 2.3 1.15 2.3 1.15 2.3 1.15 2.3 1.15 2.3 1.15 2.8 1.4 2.3 1.15 2.8 1.4 2 2 2 2 1 1 49 45 33 30 40 42 4.5 2.3
20.3 20.1 1 2 1 2 2 1 2 1 2 1 2 1 2 1 2.5 1.25 2 1 2.4 1.2 1 2 1 1 1 1 80 75 50 54 55 55 3.7 1.9
19.7 20.4 1 2 1 2 2.1 1.05 2 1 2.1 1.05 2 1 2.1 1.05 2.4 1.2 2.1 1.05 2.3 1.15 2 3 1 1 1 1 50 52 25 24 55 60 3.8 2
20 20.2 1 2 1 2 2 1 1.9 0.95 2 1 1.9 0.95 2 1 2.2 1.1 2 1 2.2 1.1 1 1 1 1 1 70 66 45 44 60 55 3.7 1.9
24 24.5 1 2 1 2 2.1 1.05 2.2 1.1 2.1 1.05 2.2 1.1 2.1 1.05 2.4 1.2 2.1 1.05 2.4 1.2 1 1 1 1 0 0 103 100 67 65 54 56 4.5 2.1
20 21.8 1 2 1 2 1.9 0.95 2.1 1.05 1.9 0.95 2 1 1.9 0.95 2.7 1.35 1.9 0.95 2.7 1.35 2 2 1 1 1 1 60 66 40 42 55 60 4.2 2.1
20 19.6 1 2 1 2 2 1 1.8 0.9 2 1 1.9 0.95 2 1 2.5 1.25 2 1 2.6 1.3 2 2 1 1 1 1 60 56 38 36 60 55 3.8 1.9
20 20 1 2 1 2 1.9 0.95 1.9 0.95 1.8 0.9 1.8 0.9 1.9 0.95 2.5 1.25 1.9 0.95 2.4 1.2 2 2 1 1 0 0 60 60 34 36 63 60 3.75 2.1
19.5 19.5 1 2 1 2 1.8 0.9 1.8 0.9 1.8 0.9 1.8 0.9 1.8 0.9 2.2 1.1 1.8 0.9 2.2 1.1 2 2 2 2 1 1 90 76 60 50 58 60 3.2 1.8
20.2 20.8 1 2 1 2 1.9 0.95 1.9 0.95 1.9 0.95 2 1 1.9 0.95 2.5 1.25 1.9 0.95 2.4 1.2 2 3 2 2 1 1 147 140 89 81 52 50 4 1.9
21 21.5 1 2 1 2 2.2 1.1 2.2 1.1 2.2 1.1 2.2 1.1 2.2 1.1 2.6 1.3 2.2 1.1 2.5 1.25 2 2 1 1 1 1 125 123 78 78 60 55 5 2.2
21.3 21.2 1 2 1 2 2.1 1.05 2.2 1.1 2.1 1.05 2.2 1.1 2.1 1.05 2.5 1.25 2.1 1.05 2.5 1.25 2 2 1 1 1 1 100 96 60 59 58 60 4.2 2.1
21 21.4 1 2 1 2 2.2 1.1 2.2 1.1 2.2 1.1 2.3 1.15 2.2 1.1 2.8 1.4 2.2 1.1 2.7 1.35 2 3 1 1 1 1 50 60 32 30 60 58 4.8 2.2
20.8 21 1 2 1 2 2 1 2 1 2.1 1.05 2.1 1.05 2 1 2.4 1.2 2.1 1.05 2.4 1.2 2 2 1 1 1 1 52 48 31 30 60 59 3.6 2
25.8 26 1 2 1 2 2.8 1.4 2.8 1.4 2.7 1.35 2.7 1.35 2.8 1.4 3.3 1.65 2.7 1.35 3.2 1.6 2 3 1 1 2 2 56 50 28 26 30 32 7.5 2.8
21 21.2 1 2 1 2 1.9 0.95 1.9 0.95 1.9 0.95 1.9 0.95 1.9 0.95 2.4 1.2 1.9 0.95 2.4 1.2 2 2 2 2 2 2 31 30 21 20 55 58 3.4 1.9
20.5 19.6 1 2 1 2 2 1 1.9 0.95 2 1 1.9 0.95 2 1 2.4 1.2 2 1 2.5 1.25 2 2 1 1 2 2 33 34 22 22 50 50 4.1 1.9
18.5 17.8 1 2 1 2 1.8 0.9 1.8 0.9 1.8 0.9 1.7 0.85 1.8 0.9 2.1 1.05 1.8 0.9 2.1 1.05 1 1 1 1 1 1 45 42 28 30 58 55 3 1.8
26.6 26.4 1 2 1 2 2.5 1.25 2.5 1.25 2.6 1.3 2.6 1.3 2.5 1.25 3.2 1.6 2.6 1.3 3 1.5 1 1 1 1 1 1 42 47 27 27 52 54 6.1 2.5
22 22.4 1 2 1 2 2.1 1.05 2.1 1.05 2.1 1.05 2.1 1.05 2.1 1.05 2.2 1.1 2.1 1.05 2.2 1.1 1 1 1 1 1 1 65 66 35 38 55 56 3.7 2.1
21.5 21.2 1 2 1 2 2 1 2 1 2 1 2 1 2 1 2.2 1.1 2 1 2.3 1.15 2 3 1 1 1 1 46 48 24 20 50 52 3.5 2
22.2 22 1 2 1 2 2.2 1.1 2.2 1.1 2.2 1.1 2.3 1.15 2.2 1.1 2.6 1.3 2.2 1.1 2.7 1.35 1 1 1 1 0 0 74 70 42 40 55 56 4.2 2.2
22.4 22.2 1 2 1 2 2.3 1.15 2.3 1.15 2.3 1.15 2.3 1.15 2.3 1.15 3 1.5 2.3 1.15 3.1 1.55 1 1 1 1 1 1 93 87 66 63 55 60 6 2.3
20.5 21 1 2 1 2 2.2 1.1 2.2 1.1 2.2 1.1 2.2 1.1 2.2 1.1 2.5 1.25 2.2 1.1 2.5 1.25 1 1 1 1 1 1 106 103 70 67 65 63 4.6 2.1
20 19.6 1 2 1 2 1.8 0.9 1.8 0.9 1.8 0.9 1.9 0.95 1.8 0.9 2.3 1.15 1.8 0.9 2.3 1.15 2 3 2 2 2 2 55 54 34 33 50 54 3.3 1.8
20.6 21 1 2 1 2 2 1 2 1 2 1 2 1 2 1 2.3 1.15 2 1 2.4 1.2 1 1 1 1 1 1 93 80 40 50 52 55 3.5 1.9

SlN
o
1
2
3
4
5
6
7
8
9
10
11
12
13
14
15
16
17
18
19
20
21
22
23
24
25
26
27
28
29
30
31
32
33
34
35
36
37
38
39
40
X R
12D
X D
2 2D
XR
2 2
D
SW
S 2
D
SW
D 2
D
PW
S 2
D
PW
D 2
D
LV
DF
2D
TA
PS
E 2
D
OT
HE
RS
1.15 2.6 1.3 20 16 15 12 0 17
1.25 2.9 1.45 18 13 17 14 0 16
1 2.5 1.25 16 14 14 12 1 17
1.05 2.7 1.35 16 12 14 12 3 15
1.15 2.9 1.45 22 16 16 13 1 16
1.25 3 1.5 16 12 15 13 1 18
1 2.3 1.15 16 12 12 10 1 16 MS 12/6 DVR
1.3 3.1 1.55 20 15 17 12 1 19
1 2.3 1.15 19 14 15 12 3 18
0.9 2.4 1.2 23 18 18 14 1 18
0.95 2.5 1.25 18 15 15 12 1 19 BPH
1 2.5 1.25 18 12 15 11 1 18
1 2.5 1.25 17 14 14 10 1 15 TRACHEOSTOMISED
1.2 2.8 1.4 16 12 14 11 1 18
1.15 3 1.5 12 10 11 9 3 16
0.95 2.3 1.15 16 13 15 12 1 20
1 2.5 1.25 17 13 16 13 1 17
0.95 2.4 1.2 18 14 14 12 1 18
1.05 2.4 1.2 16 12 15 13 1 18
1.05 2.6 1.3 20 18 18 16 1 18
0.95 2.3 1.15 14 12 12 10 1 18
1.05 2.5 1.25 19 17 15 11 1 16
0.9 2.1 1.05 16 14 14 12 1 18
0.95 2.4 1.2 20 16 17 14 2 12 DVR MR-3
1.1 2.7 1.35 21 17 119 15 1 16 CT ANN-22X26,LVOT 21X27
1.05 2.5 1.25 20 14 14 12 1 18
1.1 2.6 1.3 18 16 17 14 1 18
1 2.4 1.2 16 12 15 11 1 16
1.4 3.2 1.6 14 11 11 9 3 14 DILATED ASC AORTA, PLASTY
0.95 2.2 1.1 13 11 12 10 1 16 MOD MS, DVR
0.95 2.4 1.2 12 10 12 10 3 12 DVR, MS3
0.9 2.1 1.05 14 12 12 10 1 18
1.25 3.2 1.6 16 12 12 10 1 18 LF,LG,AS
1.05 2.2 1.1 16 12 12 10 1 16
1 2.2 1.1 14 12 12 10 1 18 MOD AR
1.1 2.5 1.25 16 14 14 11 1 17
1.15 3 1.5 16 12 15 11 1 22
1.05 2.6 1.3 21 19 17 50 1 16
0.9 2.3 1.15 18 13 16 14 1 18
0.95 2.2 1.1 25 22 18 16 1 16