comparison between cfd and measurements for real … · holden, michael dufrene, aaron cubrc, inc....
TRANSCRIPT

Comparison between CFD and Measurements
for Real-gas Effects on Laminar Shockwave
Boundary Layer Interaction, I.
20 June 2014
MacLean, Matthew Holden, Michael Dufrene, Aaron
CUBRC, Inc.
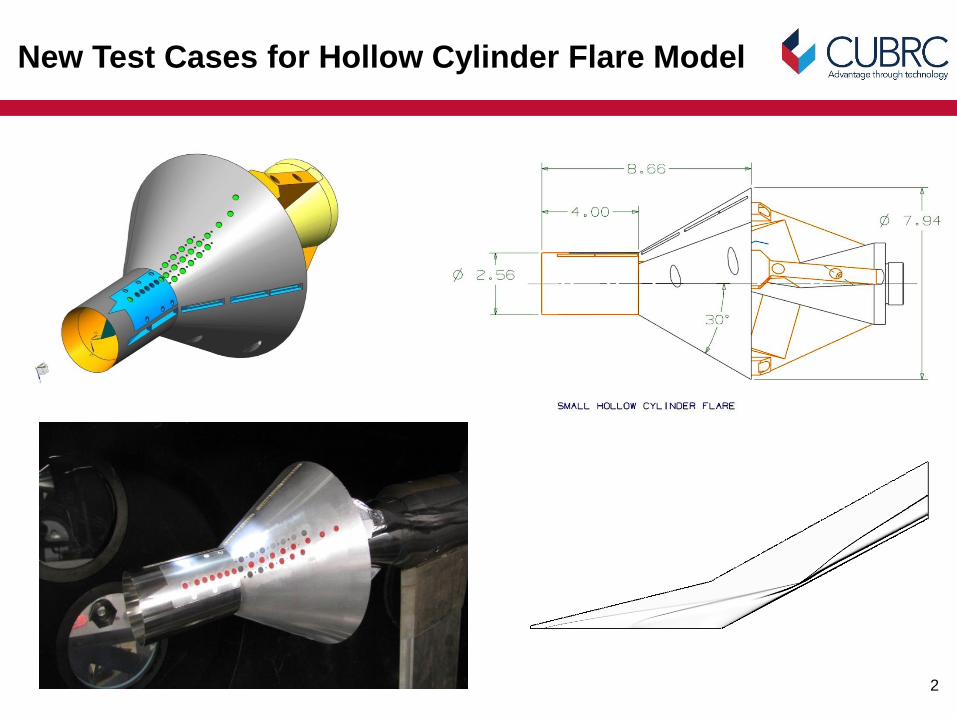
New Test Cases for Hollow Cylinder Flare Model
2

New Test Cases for Double Cone Model
3

Comparisons to Previous Data Obtained over Double
Cone Model from LENS-I Reflected Shock Tunnel
4
3 MJ/kg (2.5 km/s) Nitrogen
5 MJ/kg (3 km/s) Air
10 MJ/kg (4.5 km/s) Air

Test Conditions for Double Cone and Hollow Cylinder
Flare Experiments
5
Double Cone
Hollow Cylinder Flare

Operation schematic of an Expansion Tunnel
DRIVER TEST GAS ACCELERATION GAS
1. Three tubes initially separated by diaphragms (test gas shown in center tube)
2. Breaking the primary diaphragm transmits a shock into the test gas, increasing its pressure
3. When the shock reaches the secondary diaphragm, the higher pressure test gas breaks it and causes the test gas to expand into the acceleration tube
3. The expanding test gas cools and gains velocity while it drives a very strong shock through the acceleration gas ahead of it
5. Testing begins as soon as the test gas arrives at the test station and lasts until the unsteady expansion fan begins to alter the freestream state of the gas [ O(~1ms) ]
Freestream gas
Freestream gas Shock-heated accelerator gas
6

Wave Diagram of an Expansion Tunnel showing Propagation of Shocks, Expansions, and Contact Surfaces
freestream (5)
Test Time Limited by Two Factors:
•Head of unsteady expansion (reflected off primary contact)
•Tail of unsteady expansion
TEST TIME
DRIVER TEST GAS ACCELERATION GAS
1
10
4
3 2
5
20
TIM
E (
t)
POSITION (x)
unsteady expansion adds kinetic energy directly
(U5 >> U2)
expansion wave
contact surface
shock
assume:
P4 >> P1 >> P10
peak temperature (2)
7
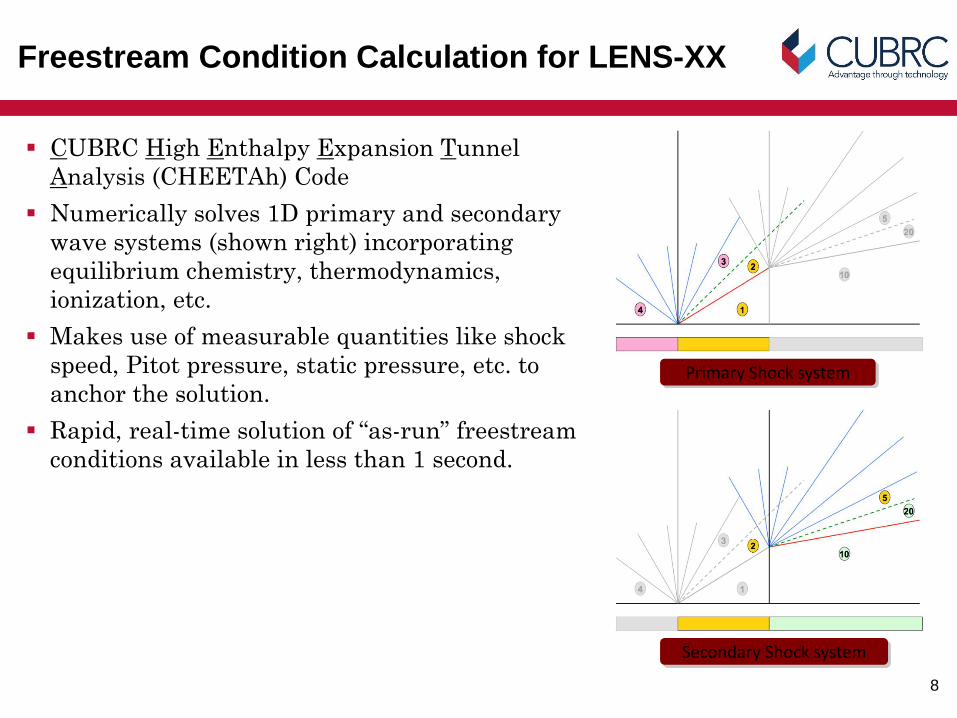
Freestream Condition Calculation for LENS-XX
CUBRC High Enthalpy Expansion Tunnel
Analysis (CHEETAh) Code
Numerically solves 1D primary and secondary
wave systems (shown right) incorporating
equilibrium chemistry, thermodynamics,
ionization, etc.
Makes use of measurable quantities like shock
speed, Pitot pressure, static pressure, etc. to
anchor the solution.
Rapid, real-time solution of “as-run” freestream
conditions available in less than 1 second.
Secondary Shock system
Primary Shock system
8

Development of Separated Region over
Double Cone: Run 05
Arrival of initial gas marked approximately by time=0.0 Separation length estimated using distance from the corner forward to the point where
heat flux sharply drops on the front cone (eyeballed). Accelerator gas pre-cursor time is shown in yellow, followed by establishing test gas
shown in gray – the accelerator gas partially develops the separated region. As pressure and heat flux rise post-test as shown in blue, separation point remains
invariant for quite a while. 9

Development of Separated Region over
Hollow Cylinder Flare: Run 04
Separation region size is approximately 2.5X the size observed on the double-cone; establishment timescale seems to increase correspondingly.
In all cases, the hollow cylinder “over-shoots” (separated region gets too large) immediately after the contact surface arrives, and then shrinks back to its minimum observed size (recall the CFD solutions over-predict this).
Post-test as pressure and heat flux rises on the model, separation region increases again (as Reynolds number increases)
10

Freestream Conditions
Run # Total Enthalpy
(MJ/kg) Mach Number
Pitot Pressure (kPa)
Unit Reynolds Number
/106 (1/m)
Velocity (km/s)
Density (g/m3)
Temperature (K)
1 5.44 12.2 5.1 0.14 3.246 0.499 175
2 9.65 10.90 17.5 0.19 4.303 0.984 389
3 18.70 13.23 18.0 0.11 6.028 0.510 521
4 21.77 12.82 39.5 0.20 6.497 0.964 652
5 18.51 13.14 36.8 0.23 5.996 1.057 523
6 15.23 11.46 59.0 0.39 5.466 2.045 573
Run # Total Enthalpy
/106 (ft2/s2) Mach Number
Pitot Pressure (psia)
Unit Reynolds Number
/103 (1/ft)
Velocity (kft/s)
Density x106 (sl/ft3)
Temperature (R)
1 58.2 12.2 0.74 43 10.65 0.968 315
2 103.2 10.9 2.54 58 14.11 1.909 700
3 199.9 13.23 2.61 34 19.77 0.990 938
4 232.7 12.82 5.73 61 21.31 1.871 1174
5 197.9 13.14 5.34 70 19.67 2.051 941
6 163.9 11.3 8.55 119 17.93 3.968 1031 11

Run 01: [3.2 km/s, 0.5 g/m3]
12

Run 02: [4.3 km/s, 1.0 g/m3]
13

Run 03: [6.0 km/s, 0.5 g/m3]
14

Run 04: [6.5 km/s, 1.0 g/m3]
15

Run 05: [6.0 km/s, 1.1 g/m3]
16

Run 06: [5.4 km/s, 2.1 g/m3]
17

Reynolds Number Trend in Experimental Data
18

Velocity (Enthalpy) Trend in Experimental Data
19

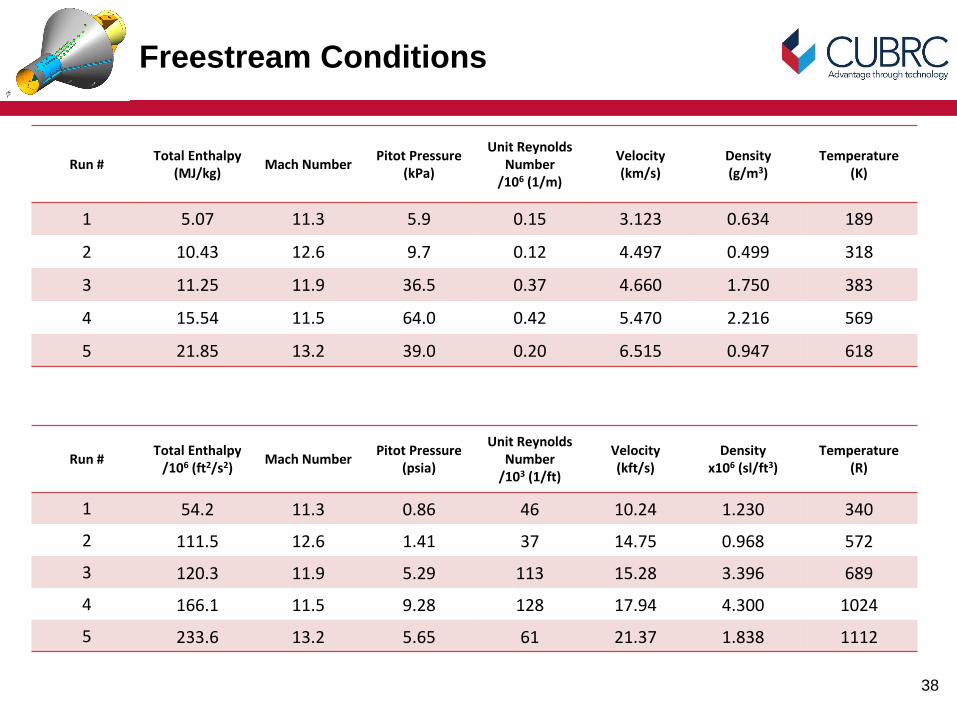
Freestream Conditions
Run # Total Enthalpy
(MJ/kg) Mach Number
Pitot Pressure (kPa)
Unit Reynolds Number
/106 (1/m)
Velocity (km/s)
Density (g/m3)
Temperature (K)
1 5.07 11.3 5.9 0.15 3.123 0.634 189
2 10.43 12.6 9.7 0.12 4.497 0.499 318
3 11.25 11.9 36.5 0.37 4.660 1.750 383
4 15.54 11.5 64.0 0.42 5.470 2.216 569
5 21.85 13.2 39.0 0.20 6.515 0.947 618
Run # Total Enthalpy
/106 (ft2/s2) Mach Number
Pitot Pressure (psia)
Unit Reynolds Number
/103 (1/ft)
Velocity (kft/s)
Density x106 (sl/ft3)
Temperature (R)
1 54.2 11.3 0.86 46 10.24 1.230 340
2 111.5 12.6 1.41 37 14.75 0.968 572
3 120.3 11.9 5.29 113 15.28 3.396 689
4 166.1 11.5 9.28 128 17.94 4.300 1024
5 233.6 13.2 5.65 61 21.37 1.838 1112
20

Run 01: [3.1 km/s, 0.6 g/m3]
21

Run 02: [4.5 km/s, 0.5 g/m3]
22

Run 03: [4.7 km/s, 1.8 g/m3]
23

Run 04: [5.5 km/s, 2.2 g/m3]
24

Run 05: [6.5 km/s, 0.9 g/m3]
25

Reynolds Number Trend in Experimental
Data
26

Double Cone Data Obtained in LENS-I vs
LENS-XX
27
5 MJ/kg (3 km/s) 10 MJ/kg (4.5 km/s)
LENS-I
LENS-XX
NOTE: Reynolds numbers are not the same between the two tunnels!

Unique dataset of laminar shock/BL-interaction experiments
available from LENS-XX from 3 to 6.5 km/s freestream velocity.
Comparison between LENS-I and LENS-XX at 5 and 10 MJ/kg
compares favorably.
Comparisons with CFD to be made at end of session.
Conclusions
28

Comparison between CFD and Measurements
for Real-gas Effects on Laminar Shockwave
Boundary Layer Interaction, II.
20 June 2014
MacLean, Matthew Holden, Michael Dufrene, Aaron
CUBRC, Inc.

Model Configurations
30

Freestream Conditions
Run # Total Enthalpy
(MJ/kg) Mach Number
Pitot Pressure (kPa)
Unit Reynolds Number
/106 (1/m)
Velocity (km/s)
Density (g/m3)
Temperature (K)
1 5.44 12.2 5.1 0.14 3.246 0.499 175
2 9.65 10.90 17.5 0.19 4.303 0.984 389
3 18.70 13.23 18.0 0.11 6.028 0.510 521
4 21.77 12.82 39.5 0.20 6.497 0.964 652
5 18.51 13.14 36.8 0.23 5.996 1.057 523
6 15.23 11.46 59.0 0.39 5.466 2.045 573
Run # Total Enthalpy
/106 (ft2/s2) Mach Number
Pitot Pressure (psia)
Unit Reynolds Number
/103 (1/ft)
Velocity (kft/s)
Density x106 (sl/ft3)
Temperature (R)
1 58.2 12.2 0.74 43 10.65 0.968 315
2 103.2 10.9 2.54 58 14.11 1.909 700
3 199.9 13.23 2.61 34 19.77 0.990 938
4 232.7 12.82 5.73 61 21.31 1.871 1174
5 197.9 13.14 5.34 70 19.67 2.051 941
6 163.9 11.3 8.55 119 17.93 3.968 1031 31

Run 01: [3.2 km/s, 0.5 g/m3]
32

Run 02: [4.3 km/s, 1.0 g/m3]
33

Run 03: [6.0 km/s, 0.5 g/m3]
34

Run 04: [6.5 km/s, 1.0 g/m3]
35

Run 05: [6.0 km/s, 1.1 g/m3]
36

Run 06: [5.4 km/s, 2.1 g/m3]
37
Freestream Conditions
Run # Total Enthalpy
(MJ/kg) Mach Number
Pitot Pressure (kPa)
Unit Reynolds Number
/106 (1/m)
Velocity (km/s)
Density (g/m3)
Temperature (K)
1 5.07 11.3 5.9 0.15 3.123 0.634 189
2 10.43 12.6 9.7 0.12 4.497 0.499 318
3 11.25 11.9 36.5 0.37 4.660 1.750 383
4 15.54 11.5 64.0 0.42 5.470 2.216 569
5 21.85 13.2 39.0 0.20 6.515 0.947 618
Run # Total Enthalpy
/106 (ft2/s2) Mach Number
Pitot Pressure (psia)
Unit Reynolds Number
/103 (1/ft)
Velocity (kft/s)
Density x106 (sl/ft3)
Temperature (R)
1 54.2 11.3 0.86 46 10.24 1.230 340
2 111.5 12.6 1.41 37 14.75 0.968 572
3 120.3 11.9 5.29 113 15.28 3.396 689
4 166.1 11.5 9.28 128 17.94 4.300 1024
5 233.6 13.2 5.65 61 21.37 1.838 1112
38

Run 01: [3.1 km/s, 0.6 g/m3]
39

Run 01: [3.1 km/s, 0.6 g/m3]
40

Run 02: [4.5 km/s, 0.5 g/m3]
41
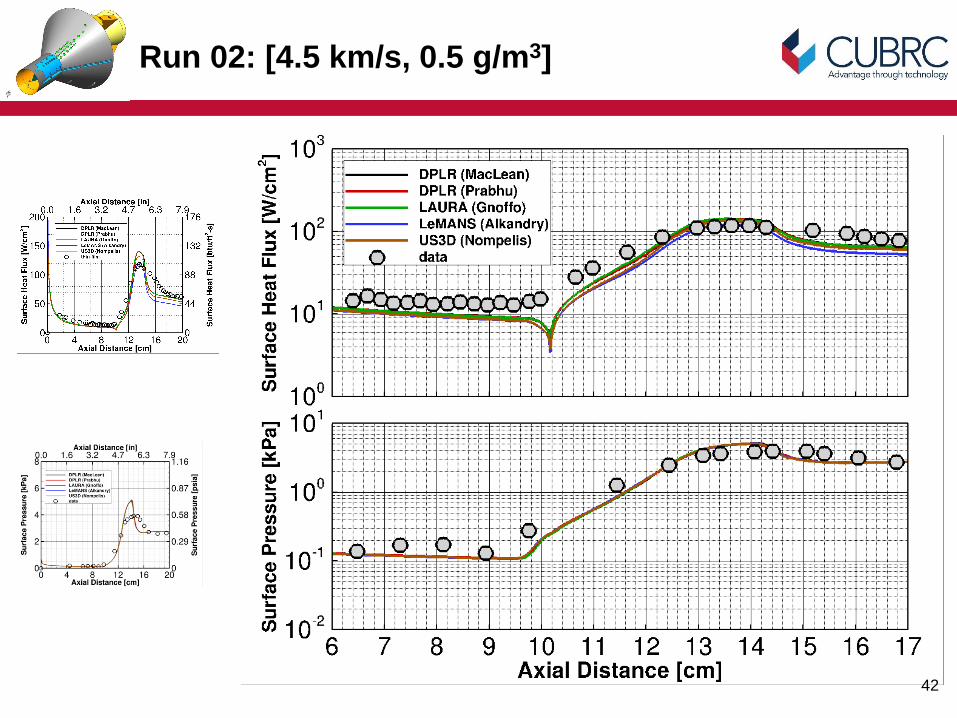
Run 02: [4.5 km/s, 0.5 g/m3]
42

Run 03: [4.7 km/s, 1.8 g/m3]
43

Run 03: [4.7 km/s, 1.8 g/m3]
44

Run 04: [5.5 km/s, 2.2 g/m3]
45

Run 04: [5.5 km/s, 2.2 g/m3]
46

Run 05: [6.5 km/s, 0.9 g/m3]
47

Run 05: [6.5 km/s, 0.9 g/m3]
48

Dataset of laminar shock/BL-interaction experiments available
from LENS-XX from 3 to 6.5 km/s freestream velocity.
In general, the CFD simulations are very consistent with each
other except for specific instances shown during the
presentation.
In general, the CFD tends toward over-predicting separated
region length on the hollow cylinder flare and under-predicting
separated region length on the double cone.
Data on the hollow cylinder flare in the attachment region
shows consistently broader character than the CFD predicts –
reason unclear.
Conclusions
49