comparing visual-interactive labeling with active learning
TRANSCRIPT
Comparing Visual-Interactive Labeling with Active Learning:An Experimental Study
Jurgen Bernard, Marco Hutter, Matthias Zeppelzauer, Dieter Fellner, and Michael Sedlmair
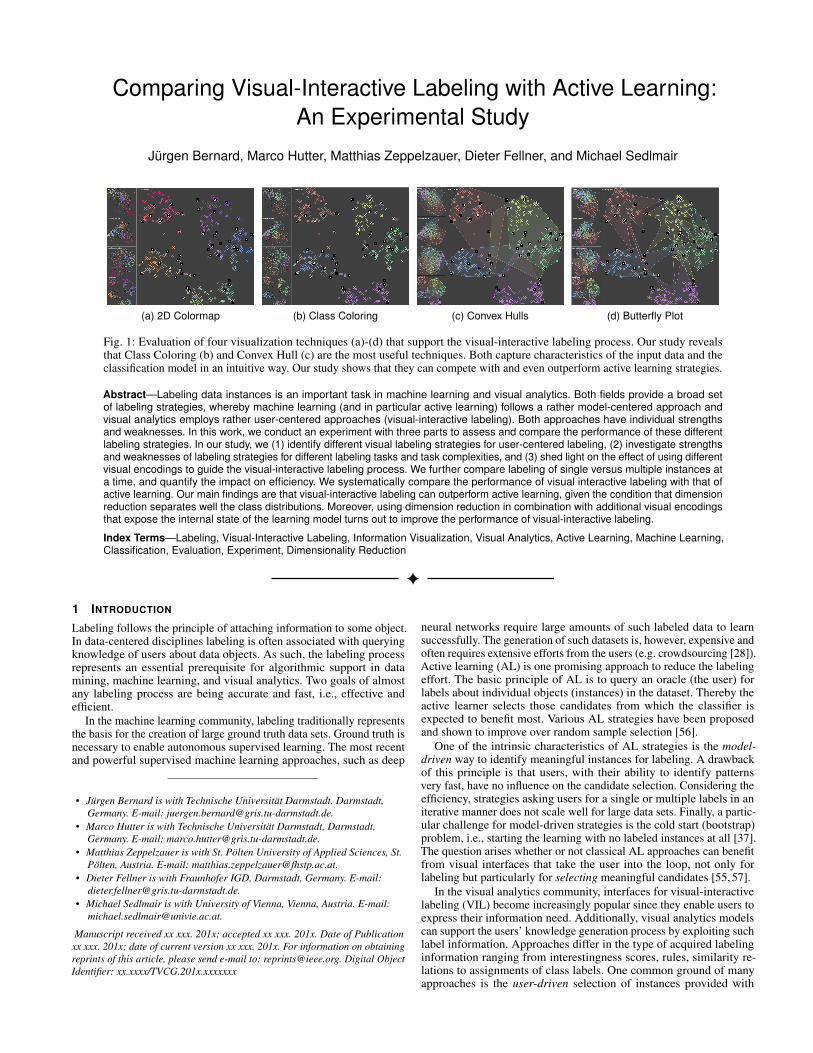
(a) 2D Colormap (b) Class Coloring (c) Convex Hulls (d) Butterfly Plot
Fig. 1: Evaluation of four visualization techniques (a)-(d) that support the visual-interactive labeling process. Our study revealsthat Class Coloring (b) and Convex Hull (c) are the most useful techniques. Both capture characteristics of the input data and theclassification model in an intuitive way. Our study shows that they can compete with and even outperform active learning strategies.
Abstract—Labeling data instances is an important task in machine learning and visual analytics. Both fields provide a broad setof labeling strategies, whereby machine learning (and in particular active learning) follows a rather model-centered approach andvisual analytics employs rather user-centered approaches (visual-interactive labeling). Both approaches have individual strengthsand weaknesses. In this work, we conduct an experiment with three parts to assess and compare the performance of these differentlabeling strategies. In our study, we (1) identify different visual labeling strategies for user-centered labeling, (2) investigate strengthsand weaknesses of labeling strategies for different labeling tasks and task complexities, and (3) shed light on the effect of using differentvisual encodings to guide the visual-interactive labeling process. We further compare labeling of single versus multiple instances ata time, and quantify the impact on efficiency. We systematically compare the performance of visual interactive labeling with that ofactive learning. Our main findings are that visual-interactive labeling can outperform active learning, given the condition that dimensionreduction separates well the class distributions. Moreover, using dimension reduction in combination with additional visual encodingsthat expose the internal state of the learning model turns out to improve the performance of visual-interactive labeling.
Index Terms—Labeling, Visual-Interactive Labeling, Information Visualization, Visual Analytics, Active Learning, Machine Learning,Classification, Evaluation, Experiment, Dimensionality Reduction
1 INTRODUCTION
Labeling follows the principle of attaching information to some object.In data-centered disciplines labeling is often associated with queryingknowledge of users about data objects. As such, the labeling processrepresents an essential prerequisite for algorithmic support in datamining, machine learning, and visual analytics. Two goals of almostany labeling process are being accurate and fast, i.e., effective andefficient.
In the machine learning community, labeling traditionally representsthe basis for the creation of large ground truth data sets. Ground truth isnecessary to enable autonomous supervised learning. The most recentand powerful supervised machine learning approaches, such as deep
• Jurgen Bernard is with Technische Universitat Darmstadt, Darmstadt,Germany. E-mail: [email protected].
• Marco Hutter is with Technische Universitat Darmstadt, Darmstadt,Germany. E-mail: [email protected].
• Matthias Zeppelzauer is with St. Polten University of Applied Sciences, St.Polten, Austria. E-mail: [email protected].
• Dieter Fellner is with Fraunhofer IGD, Darmstadt, Germany. E-mail:[email protected].
• Michael Sedlmair is with University of Vienna, Vienna, Austria. E-mail:[email protected].
Manuscript received xx xxx. 201x; accepted xx xxx. 201x. Date of Publicationxx xxx. 201x; date of current version xx xxx. 201x. For information on obtainingreprints of this article, please send e-mail to: [email protected]. Digital ObjectIdentifier: xx.xxxx/TVCG.201x.xxxxxxx
neural networks require large amounts of such labeled data to learnsuccessfully. The generation of such datasets is, however, expensive andoften requires extensive efforts from the users (e.g. crowdsourcing [28]).Active learning (AL) is one promising approach to reduce the labelingeffort. The basic principle of AL is to query an oracle (the user) forlabels about individual objects (instances) in the dataset. Thereby theactive learner selects those candidates from which the classifier isexpected to benefit most. Various AL strategies have been proposedand shown to improve over random sample selection [56].
One of the intrinsic characteristics of AL strategies is the model-driven way to identify meaningful instances for labeling. A drawbackof this principle is that users, with their ability to identify patternsvery fast, have no influence on the candidate selection. Considering theefficiency, strategies asking users for a single or multiple labels in aniterative manner does not scale well for large data sets. Finally, a partic-ular challenge for model-driven strategies is the cold start (bootstrap)problem, i.e., starting the learning with no labeled instances at all [37].The question arises whether or not classical AL approaches can benefitfrom visual interfaces that take the user into the loop, not only forlabeling but particularly for selecting meaningful candidates [55, 57].
In the visual analytics community, interfaces for visual-interactivelabeling (VIL) become increasingly popular since they enable users toexpress their information need. Additionally, visual analytics modelscan support the users’ knowledge generation process by exploiting suchlabel information. Approaches differ in the type of acquired labelinginformation ranging from interestingness scores, rules, similarity re-lations to assignments of class labels. One common ground of manyapproaches is the user-driven selection of instances provided with
visual interfaces for the exploration and identification of interestinginstances. The motivation of users for the selection of particular in-stances can be diverse. It may be task-dependent but also the context,application field, and more intrinsic backgrounds of users may motivatethe instance selection. These different motivations may lead to biasedselections of instances that result in suboptimally trained models. Fol-lowing the principle of AL strategies, guiding users in the candidateidentification may be beneficial to mitigate subjective or suboptimalinstance selection.
Our research is motivated by observing the different strengths andweaknesses of the respective principles and the idea of a substanti-ated combination of mutual strengths in future approaches. Recentdevelopments in machine learning and visual analytics indicate thatthe two fields are getting closer, see for example a recent survey thatexposes the considerable overlap [43]. Furthermore, there have beenfirst initiatives to combine active learning and visual-interactive labelselection [22, 23, 55, 57]. We share the vision that the strengths of bothprinciples can be seamlessly combined in visual-interactive labelingsystems, raising the effectiveness and efficiency to new levels.
From our literature research, we conclude that the strengths andweaknesses of both principles have hardly been assessed in direct com-parison. There is a lack in formalizations of AL and VIL strategiesand more generally of labeling approaches in machine learning andvisual analytics. Thus, reliable decisions on whether or not to chooseone or the other approach are hardly feasible. A core driving question iswhether or not visual interfaces can improve labeling tasks, or whetherAL performs so well that they render visual interfaces redundant. Incase that VIL is really helpful, other interesting questions arise: Dousers have particular strategies for the identification of labeling candi-dates? How good are these strategies with respect to their performance?Under which circumstances does VIL help, and when not? How doesVIL perform for differently complex tasks? And how much and whatinformation about data and machine learning models should be repre-sented in visual interfaces? These questions have not been answeredyet and require a closer investigation.
To answer these questions and to provide a direct comparison ofVIL and AL labeling strategies, we perform an experimental study.As a basis for the study, we develop a flexible evaluation toolkit thatintegrates 16 different established AL strategies, five classifiers andfour visualization techniques (Sec. 3). Using this toolkit, we conductedan empirical study with 16 expert participants. Our study sheds lightinto (i) how VIL and AL techniques compare to each other, (ii) howthe complexity of the labeling situation impacts them, and (iii) thedifferences between single- and multi-instance labeling approaches(Sec. 5.1-5.2). We also (iv) characterize a set of labeling strategiesthat we found our participants applying in VIL conditions (Sec. 5.3).With these findings, we discuss lessons learned, insights gained, andpotential future work (Sec. 6).
Our investigation shows that VIL achieves similar performance toAL and in some settings even outperforms AL. It further points out newconnecting points where VIL and AL may benefit from each other. Thepresented investigation represents an important step towards a unifiedlabeling process that combines the individual strengths of user-centeredand model-centered strategies.
We present related work in the next section, followed by our baselineapproaches in Section 3, used for our experimental study. In Section 4,we introduce the experiment design, and present the experiment resultsin Section 5. We discuss follow-up insights in Section 6, and concludewith a discussion on limitations and future work.
2 RELATED WORK
Related work for our study comes from different domains. Thus wesubdivide the presentation of related work into three sections: relatedwork on active learning (Section 2.1), visual interactive labeling (Sec-tion 2.2) and previous studies on visual interactive labeling (Section2.3)
2.1 Active LearningActive learning (AL) is a special type of semi-supervised machinelearning which takes the user into the loop to query label information
to improve the training performance of a classifier. AL techniquesask (query) an oracle (the user) for specific instances instead of, e.g.,querying random instances. AL is especially useful in cases wherelarge portions of the data are unlabeled, or where manual labeling isexpensive. Thereby, the major goal of AL is to achieve high accuracywith a minimum of manual labeling effort. The core component ofAL is the candidate selection strategy which aims at identifying thoseinstances which would contribute most to the learning progress of themodel. The different classes of AL strategies are described in severalsurveys in detail [39, 56, 65, 68]. We partition AL strategies into fourmajor classes: (i) uncertainty sampling, (ii) error reduction schemes,(iii) relevance-based selection, and (iv) purely data-centered strategies.
Uncertainty sampling aims at finding the instances that the learner ismost uncertain or unsure about. A widely used strategy is to search forthose samples near the decision boundary of margin-based classifiers[72] also referred to as large-margin based AL [65]. Other strategiesmeasure the uncertainty of a committee of classifiers. In Query byCommittee (QBC) [60], each classifier of the ensemble is asked forlabelings. Instances are considered interesting when the committeedisagrees with respect to their labeling [36].
Error reduction schemes focus on the selection of those instanceswhich may change the underlying classification model most. Tech-niques focus either on the impact on the training error (expected modelchange) [59] or on the reduction of the generalization error (risk reduc-tion [42] and variance reduction [24]).
The third group of AL strategies focuses on relevance [67]. Basedon a relevance criterion, those instances are selected which have thehighest probability to be relevant for a certain class. This strategy fostersthe identification of positive examples for a class. This is particularlyuseful in systems that aim at ranking search results [68].
Finally, one of approaches is purely data-driven and independentof the learning model. Examples for such data-driven strategies aredensity- and diversity-based instance selection. The diversity criterionfosters the selection of dissimilar instances for labeling to increase theinformation gain for the learner [17]. In density-based selection, thequery candidates are selected from dense areas of the feature spacebecause those instances are considered as most representative [72].Density-based selection of candidates is a promising strategy for initi-ating an AL process in the case when no labels are available at all (coldstart problem).
In this work, we employ a heterogeneous set of 16 AL strategies toobtain a representative baseline for AL (see Section 3.3).
2.2 Visual-Interactive Labeling and ClassificationLabeling is a frequently supported task in visual analytics. Depend-ing on the given task and approach, different types of labels may beemployed. A widely used label type are categorical labels which canbe either binary or multi-valued. Binary labels enable simple userfeedback, such as “yes/no” decisions or “relevant/not relevant” assess-ments. Multi-valued categorial labels enable for example the taggingof different classes of objects. Users can, e.g., label relevant textualdocuments [22], interesting time series patterns [47], or occurrences ofobjects in video streams [23]. Another important label type are continu-ous labels, often used to assign more fine grained interestingness or rele-vance scores. Example applications include relevance feedback [45,54],candidate assessment and evaluation [71], patient well-being scores [4],or distinguishing between relevant and irrelevant views [2]. Asidefrom providing labels explicitly, another type of user feedback is todirectly provide weights (of features or data attributes), e.g., to build,validate, or improve algorithmic models [38, 40, 70]. Another type oflabel are similarity relations between instances, explicitly assigned byusers which are used, e.g., to learn distance functions to support thevisual-interactive re-allocation of instances [5, 10, 35].
Labeling is an upstream task for (visual-interactive) classificationapproaches. Some approaches directly combine AL-based withVIL-based instance identification and labeling [22, 23, 55, 57]. Seifertand Granitzer [55] elaborate on user-picking strategies similarly aswe do in our experiment. In contrast, the baseline interface does notaim for a similarity-preserving representation of instances. Heimerlat al. [22] and Hoferlin et al. [23] present visual analytics systems
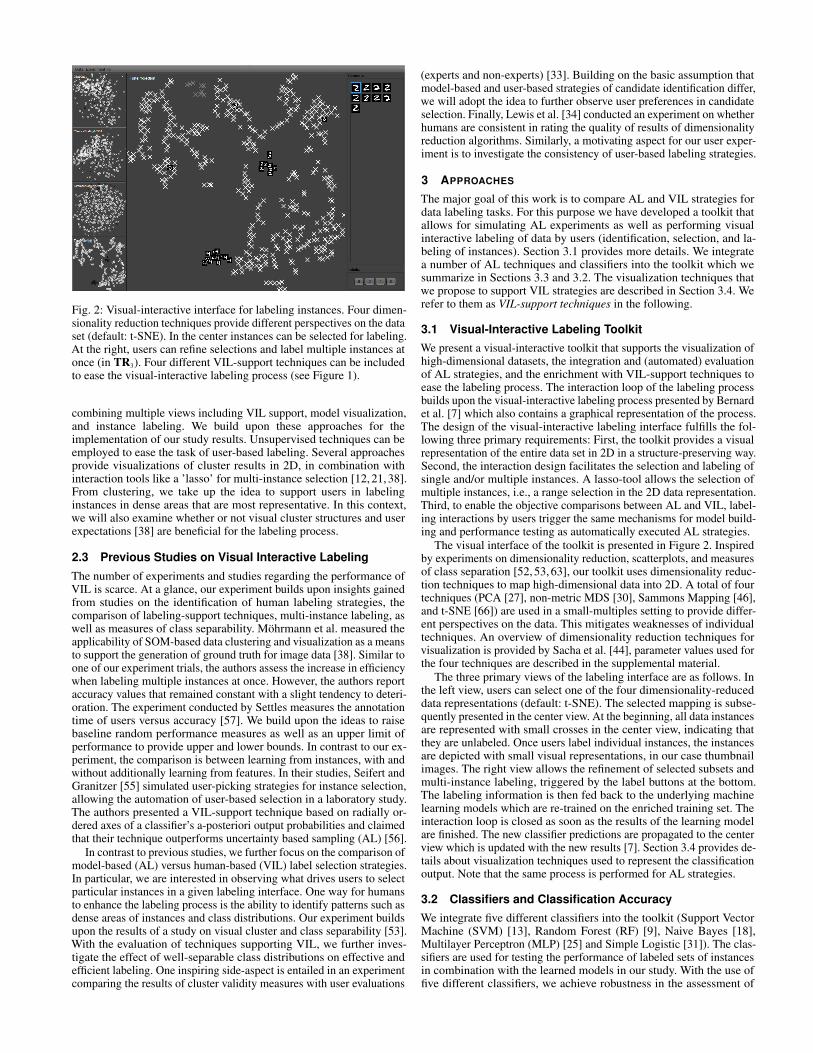
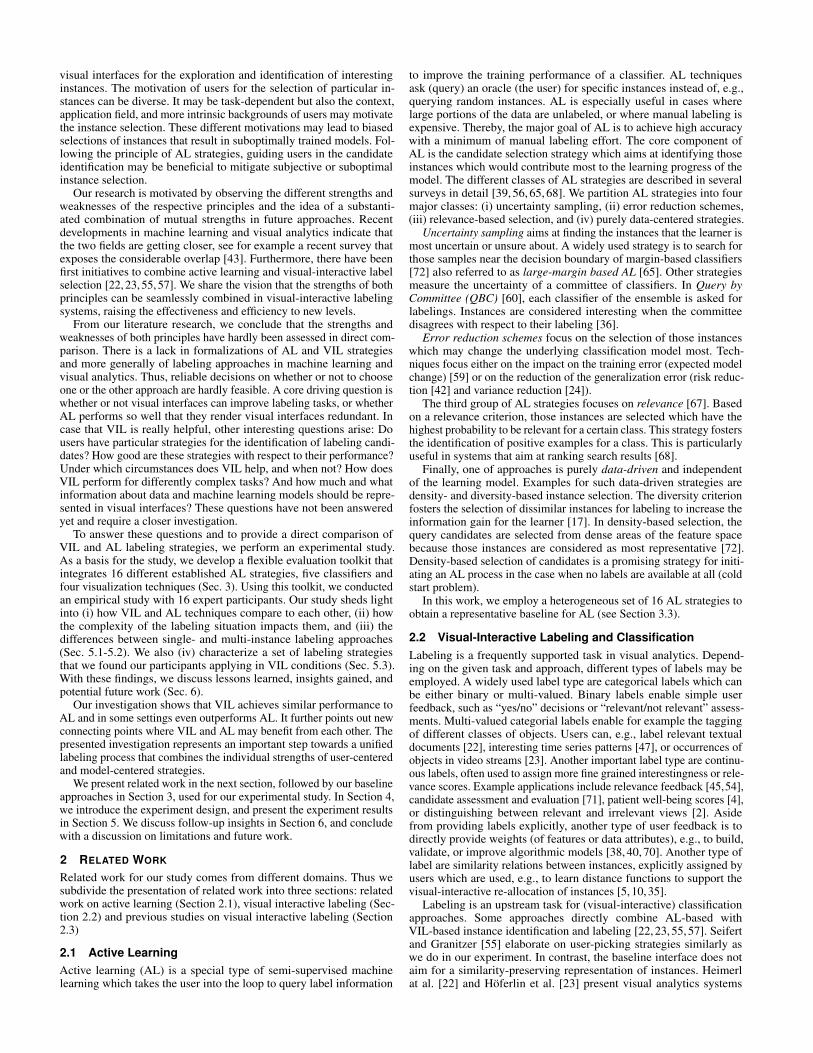
Fig. 2: Visual-interactive interface for labeling instances. Four dimen-sionality reduction techniques provide different perspectives on the dataset (default: t-SNE). In the center instances can be selected for labeling.At the right, users can refine selections and label multiple instances atonce (in TR3). Four different VIL-support techniques can be includedto ease the visual-interactive labeling process (see Figure 1).
combining multiple views including VIL support, model visualization,and instance labeling. We build upon these approaches for theimplementation of our study results. Unsupervised techniques can beemployed to ease the task of user-based labeling. Several approachesprovide visualizations of cluster results in 2D, in combination withinteraction tools like a ’lasso’ for multi-instance selection [12, 21, 38].From clustering, we take up the idea to support users in labelinginstances in dense areas that are most representative. In this context,we will also examine whether or not visual cluster structures and userexpectations [38] are beneficial for the labeling process.
2.3 Previous Studies on Visual Interactive LabelingThe number of experiments and studies regarding the performance ofVIL is scarce. At a glance, our experiment builds upon insights gainedfrom studies on the identification of human labeling strategies, thecomparison of labeling-support techniques, multi-instance labeling, aswell as measures of class separability. Mohrmann et al. measured theapplicability of SOM-based data clustering and visualization as a meansto support the generation of ground truth for image data [38]. Similar toone of our experiment trials, the authors assess the increase in efficiencywhen labeling multiple instances at once. However, the authors reportaccuracy values that remained constant with a slight tendency to deteri-oration. The experiment conducted by Settles measures the annotationtime of users versus accuracy [57]. We build upon the ideas to raisebaseline random performance measures as well as an upper limit ofperformance to provide upper and lower bounds. In contrast to our ex-periment, the comparison is between learning from instances, with andwithout additionally learning from features. In their studies, Seifert andGranitzer [55] simulated user-picking strategies for instance selection,allowing the automation of user-based selection in a laboratory study.The authors presented a VIL-support technique based on radially or-dered axes of a classifier’s a-posteriori output probabilities and claimedthat their technique outperforms uncertainty based sampling (AL) [56].
In contrast to previous studies, we further focus on the comparison ofmodel-based (AL) versus human-based (VIL) label selection strategies.In particular, we are interested in observing what drives users to selectparticular instances in a given labeling interface. One way for humansto enhance the labeling process is the ability to identify patterns such asdense areas of instances and class distributions. Our experiment buildsupon the results of a study on visual cluster and class separability [53].With the evaluation of techniques supporting VIL, we further inves-tigate the effect of well-separable class distributions on effective andefficient labeling. One inspiring side-aspect is entailed in an experimentcomparing the results of cluster validity measures with user evaluations
(experts and non-experts) [33]. Building on the basic assumption thatmodel-based and user-based strategies of candidate identification differ,we will adopt the idea to further observe user preferences in candidateselection. Finally, Lewis et al. [34] conducted an experiment on whetherhumans are consistent in rating the quality of results of dimensionalityreduction algorithms. Similarly, a motivating aspect for our user exper-iment is to investigate the consistency of user-based labeling strategies.
3 APPROACHES
The major goal of this work is to compare AL and VIL strategies fordata labeling tasks. For this purpose we have developed a toolkit thatallows for simulating AL experiments as well as performing visualinteractive labeling of data by users (identification, selection, and la-beling of instances). Section 3.1 provides more details. We integratea number of AL techniques and classifiers into the toolkit which wesummarize in Sections 3.3 and 3.2. The visualization techniques thatwe propose to support VIL strategies are described in Section 3.4. Werefer to them as VIL-support techniques in the following.
3.1 Visual-Interactive Labeling ToolkitWe present a visual-interactive toolkit that supports the visualization ofhigh-dimensional datasets, the integration and (automated) evaluationof AL strategies, and the enrichment with VIL-support techniques toease the labeling process. The interaction loop of the labeling processbuilds upon the visual-interactive labeling process presented by Bernardet al. [7] which also contains a graphical representation of the process.The design of the visual-interactive labeling interface fulfills the fol-lowing three primary requirements: First, the toolkit provides a visualrepresentation of the entire data set in 2D in a structure-preserving way.Second, the interaction design facilitates the selection and labeling ofsingle and/or multiple instances. A lasso-tool allows the selection ofmultiple instances, i.e., a range selection in the 2D data representation.Third, to enable the objective comparisons between AL and VIL, label-ing interactions by users trigger the same mechanisms for model build-ing and performance testing as automatically executed AL strategies.
The visual interface of the toolkit is presented in Figure 2. Inspiredby experiments on dimensionality reduction, scatterplots, and measuresof class separation [52, 53, 63], our toolkit uses dimensionality reduc-tion techniques to map high-dimensional data into 2D. A total of fourtechniques (PCA [27], non-metric MDS [30], Sammons Mapping [46],and t-SNE [66]) are used in a small-multiples setting to provide differ-ent perspectives on the data. This mitigates weaknesses of individualtechniques. An overview of dimensionality reduction techniques forvisualization is provided by Sacha et al. [44], parameter values used forthe four techniques are described in the supplemental material.
The three primary views of the labeling interface are as follows. Inthe left view, users can select one of the four dimensionality-reduceddata representations (default: t-SNE). The selected mapping is subse-quently presented in the center view. At the beginning, all data instancesare represented with small crosses in the center view, indicating thatthey are unlabeled. Once users label individual instances, the instancesare depicted with small visual representations, in our case thumbnailimages. The right view allows the refinement of selected subsets andmulti-instance labeling, triggered by the label buttons at the bottom.The labeling information is then fed back to the underlying machinelearning models which are re-trained on the enriched training set. Theinteraction loop is closed as soon as the results of the learning modelare finished. The new classifier predictions are propagated to the centerview which is updated with the new results [7]. Section 3.4 provides de-tails about visualization techniques used to represent the classificationoutput. Note that the same process is performed for AL strategies.
3.2 Classifiers and Classification AccuracyWe integrate five different classifiers into the toolkit (Support VectorMachine (SVM) [13], Random Forest (RF) [9], Naive Bayes [18],Multilayer Perceptron (MLP) [25] and Simple Logistic [31]). The clas-sifiers are used for testing the performance of labeled sets of instancesin combination with the learned models in our study. With the use offive different classifiers, we achieve robustness in the assessment of
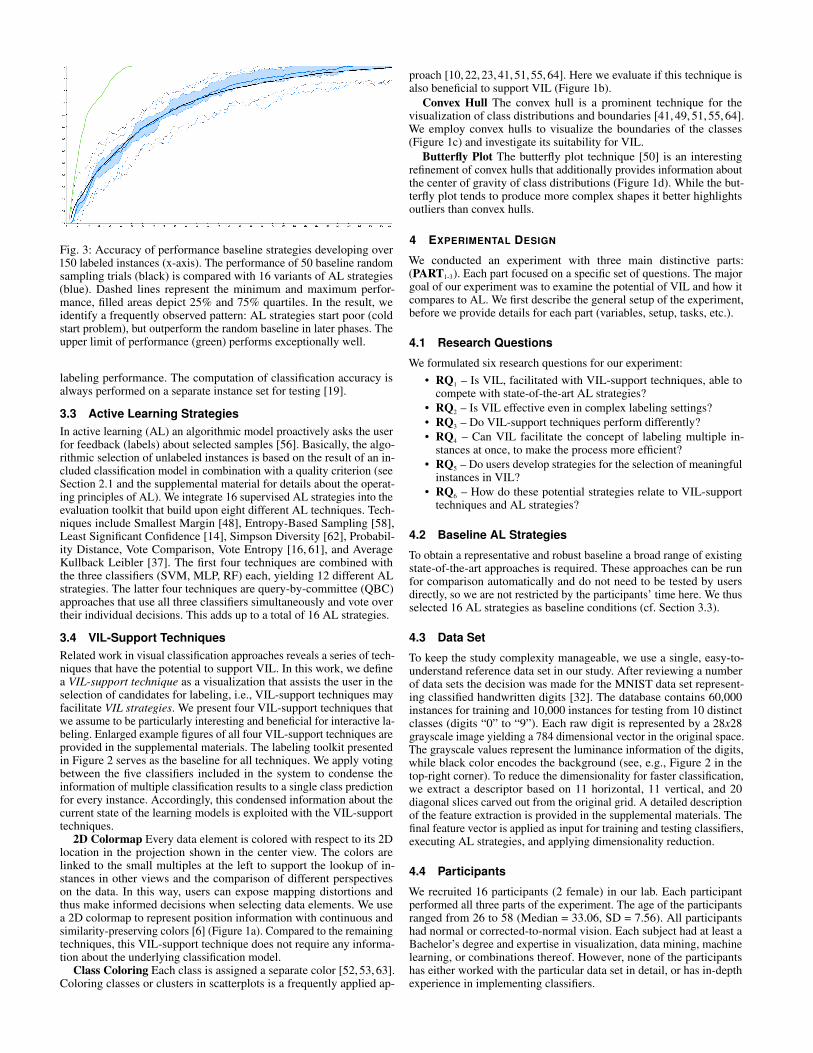
Fig. 3: Accuracy of performance baseline strategies developing over150 labeled instances (x-axis). The performance of 50 baseline randomsampling trials (black) is compared with 16 variants of AL strategies(blue). Dashed lines represent the minimum and maximum perfor-mance, filled areas depict 25% and 75% quartiles. In the result, weidentify a frequently observed pattern: AL strategies start poor (coldstart problem), but outperform the random baseline in later phases. Theupper limit of performance (green) performs exceptionally well.
labeling performance. The computation of classification accuracy isalways performed on a separate instance set for testing [19].
3.3 Active Learning StrategiesIn active learning (AL) an algorithmic model proactively asks the userfor feedback (labels) about selected samples [56]. Basically, the algo-rithmic selection of unlabeled instances is based on the result of an in-cluded classification model in combination with a quality criterion (seeSection 2.1 and the supplemental material for details about the operat-ing principles of AL). We integrate 16 supervised AL strategies into theevaluation toolkit that build upon eight different AL techniques. Tech-niques include Smallest Margin [48], Entropy-Based Sampling [58],Least Significant Confidence [14], Simpson Diversity [62], Probabil-ity Distance, Vote Comparison, Vote Entropy [16, 61], and AverageKullback Leibler [37]. The first four techniques are combined withthe three classifiers (SVM, MLP, RF) each, yielding 12 different ALstrategies. The latter four techniques are query-by-committee (QBC)approaches that use all three classifiers simultaneously and vote overtheir individual decisions. This adds up to a total of 16 AL strategies.
3.4 VIL-Support TechniquesRelated work in visual classification approaches reveals a series of tech-niques that have the potential to support VIL. In this work, we definea VIL-support technique as a visualization that assists the user in theselection of candidates for labeling, i.e., VIL-support techniques mayfacilitate VIL strategies. We present four VIL-support techniques thatwe assume to be particularly interesting and beneficial for interactive la-beling. Enlarged example figures of all four VIL-support techniques areprovided in the supplemental materials. The labeling toolkit presentedin Figure 2 serves as the baseline for all techniques. We apply votingbetween the five classifiers included in the system to condense theinformation of multiple classification results to a single class predictionfor every instance. Accordingly, this condensed information about thecurrent state of the learning models is exploited with the VIL-supporttechniques.
2D Colormap Every data element is colored with respect to its 2Dlocation in the projection shown in the center view. The colors arelinked to the small multiples at the left to support the lookup of in-stances in other views and the comparison of different perspectiveson the data. In this way, users can expose mapping distortions andthus make informed decisions when selecting data elements. We usea 2D colormap to represent position information with continuous andsimilarity-preserving colors [6] (Figure 1a). Compared to the remainingtechniques, this VIL-support technique does not require any informa-tion about the underlying classification model.
Class Coloring Each class is assigned a separate color [52, 53, 63].Coloring classes or clusters in scatterplots is a frequently applied ap-
proach [10, 22, 23, 41, 51, 55, 64]. Here we evaluate if this technique isalso beneficial to support VIL (Figure 1b).
Convex Hull The convex hull is a prominent technique for thevisualization of class distributions and boundaries [41, 49, 51, 55, 64].We employ convex hulls to visualize the boundaries of the classes(Figure 1c) and investigate its suitability for VIL.
Butterfly Plot The butterfly plot technique [50] is an interestingrefinement of convex hulls that additionally provides information aboutthe center of gravity of class distributions (Figure 1d). While the but-terfly plot tends to produce more complex shapes it better highlightsoutliers than convex hulls.
4 EXPERIMENTAL DESIGN
We conducted an experiment with three main distinctive parts:(PART1-3). Each part focused on a specific set of questions. The majorgoal of our experiment was to examine the potential of VIL and how itcompares to AL. We first describe the general setup of the experiment,before we provide details for each part (variables, setup, tasks, etc.).
4.1 Research Questions
We formulated six research questions for our experiment:• RQ1 – Is VIL, facilitated with VIL-support techniques, able to
compete with state-of-the-art AL strategies?• RQ2 – Is VIL effective even in complex labeling settings?• RQ3 – Do VIL-support techniques perform differently?• RQ4 – Can VIL facilitate the concept of labeling multiple in-
stances at once, to make the process more efficient?• RQ5 – Do users develop strategies for the selection of meaningful
instances in VIL?• RQ6 – How do these potential strategies relate to VIL-support
techniques and AL strategies?
4.2 Baseline AL Strategies
To obtain a representative and robust baseline a broad range of existingstate-of-the-art approaches is required. These approaches can be runfor comparison automatically and do not need to be tested by usersdirectly, so we are not restricted by the participants’ time here. We thusselected 16 AL strategies as baseline conditions (cf. Section 3.3).
4.3 Data Set
To keep the study complexity manageable, we use a single, easy-to-understand reference data set in our study. After reviewing a numberof data sets the decision was made for the MNIST data set represent-ing classified handwritten digits [32]. The database contains 60,000instances for training and 10,000 instances for testing from 10 distinctclasses (digits “0” to “9”). Each raw digit is represented by a 28x28grayscale image yielding a 784 dimensional vector in the original space.The grayscale values represent the luminance information of the digits,while black color encodes the background (see, e.g., Figure 2 in thetop-right corner). To reduce the dimensionality for faster classification,we extract a descriptor based on 11 horizontal, 11 vertical, and 20diagonal slices carved out from the original grid. A detailed descriptionof the feature extraction is provided in the supplemental materials. Thefinal feature vector is applied as input for training and testing classifiers,executing AL strategies, and applying dimensionality reduction.
4.4 Participants
We recruited 16 participants (2 female) in our lab. Each participantperformed all three parts of the experiment. The age of the participantsranged from 26 to 58 (Median = 33.06, SD = 7.56). All participantshad normal or corrected-to-normal vision. Each subject had at least aBachelor’s degree and expertise in visualization, data mining, machinelearning, or combinations thereof. However, none of the participantshas either worked with the particular data set in detail, or has in-depthexperience in implementing classifiers.
4.5 ProcedureWe prepared a workstation in a quiet lab with a color-calibrated monitor.The evaluation toolkit (cf. Section 3.1) was installed and prepared forthe experiment. Figure 2 gives an impression of the toolkit. By de-sign, all unlabeled (unknown) instances are represented with x, labeledinstances are depicted with the image of the handwritten digit.
At the beginning, the participants were introduced to the topic andthe goals of our experiment, accompanied by the possibility to askquestions. Our toolkit was introduced in a short demo session, includingits interaction techniques and VIL-support techniques. In addition,the concept of (baseline) AL strategies was described, as well as thefunctionality of the classifiers to be trained in the course of each session.
The main part of our study consisted of three core parts then:• PART1 – Users were asked to label the data under the 4 different
VIL conditions described in 3.4. Our goal was to learn abouthow VIL techniques compare among each other, as well as to thebaseline AL strategies, and how they do so in differently complexsituations.
• PART2 – The users had to engage in a single and a multiple-instance selection tasks, so we can compare single vs. multipleinstance labeling strategies for AL and VIL.
• PART3 – We gathered qualitative and subjective feedback fromthe participants.
During PART1 and PART2, the participants were asked to thinkaloud in the course of the labeling process, e.g., when they identifyspecial cases, difficulties, or interesting findings. We also observedthem and took notes on interesting behaviors and user strategies. Bothparts used a separate within-subject design, which will be described inmore detail below.
The overall time to perform the three parts was estimated with 75minutes, depending on the extent of the interview. Participants wereallowed to take breaks between the three parts. We now describe theexperimental design of each part in more detail.
4.6 PART1: Performance Comparison VIL and ALThe first part of the experiment considered the question whether ornot the four VIL-support techniques can compete with state-of-the-artAL strategies, how they compare among each other, and how theyperform in three different levels of complexity (RQ1-3). To answer thesequestions, PART1 was organized as a 4 × 3 within subject design.
4.6.1 Independent VariablesWe had two independent variables in PART1.VIL. Our main variable of interest were the 4 different VIL-supporttechniques as outlined in Section 3.4: 2D Colormap, Class Coloring,Convex Hulls, and Butterfly Plot (cf. Figure 1).Complexity. The second variable was task complexity. Complexity ofthe labeling task at hand is a very important factor that can stronglyinfluence AL and VIL performance. Task complexity in itself, however,is a multifaceted concept. It is influenced by model aspects such as thenumber of different classes, how many data points it is operating on, thechosen model type, etc. It also depends on the input data and the natureof the labeling tasks, for instance, labeling digits might be easier thanlabeling objects in video streams. No single study can investigate all ofthese factors at once. Based on our pilot study (see suppl. materials),we thus opted for a well-defined labeling task (labeling digits), andfocus on three different levels of model complexity:
1. Easy: 2 classes (0,1), 100 instances each class2. Medium: 5 classes (0,1,2,3,4), 100 instances each class3. Difficult: 10 classes (0,1,...,9), 100 instances each class
4.6.2 Task DescriptionWe asked the participants to select data instances for labeling in ameaningful way based on their preference. Depending on the providedVIL-support technique additional information about data and/or classifi-cation result was shown that possibly supported the process of selectinginstances for labeling. As a general rule, we asked the participants toexploit relevant information about patterns explored in the labeling
interface, and use it for the selection (labeling) of instances. For everycondition, users were informed about the set of labels existing in thedata set (task complexity).
The focus of PART1 was on the selection of instances rather thanthe actual process of assigning a label to the selected instance. We thussetup our toolkit in a way that participants did not actually need to labelthe digits of selected instances to save time. They could simply selectan instance by clicking on it. The label was then set automatically andthe image was revealed to the user. The registration of the true label offor the selected instance was automatically triggered to the evaluationbench (see the interaction loop in Section 3.1).
4.6.3 SetupThe independent variables of PART1 lead to 4×3 = 12 different con-ditions. We decided for a within-subject design, so all 16 participantswere asked to perform all 12 conditions. We decided not to randomizethe order of VIL techniques as the conditions are building up on topof each other (the number of visual variables depicting model infor-mation was zero for 2D Colormap, one for Class Coloring, and twofor Convex Hulls and Butterfly Plot). The three different complexitiesof the labeling task were always performed in the natural order fromeasy to difficult. The data instances used for training and testing wererandomly chosen with a constant seed to achieve both comparabilityand reproducibility. All other choices were based on the pilot study thatwe describe in Appendix A in the supplemental materials.
4.6.4 Dependent VariablesAccuracy. To assess the performance of the 12 tested conditions out-lined above, a measure is needed that is expressive and easy to under-stand. To enable comparability, the measure should be applicable forthe 12 conditions and the baseline AL strategies. Based on these require-ments, we select classification accuracy as the sole dependent measureto compare how ‘good’ the different conditions are. We use the standarddefinition of classification accuracy, that is, the portion of correctly clas-sified instances compared to ground truth labels [19]. To achieve robust(classifier-independent) accuracy estimates, we compute the accuracyafter every label operation for all five classifiers listed in Section 3.2and average the results. This leads to robust performance estimates.
4.7 PART2: Labeling Single vs. Multiple InstancesIn the second part of the experiment, we turn towards the assessmentof efficiency of the labeling process. To this end, we allow labelingmultiple instances with the same label in a single labeling iteration. Weinvestigate whether or not VIL can facilitate the concept of labelingmultiple instances at once to make the process more efficient (RQ4).
4.7.1 Independent VariablesSingle vs. Multi Labeling. We were interested in the question of howmany labels should be set at once in the labeling interface. There areessentially two options. Setting one label to a single instance, one afteranother, or assigning a label to multiple instances at once.VIL vs. AL Strategies. Assigning labels to multiple instances at oncecan be facilitated with AL and for VIL as well. As a result, and incontrast to PART1, AL now shifts from an automated baseline approachto an independent variable as the participants need to get active in theseconditions as well.
4.7.2 Task DescriptionIn contrast to PART1, the users’ task in PART2 was to explicitly assignlabels to instances. That is, users selected and labeled instances (in VILconditions), or they labeled suggested instances (in the AL condition).
4.7.3 SetupAltogether, the two independent variables form four conditions. Werefer, to these four different conditions as:
• AL single labeling: AL suggests one item, labeled by the user• AL multi labeling: AL suggests multiple items to be labeled by
the user; the user can select a subset of the suggestions and labelthem with one class label, for example, all ”1s”.
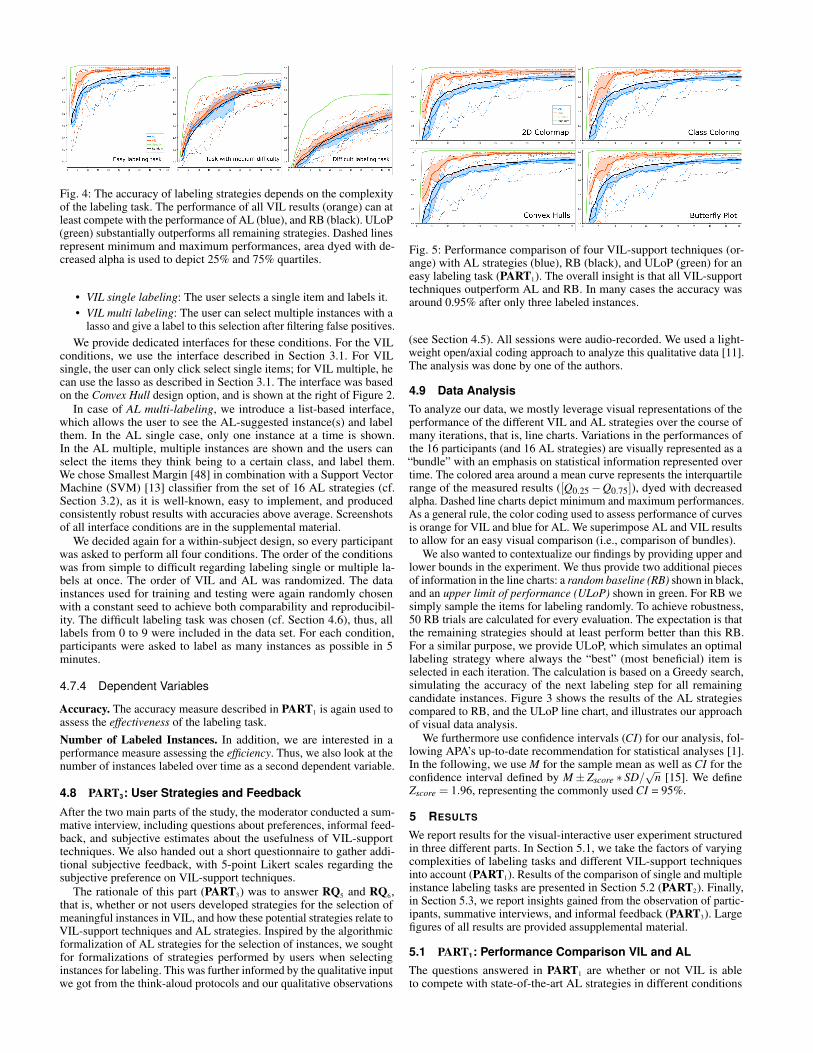
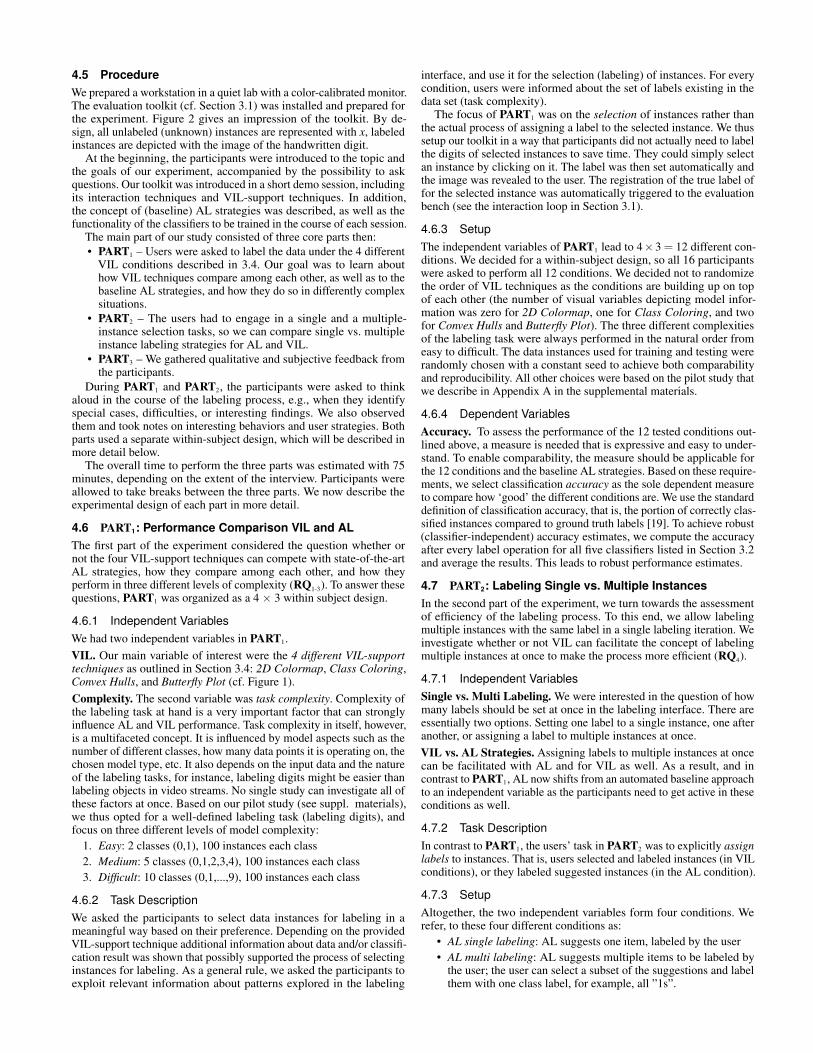
Fig. 4: The accuracy of labeling strategies depends on the complexityof the labeling task. The performance of all VIL results (orange) can atleast compete with the performance of AL (blue), and RB (black). ULoP(green) substantially outperforms all remaining strategies. Dashed linesrepresent minimum and maximum performances, area dyed with de-creased alpha is used to depict 25% and 75% quartiles.
• VIL single labeling: The user selects a single item and labels it.• VIL multi labeling: The user can select multiple instances with a
lasso and give a label to this selection after filtering false positives.We provide dedicated interfaces for these conditions. For the VIL
conditions, we use the interface described in Section 3.1. For VILsingle, the user can only click select single items; for VIL multiple, hecan use the lasso as described in Section 3.1. The interface was basedon the Convex Hull design option, and is shown at the right of Figure 2.
In case of AL multi-labeling, we introduce a list-based interface,which allows the user to see the AL-suggested instance(s) and labelthem. In the AL single case, only one instance at a time is shown.In the AL multiple, multiple instances are shown and the users canselect the items they think being to a certain class, and label them.We chose Smallest Margin [48] in combination with a Support VectorMachine (SVM) [13] classifier from the set of 16 AL strategies (cf.Section 3.2), as it is well-known, easy to implement, and producedconsistently robust results with accuracies above average. Screenshotsof all interface conditions are in the supplemental material.
We decided again for a within-subject design, so every participantwas asked to perform all four conditions. The order of the conditionswas from simple to difficult regarding labeling single or multiple la-bels at once. The order of VIL and AL was randomized. The datainstances used for training and testing were again randomly chosenwith a constant seed to achieve both comparability and reproducibil-ity. The difficult labeling task was chosen (cf. Section 4.6), thus, alllabels from 0 to 9 were included in the data set. For each condition,participants were asked to label as many instances as possible in 5minutes.
4.7.4 Dependent Variables
Accuracy. The accuracy measure described in PART1 is again used toassess the effectiveness of the labeling task.Number of Labeled Instances. In addition, we are interested in aperformance measure assessing the efficiency. Thus, we also look at thenumber of instances labeled over time as a second dependent variable.
4.8 PART3: User Strategies and Feedback
After the two main parts of the study, the moderator conducted a sum-mative interview, including questions about preferences, informal feed-back, and subjective estimates about the usefulness of VIL-supporttechniques. We also handed out a short questionnaire to gather addi-tional subjective feedback, with 5-point Likert scales regarding thesubjective preference on VIL-support techniques.
The rationale of this part (PART3) was to answer RQ5 and RQ6,that is, whether or not users developed strategies for the selection ofmeaningful instances in VIL, and how these potential strategies relate toVIL-support techniques and AL strategies. Inspired by the algorithmicformalization of AL strategies for the selection of instances, we soughtfor formalizations of strategies performed by users when selectinginstances for labeling. This was further informed by the qualitative inputwe got from the think-aloud protocols and our qualitative observations
Fig. 5: Performance comparison of four VIL-support techniques (or-ange) with AL strategies (blue), RB (black), and ULoP (green) for aneasy labeling task (PART1). The overall insight is that all VIL-supporttechniques outperform AL and RB. In many cases the accuracy wasaround 0.95% after only three labeled instances.
(see Section 4.5). All sessions were audio-recorded. We used a light-weight open/axial coding approach to analyze this qualitative data [11].The analysis was done by one of the authors.
4.9 Data AnalysisTo analyze our data, we mostly leverage visual representations of theperformance of the different VIL and AL strategies over the course ofmany iterations, that is, line charts. Variations in the performances ofthe 16 participants (and 16 AL strategies) are visually represented as a“bundle” with an emphasis on statistical information represented overtime. The colored area around a mean curve represents the interquartilerange of the measured results ([Q0.25−Q0.75]), dyed with decreasedalpha. Dashed line charts depict minimum and maximum performances.As a general rule, the color coding used to assess performance of curvesis orange for VIL and blue for AL. We superimpose AL and VIL resultsto allow for an easy visual comparison (i.e., comparison of bundles).
We also wanted to contextualize our findings by providing upper andlower bounds in the experiment. We thus provide two additional piecesof information in the line charts: a random baseline (RB) shown in black,and an upper limit of performance (ULoP) shown in green. For RB wesimply sample the items for labeling randomly. To achieve robustness,50 RB trials are calculated for every evaluation. The expectation is thatthe remaining strategies should at least perform better than this RB.For a similar purpose, we provide ULoP, which simulates an optimallabeling strategy where always the “best” (most beneficial) item isselected in each iteration. The calculation is based on a Greedy search,simulating the accuracy of the next labeling step for all remainingcandidate instances. Figure 3 shows the results of the AL strategiescompared to RB, and the ULoP line chart, and illustrates our approachof visual data analysis.
We furthermore use confidence intervals (CI) for our analysis, fol-lowing APA’s up-to-date recommendation for statistical analyses [1].In the following, we use M for the sample mean as well as CI for theconfidence interval defined by M± Zscore ∗ SD/
√n [15]. We define
Zscore = 1.96, representing the commonly used CI = 95%.
5 RESULTS
We report results for the visual-interactive user experiment structuredin three different parts. In Section 5.1, we take the factors of varyingcomplexities of labeling tasks and different VIL-support techniquesinto account (PART1). Results of the comparison of single and multipleinstance labeling tasks are presented in Section 5.2 (PART2). Finally,in Section 5.3, we report insights gained from the observation of partic-ipants, summative interviews, and informal feedback (PART3). Largefigures of all results are provided assupplemental material.
5.1 PART1: Performance Comparison VIL and ALThe questions answered in PART1 are whether or not VIL is ableto compete with state-of-the-art AL strategies in different conditions

Fig. 6: Performance comparison of four VIL-support techniques (or-ange) with AL strategies (blue), RB (black), and ULoP (green) for alabeling task with medium difficulty (PART1). All VIL-support tech-niques have accuracies at least as high as AL and RB in earlier phasesof the process. Convex hulls can compete with the AL performance forthe entire observed process. ULoP (green) substantially outperformsall remaining techniques.
(RQ1,2,3). To that aim, we investigate the performance of four VIL-support techniques in combination with three different task complexi-ties (details about PART1 in Section 4.6).
5.1.1 Performance for Different Task Complexities
First, we assess the dependency of the labeling performance on thecomplexity of the labeling settings. Three different task complexitieseasy, medium, and difficult are evaluated and compared.
Results Figure 4 shows the overall results of the performancecomparison for easy (left), medium, and difficult (right) labeling tasks.In general, the performance of virtually any strategy increases in thecourse of the labeling process. Please note that the performances ofthe four VIL techniques are aggregated for every complexity level.The results show that from easy to difficult the accuracy decreasessubstantially for all strategies, i.e., we infer that the complexity levelhas an influence on the labeling performance. A more detailed analysisreveals that the performance of VIL is at least as good as AL for allthree task complexities (RQ1,2). For easy tasks VIL outperforms ALconsiderably. In early phases, the accuracy curve is very steep andconverges at higher levels. Using iteration 20 as an example, M =0.96 (CI = [0.95 – 0.98]) for VIL whereas the performance of ALonly reaches M = 0.85 (CI = [0.82 – 0.88]). One explanation may bethat VIL enables faster capturing instances of all classes. This can beseen as an indicator that human intuition (in combination with datavisualization) may be useful to solve the cold start problem of ALapproaches (AL even performs weaker than RB at start). The results ofthe performance comparison for medium and difficult task complexitiesare similar. VIL performs slightly better than AL, RB can compete withAL. In the difficult case after 20 iterations, VIL performs with M = 0.42(CI = [0.38 – 0.45]) in contrast to AL (M = 0.35, CI = [0.33 – 0.38]).However, we ascertain that VIL shows higher variations (Figure 4center, right). We draw the conclusion that, with VIL, human controlover the labeling process is beneficial, but may also lead to weakerperformances for individuals. In general, we ascertain that VIL cancompete with the remaining strategies (RQ1), even for complex labelingsettings (RQ2). The comparison of all strategies with the results of theULoP indicates remaining potential. Even for the difficult condition,ULoP still achieved outstanding performance (M = 0.70 at iteration 20).
5.1.2 Comparison of VIL-Support Techniques
The second factor in PART1 was the comparison of the 4 VIL-supporttechniques. The core question is whether VIL-support techniques per-form differently (RQ3). According to the 4×3 experiment conditions,we compare VIL-support techniques for the easy, medium, and difficultcomplexity level, Section 4.6 provides additional details.
Fig. 7: Performance comparison of four VIL-support techniques (or-ange) with AL strategies (blue), RB (black), and ULoP (green) for adifficult labeling task (PART2). For difficult labeling tasks, the per-formance of AL and VIL is more similar, with VIL having slightadvantages over AL. RB performs surprisingly well. All VIL-supporttechniques have a good starting performance. Convex Hulls and Butter-fly Plots perform well over the entire labeling process.
Results In Figure 5, results of the four VIL-support techniques canbe compared for the easy task. Thus, we now explicitly distinguish theperformances of different VIL-support techniques. One finding that canbe identified without effort is the substantially better performance of allfour candidates compared to AL. Compared to results of more difficulttasks VIL strategies are closer to the ULoP. We assume that, given aneasy task, a clear separation of classes in 2D eases the identification ofinstances, leading to high accuracies very quickly. We conclude thatdifferences between the four VIL-support techniques are negligible.
Figure 6 shows the performances of the VIL-support techniquesfor the medium task complexity. Again, it becomes apparent that VIL-techniques are able to compete with AL strategies (RQ1), particularlyat the start of the process. In early phases of the labeling process (e.g.,iteration 10), we assess the best performance for the Class Colorstechnique (M = 0.73, CI = [0.71 – 0.75] in contrast to the 2D Colormap(M = 0.68, CI = [0.64 – 0.73]), Convex Hull (M = 0.70, CI = [0.65 –0.74]), and the Butterfly Plot (M = 0.70, CI = [0.66 – 0.73]). Anotherinsight for late iterations is the good performance of the three techniquesdisplaying classifier information (Class Colors M = 0.83, Convex HullM = 0.85 and Butterfly Plot M = 0.84), the Convex Hull approachperforms best and keeps track with AL (M = 0.85) (RQ1,3). In turn, the2D Colormap approach cannot compete with the remaining techniques(M = 0.82). Finally, the ULoP outperforms all remaining strategiessubstantially which shows that there is still room for improvements.
The situation is similar for the difficult labeling task (see Figure 7).All VIL-support techniques perform comparatively well at the begin-ning. Here, the 2D Colormap (no model information provided) slightlyoutperforms the remaining techniques (RQ3). In the course of theprocess, the two shape-based techniques (Convex Hull M=0.61 andButterfly Plot M=0.60) achieve the highest accuracies. Overall, the VILstrategies perform at least as good as AL and RB, AL again seemsto perform weaker than RB at first. One explanation is that AL hasproblems to capture representatives of all classes (cold start problem)which is may be more severe for a complex tasks. To further investigatethe cold start problem, we refer the reader to Figure 3 which comparesthe accuracy of AL and RB for substantially more iterations. Here,we identify a break-even point at approximately 50 instances whereAL starts to outperform RB. The observation strengthens the rationaleto combine the strengths of AL and VIL, using the latter for entirelyunlabeled data. One final insight gathered from Figure 7 is the againoutstanding performance of ULoP.
In summary, we identified that VIL can compete with AL (RQ1)especially in early phases of the process. In addition, we ascertain aslight tendency of VIL-support techniques with classifier visualizationto outperform the 2D Colormap technique (RQ3).

Fig. 8: Comparison of AL with VIL in combination with labeling singleand multiple instances at once (PART2). The duration of the labelingprocess is mapped to the x-axis ([ms] - 300k = 5 min). Left: AL achieveshigher accuracies (y-axis) than VIL for both single and multi-instancelabeling. Right: the number of labeled instances is mapped to the y-axis. Assigning a label for multiple instances at once works particularlyfast for VIL. In 5 minutes users were able to label approximately 450instances on average.
5.2 PART2: Labeling Single vs. Multiple InstancesPART2 considered the question of whether the process can be mademore efficient when multiple instances are labeled at once. In particular,we were interested whether or not VIL can make the process moreefficient (RQ4). The four candidate interfaces for PART2 are AL singlelabeling, AL multi labeling, VIL single labeling, and VIL multi label-ing, Section 4.7 provides additional information about the experimentdesign.
Analysis of Effectiveness We analyze the progression of accu-racy of the four candidates measured over time (see Figure 8, left). Theduration (300,000 ms) of the labeling process is mapped to the x-axis.The analysis of the accuracy (mapped to the y-axis) provides three in-sights. First, in the beginning of the process the four candidates performfairly balanced. Second, both AL strategies (blue colors) achieve higheraccuracies in less time in the remaining phase of the process. Third, la-beling multiple instances at once improves the efficiency. This accountsfor AL as well as for VIL. Overall, with respect to the accuracy overtime, VIL cannot compete with AL. One explanation of the lower accu-racy values is associated with an observation we made several times inthe study. Selecting and filtering a large number of identical instancesrequires a considerable portion of time. Thus, many participants did notlabel all of the classes (leading to weaker accuracies), as this was notsubject of the task introduction.
Analysis of Efficiency We analyze the number of labeled in-stances over time for all four candidates (see Figure 8, right). Wemake two observations. First, the efficiency of VIL multi labeling isconsiderably better than the three remaining candidates. Thus, labelingmultiple instances at once with a VIL-based interface can substantiallyincrease the efficiency of the labeling process (RQ4). We observed thatusers partially labeled 50 or more instances at once leading to a mas-sive increase of efficiency compared to the other interfaces. Even theminimum performance of all users is considerably better than the maxi-mum performance of any user using the remaining interfaces. Second,both AL-based candidates outperform VIL single labeling. This can beexplained with the overhead of VIL approaches requiring additionalexploration, identification, and selection of single candidate instances.
5.3 PART3 User Strategies and User FeedbackIn PART3, we focus on the question whether or not users developstrategies for the selection of instances in VIL (RQ5) and if so, howthese strategies relate to VIL-support techniques and AL strategies(RQ6). The experimental setup of PART3 follows the description inSection 4.8.
5.3.1 User Strategies for Labeling DataThe observation of participants during PART1-2 revealed a series of userstrategies for selecting labeling candidates (RQ5). We classified these
strategies into data-centered and model-centered strategies in a jointdiscourse of the authors. Data-centered strategies focus on characteris-tics of data instances (elementary or synoptic level). Model-centeredstrategies are based on visual feedback of the current state of the classi-fication model.
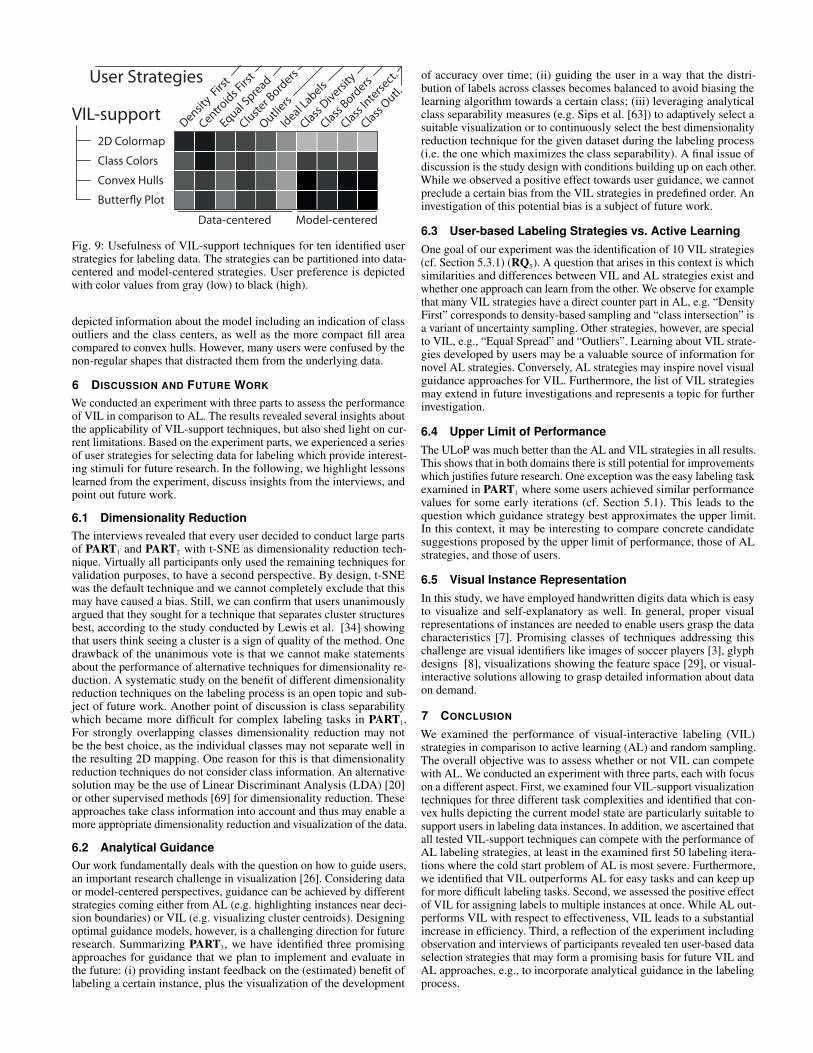
Data-Centered Strategies Dense Areas First: Collections ofinstances that form dense clusters are preferred during the labelingprocess. This supports the classification performance by learning theinformation for many instances at once. Centroid First: Special typeof Dense Areas First. Instances that are at the center of clusters arelabeled first, in order to assign labels to instances that are representativefor a cluster. Equal Spread: The user tries to assign labels to instancesthat are well distributed (in 2D), to make sure that there are no areasin the original (high-dimensional) space that do not contain labeledinstances. Cluster Borders: Instances that are at the border betweentwo clusters are labeled, in order to give the classifier informationthat helps to better separate the clusters. Outliers: Outliers of thedata set are labeled explicitly, in order to allow the classifier to learnabout the range of instances that belong to one class. Ideal Label: Theuser only assigns labels to the instances that are ideal candidates orrepresentatives of the respective class. The motivation for some usersapplying this strategy was based on data-semantical reasons.
Model-Centered Strategies Class Distribution Minimization:The spread of a class in the 2D representation (e.g., represented witha convex hull) is to be minimized. Class Borders: The user tries toachieve clearly separated borders between classes based on the visualfeedback on spatial class distribution (e.g. based on the size of the con-vex hull). Class Intersection: The labeling process aims at minimizingpossible ambiguities in the intersection between classes (e.g. depictedwith overlaps of convex hulls). Class Outliers: Users label those in-stances that are assigned to a class but are far away from the class centerof gravity. Referring to the convex hull, this can be identified with aspike.
5.3.2 Subjective User FeedbackFinally, we report on the subjective feedback we received in the con-cluding interviews and questionnaire. Table 1 provides an overview ofaverage scores (5-point Likert scale, with 5 being ‘very good’). Thesubjectively preferred techniques are Convex Hulls and Class Colors(RQ6). Overall, information about the state of the classification model(Class Color, Convex Hulls, Butterfly Plot) was welcomed by mostparticipants. We identified a shift in the labeling strategies towardsmodel-centered characteristics, such as class distributions and classoutliers, provoked by the additional visual encodings. One potentialdrawback of the shift towards model-centered information is neglectingdata-centered properties as revealed by dimensionality reduction incombination with scatterplots.
In the interviews, we also received rich user feedback on the us-ability of the different VIL-support techniques (RQ6). 2D Colormap:Users remarked the disadvantage of missing model information. Inturn, the simplicity of the interface was welcomed for the complexlabeling task. Class Color: Users welcomed the direct feedback aboutthe current state of the model by means of colors. For complex labelingtasks with many colors, users had problems in the distinction of some(categorical) colors. Convex Hulls: Many users liked the combinationof color and shape-based information about the current state of themodel. The distribution of classes in the 2D representation was easilycomprehensible. However, overlays of many semi-transparent layerscaused some problems in distinguishing classes. Butterfly Plots: TheButterfly plot obtained the most user feedback. Positive aspects are the
2D Col-ormap
Class Col-ors
ConvexHulls
ButterflyPlot
Score 1.7 4.3 4.4 3,7
Table 1: User preferences on VIL-support techniques in PART1 andPART2. Convex Hulls achieved the highest scores, followed by ClassColors.
2D Colormap
Class Colors
Convex Hulls
Butter�y Plot
Density F
irst
Centroids F
irst
Equal Spread
Cluster B
orders
Outliers
Ideal Labels
Class Diversi
ty
Class Bord
ers
Class Interse
ct.
Class Outl.
Data-centered Model-centered
VIL-support
User Strategies
Fig. 9: Usefulness of VIL-support techniques for ten identified userstrategies for labeling data. The strategies can be partitioned into data-centered and model-centered strategies. User preference is depictedwith color values from gray (low) to black (high).
depicted information about the model including an indication of classoutliers and the class centers, as well as the more compact fill areacompared to convex hulls. However, many users were confused by thenon-regular shapes that distracted them from the underlying data.
6 DISCUSSION AND FUTURE WORK
We conducted an experiment with three parts to assess the performanceof VIL in comparison to AL. The results revealed several insights aboutthe applicability of VIL-support techniques, but also shed light on cur-rent limitations. Based on the experiment parts, we experienced a seriesof user strategies for selecting data for labeling which provide interest-ing stimuli for future research. In the following, we highlight lessonslearned from the experiment, discuss insights from the interviews, andpoint out future work.
6.1 Dimensionality ReductionThe interviews revealed that every user decided to conduct large partsof PART1 and PART2 with t-SNE as dimensionality reduction tech-nique. Virtually all participants only used the remaining techniques forvalidation purposes, to have a second perspective. By design, t-SNEwas the default technique and we cannot completely exclude that thismay have caused a bias. Still, we can confirm that users unanimouslyargued that they sought for a technique that separates cluster structuresbest, according to the study conducted by Lewis et al. [34] showingthat users think seeing a cluster is a sign of quality of the method. Onedrawback of the unanimous vote is that we cannot make statementsabout the performance of alternative techniques for dimensionality re-duction. A systematic study on the benefit of different dimensionalityreduction techniques on the labeling process is an open topic and sub-ject of future work. Another point of discussion is class separabilitywhich became more difficult for complex labeling tasks in PART1.For strongly overlapping classes dimensionality reduction may notbe the best choice, as the individual classes may not separate well inthe resulting 2D mapping. One reason for this is that dimensionalityreduction techniques do not consider class information. An alternativesolution may be the use of Linear Discriminant Analysis (LDA) [20]or other supervised methods [69] for dimensionality reduction. Theseapproaches take class information into account and thus may enable amore appropriate dimensionality reduction and visualization of the data.
6.2 Analytical GuidanceOur work fundamentally deals with the question on how to guide users,an important research challenge in visualization [26]. Considering dataor model-centered perspectives, guidance can be achieved by differentstrategies coming either from AL (e.g. highlighting instances near deci-sion boundaries) or VIL (e.g. visualizing cluster centroids). Designingoptimal guidance models, however, is a challenging direction for futureresearch. Summarizing PART3, we have identified three promisingapproaches for guidance that we plan to implement and evaluate inthe future: (i) providing instant feedback on the (estimated) benefit oflabeling a certain instance, plus the visualization of the development
of accuracy over time; (ii) guiding the user in a way that the distri-bution of labels across classes becomes balanced to avoid biasing thelearning algorithm towards a certain class; (iii) leveraging analyticalclass separability measures (e.g. Sips et al. [63]) to adaptively select asuitable visualization or to continuously select the best dimensionalityreduction technique for the given dataset during the labeling process(i.e. the one which maximizes the class separability). A final issue ofdiscussion is the study design with conditions building up on each other.While we observed a positive effect towards user guidance, we cannotpreclude a certain bias from the VIL strategies in predefined order. Aninvestigation of this potential bias is a subject of future work.
6.3 User-based Labeling Strategies vs. Active LearningOne goal of our experiment was the identification of 10 VIL strategies(cf. Section 5.3.1) (RQ5). A question that arises in this context is whichsimilarities and differences between VIL and AL strategies exist andwhether one approach can learn from the other. We observe for examplethat many VIL strategies have a direct counter part in AL, e.g. “DensityFirst” corresponds to density-based sampling and “class intersection” isa variant of uncertainty sampling. Other strategies, however, are specialto VIL, e.g., “Equal Spread” and “Outliers”. Learning about VIL strate-gies developed by users may be a valuable source of information fornovel AL strategies. Conversely, AL strategies may inspire novel visualguidance approaches for VIL. Furthermore, the list of VIL strategiesmay extend in future investigations and represents a topic for furtherinvestigation.
6.4 Upper Limit of PerformanceThe ULoP was much better than the AL and VIL strategies in all results.This shows that in both domains there is still potential for improvementswhich justifies future research. One exception was the easy labeling taskexamined in PART1 where some users achieved similar performancevalues for some early iterations (cf. Section 5.1). This leads to thequestion which guidance strategy best approximates the upper limit.In this context, it may be interesting to compare concrete candidatesuggestions proposed by the upper limit of performance, those of ALstrategies, and those of users.
6.5 Visual Instance RepresentationIn this study, we have employed handwritten digits data which is easyto visualize and self-explanatory as well. In general, proper visualrepresentations of instances are needed to enable users grasp the datacharacteristics [7]. Promising classes of techniques addressing thischallenge are visual identifiers like images of soccer players [3], glyphdesigns [8], visualizations showing the feature space [29], or visual-interactive solutions allowing to grasp detailed information about dataon demand.
7 CONCLUSION
We examined the performance of visual-interactive labeling (VIL)strategies in comparison to active learning (AL) and random sampling.The overall objective was to assess whether or not VIL can competewith AL. We conducted an experiment with three parts, each with focuson a different aspect. First, we examined four VIL-support visualizationtechniques for three different task complexities and identified that con-vex hulls depicting the current model state are particularly suitable tosupport users in labeling data instances. In addition, we ascertained thatall tested VIL-support techniques can compete with the performance ofAL labeling strategies, at least in the examined first 50 labeling itera-tions where the cold start problem of AL is most severe. Furthermore,we identified that VIL outperforms AL for easy tasks and can keep upfor more difficult labeling tasks. Second, we assessed the positive effectof VIL for assigning labels to multiple instances at once. While AL out-performs VIL with respect to effectiveness, VIL leads to a substantialincrease in efficiency. Third, a reflection of the experiment includingobservation and interviews of participants revealed ten user-based dataselection strategies that may form a promising basis for future VIL andAL approaches, e.g., to incorporate analytical guidance in the labelingprocess.
REFERENCES
[1] American Psychological Association. Publication manual of the Amer-ican psychological association (6th edition). American PsychologicalAssociation Washington, 2010.
[2] M. Behrisch, F. Korkmaz, L. Shao, and T. Schreck. Feedback-driveninteractive exploration of large multidimensional data supported by visualclassifier. In IEEE Visual Analytics Science and Technology (VAST), pp.43–52, 2014.
[3] J. Bernard, C. Ritter, D. Sessler, M. Zeppelzauer, J. Kohlhammer, andD. Fellner. Visual-interactive similarity search for complex objects byexample of soccer player analysis. In Proc. of IVAPP, VISIGRAPP, pp.75–87, 2017. doi: 10.5220/0006116400750087
[4] J. Bernard, D. Sessler, A. Bannach, T. May, and J. Kohlhammer. A visualactive learning system for the assessment of patient well-being in prostatecancer research. In IEEE VIS Workshop on Visual Analytics in Healthcare(VAHC), pp. 1–8. ACM, 2015.
[5] J. Bernard, D. Sessler, T. Ruppert, J. Davey, A. Kuijper, and J. Kohlhammer.User-based visual-interactive similarity definition for mixed data objects-concept and first implementation. In WSCG, vol. 22. Eurographics, 2014.
[6] J. Bernard, M. Steiger, S. Mittelstadt, S. Thum, D. Keim, and J. Kohlham-mer. A survey and task-based quality assessment of static 2d colormaps. InElectronic Imaging, SPIE Conference on Visualization and Data Analysis,vol. 9397, pp. 93970M–93970M–16. SPIE Press, 2015.
[7] J. Bernard, M. Zeppelzauer, M. Sedlmair, and W. Aigner. A UnifiedProcess for Visual-Interactive Labeling. In M. Sedlmair and C. Tominski,eds., EuroVis Workshop on Visual Analytics (EuroVA). The EurographicsAssociation, 2017. doi: 10.2312/eurova.20171123
[8] R. Borgo, J. Kehrer, D. H. S. Chung, E. Maguire, R. S. Laramee, H. Hauser,M. Ward, and M. Chen. Glyph-based visualization: Foundations, designguidelines, techniques and applications. In Eurographics State of the ArtReports, EG STARs, pp. 39–63. Eurographics Association, May 2013.
[9] L. Breiman. Random forests. Machine learning, 45(1):5–32, 2001.[10] E. T. Brown, J. Liu, C. E. Brodley, and R. Chang. Dis-function: Learning
distance functions interactively. In IEEE Visual Analytics Science andTechnology (VAST), pp. 83–92. IEEE, 2012.
[11] K. Charmaz. Constructing grounded theory. Sage, 2014.[12] K. Chen and L. Liu. Clustermap: Labeling clusters in large datasets
via visualization. In ACM Conference on Information and KnowledgeManagement (CIKM), pp. 285–293. ACM, New York, NY, USA, 2004.
[13] C. Cortes and V. Vapnik. Support-vector networks. Machine learning,20(3):273–297, 1995.
[14] A. Culotta and A. McCallum. Reducing labeling effort for structuredprediction tasks. In Conference on Artificial Intelligence (AAAI), pp.746–751. AAAI Press, 2005.
[15] G. Cumming and S. Finch. Inference by eye: confidence intervals and howto read pictures of data. American Psychologist, 60(2):170, 2005.
[16] I. Dagan and S. P. Engelson. Committee-based sampling for trainingprobabilistic classifiers. In Conference on Machine Learning (ICML), pp.150–157. Morgan Kaufmann Pub., 1995.
[17] C. K. Dagli, S. Rajaram, and T. S. Huang. Leveraging active learning forrelevance feedback using an information theoretic diversity measure. InConference on Image and Video Retrieval, pp. 123–132. Springer, 2006.
[18] R. O. Duda, P. E. Hart, D. G. Stork, et al. Pattern classification, vol. 2.Wiley New York, 1973.
[19] C. Ferri, J. Hernandez-Orallo, and R. Modroiu. An experimental compar-ison of performance measures for classification. Pattern Recogn. Lett.,30(1):27–38, 2009.
[20] R. A. FISHER. The use of multiple measurements in taxonomic problems.Annals of Eugenics, 7(2):179–188, 1936. doi: 10.1111/j.1469-1809.1936.tb02137.x
[21] S. Garg, I. Ramakrishnan, and K. Mueller. A visual analytics approach tomodel learning. na, pp. 67–74, 2010.
[22] F. Heimerl, S. Koch, H. Bosch, and T. Ertl. Visual classifier training fortext document retrieval. IEEE Transactions on Visualization and ComputerGraphics (TVCG), 18(12):2839–2848, 2012.
[23] B. Hoferlin, R. Netzel, M. Hoferlin, D. Weiskopf, and G. Heidemann.Inter-active learning of ad-hoc classifiers for video visual analytics. InIEEE Visual Analytics Science and Technology (VAST), pp. 23–32, 2012.
[24] S. C. Hoi, R. Jin, and M. R. Lyu. Large-scale text categorization by batchmode active learning. In World Wide Web, pp. 633–642. ACM, 2006.
[25] K. Hornik, M. Stinchcombe, and H. White. Multilayer feedforward net-works are universal approximators. Neural networks, 2(5):359–366, 1989.
[26] S. Ingram, T. Munzner, V. Irvine, M. Tory, S. Bergner, and T. Moller.
Dimstiller: Workflows for dimensional analysis and reduction. In IEEEVisual Analytics Science and Technology (VAST), pp. 3–10. IEEE, 2010.
[27] I. T. Jolliffe. Principal Component Analysis. Springer, 3rd ed., 2002.[28] A. Kittur, E. H. Chi, and B. Suh. Crowdsourcing user studies with mechan-
ical turk. In Proceedings of the SIGCHI Conference on Human Factors inComputing Systems, CHI ’08, pp. 453–456. ACM, New York, NY, USA,2008. doi: 10.1145/1357054.1357127
[29] J. Krause, A. Perer, and E. Bertini. Infuse: Interactive feature selectionfor predictive modeling of high dimensional data. IEEE Trans on Vis.& Comp. Graph., 20(12):1614–1623, 2014. doi: 10.1109/TVCG.2014.2346482
[30] J. B. Kruskal. Multidimensional scaling by optimizing goodness of fit to anonmetric hypothesis. Psychometrika, 29(1):1–27, 1964.
[31] N. Landwehr, M. Hall, and E. Frank. Logistic model trees. MachineLearning, 59(1-2):161–205, 2005.
[32] Y. LeCun, L. Bottou, Y. Bengio, and P. Haffner. Gradient-based learningapplied to document recognition. Proceedings of the IEEE, 86(11):2278–2324, 1998.
[33] J. M. Lewis, M. Ackerman, and V. R. de Sa. Human cluster evaluationand formal quality measures: A comparative study. In Annual Meeting ofthe Cognitive Science Society (CogSci), pp. 1870–1875, 2012.
[34] J. M. Lewis, L. van der Maaten, and V. R. de Sa. A behavioral investigationof dimensionality reduction. In Annual Meeting of the Cognitive ScienceSociety (CogSci), 2012.
[35] G. M. Mamani, F. M. Fatore, L. G. Nonato, and F. V. Paulovich. User-driven feature space transformation. In CGF, pp. 291–299, 2013.
[36] N. A. H. Mamitsuka. Query learning strategies using boosting and bagging.In Conference on Machine Learning (ICML), vol. 1. Morgan KaufmannPub., 1998.
[37] A. McCallum and K. Nigam. Employing em and pool-based active learn-ing for text classification. In Conference on Machine Learning (ICML),pp. 350–358. Morgan Kaufmann Pub., San Francisco, CA, USA, 1998.
[38] J. Mohrmann, S. Bernstein, T. Schlegel, G. Werner, and G. Heidemann.Improving the usability of interfaces for the interactive semi-automaticlabeling of large image data sets. In Human Computer Interaction. Designand Development Approaches, pp. 618–627. Springer, 2011.
[39] F. Olsson. A literature survey of active machine learning in the context ofnatural language processing. Technical Report, no. 3600, 2009.
[40] S. Pajer, M. Streit, T. Torsney-Weir, F. Spechtenhauser, T. Mller, andH. Piringer. Weightlifter: Visual weight space exploration for multi-criteriadecision making. IEEE Transactions on Visualization and ComputerGraphics (TVCG), 23(1):611–620, 2017.
[41] F. V. Paulovich, M. C. F. Oliveira, and R. Minghim. The projection ex-plorer: A flexible tool for projection-based multidimensional visualization.In Symposium on Computer Graphics and Image Processing (SIBGRAPI),pp. 27–36. IEEE Computer Society, Washington, DC, USA, 2007.
[42] G.-J. Qi, X.-S. Hua, Y. Rui, J. Tang, and H.-J. Zhang. Two-dimensionalmultilabel active learning with an efficient online adaptation model forimage classification. IEEE Transactions on Pattern Analysis and MachineIntelligence, 31(10):1880–1897, 2009.
[43] D. Sacha, M. Sedlmair, L. Zhang, J. A. Lee, D. Weiskopf, S. C. North,and D. A. Keim. Human-Centered Machine Learning Through InteractiveVisualization: Review and Open Challenges. In Symp. on Artificial NeuralNetworks, Computational Intelligence and Machine Learning, 2016.
[44] D. Sacha, L. Zhang, M. Sedlmair, J. A. Lee, J. Peltonen, D. Weiskopf, S. C.North, and D. A. Keim. Visual Interaction with Dimensionality Reduction:A Structured Literature Analysis. IEEE Transactions on Visualization andComputer Graphics (TVCG), 23(01):241–250, 2016.
[45] G. Salton and C. Buckley. Improving retrieval performance by relevancefeedback. Readings in Information Retrieval, 24:5, 1997.
[46] J. W. Sammon. A nonlinear mapping for data structure analysis. IEEETrans. Comput., 18(5):401–409, 1969. doi: 10.1109/T-C.1969.222678
[47] A. Sarkar, M. Spott, A. F. Blackwell, and M. Jamnik. Visual discoveryand model-driven explanation of time series patterns. In Visual Languagesand Human-Centric Computing (VL/HCC), pp. 78–86. IEEE, 2016.
[48] T. Scheffer, C. Decomain, and S. Wrobel. Active hidden markov modelsfor information extraction. In Conference on Advances in Intelligent DataAnalysis (IDA), pp. 309–318. Springer-Verlag, London, UK, UK, 2001.
[49] T. Schreck and C. Panse. A new metaphor for projection-based visualanalysis and data exploration. In Visualization and Data Analysis 2007,SPIE Proceedings, pp. 64950L–64950L–12, 2007.
[50] T. Schreck, M. Schler, F. Zeilfelder, and K. Worm. Butterfly plots forvisual analysis of large point cloud data. In WSCG, pp. 33–40. University

of West Bohemia, Plzen, 2008.[51] T. Schreck, T. von Landesberger, and S. Bremm. Techniques for precision-
based visual analysis of projected data. Information Visualization,9(3):181–193, 2010.
[52] M. Sedlmair, T. Munzner, and M. Tory. Empirical guidance on scatter-plot and dimension reduction technique choices. IEEE Transactions onVisualization and Computer Graphics (TVCG), 19(12):2634–2643, 2013.
[53] M. Sedlmair, A. Tatu, T. Munzner, and M. Tory. A taxonomy of visualcluster separation factors. Computer Graphics Forum, 31(3pt4):1335–1344, 2012.
[54] D. Seebacher, M. Stein, H. Janetzko, and D. A. Keim. Patent Retrieval: AMulti-Modal Visual Analytics Approach. In EuroVis Workshop on VisualAnalytics (EuroVA), pp. 013–017. Eurographics, 2016.
[55] C. Seifert and M. Granitzer. User-based active learning. In IEEE Confer-ence on Data Mining Workshops (ICDMW), pp. 418–425, 2010.
[56] B. Settles. Active learning literature survey. Tech. Report 1648, Univ. ofWisconsin–Madison, 2009.
[57] B. Settles. Closing the loop: Fast, interactive semi-supervised annota-tion with queries on features and instances. In Conference on EmpiricalMethods in Natural Language Processing (EMNLP), pp. 1467–1478. Com-putational Linguistics, 2011.
[58] B. Settles and M. Craven. An analysis of active learning strategies forsequence labeling tasks. In Empirical Methods in Natural LanguageProcessing, pp. 1070–1079. Computational Linguistics, 2008.
[59] B. Settles, M. Craven, and S. Ray. Multiple-instance active learning. InAdvances in neural information processing systems, pp. 1289–1296, 2008.
[60] H. S. Seung, M. Opper, and H. Sompolinsky. Query by committee. InProc. of the 5th Ann. Worksh. on Comput. Learning Theory, COLT ’92,pp. 287–294. ACM, New York, NY, USA, 1992.
[61] C. Shannon. A mathematical theory of communication. Bell systemtechnical journal, 27, 1948.
[62] E. Simpson. Measurement of diversity. Nature, 163(4148):688–688, 1949.[63] M. Sips, B. Neubert, J. P. Lewis, and P. Hanrahan. Selecting good views
of high-dimensional data using class consistency. Computer GraphicsForum, 28(3):831–838, 2009.
[64] J. Stahnke, M. Drk, B. Mller, and A. Thom. Probing projections: Interac-tion techniques for interpreting arrangements and errors of dimensionalityreductions. IEEE Transactions on Visualization and Computer Graphics(TVCG), 22(1):629–638, 2016.
[65] D. Tuia, M. Volpi, L. Copa, M. Kanevski, and J. Munoz-Mari. A sur-vey of active learning algorithms for supervised remote sensing imageclassification. IEEE Selected Topics in Signal Proc., 5(3):606–617, 2011.
[66] L. van der Maaten and G. E. Hinton. Visualizing high-dimensional datausing t-sne. Journal of Machine Learning Research, 9:2579–2605, 2008.
[67] J. Vendrig, I. Patras, C. Snoek, M. Worring, J. den Hartog, S. Raaijmakers,J. van Rest, and D. A. van Leeuwen. Trec feature extraction by activelearning. In TREC, 2002.
[68] M. Wang and X.-S. Hua. Active learning in multimedia annotation andretrieval: A survey. ACM Trans. Intell. Syst. Technol., 2(2):10:1–10:21,2011.
[69] Y. Wang, K. Feng, C. Xiaowei, J. Zhang, C.-W. Fu, M. Sedlmair, X. Yu, andB. Chen. A Perception-Driven Approach to Supervised DimensionalityReduction for Visualization. IEEE Transactions on Visualization andComputer Graphics (TVCG), 2017. to appear.
[70] M. Ware, E. Frank, G. Holmes, M. Hall, and I. H. Witten. Interactivemachine learning: letting users build classifiers. Human-Computer Studies,pp. 281–292, 2001.
[71] N. Weber, M. Waechter, S. C. Amend, S. Guthe, and M. Goesele. Rapid,Detail-Preserving Image Downscaling. In ACM SIGGRAPH Asia, 2016.
[72] Y. Wu, I. Kozintsev, J.-Y. Bouguet, and C. Dulong. Sampling strategiesfor active learning in personal photo retrieval. In Multimedia and Expo,2006 IEEE International Conference on, pp. 529–532. IEEE, 2006.