comparative testing of pipeline slurry monitors; u.s. doe
TRANSCRIPT

DOE/EM-0490
ComparativeTesting of
Pipeline SlurryMonitors
Tanks Focus Area andCharacterization, Monitoring and
SensorTechnology Crosscutting Program
Prepared for
U.S. Department of EnergyOffice of Environmental Management
Office of Science and Technology
September 1999
ComparativeTesting of
Pipeline SlurryMonitors
OST Reference #1547
Tanks Focus Area andCharacterization, Monitoring andSensor Technology Crosscutting
Program
Demonstrated atOak Ridge National Laboratory
Oak Ridge, Tennessee

Purpose of this document
Innovative Technology Summary Reports are designed to provide potential users with theinformation they need to quickly determine if a technology would apply to a particularenvironmental management problem. They are also designed for readers who mayrecommend that a technology be considered by prospective users.
Each report describes a technology, system, or process that has been developed and testedwith funding from DOE’s Office of Science and Technology (OST). A report presents the fullrange of problems that a technology, system, or process will address and its advantages to theDOE cleanup in terms of system performance, cost, and cleanup effectiveness. Most reportsinclude comparisons to baseline technologies as well as other competing technologies.Information about commercial availability and technology readiness for implementation is alsoincluded. Innovative Technology Summary Reports are intended to provide summaryinformation. References for more detailed information are provided in an appendix.
Efforts have been made to provide key data describing the performance, cost, and regulatoryacceptance of the technology. If this information was not available at the time of publication,the omission is noted.
All published Innovative Technology Summary Reports are available on the OST Web site athttp://OST.em.doe.gov under “Publications.”

1
SUMMARY page 1
TECHNOLOGY DESCRIPTION page 4
PERFORMANCE page 8
TECHNOLOGY APPLICABILITY AND ALTERNATIVES page 13
COST page 15
REGULATORY AND POLICY ISSUES page 18
LESSONS LEARNED page 20
APPENDICES
References
List of Acronyms
1
2
3
4
5
6
7
A
TABLE OF CONTENTS
B

1
SECTION 1SUMMARY
Technology Summary
Problem DefinitionMillions of gallons of radioactive liquid and sludge wastes must be retrieved from underground storagetanks at U.S. Department of Energy (DOE) sites, transferred to treatment facilities, and processed to afinal waste form. To retrieve waste from storage tanks, sludge wastes are typically mobilized and mixedwith liquid wastes to create a slurry of liquid and suspended solids. The slurry is then transferred bypipeline to the desired location for treatment prior to disposal. Slurries from retrieving tank waste havehigh viscosity and solids content. Slurries with high viscosity are difficult to pump and generate largeback pressures. If pump back pressures exceed the rating of the transport pipeline, pumping cannotcontinue. A pipeline blockage can occur because of gravity sedimentation of solids in the transfer line.
How the Devices WorkMonitoring the transport properties (i.e., the percentage of suspended solids, density, viscosity, massflow rate, and particle size) of the slurries in transfer lines can prevent pipeline blockage and ensure safetransport of the waste. Slurry monitoring instruments measure transport properties during pipelinetransfers to enable operators to maintain acceptable control limits and thereby prevent pipeline blockage.In-line instruments provide real-time measurements of slurry properties to operators, who can respondquickly to prevent any conditions that could lead to pipeline blockage.
Potential MarketsMany DOE sites have wastes that need to be retrieved from tanks for treatment and disposal. ThreeDOE sites have identified the need for slurry monitoring to improve tank waste treatment operations:
• The Hanford Site has 54 million gal of waste.• Savannah River Site (SRS) has 34 million gal of waste.• The Oak Ridge Reservation (ORR) has about 700,000 gal of legacy waste and generates about
500,000 gal of new liquid waste annually.
Advantages over Base lineThe baseline instrumentation plan calls for grab sampling of the waste followed by off-line laboratoryanalysis. The innovative in-line slurry monitors outperform the baseline technology by
• providing real-time data on the density, particle population, and particle dimensions of the slurrymaterial throughout the transport process, starting at the source tank, then along the pipeline and atdestination location;
• reducing the required number of grab sample and thus reducing personnel exposure to radiationduring grab sampling; and
• reducing the potential for pipeline blockages that negatively impact project costs and schedules.
Demonstration Summary
Pipeline slurry monitors were demonstrated to assess instrumentation to monitor slurry transportproperties on line and in real time.
• In fiscal year 1997 (FY97), nine pipeline and three in-tank instruments were evaluated in a cold-testloop under conditions similar to field environment at ORR. (Hylton et al. 1998)
• In FY98, under the Slurry Monitoring Technology Deployment Initiative, ORR’s Slurry MonitoringTest Loop (SMTL) was installed at the Gunite and Associated Tank (GAAT) Slurry Transport System.

2
• In FY99, the Endress+Hauser Promass 63M Coriolis meter (Figure 1) and the Lasentec M600Panalyzer (Figure 2) were demonstrated in the SMTL. (Hylton and Bayne 1999)
The Endress+Hauser Promass 63M Coriolis meter and the Lasentec M600P analyzer have beensuccessfully deployed at ORR. Slurry monitors are used as slurry is transported to GAAT W-9, which isused as a consolidation tank. The waste is transferred from GAAT W-9 to the Melton Valley StorageTanks (MVSTs). Initial operation of slurry monitors with supernatant from the GAAT consolidation tankwas accomplished in May 1999. By late June, a total of 60,000 gal had been transferred from GAAT W-9to the MVSTs.
Parties Involved in the Deve lopmentDOE sponsored comparative testing of slurry monitors through cooperation of the Characterization,Monitoring, and Sensor Technology Crosscutting Program and the Tanks Focus Area. The slurry monitordeployments were funded under an Accelerated Site Technology Deployment (ASTD) project. The OakRidge Waste Management Program was responsible for the ORR deployment.
Regulatory Consid erat ions and Policy IssuesThe installation of slurry monitoring instruments is considered a maintenance activity, and permits arenot required.
Commercial Availa bility and Readiness for A pplication
• The Endress+Hauser Promass 63M Coriolis meter is available from Endress+Hauser, Inc.,Greenwood, Indiana.
• The Lasentec M600P analyzer is available from Laser Sensor Technology, Inc., Redmond,Washington.
Figure 1. End ress+Hauser Promass 63MCoriolis meter installed in GAAT Slurry
Monitoring Test Loop.
Figure 2. L asentech M600P analyzerinstalled in GAAT Slurry M onitoring
Test Loop.
3
Future PlansThe Endress+Hauser Promass 63M Coriolis meter and the Lasentec M600P analyzer are used asprocess flow monitors during transfers from ORR GAAT W-9 to the MVSTs. The Endress+HauserPromass 63M Coriolis meter is used to measure slurry density and estimate suspended solidsconcentration based on a calculational method. The Lasentec M600P analyzer is used to estimate thedistribution of particles. These two instruments will continue to be used for such transfer campaigns untilApril 2000. Slurry monitors are available for deployment at Hanford, SRS, and other locations across theDOE complex.
Contacts
TechnicalTom Hylton, Senior Scientist, Oak Ridge National Laboratory, Oak Ridge, Tenn., (423) 576-2225, E-mail:[email protected]
Glenn Bastiaans, Senior Scientist, Ames Laboratory, Iowa State University, Ames, Iowa, (515) 294-3298,E-mail: [email protected]
Eric Daymo, Senior Scientist, Pacific Northwest National Laboratory, Richland, Wash., (509) 373-6225,E-mail: [email protected]
Tom Thomas, Technical Integration Manager, Tanks Focus Area, Idaho National Engineering andEnvironmental Laboratory, Idaho Falls, Id., (208) 526-3086, E-mail: [email protected]
ManagementKurt Gerdes, Program Manager, Tanks Focus Area, DOE, Germantown, Md., (301) 903-7289, E-mail:[email protected]
Ted Pietrok, Field Program Manager, Tanks Focus Area, DOE Richland Operations Office, Richland,Wash., (509) 372-4546, E-mail: [email protected]
Charles Nalezny, Program Manager, Characterization, Monitoring, and Sensor Technology CrosscuttingProgram, DOE, Germantown, Md., (301) 903-1742, E-mail: [email protected]
Joseph Ginanni, Field Program Manager, Characterization, Sensor and Monitoring TechnologyCrosscutting Program, DOE Nevada Operations Office, Las Vegas, Nev., (702) 295-0209, E-mail:[email protected]
OtherAll published Innovative Technology Summary Reports are available on the OST Web site athttp://ost.em.doe.gov under “Publications.” The Technology Management System (TMS), also availablethrough the OST Web site, provides information about OST programs, technologies, and problems. TheOST/TMS ID for comparative testing of pipeline slurry monitors is 1547.

4
SECTION 2 TECHNOLOGY DESCRIPTION
Overall Process Definition
Slurry monitoring requirements can potentially be met by numerous commercial instruments andlaboratory prototype devices. Several of these commercial and prototype slurry monitors were evaluatedin a comparative testing program. Two measures of quantitative performance were used to evaluate theslurry monitoring instruments:
• bias—the difference between the average of the measurement readings by a slurry monitoringinstrument and the accepted reference value, and
• variance—a measure of dispersion of replicate measurement readings by a slurry monitoringinstrument.
The Endress+Hauser Promass 63M Coriolis meter and the Lasentec M600P analyzer performedsuccessfully. These instruments are described below.
Endress+Hauser Promass 63M Cor iolis MeterThe Endress+Hauser Promass 63M Coriolis meter is approximately 28 inches long from flange to flange(see Figure 1). The meter measures the mass flow, density, and temperature of fluids or slurriessimultaneously. Once mass flow and density are determined, other functions can be calculated (e.g.,volumetric flow, suspended solids concentration). Measurement of the slurry density was the majorparameter evaluated in this project; however, the suspended solids concentration—as determined fromthe slurry density, supernatant density, and dry solids density—was also assessed. The mass flow ratewas not evaluated in this study but was used to determine the flow rate of the slurry through the SMTL.
The measuring principle of the Endress+Hauser Promass63M Coriolis meter is based on the controlled generationof Coriolis forces, which are present when translational(straight-line) and angular (rotational) movements occursimultaneously in a moving system (see Figure 3). Theamplitude of the Coriolis force depends on the movingmass, its velocity in the system, and, therefore, its massflow. The Endress+Hauser Promass 63M Coriolis meteruses two parallel measuring pipes with liquid flowingthrough them . The slightly curved measuring pipes aremade to oscillate at their resonant frequency like a tuningfork. This resonant frequency adjusts automatically assoon as the mass of the oscillating system—and thereforethe density—changes. The resonant frequency is thus afunction of the density of the flowing liquid and enables themicroprocessor to produce a signal indicating density. Themass flow rate is indicated by the oscillation phasedifference between the ends of the tubes.
Lasentec M600P AnalyzerThe Lasentec M600P analyzer (see Figure 2) uses atechnique known as focused-beam reflectancemeasurement (FBRM), which involves focusing a laserto a fine point. The FBRM technique provides acontinuous, high-speed count of particle population bydimension, making it possible to track the rate and degreeof change on the basis of both particle count and particle Figure 3. Pro mass measurement princ iple.

5
dimension. FBRM is a real-time, in-process measure of particle count and dimension by chord lengthdistribution. The chord length distribution is a function of the shape and dimension of the particles in theflowing medium.
When the Lasentec analyzer is used, a FBRMprobe is inserted into a flowing medium of anyconcentration or viscosity. A highly focusedlaser beam is projected through the probewindow and, at a fixed velocity, rapidlyscanned across particles and particlestructures flowing past the probe window (seeFigure 4).
The most intense part of the focused beam isapproximately 2 µm in diameter and 10 µm indepth. The light intensity is distributed acrossthe cross section of the beam spot with thecenter being far more intense than the edges.The focal point, which is just inside the windowof the probe, is then rotated around thewindow with a linear velocity of 2 m/s.
When the focused beam intersects the edge of a particle, the particle begins to backscatter the laserlight. The particle continues to backscatter until the focused beam has reached the opposite edge of theparticle. This backscatter is collected by the FBRM optics and then converted into an electronic signal. Aunique discrimination circuit is used to isolate the time period of the backscatter from one edge of anindividual particle to its opposite edge. This time period is multiplied by the scan speed, and the result isa distance (see Figure 5). This distance is a chord length, which is a straight line between any two pointson the edge of the particle or particle structure. Hundreds of thousands of chords are typically measuredper second, resulting in a chord length distribution (number of counts per second sorted by chord length).
Figure 5. The focused l aser beam scanned across each particle and the result ing chord length.Source: Laser Sensor Technology, Inc. Used with permission.
The chord length distribution is a highly precise and sensitive means to track change to both particledimension and particle population. In addition, with a number/length/second distribution, specific regionsof the distribution can be isolated to enhance resolution (i.e., the number of fine particles or number ofparticles over a given dimension).
Support EquipmentThe technologies must be supported by electronics, data analysis, and data reduction equipment locatedin a remote field unit, usually no more than 10 m from the probe. Data reduction requires a computerlocated in a nearby trailer or accessed via phone line from the field site. In remote locations, power mayneed to be supplied by a generator.
Specific DOE ApplicationThe objective of the GAAT project is to remediate and permanently close several inactive storage tanksconstructed in the 1940s. The GAAT project removes the sludges from the various tanks by creating
Figure 4. L asentec probe tip.Source: Laser Sensor Technology, Inc.
Used with permission.
6
slurries for transport and consolidating them into a single tank. Once the slurries are in the consolidationtank, they are mixed to homogenize and keep them suspended in a slurry form.
A pipeline loop is used to circulate the slurries out of and back into the consolidation tank. The slurrymonitoring test system is installed in the circulation loop. While the slurries are being circulated, thevarious monitoring instruments determine their transport properties. Samples are collected and analyzedto verify the accuracy and precision of the data reported by the instruments. The slurry monitoringinstruments determine whether and when the transport properties are acceptable. When the transportproperties are deemed acceptable, the slurry flow is diverted and transferred to the MVSTs for storageand processing.
System Operation
In-line instruments measure the transport properties as the slurry flows through or by the instrument.Data are provided to operators, who respond to counteract conditions that could lead to pipeline pluggingand to control those conditions within specified limits while the slurry transfer is in progress. Operatingrequirements are described in more detail below.
Endress+Hauser Promass 63M Cor iolis MeterNo special precautions need to be taken during mounting for turbulence-generating devices such asvalves, bends, pipe tees, etc., as long as no cavitation occurs. External forces are absorbed by thesecondary containment vessel. The high-frequency oscillation of the measuring tubes protects themeasuring system from being affected by plant vibration.
Vertical mounting is recommended with the process material flowing upwards. This arrangement allowsentrained solids to sink down and gases to rise away from the measuring tube. It also allows themeasuring tube to be completely drained during periods of no flow, protecting the tubes from solidsbuildup. When correctly installed, the transmitter housing is either above or below the piping, ensuringthat no gas bubbles collect and solids are deposited in the curved measuring tubes.
The sensor must not be suspended in the piping without support to avoid excessive stress on thematerial around the process connection. The housing base plate of the sensor allows table, wall, or postmounting. The post mounting option requires a special mounting set available from Endress+Hauser.
Lasentec M600P AnalyzerPer the manufacturer’s recommendation, the Lasentec M600P analyzer is installed at a 45° angle to helpmake the probe self-cleaning: the impinging slurry keeps the sludge from building up on the surface ofthe probe’s window.
The Lasentec instrument does not account for the velocity of particles as they pass the probe. To offsetthis effect, the focal point is scanned at 2 m/s. The manufacturer recommends a slurry velocity ofapproximately 1.8 m/s; however, the flow rate should be turbulent to mix the particles in the pipe toensure that uniformly random material is presented to the probe window. The manufacturer advises thatfor constant flow speeds in excess of 1.8 m/s, a constant offset will occur in the measurement caused bythe slurry’s flowing faster than the scan rate used for the chord length calculation.
Materials, Energy, and Other Expendable ItemsThe Lasentec probe has one moving part, a bearing assembly that rotates the laser light. If theinstrument is turned off when not in use, the bearing should never have to be replaced. Otherwise, thebearing should last for a year of 24-h/day operation.
The Endress+Hauser Promass 63M Coriolis meter housing/containment vessel is surface-resistant toacids and alkalis. Its measuring tubes are Grade 9 titanium. It has no internal gaskets. The sensorconnection uses O-rings.

7
Personnel RequiredThe instruments can be operated by a single person; however, operation is easier with two people.Installation time for slurry monitoring equipment should not impact project schedules.
Secondary Waste Stream Considerat ionsThe SMTL is a fully contained system, so no job waste is generated.
Potential Operat ional Con cerns and RisksRisk is minimal because the system is fully contained.

8
SECTION 3 PERFORMANCE
Demonstration Plan
In 1997, nine pipeline and three in-tank slurry monitoring instruments were tested in nonradioactiveconditions at either ORR or Pacific Northwest National Laboratory. See Table 1 and Figure 6.
Table 1. Slurry m onitoring instruments included in the 1997 cold testInstrument Technique Mounted Organization
Particle size probe Ultrasonic signalattenuation
In tank Pacific Northwest NationalLaboratory
Density probe Ultrasonic reflectioncoefficient
Pipeline,in tank
Pacific Northwest NationalLaboratory
Viscosity-densityproduct
Quartz crystal resonation Pipeline,in tank
Sandia National Laboratories
Density probe Gamma-ray attenuation Pipeline Oak Ridge National LaboratoryDensity, viscosity, andvolume percent solids
Ultrasonic impedancesand scattering
Pipeline Argonne National Laboratory
Percent solids Image processing system Pipeline Items purchased separately andmerged to form a system
Density (U-loop) Pressure drop Pipeline Fabricated in houseDensity meter Coriolis effect Pipeline Endress+Hauser (Promass)Density meter Coriolis effect Pipeline Endress+Hauser (m-Point)Percent solids Backscattering of light Pipeline BTG (SMS-3000 System)Particle probea FBRM Pipeline Laser Sensor Technology, Inc.Line pressurea Pipeline Red Valve, Honeywell
aTested at Pacific Northwest National Laboratory. (Reynolds et al. 1996)
The Endress+Hauser Promass 63M Coriolis meter andthe ultrasonic instrument from Argonne NationalLaboratory were selected by the Characterization,Monitoring, and Sensor Technology CrosscuttingProgram and the Tanks Focus Area for testing in aradioactive application. The Lasentec instrument wasincluded in the evaluation at the request of the ASTDProgram.
In February 1999, as a follow-up to the FY97 study,scientists tested these instruments to monitor thetransport properties of radioactive slurry. The objectwas to determine whether the instruments couldaccurately monitor radioactive slurries to help preventpipe blockage, a problem encountered at the variousDOE radioactive waste storage sites.
The instruments were installed and tested in arecirculation loop at the GAAT project at ORR (seeFigure 7). A pipeline loop is used to circulate the slurries out of and back into the W-9 consolidation tank.The slurry monitoring test system is installed in the circulation loop. While the slurries are beingcirculated, the various monitoring instruments determine transport properties. Samples are collected andanalyzed to verify the accuracy and precision of the data reported by the instruments. Hydrostatic tests
Figure 6. Oak Ridge National Laboratorycold-test loop.
9
of slurry monitors installed in the SMTL were successfully initiated in February 1999. Results of thesetests are discussed below.
Figure 7. ORR’s Slu rry M onitoring Test Loop.
Demonstration Site DescriptionThe GAAT at ORR includes six large underground gunite tanks, designated as tanks W-5 through W-10,built to collect and store wastes generated by ORR operations (see Figure 8). These tanks have avolume capacity of 643,000 L (170,000 gal), an inside diameter of 50 ft, a sidewall height of 12 ft, and adome height of 18 ft at the center. GAAT waste is being consolidated in W-9.
Six smaller gunite tanks and four stainless steel tanks constitute the remainder of the GAAT. Thesetanks eventually became an integral part of the ORR waste system. When the gunite tanks were takenout of service in 1980, approximately 1.5 million L (400,000 gal) of sludge containing between 0.5 and 1million curies had accumulated.
Major ObjectivesThis project tested and evaluated slurry monitors that are commercially available and those beingdeveloped under the Characterization, Monitoring, and Sensor Technology Program; the Tanks FocusArea; and the Oak Ridge National Laboratory (ORNL) Waste Management organization. Slurrymonitoring was demonstrated to improve slurry transfer operations, so slurry monitors were deployed forthe GAAT Remediation Project. The goal of the GAAT Remediation Project is to remove the remainingsludge and to permanently close the tanks. Slurry monitors facilitate safe and efficient GAAT wasteremoval, transfer to GAAT W-9, and cross-site transfer to MVSTs.
Submersible Pump
Tank W-9
A B C D
A Lasentec M600PB Ultrasonic Suspended Solids MonitorC ISOLOK samplerD Endress + Hauser Promass 63M
SMTS
To theCross-Site
Slurry TransferPipeline
Slurry fromOther Tanks

10
Figure 8. Gunite waste tanks at Oak Ridge National Laboratory.
Major Elements of the Tec hnologyA recirculation loop receives wastes being transferred into and out of GAAT W-9. Slurry monitors areinstalled in a recirculation loop with a waste conditioning system (WCS). The WCS consists of anenclosure for the primary conditioning system components. The tank contents are mixed using a pulsed-air mixer developed by Pulsair Systems, Inc. A solids classifier and a sampler are used to monitor theparticle size of the sludge in the WCS. Waste passes through a separate SMTL enclosure containingslurry monitoring instrumentation.
BoundariesThis demonstration was not intended to address the efficacy of the slurry transport process or to findalternative methods of cleanup.
Results
Area/Volume CharacterizedThe volume of material in GAAT W-9 varied from 104,000 to 113,000 gal during the testing period. Dwelltime (the time between the air injections) was varied for the pulsed-air mixer during testing (see Table 2).
Table 2. Conditions for testing the slu rry m onitorsPulsed-air mixing p arameters
Test
DateTank W-9volume
(gal)
Recirculationpump position a
(ft)Dwell time
(s)Injection time
(s)Air supply p ressure
(psig)1 02/17/9
9104,000 4 10 1 35
2 02/22/99
104,000 4 18 1 35
3 02/25/99
103,000 4 14 1 35
4 03/02/99
105,000 6 10 1 35
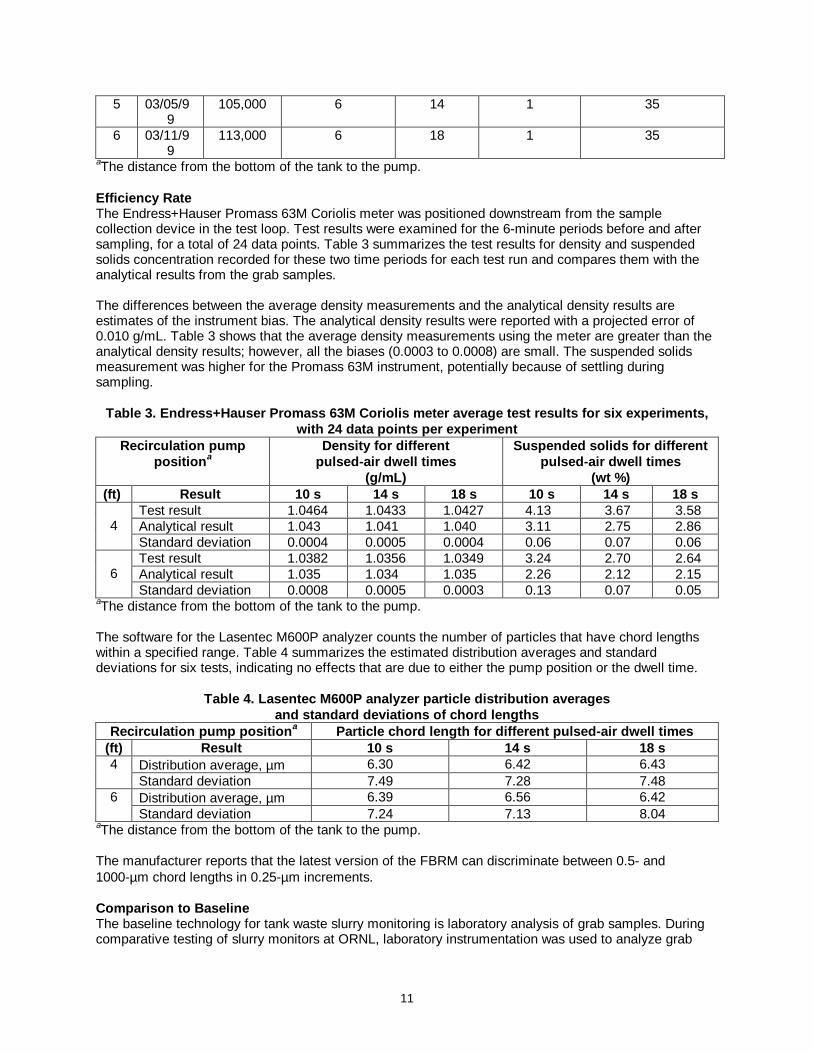
11
5 03/05/99
105,000 6 14 1 35
6 03/11/99
113,000 6 18 1 35
aThe distance from the bottom of the tank to the pump.
Efficiency RateThe Endress+Hauser Promass 63M Coriolis meter was positioned downstream from the samplecollection device in the test loop. Test results were examined for the 6-minute periods before and aftersampling, for a total of 24 data points. Table 3 summarizes the test results for density and suspendedsolids concentration recorded for these two time periods for each test run and compares them with theanalytical results from the grab samples.
The differences between the average density measurements and the analytical density results areestimates of the instrument bias. The analytical density results were reported with a projected error of0.010 g/mL. Table 3 shows that the average density measurements using the meter are greater than theanalytical density results; however, all the biases (0.0003 to 0.0008) are small. The suspended solidsmeasurement was higher for the Promass 63M instrument, potentially because of settling duringsampling.
Table 3. Endress+Hauser Promass 63M Cor iolis meter average test results for six experiments,with 24 data points per experiment
Recirculat ion pumpposition a
Density for differentpulsed-air dwell times
(g/mL)
Suspended solids for diff erentpulsed-air dwell times
(wt %)(ft) Result 10 s 14 s 18 s 10 s 14 s 18 s
Test result 1.0464 1.0433 1.0427 4.13 3.67 3.58Analytical result 1.043 1.041 1.040 3.11 2.75 2.864Standard deviation 0.0004 0.0005 0.0004 0.06 0.07 0.06Test result 1.0382 1.0356 1.0349 3.24 2.70 2.64Analytical result 1.035 1.034 1.035 2.26 2.12 2.156Standard deviation 0.0008 0.0005 0.0003 0.13 0.07 0.05
aThe distance from the bottom of the tank to the pump.
The software for the Lasentec M600P analyzer counts the number of particles that have chord lengthswithin a specified range. Table 4 summarizes the estimated distribution averages and standarddeviations for six tests, indicating no effects that are due to either the pump position or the dwell time.
Table 4. Lasentec M600P analyzer particle distr ibution averagesand standard deviations of chord lengths
Recirculat ion pump position a Particle chord length for different pulsed-air dwell times(ft) Result 10 s 14 s 18 s
Distribution average, µm 6.30 6.42 6.434Standard deviation 7.49 7.28 7.48Distribution average, µm 6.39 6.56 6.426Standard deviation 7.24 7.13 8.04
aThe distance from the bottom of the tank to the pump.
The manufacturer reports that the latest version of the FBRM can discriminate between 0.5- and1000-µm chord lengths in 0.25-µm increments.
Comparison to Base lineThe baseline technology for tank waste slurry monitoring is laboratory analysis of grab samples. Duringcomparative testing of slurry monitors at ORNL, laboratory instrumentation was used to analyze grab

12
samples to provide data for comparison with results from the in-line monitors being tested. The assaydata obtained in the laboratory were comparable in quality to the results obtained from the Coriolisdensity monitor and the Lasentec M600P analyzer. (Hylton and Bayne 1999)
During testing, the innovative in-line slurry monitors outperformed the baseline technology by:
• providing real-time data on the density and particle distribution of the slurry material throughout thetransport process, starting at the source tank, then along the pipeline and at destination location;
• eliminating unnecessary personnel exposure to radiation during grab sampling; and• reducing the potential for pipeline blockages that negatively impact project costs and schedules.

13
SECTION 4 TECHNOLOGY APPLICABILITY AND ALTERNATIVES
Competing Technologies
In FY97 numerous in-line, real time monitoring instruments were tested for their ability to measure arange of waste slurry properties (Hylton et al. 1998). An analysis of the operational characteristics andmeasurement results of the in-line instruments, when tested with surrogate waste slurries, supported adecision process to determine and select the best instrumentation for testing with real tank waste. TheEndress+Hauser Promass 63M Coriolis meter and the Lasentec M600P analyzer and were judged tohave performed better than the competing technologies during surrogate waste testing and were selectedfor testing with real waste.
Technology Applicability
Other Potential Applications To Be Consid eredHanford and ORR both plan to retrieve and transport millions of gallons of radioactive sludges andslurries from radioactive waste tanks. At Hanford alone, 54 million gal of slurry must be retrieved fromtanks for treatment and disposal.
The in-line monitoring instruments also have potential applications at SRS, which currently monitors theinterarea slurry transfer line with pressure sensors and flow meters. The type of pressure sensor used atSRS requires the slurry to travel through a small capillary tube to act against a diaphragm. Thesesensors are prone to failure if solids block the capillary tube.
Scale-Up RequirementsThere are no scale-up requirements. The monitors tested are all commercially available or use off-the-shelf components and can be deployed without development costs. All the instruments have beendemonstrated.
Future Technology Selection Consid erat ionsThe Lasentec M600P analyzer will be the first slurry instrument installed in the DOE nuclear complex tomeasure particle distribution in line. The proposed monitor is not included in current transfer line designsbecause the technology has been very recently demonstrated.
Patents/Commercialization/Sponsor
Commercial Involvement by Private IndustryLasentec and Endress+Hauser designed their own instruments and hold all patent and licensing rights.Both instruments can be purchased directly from the manufacturers.
SponsorsPotential sponsors for slurry monitoring deployment include
• user organizations;• the Office of Science and Technology through the Tanks Focus Area, Technology Deployment
Initiative (TDI), and the Characterization, Monitoring, and Sensor Technology Program; and• Site Technology Coordination Groups, which manage and coordinate technical needs at their
respective sites.
Potential Privatization of Technology

14
Operation of slurry monitors can be privatized if appropriate. The instruments could be used to monitorthe slurry transfer systems that provide feed to private vendors under Hanford Phase I Privatization.During Phase II Privatization at Hanford, slurry transfers will become the responsibility of theprivatization contractor.

15
SECTION 5 COST
A slurry monitor deployment will result in cost savings by preventing pipeline blockages. Slurrymonitoring provides an additional value beyond replacing grab sampling by eliminating the need forunnecessary radiation exposure of workers collecting samples or repairing blocked pipelines.
Methodology
The baseline and innovative technology cost and schedule information was obtained from the draftdeployment plan of the slurry monitoring TDI proposal. The costs are provided below for GAAT. The useof in-line slurry monitors instead of grab sampling allows for continuous sampling of the waste stream formore representative data with no project downtime and no personnel exposure.
Cost Analysis
Slurry M onitoring CostsTable 5 summarizes life cycle costs for deployment of the Endress+Hauser Promass 63M Coriolis meterand the Lasentec M600P analyzer at GAAT. The capital costs include equipment procurement,calibration, and installation. Safety analyses, permitting, design modifications, other project expenses notdirectly related to capital equipment costs, and calibration tests are included in the installation cost. Thetable shows operating and maintenance costs separately from decontamination and decommissioningcosts.
Table 5. Life cycle costs for de ploying slu rry m onitorsat the Oak Ridge Gunite and Associated Tanks
Item Endress+Hauser Promass63M Coriolis meter
($K)
Lasentec M600Panalyzer
($K)Capital equipment 10 85Calibration 2 5Installation 30 30Operating and maintenance 6 6Decontamination and decommissioning 10 10Total 58 136
Costs for the Endress+Hauser Promass 63M Coriolis meter are not included in the TDI proposal.Installing the Endress+Hauser Promass 63M Coriolis meter would increase cost by 30%. The capitalequipment cost of the Endress+Hauser Promass 63M Coriolis meter is approximately $10K. Other costsare similar to those for the Lasentec M600P analyzer.
Grab Sampling CostsTable 6 summarizes parameters and costs for baseline grab sampling for GAAT. Grab sampling requiresthe use of sampling teams to collect the samples and analytical services to provide the necessaryparticle distribution data.
• Volume of waste—The volume of waste used to calculate cost savings is based on the planned totalvolume to be transferred as part of GAAT, plus 20% for added sluicing water. Estimates are basedon information obtained from the TDI draft deployment plan, the GAAT Web site (gaat.stepenv.com),and Eric Daymo, Senior Scientist, Pacific Northwest National Laboratory.

16
• Sampling events—The cost for collecting grab samples is based on project information andcommunication from project personnel. Past sampling events are used to determine the batch sizeper transfer, the number of samples required per batch, and the sampling team cost.
• Cost of project downtime—The cost of project downtime is calculated from project information andcommunication from project personnel. No waste is transferred while samples are collected. Staffneeded to manage, perform, or oversee waste transfer wait until the grab sampling data is obtained.The estimated number of people affected includes the field project managers, craft workers, healthphysicists (HP), and operations personnel. In many cases, the cost for downtime during sampleanalysis is minimized because the crew can be assigned to another job until needed.
Table 6. Grab sampling at the Oak Ridge Gunite and Associated TanksItem Estimate
Parameters affect ing sampling costsVolume of waste processed 350,000 galVolume with assumed 100% increase for sluicing water:2 x 350,000 = 700,000 gal
700,000 gal
Waste transfer batch size 40,000 galNumber of batches 18Samples per batch 3Total number of samples [samples/batch (3) x number of batches (18)] 54Length of time per sample 2 hSampling costsSample team costs: two samplers and one HP, 2 h each @ $100/h/sample $600Materials cost (gloves, PPE, sample bottle, plastic sheets) @ $100/sample $100Total sampling costs [sample team costs ($700) x total number of samples (54)] $37,800Radiological analytical costsLaboratory setup cost: 8 h x $125/h $1,000Analysis cost: 4 h for suspended solids + 2 h for density + 8 h for suspendedsolids concentration x $125/h/sample
$1,750
Total analytical costs [setup + analysis ($2,750) x total number of samples (54)] $148,500Project downtime costs during sampling eventsHourly project personnel cost (20 @ $100/h) $2,000/hTotal sampling time over project (2 h x 54 samples) 108 hTotal project personnel downtime costs during sampling [hourly cost ($2,000/h) x total time (108 h)]
$216,000
Estimated project personnel downtime costs during sample analysis (2 persons x8 h x $100 h x 54 samples). Other personnel assigned to productive tasks.
$86,400
Total project downtime costs $302,400Total project costs for grab sampling at GAATTotal sample team costs $37,800Total analytical costs $148,500Total downtime costs $302,400Total project costs for grab sampling at GAAT ~$489,000
Cost of Line Blo ckageTable 7 shows the cost of a pipeline blockage for GAAT. The cost to either repair or replace a section ofline because of a blockage is estimated to be $100,000. This estimate assumes that 100 ft of pipeline at$1,000/ft would be required and would take 10 days to be completed. Costs for excavating and workingin a radiological zone were not included and would significantly increase the cost of repair of a pipelineblockage.
17
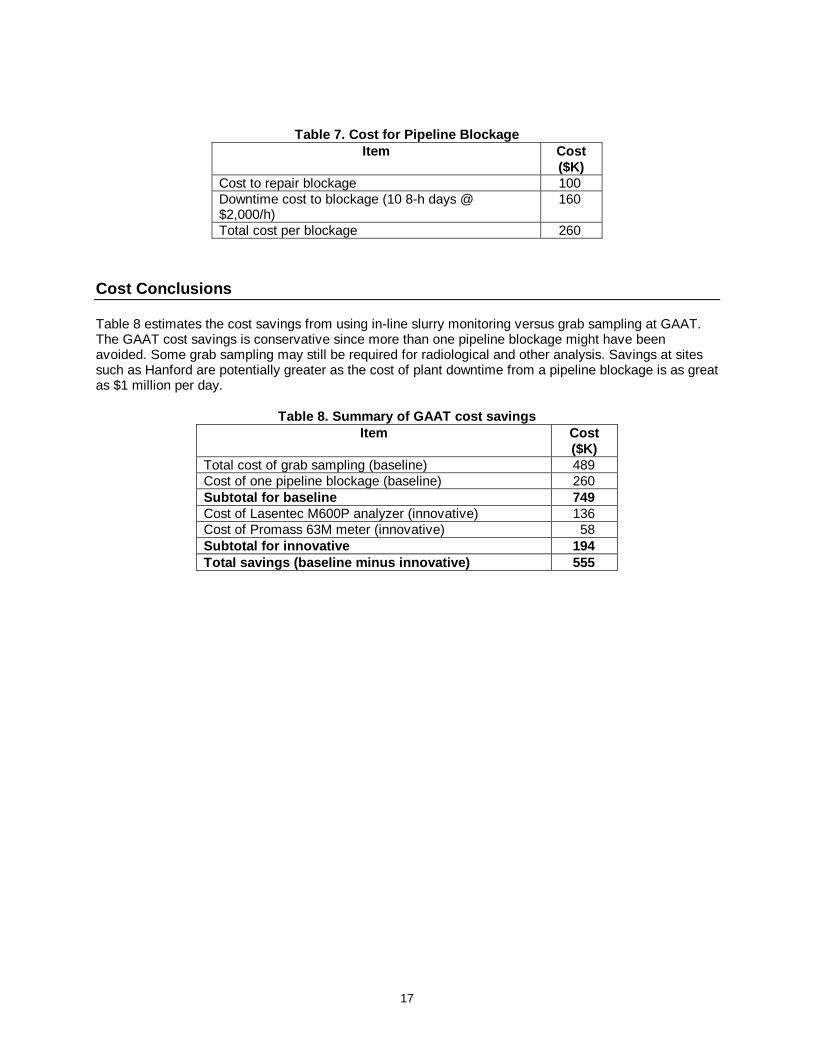
Table 7. Cost for Pipeline Blo ckageItem Cost
($K)Cost to repair blockage 100Downtime cost to blockage (10 8-h days @$2,000/h)
160
Total cost per blockage 260
Cost Conclusions
Table 8 estimates the cost savings from using in-line slurry monitoring versus grab sampling at GAAT.The GAAT cost savings is conservative since more than one pipeline blockage might have beenavoided. Some grab sampling may still be required for radiological and other analysis. Savings at sitessuch as Hanford are potentially greater as the cost of plant downtime from a pipeline blockage is as greatas $1 million per day.
Table 8. Summary of GAAT cost sav ingsItem Cost
($K)Total cost of grab sampling (baseline) 489Cost of one pipeline blockage (baseline) 260Subtotal for baseline 749Cost of Lasentec M600P analyzer (innovative) 136Cost of Promass 63M meter (innovative) 58Subtotal for innovative 194Total savings (b aseline minus innovative) 555

18
SECTION 6 REGULATORY AND POLICY ISSUES
Regulatory Considerations
There are no specific regulatory considerations with the use of in-line slurry monitoring instruments. Theuse of in-line slurry monitoring instruments will indirectly support DOE requirements and milestones forthe final closure of waste tanks at Hanford, Idaho National Engineering and Environmental Laboratory(INEEL), ORR, and SRS.
Regulatory drivers for remediation of GAAT wastes at the ORR include the following:
• Oak Ridge Federal Facility Agreement and Consent Order between the U.S. EnvironmentalProtection Agency (EPA) Region IV and Tennessee Department of the Environment andConservation
• Tennessee Department of Environment and Conservation Commissioner’s Order for the ORR SiteTreatment Plan
• DOE Order 5820.2A requiring treatment of transuranic waste for disposal at the Waste Isolation PilotPlant
• Comprehensive Environmental Response, Compensation, and Liability Act (CERCLA) of 1980
Secondary wasteThe baseline technology approach will generate wastes from sampling activities and repair of blockedpipelines. These wastes will not be generated using in-line slurry monitoring.
CERCLA EvaluationThis section summarizes how in-line slurry monitoring addresses the nine CERCLA evaluation criteria.
1. Overall Protection of Human Health and the Environment
• In-line slurry monitoring minimizes radiation exposure to workers.• Environmental contamination from repairing pipeline blockages is avoided.
2. Compliance with Applicable or Relevant and Appropriate Requirements (ARARs)
• The system was designed and deployed according to applicable regulatory requirements.
3. Long-Term Effectiveness and Permanence
• This technology can help accelerate tank remediation and closure schedules.
4. Reduction of Toxicity, Mobility, or Volume through Treatment
• The system prevents environmental contamination from repair of blocked pipelines.
5. Short-Term Effectiveness
• Radiation exposure to workers is maintained “as-low-as-reasonably-achievable” (ALARA) becausesampling activities are no longer required or the number is reduced substantially.
6. Implementability
• Slurry monitors are widely used in the private sector in nonradioactive environments.

19
7. Cost data are provided in Section 5.
8. State (Support Agency) Acceptance
• Both the state of Tennessee and EPA are parties of the Federal Facilities Agreement that coversregulatory issues and establishes requirements for management of tanks.
9. Community Acceptance is discussed below.
Safety, Risks, Benefits, and Community Reaction
Worker SafetyThe use of in-line slurry monitoring instruments will reduce worker exposure to unnecessary radiation byeliminating the need for grab sampling prior to and during the pipeline transfers and potentially byavoiding the need for workers to unplug or replace the blocked pipeline or install a new pipeline.
Community SafetyThere are no risks to the community as a result of using the in-line slurry monitoring instruments.
Potential Environmental ImpactsThere are no potential environmental impacts as a result of using the in-line slurry monitoringinstruments.
Potential ExposuresThere are no increased hazardous or radiation exposures using the in-line slurry monitoring instruments.
Liability RisksThere are no liability risks as a result of using the in-line slurry monitoring instruments.
Potential Socioeconomic Impacts and Community P ercept ionsThere are no socioeconomic impacts or negative community perceptions using the in-line slurrymonitoring instruments.
Comparison with Base line or Competing TechnologiesThe in-line slurry monitoring instruments provide increased safety and operational benefits with reducedrisks over the baseline technology of grab sampling. Personnel are not exposed to unnecessary radiationexposure to collect grab samples prior to and during pipeline transfers. The potential for pipelineblockage will be reduced, further minimizing worker exposure to radiation while maintaining project costsand schedule.
20
SECTION 7 LESSONS LEARNED
Implementation Considerations
The technologies are used during the transfer of slurries so that operators can quickly respond to plugs.There is no routine release of contaminants caused by this technology or potential impact fromtransportation of equipment, samples, waste, or other materials associated with this technology.
Having few moving parts and requiring little maintenance within the radioactive environment, slurrymonitoring devices are inherently designed to ALARA conditions. Installation uses existing tank pumppits and piping runs. Radiation exposure must be minimized during installation by wearing protectiveclothing, and actions must be taken to prevent the inadvertent release of tank contents. Engineeringanalyses indicate that slurry monitors can safely be placed on the tanks and pipelines.
Technology Limitations and Needs for Future Development
Required electronics and software may have to be developed for each application. Measurementaccuracy may vary from application to application depending on the operating conditions. For example,ultrasonic instruments may, if gas bubbles are present, drastically overestimate the solids concentration.Acceptable measurements can be made only in the absence of entrained air bubbles.
Technology Selection Considerations
It is critically important for both worker and environmental safety that these radioactive slurries besuccessfully transferred through the pipelines with minimal risk of plugging the pipeline. If a pipelineblockage does occur, there is an increase in worker exposure to radiation while trying to unplug thepipeline. If the pipeline cannot be unplugged, an enormous cost and schedule delay will occur. Testsconducted at the ORNL hot-test facility provide data for selecting instruments for a specific application,including how well an instrument functions in a radioactive environment.
21
APPENDIX A REFERENCES
Hudson, J. D. 1996. Defining waste acceptance criteria for the Hanford replacement cross-site transfer
system. PNNL-11146. Richland, Wash.: Pacific Northwest National Laboratory.
Hylton, T. D., M. S. Anderson, D. C. Van Essen, and C. K. Bayne. 1998. Comparative testing of slurrymonitors. ORNL/TM-13587. Oak Ridge, Tenn.: Oak Ridge National Laboratory.
Hylton, T. D. and C. K. Bayne. 1999. Testing of in-line slurry monitors and Pulsair mixers with radioactiveslurries. ORNL/TM-1999/111. Oak Ridge, Tenn.: Oak Ridge National Laboratory.
Reynolds, B. A., E. A. Daymo, J. G. H. Geeting, and J. Zhang. 1996. Instrument validation project.PNNL-11221. Richland, Wash.: Pacific Northwest National Laboratory.

23
APPENDIX BLIST OF ACRONYMS
ALARA as low as reasonably achievable
ARAR applicable or relevant and appropriate requirements
ASTD Accelerated Site Technology Deployment
CERCLA Comprehensive Environmental Response, Compensation, and Liability Act
DOE U.S. Department of Energy
EPA U.S. Environmental Protection Agency
FBRM focused-beam reflectance measurement
FY fiscal year
GAAT Gunite and Associated Tanks
HP health physicist
MVST Melton Valley Storage Tanks
ORNL Oak Ridge National Laboratory
ORR Oak Ridge Reservation
OST Office of Science and Technology
PPE personal protective equipment
SMTL Slurry Monitoring Test Loop
SRS Savannah River Site
TDI Technology Deployment Initiative
WCS waste conditioning system