comparative study of photocatalytic activity for three
TRANSCRIPT

Comparative study of photocatalytic activity for three type Fe3O4 prepared in
presence of different hydrolysis agent
Rahmatollah Rahimi, Mahboubeh Rabbani*, Ghaffar Kareh
Department of Chemistry, Iran University of Science and Technology, Tehran 16846-
13114, Iran.
*E-mail: [email protected]
Abstract
The aim of this study was to compare morphology, size and photocatalytic activity of
magnetic Fe3O4 nanopowders synthesized by solvothermal method utilizing different
sources of hydrolysis factor (ammonium acetate, urea and dodecyl amine) in various
temperatures. Prepared magnetic nanostructures were characterized by FT-IR and DRS
spectra and SEM images. Influence of different conditions of synthesize on
morphology, size and photocatalytic activity of Fe3O4 nanopowders was investigated.
Keywords: Fe3O4, ammonium acetate, urea, dodecyl amine, photocatalytic activity.
1. Introduction
The powder of Fe3O4 is increasingly important for applications as magnetic material,
catalyst, biomaterial, and so on. Especially in the nanoscale region, the particles of
Fe3O4 often demonstrate unique size-and shape-dependent physical and chemical
properties that are of technological importance and scientific research interest.
Consequently, so far, considerable effort has been devoted to designing novel methods

for the preparation of Fe3O4 nanomaterials with different characteristics and purposes
[1-4].
Among the various developed for synthesizing metal oxide nanomaterials, the
metalorganic molecular precursor route has been regarded as one of the most
convenient and practical techniques, because it not only enables to avoid special
instruments and severe preparation condition, but also provides good control over
purity, homogeneity, composition, phase and microstructure of resultant products [3-
4]. Besides practical applications in industry such as in catalysis, ceramics, energy
storage, magnetic data storage, and ferrofluids [2], Fe3O4 nanoparticles have already
been applied in clinical diagnosis and medicine transporters. Conventionally, Fe3O4
nanoparticles are produced via aqueous or organic solution synthesis.
A hydrothermal reaction of (NH4)2SO4.FeSO4.6H2O in the presence of hydrazine
produces Fe3O4 particles of about 70 nm [5]. Other aqueous solution synthesis methods,
such as co-precipitation of ferrous (Fe+2) and ferric (Fe+3) ions, thermal decomposition
of alkaline solution of (Fe+3) chelate in the presence of hydrazine and sonochemical
decomposition of hydrolyzed Fe(II) salt, have also been developed in the recent years.
However, none of them cold prepare monodispersed nanoparticles with a satisfactory
size distribution [7-12]. An organic solution phase decomposition route has been widely
used in the synthesis of iron oxide nanoparticle. Although the decomposition of
Fe(cup)3, Fe(acac)3, or Fe(CO)5 followed by oxidation can bring to high-quality
monodisperse γ-Fe2O3 nanoparticles [6-8], a relatively higher temperature and a
complicated operation are required.
In this study, we present facile, one-step and magnet-induced solvothermal approach to
obtain Fe3O4 nanoparticles, using ethylene glycol (EG) as reaction solvent and utilizing
different sources of hydrolysis factor (ammonium acetate, urea and dodecyl amine) in
various temperatures. Influence of different conditions of synthesize on morphology,
size and photocatalytic activity of Fe3O4 nanopowders was investigated.
2. Experimental
2.1. Materials
In this study, iron(II) chloride (FeCl2.4H2O), iron(III) chloride (FeCl3.6H2O), ethylene
glycol (EG), ammonium acetate (NH4Ac), dodocyleamine (DDA), sodium hydroxide
(NaOH), citric acid(C6H7O8), urea (CH4N2O) and ethanol were purchased from Merck
Company and used as received without further purification to prepare the samples.
2.2. Preparation of Fe3O4 nanostructures
2.2.1. Preparation of Fe3O4 nanostructures by method 1: Fe3O4-DDA
Solution A was prepared by dissolving 0.541 g of FeCl3.6H2O and 0.371 g of DDA in
20 mL of EG under magnetic stirring at a rate of ca. 750 rpm at 50 oC. Solution B was
prepared by dissolving 0.160 g of NaOH in 10 mL of EG under magnetic stirring at a
rate of ca. 750 rpm at 50 oC. Then the two solutions were mixed together and different
dosages of stirring at a rate of ca. 750 rpm at room temperature, leading to the formation
of a yellow suspension. The resultant solution was loaded into a 50 mL-Teflon lined
stainless steel autoclave, sealed, and heated at 220 oC for a period of time. The black
solid product was obtained by centrifugation, washed with water and ethanol three
times and dried [9].
2.2.2. Preparation of Fe3O4 nanostructures by method 2: Fe3O4-NH4Ac
Synthesis nanocrystals were obtained via a facile solvothermal synthetic route. The
typical preparation procedure of hollow Fe3O4 nanospheres is as follows. FeCl3.6H2O

(2 mmol) and FeCl2.4H2O (1 mmol) were added into ethylene glycol (30 mL) to form
a clear solution. Then a protective agent such as NH4Ac (15 mmol) was added into the
solution to form a mixture under vigorous stirring at room temperature. Subsequently,
the mixture was put into a Teflon lined stainless steel autoclave of 50 mL capacity and
sealed and maintained respectively at 200 °C for 48 h. Finally, the system was allowed
to cool to room temperature naturally. The resulting black precipitate was collected by
filtration and washed with absolute ethanol and distilled water in sequence for several
times. The final product was dried in a vacuum box at 50 °C for 4 h [10].
2.2.3. Preparation of Fe3O4 nanostructures by method 3: Fe3O4-Urea
Ferric chloride hexahydrate (FeCl3·6H2O) (6 g) and urea (10 g) and citric acid (1.6 g)
were loaded into a 100 mL Teflon-lined stainless steel autoclave, which was then filled
with 60 mL absolute EG. Then a square and stainless small magnet was added into the
autoclave, and the autoclave was sealed and maintained at 200 ℃ for 18 h. After cooling
to room temperature naturally, the black products were filtered off, washed with
distilled water and absolute ethanol for several times and dried in vacuum at 50 ℃ for
12 h [11].
2.3. Characterization of products
The particle morphologies of the prepared Fe3O4 were observed by an Tescan (model
Vega II) scanning electron microscopy (SEM). The FT-IR analyses were carried out on
a Shimadzu FTIR-8400S spectrophotometer using a KBr pellet for sample preparation.
DRS spectra were prepared via a Shimadzu (MPC-2200) spectrophotometer.
Furthermore, the structure of particles was analyzed by powder X-ray diffractometer
(XRD, Bruker AXS D8 advance).

24. Photocatalytic experiments
Photocatalytic activity studies of the prepared Fe3O4 nanostructures were evaluated by
the degradation MB solutions. In a typical process, the catalytic reaction was carried
out in a 100 mL photoreactor, which contain 10 mL of MB dye (10 mg/L) solution and
0.01 g of catalyst. Before the irradiation, the solution was magnetically stirred in the
dark (15 min) to allow equilibrium of the system. Irradiation was carried out using 7 W
LED lamps as the light sources. All photocatalytic experiments were carried out at the
same conditions. The distance between photoreactor and light sources was 10 cm.
Samples (3 mL) were collected during the irradiation and MB solution were separated
from the photocatalyst by centrifugation. The degradation was monitored by measuring
the absorbance amount using a double beam UV–Vis spectrophotometer (Shimadzu
UV-1700) at 664 nm wavelengths.
3. Results and discussion
3.1. X-ray diffraction
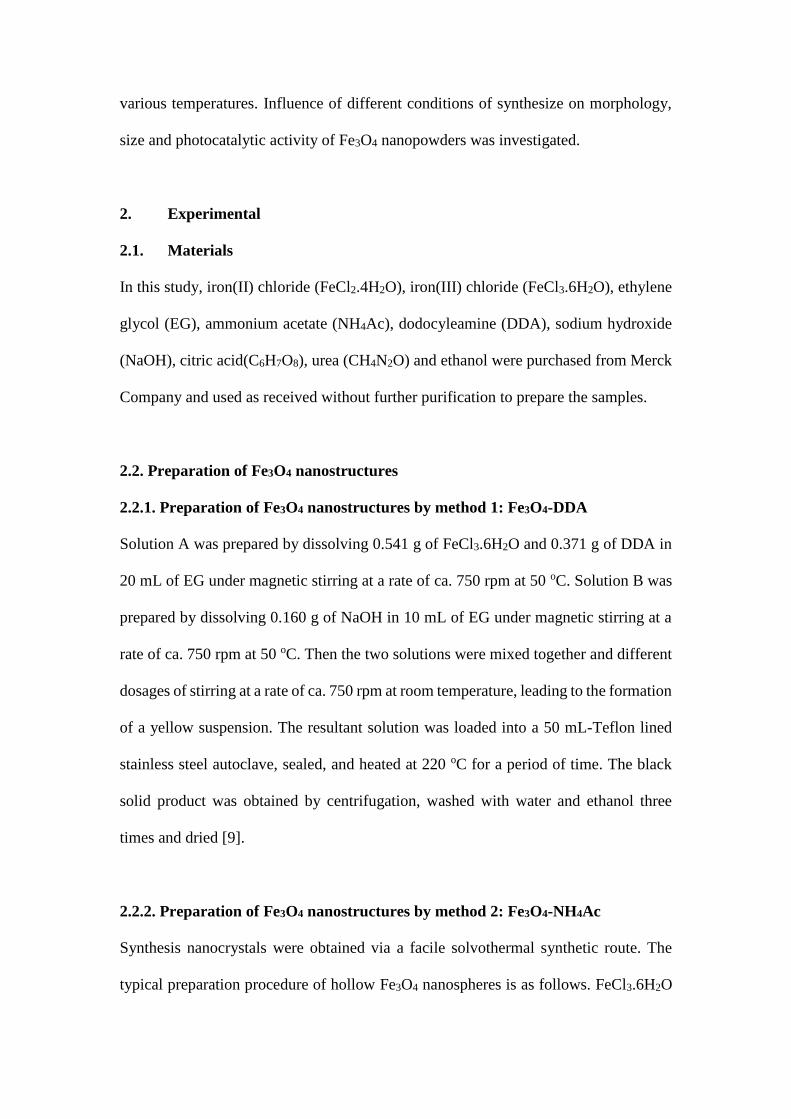
Fig. 1 shows the XRD pattern of Fe3O4 nanostructures. The position of all diffraction
peaks match well with those of Fe3O4 peaks at 2θ=29.86˚, 35.21˚, 56.68˚, 62.25˚. The
lattice system of Fe3O4 is cubic, which is in good agreement with standard card JCPDS
01-088-0315.
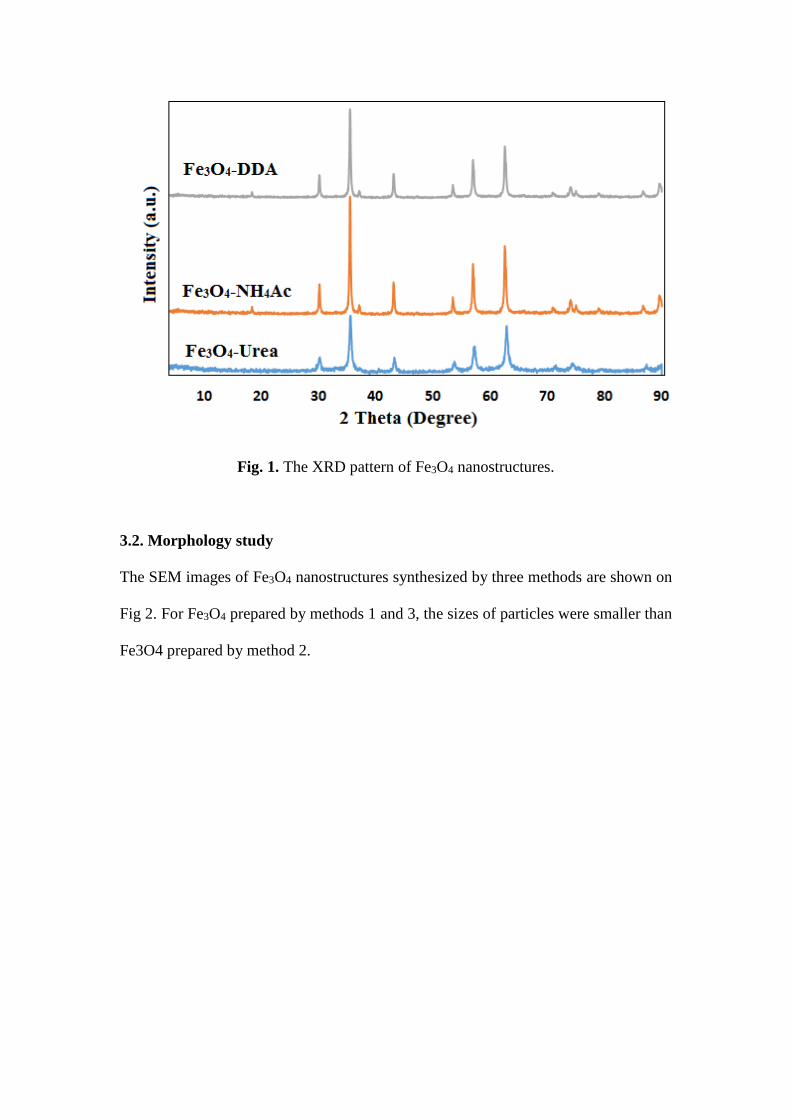
Fig. 1. The XRD pattern of Fe3O4 nanostructures.
3.2. Morphology study
The SEM images of Fe3O4 nanostructures synthesized by three methods are shown on
Fig 2. For Fe3O4 prepared by methods 1 and 3, the sizes of particles were smaller than
Fe3O4 prepared by method 2.
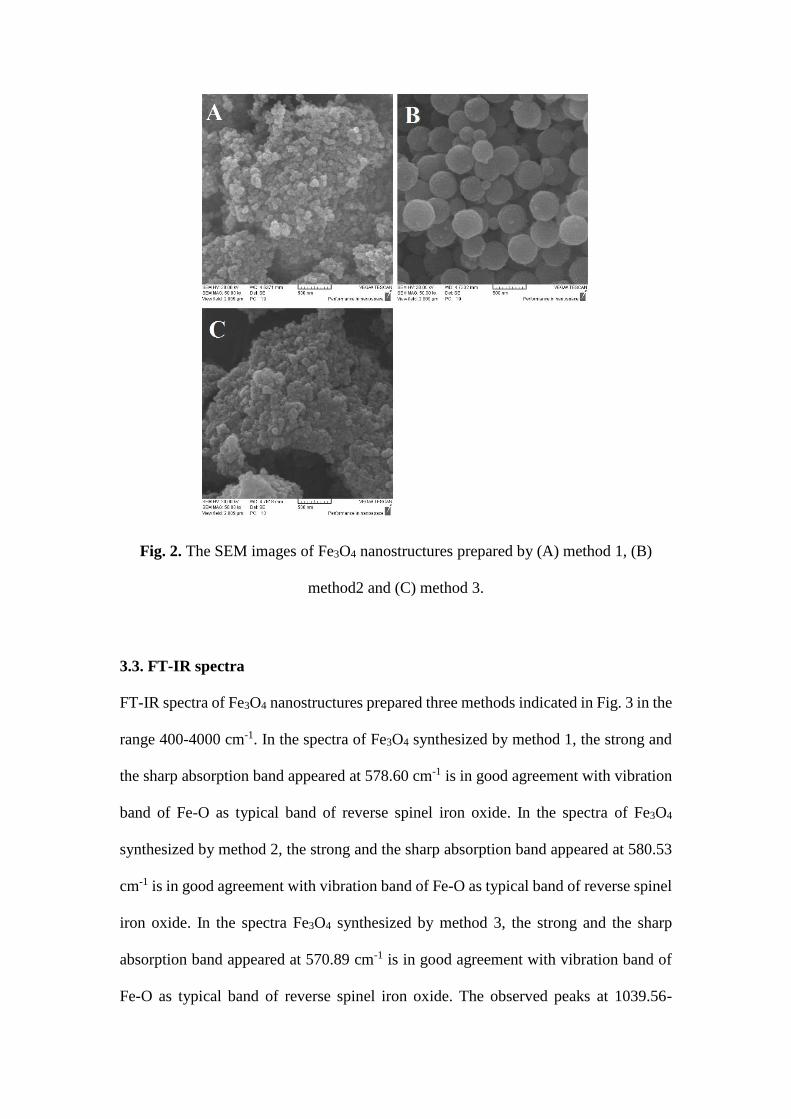
Fig. 2. The SEM images of Fe3O4 nanostructures prepared by (A) method 1, (B)
method2 and (C) method 3.
3.3. FT-IR spectra
FT-IR spectra of Fe3O4 nanostructures prepared three methods indicated in Fig. 3 in the
range 400-4000 cm-1. In the spectra of Fe3O4 synthesized by method 1, the strong and
the sharp absorption band appeared at 578.60 cm-1 is in good agreement with vibration
band of Fe-O as typical band of reverse spinel iron oxide. In the spectra of Fe3O4
synthesized by method 2, the strong and the sharp absorption band appeared at 580.53
cm-1 is in good agreement with vibration band of Fe-O as typical band of reverse spinel
iron oxide. In the spectra Fe3O4 synthesized by method 3, the strong and the sharp
absorption band appeared at 570.89 cm-1 is in good agreement with vibration band of
Fe-O as typical band of reverse spinel iron oxide. The observed peaks at 1039.56-

1081.99 cm-1 that related to C-O bonding on citric acid, the peaks 1278.72 and 1344.29
cm-1 to attributed to the stretching bond of C=O the carboxylic acid. On the other hand,
the peaks at 1454.23-1650.95 cm-1 attributed to the symmetric and asymmetric
stretching COO-. The appearance of N-C-N stretching modes of the urea functionality
in the (1454.23 cm-1. The peaks in the range 3298.05-3444.63 cm-1 to attributed to the
symmetric and asymmetric stretching of N-H on urea. The peaks at 2883.38-2864.09
cm-1 that related to C-H bonding on citric acid. One of absorption at 3164.97 cm-1
associated to O-H acidic vibration. These peaks showed that citric acid and urea have
not been completely removed from Fe3O4 nanostructures synthesized by method 3.
Fig. 3. FT-IR spectra of Fe3O4 nanostructures.
3.4. DRS-UV-Vis Spectra
The UV-Vis technique provides information including diffuse-reflectance spectra
(DRS) and the band-gap energy (Eg). UV-Vis absorption spectrum of three Fe3O4

nanostructures is shown in Fig. 4, represents the broad absorption bands in both UV
and visible regions (200–800 nm). Typically, two broad peaks were observed at about
380–400 nm on the UV absorption edge and 700 nm on the visible region which can be
assigned to absorbance for Fe3+ and Fe2+ presence in prepared compound. The band-
gap energy (Eg) according maxima band of absorption spectrum was evaluated by the
Tauc equation as follows [39]:
(αhν)n = B(hν − Eg) (2)
where hν is the photon energy, α is the absorption coefficient, B is a constant value and
Eg represents the band-gap energy. The value of n is assigned to transition which takes
different values for allowed and forbidden, direct and indirect transitions [40]. By
plotting of the (αhν)n vs. hν in eV with n = 2 for direct transitions, and then, by obtaining
the extrapolation point of this curve, the band-gap energy of the products were
estimated about 1.6 - 1.7 eV. These results reveal that the prepared sample can play a
suitable role as a photocatalyst under light irradiation.. It is known that the
photocatalytic activity is based on the generation of electron/hole pairs by means of
band-gap radiation, which can lead to redox reactions with adsorbed species on the
catalyst surface. The presence of holes on the surface of particles increases the surface
area and so active sites. Thus these results provide large amounts of the electron/hole
pairs under UV and visible irradiation and so they present a good photocatalytic
performance of the as-synthesized Fe3O4 nanostructures.

Fig. 4. UV-Vis absorption spectrum of three Fe3O4 nanostructures.
3.5. Photocatalytic degradation of MB
The photocatalytic activity of Fe3O4 nanostructures photocatalysts under visible LED
light irradiation was defined by measuring the photodegradation of MB aqueous
solutions. Methylene blue is a cationic dye with a methyl nitride group [(CH3)2N+].
The photocatalytic activity of as-synthesised Fe3O4 nanostructures synthesized by
different methods were tested Fig. 5 exhibits the photodegradation of MB in presence
of Fe3O4 nanostructures synthesized by different methods under visible light
irradiation. It was demonstrated that the photocatalyst prepared by method 3 (Fe3O4-
Urea) has the highest photocatalytic activity.
Fig. 5. The photodegradation of MB at 25 ◦C using Fe3O4 nanostructures (0.02 g catalyst, 20
mL MB, 20 mg/L, 180 min).
The adsorption of MB using Fe3O4 nanostructures have been demonstrated in Fig. 6 in
dark after 3 h. The dark condition was tested to investigation of adsorbing properties of
catalysts. The results show that removal efficiency of MB in presence of Fe3O4
nanostructures prepared by method 2 (Fe3O4-NH4Ac) have the highest adsorption
activity. Because the morphology of Fe3O4-NH4Ac was nanohollow sphere and
therefore can remove MB from solution by adsorption.

Fig. 6. The adsorption of MB at 25 ◦C using Fe3O4 nanostructures (0.02 g catalyst, 20 mL
MB, 20 mg/L, 180 min).
4. Conclusions
Fe3O4 nanostructures were successfully synthesized through solvothermal approach by
different hydrolysis factor in three methods. The results obtained from the
photodegradation of methylene blue under LED light show that the Fe3O4
nanostructures prepared using urea and citric acid exhibits a higher photocatalytic
activity than the Fe3O4 nanostructures synthesized using NH4Ac or dodecyl amine as
hydrolysis factors.
References
[1] XiaoWua, Jingyuan Tangb, Yongcai Zhangb, HaoWanga. Materials Science and
Engineering B 157 (2009) 81–86.

[2] Gang Xu, Min Zhang, Ping Ou, Yi Zhang, Gaorong Han. Advanced Materials
Research Vols. 634-638 (2013) pp 2276-2279.
[3] S. Sun, H. Zeng, D.B. Robinson, et al., J. Am. Chem. Soc. 126 (2004) 273–279.
[4] N. Pinna, S. Grancharov, P. Beato, et al., Chem. Mater. 17 (2005) 3044–3049.
[5] Y.D. Li, H.W. Liao, Y.T. Qian, Mater. Res. Bull. Vol. 33, p. 841–4.
[6] J. Rockenberger, E.C. Scher, P.A. Alivisatos, J. Am.Chem. Soc. Vol. 121, p. 11595–
6.
[7] R.S. Sapieszko, E. Matijevic, J. Colloid Interface Sci. Vol. 74 , p. 405–22.
[8] S.H. Sun, H. Zeng, J. Am. Chem. Soc.Vol. 124 (2002), p. 8204–5
[9] Shao-Wen Cao, Ying-Jie Zhu and Jiang ChangNew Journal of Chemistry. 17th
December 2007. Fe3O4 polyhedral nanoparticles with a high magnetization
synthesized in mixed solvent ethylene glycol–water system.
[10] Aiguo Yan, Xiao he Li, Ran Yi, Rongrong Shi, Ning Zhang, and Guanzhou Qiu.
J. Phys. Chem. C 2008, 112, 8558–8563.
[11] Maosheng FU, Yu. XZ & Xueming ZHONG.
Volumes/Vol15Issue2/IJRRAS_15_2_03.pdf.
[12] Shen Wu , Aizhi Sun , Fuqiang Zhai , Jin Wang , Wenhuan Xu , Qian Zhang , Alex
A. Volinsky . Materials Letters 65 (2011) 1882–1884.