comparative study of different wavelet transforms in fusion of
TRANSCRIPT
International Journal of Computer Applications (0975 – 8887)
Volume 146 – No.11, July 2016
18
Comparative Study of Different Wavelet Transforms in
Fusion of Multimodal Medical Images
R. E. Masumdar Intern at Maven Silicon
Softech Pvt Ltd, #633, Govinda Reddy Layout,
Arekere Main Road, Bangalore
R. G. Karandikar Dept of Electronics & Telecommunication,
KJ Somaiya College of Engineering, Vidyavihar, Mumbai-400077
ABSTRACT
This paper presents a comparative study of image fusion of
MRI and CT images using various wavelet transforms. The
fusion of the images is done by implementing a multi-
resolution decomposition method with the help of various
wavelets. Entropy, PSNR and MSE are the parameters that are
used as performance metrics of the fusion done using various
wavelets. The MRI and CT images are then fused using the
select maximum fusion rule, since studies have shown that
select maximum rule provides the best result. The final fused
image is examined using the various performance metrics to
evaluate which wavelet gives the best result.
Keywords Computed Tomography, Magnetic Resonance Imaging,
Wavelet Transform, Haar Transform, Daubechies Transform,
Symlet Transform, Image Fusion Vanishing Moments,
Multiresolution Decomposition, Image Fusion, Quadrature
Mirror Filter, Order, Filter Banks, Mean Squarred Error, Peak
Signal to Noise Ratio, Entropy
1. INTRODUCTION In Modern medicine, a number of medical imaging
technologies have been developed, each with their own
advantages and disadvantages. These techniques are used to
acquire information about an affected area, usually in pairs of
two different images having complementary properties. These
images which when viewed simultaneously by doing fusion
can present us with a good diagnosis rather than viewing them
separately. CT imaging provides the information about
brain/skeletal injuries. While MRI provides details of soft
tissue and anatomic structures of gray and white matter
present in brain. Both these modalities cannot carry all the
complimentary and relevant information in single image. But
fused image of these two provides us the entire information
in a single image, facilitating more precise diagnosis and a
more accurate treatment.
In any classical Image Fusion task, an image undergoes
Image Registration and fusion of relevant features from
source images. Registration of image deals with the
corrections to be made in spatial misalignments while feature
extraction mainly concerns with identification and selection of
features with a focus on relevance of features for a given
clinical condition which is of three categories namely Pixel
level fusion[1], Feature level fusion[1], Decision level
fusion[1].
Image Fusion further takes an approach into two different
ways, known commonly as Spatial domain and Transform
Domain [2]. Spatial Domain method deals directly with the
pixels of an image. The pixels of source images undergo
manipulations in them to produce a final fused image. Some
of the methods that fall into the spatial domain fusion category
are Brovey Transform[3], PCA - Principal Component
Analysis[4], Intensity Hue Transformation[5] and many more
to name.
The spatial distorsion in an image being the downside of
spatial domain, which makes transform domain fusion
methods more advantageous..Out of the two types of
transform domain methods the wavelet transform method is
chosen more over pyramid transform due to its property of
blocking effect in fused image[6].
Pyramid and Wavelet Transforms are two of the few
commonly used transform domain methods used for image
fusion. Pyramid transform methods are further categorized
into Laplacian transform, Gradient transform, etc. Similarly
there are numerous different methods that fall under the
wavelet transform category, but it is wavelet transform that is
chosen more over pyramid transform, the reason being the
blocking effect pyramid transform methods induce in fused
images. A more detailed explanation of blocking effect can be
seen in reference [6].
Features of an image are characterized by a different physical
structure at a different resolution. Images with larger
structures correspond to details which comfortably provide
image context by simply having a glimpse, while images with
finer resolution gives a detail visual information about small
objects. From Medical Imaging point of view, multimodal
images generally emphasize different anatomical structures in
either a poor or a good spatial resolution, but usually appear in
complimentary image form. Thus, analyzing images at
different resolution becomes a mandatory condition. While,
analyzing these images though, the interpretation of the scene
should be invariant with the modifications in the scale. Hence,
multiresolution decomposition[6]. Besides these primary
advantages the most important and distinguishing character of
multiresolution decomposition is that it provides information
on the magnitude of rapid contrast changes in an image. Since,
human eyes are sensitive to local changes in contrast, it serves
to act as information provision scheme for an observer[7].
Wavelet transform and pyramid transforms both can be used
for fusion of images by implementing multiresolution
decomposition algorithm. From among the existing algorithms
use of DWT (Discrete Wavelet Transform) is more generic
and finds application in many other image processing
practices. A reason for its common use is its merit of
preserving different frequency information in stable form and
allowing good localization both in time and spatial frequency
domain.
Although DWT finds a common application in medical image
fusion, the extent to which the various wavelets bases can
serve in fusion of images efficiently is still a hot topic for
International Journal of Computer Applications (0975 – 8887)
Volume 146 – No.11, July 2016
19
research. This paper draws a comparative study of different
wavelet bases and their effectiveness in medical image fusion
applications using the transform like Symlet, Daubechies, and
Haar in fusion of medical images. The quality of performance
of fusion is compared with the help of measures like PSNR,
MSE and Entropy. Rest of the paper will give an insight into
different wavelet bases. A brief discussion of image fusion
method based on multi-resolution decomposition will be
done. Conclusively presenting the comparative results
presented in a tabular form followed by conclusion and
appropriate references.
2. DISCRETE WAVELET TRANSFORM Wavelet Transform can be viewed as a function that is used to
represent another function onto which the operations of
scaling and dilation are performed. Wavelet Transform can be
expressed as an integral product of a signal to be analyzed
with a scaled and dilated version of another signal (commonly
referred to as wavelet function)
𝑊𝑇 = 𝑎−12 𝑥 𝑡 𝜓∗
𝑡 − 𝜏
𝑎 (1)
The other signal is named as Wavelet function. A general
expression for Wavelet function can be given as follows:
𝜓 𝑎 ,𝑏 (𝑡) = 𝑎 −1
2𝜓∗((𝑡 − 𝑏)/𝑎) (2)
Mother wavelet can be thought of as a function responsible for
representation by superposition of its various scaled and
dilated versions of any arbitrary signal. It also possess a
peculiar property that allows us to reconstruct the original
signal which has undergone multiresolution wavelet
decomposition. Wavelet transform of any function f(x)
𝐿2(𝑅) is stably invertible provided that the mother wavelet
also is an element of 𝐿2(𝑅). These wavelet functions were
first introduced by Grossman and Morlet [8]. But, the property
that the scaling and dilations of them can be used as expansion
of functions 𝜖 𝐿2(𝑅) was first brought to notice by Meyer [9].
Meyer said that the dilated and scaled versions of the mother
wavelet forms an orthonormal basis for all the square
integrable functions.
As was described earlier (in the introduction) the details of an
image at any resolution can be better obtained by taking the
difference between the approximations of two successive
resolutions. Thus, to decompose an image into multiple
resolutions wavelets are used[10]. The decomposition of an
image is generally done in steps of two. Thus, the same
applies for the variables of scaling and dilation in a wavelet
function, resulting in expression of a term coined as a
daughter function.
𝜓 𝑥 = 2𝑗𝜓 2𝑗𝑥 − 𝑘 3
here a = 2j and b = k2j
A signal can be considered as a vector space given by V2j | V2
j
L2(R). The approximations of an image at resolution 2𝑗 can
be obtained by operating an orthogonal projection onto the
vector space. Later, to avoid the inconveniency caused by the
discontinuity and the absence of smoothness in the function of
the vector space a unique function called as scaling function
[11] was introduced. The dilation and scaling of which makes
them orthonormal basis of the vector space 𝑉2𝑗 . In the very
similar manner, a wavelet function forms an orthonormal
basis for a vector space 𝑂2𝑗 which is orthogonal to the vector
space 𝑉2𝑗 . This manner of calculating coefficients makes the
multiresolution representation an efficient pyramidal
algorithm. A rather generalized set of expressions for the
scaling and wavelet coefficients was given by S. G.
Mallat[10] as follows:
𝐷𝑚 ,𝑛 = 𝑔2𝑛−𝑘 𝐴𝑚+1,𝑘 (4)
𝐴𝑚 ,𝑛 = ℎ2𝑛−𝑘 𝐴𝑚+1,𝑛 (5)
In the above manner coarser approximations as well as detail
approximations can be estimated recursively by filtering
followed by down-sampling operation (by a scale of two).
Finite length FIR filters can be used for decomposition sake.
These filters are entirely capable to decompose the original
signal/image. But, they simultaneously exhibit a drawback of
generating a non-linear phase, when used for reconstruction of
the image/signal reason being their anti-symmetric nature. To
overcome this limitation, Mallat gave a relation between the
filters, referred to as Quadrature Mirror Filters[10]. The
relationship between their coefficients can be given as:
𝑔 𝑛 = (−1)1−𝑛ℎ 1 − 𝑛 (6)
In many a cases, it becomes a task to choose a wavelet and
scaling functions such that they meet the condition of
mirrored impulse response filters, while simultaneously
abiding the notion of orthogonality. Thus, for such cases, a
group of wavelets known as Bi-orthogonal wavelets are used
[11].
The above derivation works well in accord with 1-D signals,
but it also serves well when used as an extension for 2-D
signals or images. When it comes to image signals though a
vector space 𝑉2𝑗 | 𝑉2𝑗 L2(R2) can be considered to be a
tensor product of vector subspaces each belonging to L2(R)
[10].
𝑉2𝑗 = 𝑉2𝑗1 ⨂ 𝑉
2𝑗1 (7)
A necessary condition though for 𝑉2𝑗 to be a multi-resolution
approximations of L2(R2) is that the vector subspaces 𝑉2𝑗1
are
multiresolution approximations of L2(R). Depending on the
above statement, wavelet and scaling functions for 2-D can be
given as follows[11].
𝜙 𝑚, 𝑛 = 𝜙 𝑚 𝜙 𝑛 8
𝜓1 𝑚, 𝑛 = 𝜙 𝑚 𝜓 𝑛 (9)
𝜓2 𝑚, 𝑛 = 𝜓 𝑚 𝜙 𝑛 (10)
𝜓3 𝑚, 𝑛 = 𝜓 𝑚 𝜓 𝑛 (11)
In a very similar fashion as that of 1-D wavelet analysis, the
2-D wavelet analysis too consist of filtering followed by
down-sampling. This is illustrated in figure. no. 1.
A typical J-level decomposition of an image follows a
filtering along the rows to separate the lower frequencies and
the higher frequencies , the impulse response of the filters of
which are dependent on wavelet and scaling coefficients
following a orthogonality condition.

International Journal of Computer Applications (0975 – 8887)
Volume 146 – No.11, July 2016
20
Fig 1: A single level Image Decomposition process. A low
pass and high pass filtering followed by down sampling
along rows and then columns.
Later filtering and down-sampling of the filtered Low and
High bands along the row are followed by one along the
columns giving rise to an approximation LL band, vertical
details given by LH band, HL band for horizontal details. If
again, one chooses to decompose an image by an additional
level-J, the approximations obtained in LL band are
decomposed to form four frequency bands. This further
proceeds in a similar fashion, seperating the approximations
and different detail signals.
As the main agenda of this paper is to present a comparative
study of different wavelet bases that can be used for fusion of
medical images, an attempt has been made to draw a
qualitative comparison of fusion using Symlet, Daubechies
and Haar wavelets. The next section gives a brief description
of these wavelets.
2.1 Haar Wavelet The Haar Functions are known since a hungarian
mathematician named Alfred Haar [12] first discovered them.
Since then a lot of modifications and changes have been made
in the definition and generalizations [13][14][15][16]. It
serves in many of the image processing applications. It has
been used in coding of an image, feature extraction and many
more promising techniques.
Fig 2: Haar Functions. Scaling Function on the left and
Wavelet function on the right.
Haar can be defined as an orthogonal system that takes values
generally from the set of {0, 2𝑗 : 𝑗 ∈ 𝑁}, with its domain
generalized as 𝐿𝑝 0,1 , 𝑝 ∈ [0, ∞]. The graphical
representation of the Haar functions is as shown in following
figure. no. 2.
2.2 Daubechies Wavelet These wavelets were first introduced by Ingrid Daubechies.
The definition of Daubechies wavelet transform resemble that
of Haar wavelet transform definition, the only manner in
which they differ is the dissimilarity of definitions of the their
scaling and wavelet signals.
Fig 3: Daubechies wavelets with different orders.
These wavelet types also has balanced frequency response but
exude non-linearity. A massive improvement can be seen in
the results when Daubechies wavelet transforms are used,
since the scaling and wavelet signals have relatively longer
support. As compared to scaling and wavelet signals of Haar,
the signals corresponding to Daubechies wavelet transform
produce approximations and differences using a few more
values[9].
2.3 Symlet Wavelet
Fig 4: Symlet Scaling Function
Symlet Wavelets are very much similar to the Daubechies
wavelets except the only difference being the vanishing
moments of the wavelets function. Thus the wavelet
coefficients differ than that of the daubechies'.
Fig 5: Symlet Scaling Function
International Journal of Computer Applications (0975 – 8887)
Volume 146 – No.11, July 2016
21
3. IMAGE FUSION SCHEME It is necessary that the two images that are supposed to
undergo the fusion are first registered. The registration of the
images render the pixels of each image aligned, making it
efficient to carry out the coefficient merging process. This is
followed by wavelet transform calculation, giving rise to
different frequency bands as described earlier. Each pixel in
each of the frequency band correspond to pixel of the original
image. The decomposition of an image into different
frequency provides us with an option of having to choose
from among four different bands corresponding to
distinguishing features of an image. While the LL band
provides with coarse features of an image, the LH, HL and
HH band give a detail blueprint of vertical, horizontal and
diagonal changes in intensity of pixels. The two images to be
fused can be at different decomposition levels while being
fused but it is uncompromisingly necessary to have the images
at the same resolution level.
The image fusion scheme is a method that addresses the issue
of representation of fusion of images. For any image the
activity level reflects the local energy in the space spanned by
the term in the expansion corresponding to a particular
coefficient. Based on these assumptions there are three
different methods categorized for computing activity level,
better known as coefficient-based, region-based, and window-
based. Depending on the application to be served, the choice
is made from among the above three methods of activity
measurement[17]. The representation of an multi-scale
decomposition coefficient can be well generalized as has been
done in ref [17]. The multi-scale decomposition representation
of an image is denoted as 𝐷𝐼 while the activity level is
represented by 𝐴𝐼. For the images M and N the fused image
be L, then multi-scale decomposition representations can be
given as 𝐷𝑚 , 𝐷𝑛 and 𝐷𝑙 and the activity level measures can be
denoted by 𝐴𝑚 and 𝐴𝑛 . An expression for the measure of
index of an multi-scale decomposition coefficient is given as
𝑞 = (𝑣, 𝑥, 𝑦, 𝑧), where 𝑣 and x in particular designate the
spatial position in a given frequency band of an image, while
𝑘 being the decomposition level and 𝑙 the frequency band of
the decomposed images
Prior to choosing the selection scheme it is requisite to apply a
grouping scheme[17] followed by a combining method to the
multi-scale decomposition coefficients. Each coefficient has a
set of corresponding coefficients in other frequency bands and
decomposition level. Grouping schemes generally are
discretized in three different categories, a no-grouping
scheme, single-scale grouping and a multi-scale grouping
scheme[17]. The preference of one over the other is a matter
of the correspondence of the multi-scale decomposition
coefficients with those of other frequency and decomposition
levels. In case if the correspondence between multi-scale
decomposition coefficients is ignored then such case becomes
a no-grouping scheme case[17]. If the coefficients in
decomposition levels are restricted to take same decision, then
this is known as single-scale grouping[17]. While, if the
coefficients of different levels or bands are given the liberty to
take different decision then such a case becomes of multi-
scale grouping[17]. This paper encompasses the no-grouping
scheme. Combining the source multi-scale decomposition
coefficients to form a composite multi-scale decomposition
representation, is done by using maximum selection rule. This
selective scheme primarily invokes the most salient image
features from among the source images. The justification for
choosing selective scheme over averaging is the possible issue
of pattern cancellation due to opposite contrast which remains
unresolved despite the stabilized fused images.
In this paper, choose maximum scheme has been adopted. It
implies that the coefficients with larger activity level has been
picked up while discarding the other. It’s a general practice to
choose maximum only from the approximations that we
obtain after decomposition. Conversely, in this paper, all the
details along with the approximations are taken into
consideration, i.e. select maximum rule is applied to all the
decomposed bands and then the synthesis is done. The
mathematical formula for an image 𝐿 can be described as
𝐷𝑙(𝑞) = 𝐷𝑖(𝑞), where 𝑖 = 𝑀 𝑜𝑟 𝑁 , depending on whichever
source image satisfies the condition. If the coefficients of the
decomposed band of either of image is equal, then weighted
average of them is computed and is taken up by the fused
image
𝐴𝑖 𝑞 = max(𝐴𝑚 𝑞 , 𝐴𝑛(𝑞)) (12)
𝐴𝑖 𝑞 = (𝐴𝑚 𝑞 +𝐴𝑛 𝑞 )
2 (13)
A common procedure that follows the selection rule is
consistency verification. It tries to take advantage of the
possibility of computation of neighboring coefficients while
calculating the composite multi-scale decomposition
coefficient. As described earlier, maximum values of the
activity measures are taken, signifying the presence of the
dominant feature in the local area. Further, so as to record the
selection results, a binary decision map of the size as that of
the wavelet transform is generated. One possible scenario that
might occur is that for an image, the dominant feature might
be evident only in the center pixel, while for another image
salient features might be from the pixels in the surrounding
region of the center region of that window, in such cases the
binary decision map is subjected to consistency
verification[18]. Wherein, the binary decision map is filtered
using a majority filter followed by negation and repeating the
procedure once more. This selection scheme helps ensure that
most of the salient features are subsumed into the fused
image.
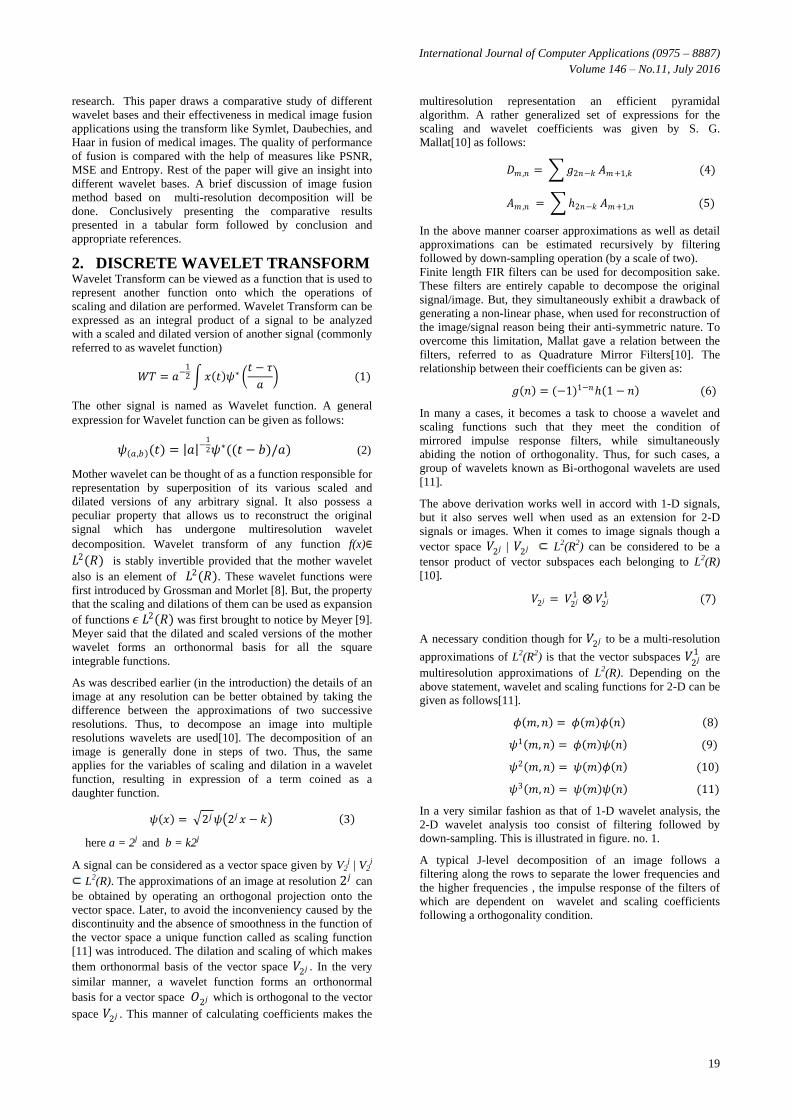
After having carried out the consistency verification step[18],
the fused bands are then subjected to the process of synthesis
as illustrated in the figure. 5. The fused approximations and
the details along the vertical, horizontal and diagonal stretch
are filtered along the columns and then along the rows along
with up sampling, to obtain a final fused image.
Fig 7: Synthesis process of an image
International Journal of Computer Applications (0975 – 8887)
Volume 146 – No.11, July 2016
22
4. FUSION PERFORMANCE
EVALUATION The concept of evaluation of fusion is more of a subjective
criteria rather than objective. Since for objective evaluation it
requires to have a solid ground truth documented that matches
the application scenarios that fusion is meant to serve. The
human perception probably has been by far the most
commonly used criteria for subjective evaluation of image
fusion. In recent years though, a number of methods have
been proposed for the objective evaluation. MSE, Entropy, MI
and PSNR are a few that have established a firm ground as
common evaluation measures. Many more methods have been
proposed, but none of them seem to have the advantages as
that of the measures like PSNR and RMSE has to
offer[18][19][20]. Although the human perception as a
subjective measure is unparalleled by any of the objective
methods, it is not something that has any scientific
justification involved in it. Thus to have a scientific backing to
the method the choice of objective evaluation is opted. This
paper incorporates Entropy, PSNR and MSE as the objective
criterion of evaluation of images.
4.1 Entropy This measure is used to evaluate and describe the amount of
information of the source images retained in the fused image.
Each source image is referred to as a discrete random variable.
Thus, the entropy of the image is given as follows.
𝐻 𝑋 = − 𝑝 𝑥 𝑙𝑜𝑔𝑝 𝑥 (13)
𝑥
In this paper, entropy of the fused images are calculated. With
the help of this evaluation, the information content in the
fused image can be known.
4.2 MSE(Mean Squared Error) One of the most widely used and one of the simplest among
the known quality metric is MSE. Apart from being simple in
calculation it offers consistency in terms of optimization of
mathematical calculation. The goal of this image fidelity
measure is to compare two images by providing a quantitative
score that describes the degree of similarity or conversely
and/or the level of inconsistency between them. For the case
of image fusion, MSE can be described as the sum of the
mean squared error terms relative to both the source images.
As the name itself implies, it is the mean over the total pixel
number of the squared difference in the fused image pixel
values and the source image pixel values. Though it has
gained its popularity because of the advantage it offers, it
lacks the ability to assess the image difference or better way to
state it would be the similarity across different noise additions
that are conducive hazards in fusion.
In this paper, the expression has been modified to meet the
necessary conditions but only within the limits of its
definition.
𝑀𝑆𝐸 = (𝐹 𝑖, 𝑗 − 𝐴(𝑖, 𝑗))2𝑁
𝑗 =1𝑀𝑖=1
𝑀 × 𝑁
+ (𝐹 𝑖, 𝑗 − 𝐵(𝑖, 𝑗))2𝑁
𝑗 =1𝑀𝑖=1
𝑀 × 𝑁 (14)
4.3 PSNR PSNR is another image fusion quality measure that has been
used in this paper. It involves direct use of the MSE value
calculated, but offers a dissimilar informative details about the
image fusion method, more specifically for this paper,
provides information about the best wavelet basis for fusion
purposes.
𝑃𝑆𝑁𝑅 = 10 log10( 255𝑀𝑆𝐸 ) (15)
5. EXPERIMENTAL VALIDATION The simulation of the whole process has been carried out on
MATLAB. A Graphical User Interface has been constructed
that invokes two images to be fused and gives a fused image
as a result, along with a drop down menu to choose the
different wavelet basis with which the images then undergo
the whole fusion process. The results obtained from the
simulation are published in this section. The images used are
of 256x256 resolution. These images are grey scale images
obtained from the MRI and CT scan of different clinical
conditions of brain.
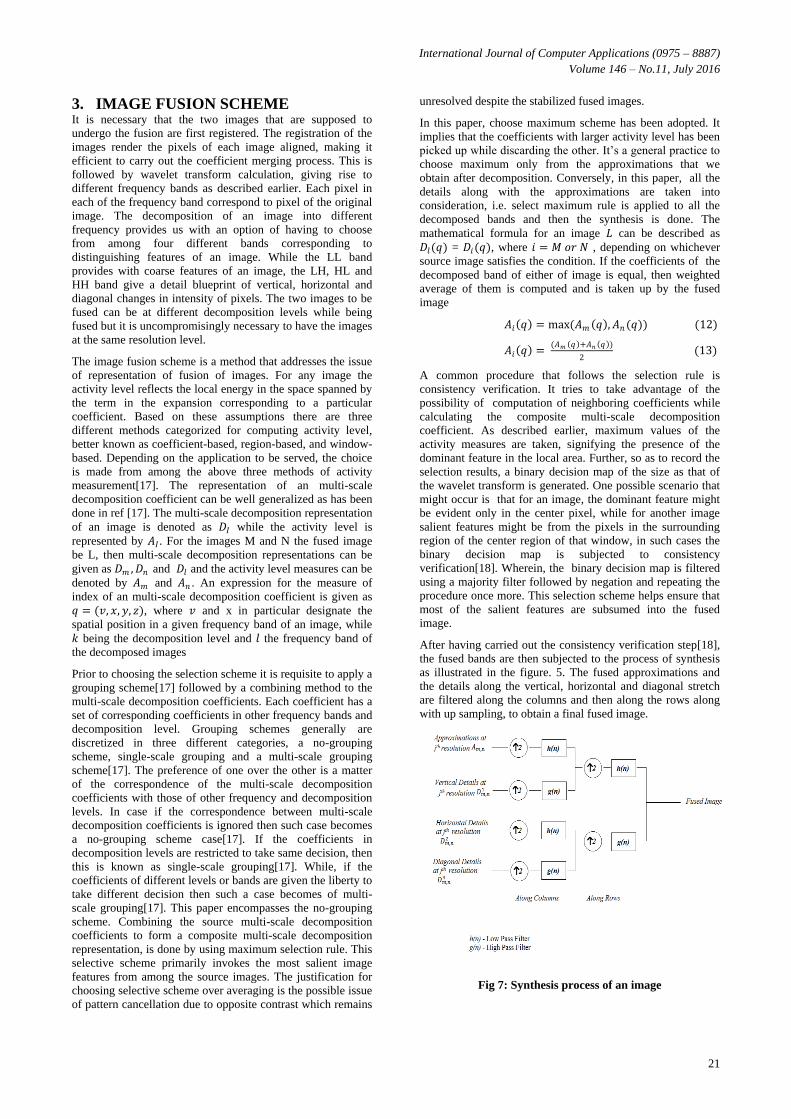
The following all figures belong to a particular clinical
condition. The results discussed in table no. 1 are all taken in
reference to images in the figure no. 8 which are MRI and CT
scan images of the brain having a particular condition.
(a) (b)
Fig 8: (a) MRI Image (b) CT Scan Image
The above two images are the source images obtained from
MRI and CT scan of a certain clinical condition of brain.
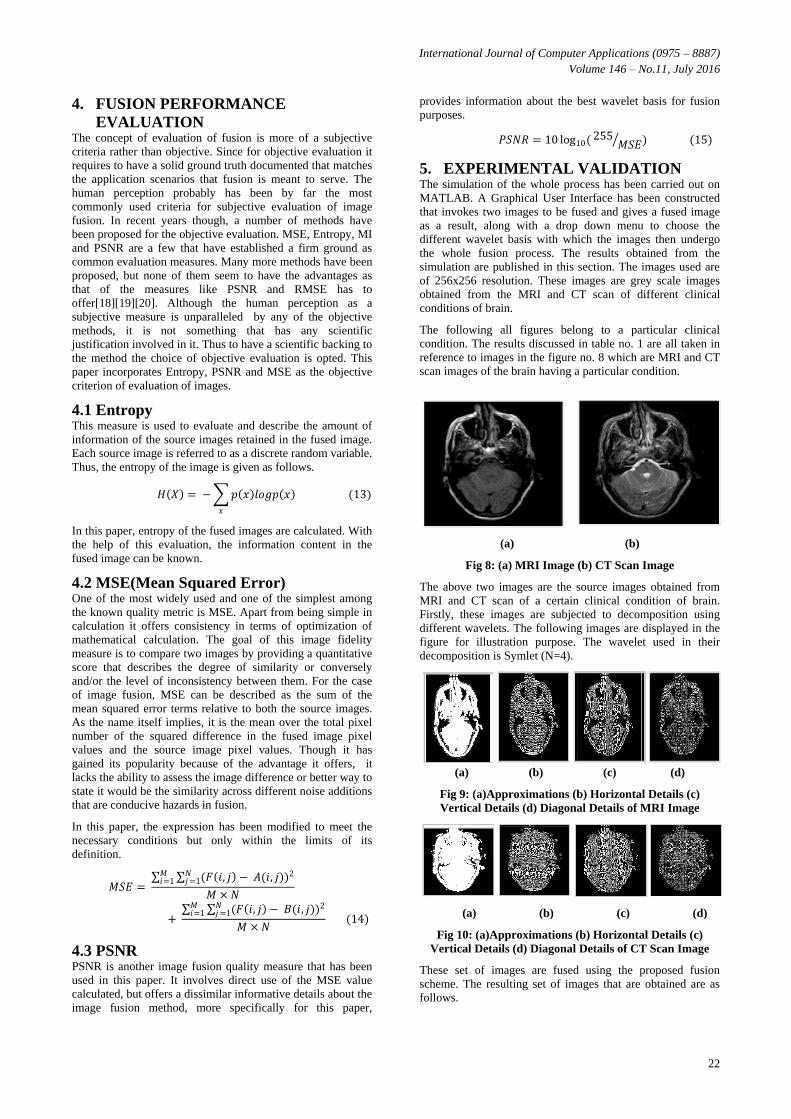
Firstly, these images are subjected to decomposition using
different wavelets. The following images are displayed in the
figure for illustration purpose. The wavelet used in their
decomposition is Symlet (N=4).
(a) (b) (c) (d)
Fig 9: (a)Approximations (b) Horizontal Details (c)
Vertical Details (d) Diagonal Details of MRI Image
(a) (b) (c) (d)
Fig 10: (a)Approximations (b) Horizontal Details (c)
Vertical Details (d) Diagonal Details of CT Scan Image
These set of images are fused using the proposed fusion
scheme. The resulting set of images that are obtained are as
follows.

International Journal of Computer Applications (0975 – 8887)
Volume 146 – No.11, July 2016
23
(a) (b) (c) (d)
Fig 11: (a)Approximations (b) Horizontal Details (c)
Vertical Details (d) Diagonal Details of fused images
These Images are later subjected to Inverse Discrete Wavelet
Transformation. After having undergone IDWT a single fused
image is obtained. The process is also better known as
synthesis is performed. These set of source images are
analyzed and synthesized using different wavelets as
mentioned earlier. The MSE, PSNR and Entropy of fused
images are obtained as result of the simulation. The observed
results are presented in a tabular form in Table no. 1.
Table. 1: Results corresponding to the images displayed in
figure. no. 8
Types of
Wavelets PSNR MSE Entropy
Haar 50.3872 0.5948 14.0323
Daubechies-4 47.3042 1.2096 23.6144
Daubechies-8 40.2233 6.1765 27.9065
Symlet-4 46.2066 1.5575 23.6278
Symlet-8 44.2738 2.4305 24.515
The following figure comprises of resultant fused images
produced using different wavelets.
(a) (b) (c)
(d) (e)
Fig 12: Fused using (a)Haar Wavelet (b) Daubechies - 8 (c)
Daubechies - 16 (d) Symlet - 8 (e) Symlet - 16
(a) (b)
Fig 13: (a) MRI Image (b) CT Scan Image
Similarly, two more sets of MRI and CT scan images were
used to obtain the results corresponding to them. The above
figures and tables represent the results for the appropriate set
of images. The results corresponding to the images in figure.
no. 13. is presented in the Table. no. 2. Also, the resultant
fused images are represented in figure. no. 14.
Table. 2: Results corresponding to the images displayed in
figure. no. 13
Types of
Wavelets PSNR MSE Entropy
Haar 51.3327 0.4784 14.2365
Daubechies-4 50.3678 0.5974 24.6343
Daubechies-8 44.6801 2.2135 29.8842
Symlet-4 48.5046 0.9175 24.7057
Symlet-8 45.6069 1.7881 28.512
(a) (b) (c)
(d) (e)
Fig 14: Fused using (a)Haar Wavelet (b) Daubechies - 8 (c)
Daubechies - 16 (d) Symlet - 8 (e) Symlet - 16
(a) (b)
Fig 15: (a) MRI Image (b) CT Scan Image
The results corresponding to the above set of images are
displayed in table. no. 3. in the adjacent column. The set of
resultant fused images are collectively displayed in figure. no.
16.
Table. 3: Results corresponding to the images displayed in
figure. no. 15
Types of
Wavelets PSNR MSE Entropy
Haar 50.7130 0.5518 13.1810
Daubechies-4 50.1203 0.6325 22.053
Daubechies-8 47.8001 1.0791 26.493

International Journal of Computer Applications (0975 – 8887)
Volume 146 – No.11, July 2016
24
Symlet-4 49.8561 0.6722 22.153
Symlet-8 49.5085 0.7282 25.423
Fig 16: Fused using (a)Haar Wavelet (b) Daubechies - 8
(c) Daubechies - 16 (d) Symlet - 8 (e) Symlet - 16
6. CONCLUSION This paper tries to draw a comparison between different
wavelets from a perspective of fusion of medical images.
From the obtained results it can be confirmed that the
wavelets with lower order tend to give good results. Since the
PSNR value corresponding to the lower values of order such
as those for Daub4 is more as compared to Daub8. The same
goes for Symlet wavelets. While the best results are obtained
using the Haar wavelets, with highest PSNR value, least MSE
and least Entropy. It can thus be conclude form above results
that the wavelets that are higher in order shows a degradation
in results of fusion when the aforementioned scheme of image
fusion is adopted.
7. ACKNOWLEDGMENT Corresponding author acknowledges Prof. Vicky Cheda, a
faculty of Dept of Electronics & Telecommunication, KJ
Somaiya College Of Engineering, Vidyavihar(Mumbai) for
providing insight and guidance in the experimental work in
the laboratory.
8. REFERENCES [1] Bushara N. Kayani, Anwar Majeed Mirza, Ajmal
Bangash, Harron Iftikhar, "Pixel and Feature Level
Multiresolution Image Fusion Based On Fuzzy Logic", in
Innovations and Advanced Techniques in Computer and
Information Sciences and Engineering, 2007, pp 129-
132.
[2] Shweta K. Shah, Prof. D. U. Shah. (2013, Mar.).
Comparative Study of Image Fusion Techniques based
on Spatial and Tranform Domain. International Journal
of Innovative Research in Science, Engineering and
Technology. [Online]. 3(3).
[3] Rohan Ashok Mandhare, Pragati Upadhyay, Sudha
Gupta. (2013, June). Pixel Level Image Fusion Using
Brovey Transform and Wavelet transform. International
Journal of Advanced Research in Electrical, Electronics
and Instrumentation Engineering. [Online]. 2(6).
http://www.ijareeie.com/upload/june/25F_PIXEL.pdf.
[4] V. P. S. Naidu, J. R. Raol. (2008, May.). Pixel Level
Image Fusion Using Wavelets and Principal Component
Analysis
[5] Myungjin Choi, (2006, June) ,"A New Intensity-Hue-
Saturation Fusion Approach to Image Fusion With a
Tradeoff Parameter", IEEE Transactions on Geoscience
and Remote Sensing, 44(6).
[6] H. Li, B. S. Manjunath, S. K. Mitra. "Multisensor image
fusion using the wavelet transform", Graphical Models
and Image Processing, 57(3), pp. 235– 245, 1995.
[7] Tianjiao Zeng, Renyi Hu, Yaodong He, and Yunqi
Wang, “Image Fusion Using Laplacian Pyramid
Transform,” ECE Capstone Design Project, Rutgers
School of Engineering, Spring 2014.
[8] A. Grossmann and J. Morlet, “Decomposition of Hardy
functions into square integrable wavelets of constant
shape,” SIAM J. Math.. vol. 15. pp. 723-736. 1984
[9] Y. Meyer. “Ondelettes et foncttons splines,” Srm.
Equarions auxeri1,ee.s Par-tie//es. Ecole Polytechnique.
Paris, France, Dec. 1986.
[10] S. Mallat, A Wavelet Tour of Signal Processing,
Academic Press,1999.
[11] Gonzalo Pajares, Jesus Manuel de la Cruz."A wavelet-
based image fusion tutorial", Pattern recognition. 37,
Elsevier, pp, 1855-1872, 2004
[12] Haar A., "Zur Theorie der orthogonalen
Funktionensysteme. Mathematische Annalen", 69, 331–
371.
[13] Porwik P., Lisowska A," The New Graphic Description
of the Haar Wavelet Transform". Lecture Notes in
Computer Science, Springer–Verlag, Berlin, Heidelberg,
New York, 3039, 1–8.
[14] Zeng L., Jansen C. P., Marsch S., Unser M., Hunziker
R,." Four– Dimensional Wavelet Compression of
Arbitrarily Sized Echocardiographic Data", IEEE
Transactions on Medical Imaging, 21(9), 1179–1188.
2003.
[15] Claypoole R., Davis G., Sweldens W., Baraniuk R.
"Adaptive Wavelet Transforms for Image Coding"
Asilomar Conference on Signals, Systems and
Computers.
[16] Munoz A., Ertle R., Unser M."Continuous wavelet
transform with arbitrary scales and O(N) complexity",
Signal Processing, 82, 749–757.
[17] Z. Zhang, R.S. Blum, "A categorization of multi-scale
decomposition based image fusion schemes with a
performance study for a digital camera application",
Proc. IEEE 87 (8) (1999) 1315–1326.
[18] J.-B. Martens and L. Meesters, “Image dissimilarity,”
Signal Processing, Vol. 70, pp. 155-176, Nov. 1998.
[19] VQEG, “Final report from the video quality experts
group on the validation of objective models of video
quality assessment,” http://www.vqeg.org/, Mar. 2000.
[20] A. M. Eskicioglu and P.S. Fisher, “Image quality
measures and their performance,” IEEE Trans.
Communications, vol. 34, pp. 2959-2965, Dec. 1995.
IJCATM : www.ijcaonline.org