comparative study between equity and derivative stocks of three selected companies
DESCRIPTION
This study helps us to compare equity stocks and the equity derivative stocks of 3 companies- ACC, ITC and ICICI Bank.TRANSCRIPT
A COMPARATIVE STUDY ON THE EQUITY AND EQUITY
DERIVATIVE (FUTURE) STOCKS OF THREE SELECTED
COMPANIES– ITC, ACC AND ICICI BANK WITH REFERENCE
TO KOTAK SECURITIES LIMITED
KOTAK SECURITIES LIMITED

A COMPARATIVE STUDY ON THE EQUITY AND EQUITY
DERIVATIVE (FUTURE) STOCKS OF THREE SELECTED
COMPANIES– ITC, ACC AND ICICI BANK WITH REFERENCE
TO KOTAK SECURITIES LIMITED
A report submitted in partial fulfillment of the requirements of the
MBA program (The Class of 2011-2013)
THE ICFAI UNIVERSITY TRIPURA
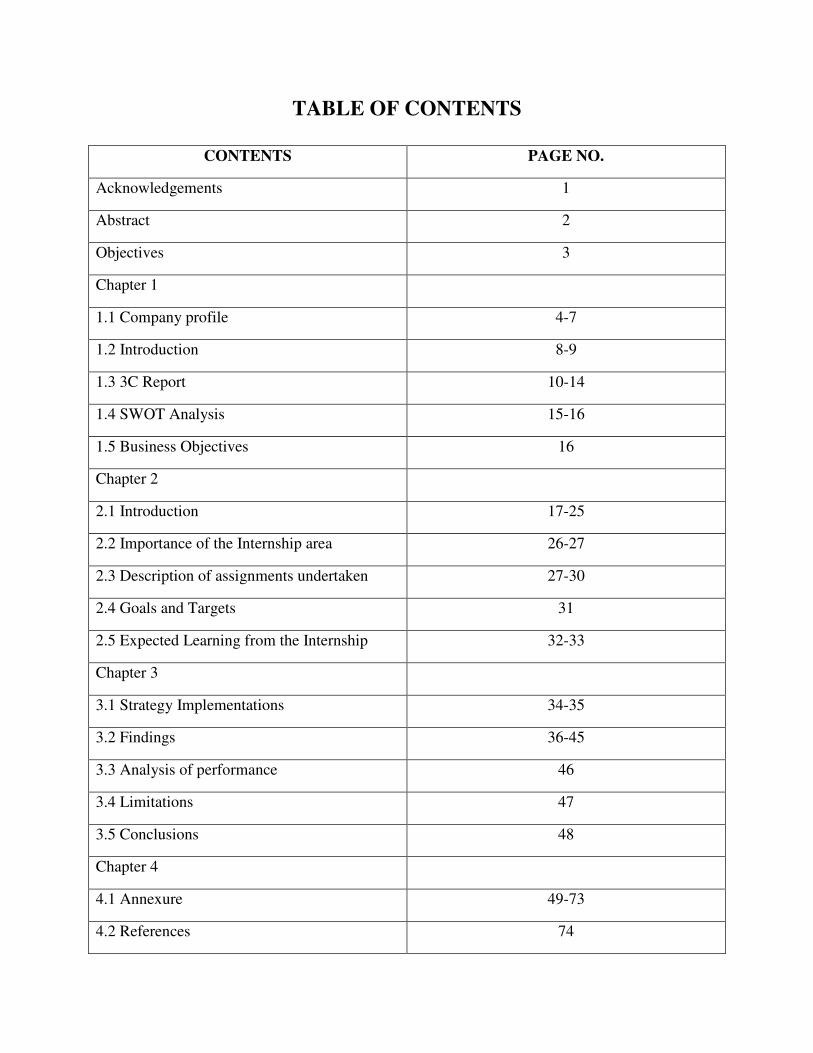
TABLE OF CONTENTS
CONTENTS PAGE NO.
Acknowledgements 1
Abstract 2
Objectives 3
Chapter 1
1.1 Company profile 4-7
1.2 Introduction 8-9
1.3 3C Report 10-14
1.4 SWOT Analysis 15-16
1.5 Business Objectives 16
Chapter 2
2.1 Introduction 17-25
2.2 Importance of the Internship area 26-27
2.3 Description of assignments undertaken 27-30
2.4 Goals and Targets 31
2.5 Expected Learning from the Internship 32-33
Chapter 3
3.1 Strategy Implementations 34-35
3.2 Findings 36-45
3.3 Analysis of performance 46
3.4 Limitations 47
3.5 Conclusions 48
Chapter 4
4.1 Annexure 49-73
4.2 References 74

Acknowledgements
This project bears imprint of all those who have directly or indirectly helped and extended their
kind support in completing this project.
At the time of making this report I express my sincere gratitude to all of them.
I am grateful to Amit Kumar Saha (HR, Kotak securities Ltd.) for giving me a chance to work
with the Company.
I am extremely thankful and obliged to my Company guide Mr. Biswadeep Chakraborty for
providing streamed guidelines since inception till the completion of the project.
I am also thankful to my faculty guide Mr. Dhananjoy Datta for the effective guidelines and
helping attitude since inception till the completion of the project.
At this moment I also thank the almighty God for the blessing showed upon me, parents for their
support and care and also my friends for their valuable suggestions.
This project report is a collective effort of all and I sincerely remember and acknowledge all of
them for their excellent help and assistance throughout the project.
Date: 23-07-2012
Agartala Chandni Saha

Abstract
In the current economic scenario interest rates are falling and fluctuating in the stock market has
put investors in confusion. One finds it difficult to take decision on investment. This is primarily,
because of investments are risky in nature and investors have to consider various factors before
investing in any stock.
These factors include risk, return, and volatility of stocks. For comparing equity stocks with
equity derivative stocks easily three companies’ equity and equity derivative stocks are taken.
The main objective of comparing equity stocks with equity derivative stocks is to analyze the
performance of equity stocks with market index and compare them with equity derivatives by
using risk, return and beta as a parameter.
Primary and secondary data were taken for calculating risk, return and beta. Analysis has done
on percentage method for comparing equity stocks with equity derivative stocks. Compare to
equity stocks, equity derivative stocks are less risky and return also less. In terms of margin,
duration, expiry date of contracts and lot size equity stocks are more effective than equity
derivative stocks.
The study will guide the investor and give them information about pros and cons of investing in
equity stock and equity derivative stocks and also provide knowledge about how to measure the
risk and return of a particular stock.
Objectives
• To compare three selected company’s Equity and Equity Future stocks in respect to their
risk and return.
• To differentiate selected company’s Equity and Equity Future stocks in terms of types of
margin, duration, lot sizes, expiry date of contract.
• To provide information about pros and cons of investing in Equity and Equity Future
stocks of those selected companies.

Chapter 1
1.1 Company profile
History of Kotak Mahindra Group:
The Kotak Mahindra Group was born in 1985 as Kotak Capital Management Finance Limited. This
company was promoted by Uday Kotak, Sidney A. A. Pinto and Kotak &Company. Industrialists Harish
Mahindra and Anand Mahindra took a stake in 1986, and that's when the company changed its name to
Kotak Mahindra Finance Limited.
1986: Kotak Mahindra Finance Limited starts the activity of bill discounting.
1987: Enters the base and hire purchase market.
1990: Auto finance division was started.
1991: Investing banking was started.
1992: Enters funds syndication sector.
1995: Brokerage and distribution businesses incorporated into a separate company Kotak Securities.
1996: The auto finance business was hived off into a separate company- Kotak Mahindra Primus Limited,
for financing ford vehicles.
1998: Enters the mutual fund market with launch of Kotak Mahindra Company.
2000: Kotak Mahindra ties up with old mutual for the life4 insurance business. Kotak Securities launches
kotaksecurities.com- its online broking site.
2003: Kotak Mahindra finance Limited converts to bank.
Kotak Mahindra is one of India's leading financial conglomerates, offering complete financial solutions
that encompass every sphere of life. From commercial banking, to stock broking, to mutual funds, to life
insurance, to investment banking, the group caters to the financial needs of individuals and corporate. The
group has a net worth of around Rs. 3,200 crores, employs around 10,800 people in its various businesses
and has a distribution network of branches, franchisees, representative offices and satellite offices across
300 cities and towns in India and offices in New York, London, Dubai, Mauritius and Singapore.
The Group services around 2.6 million customer accounts. Kotak Mahindra is one of India's leading
financial conglomerates, offering complete financial solutions that encompass every sphere of life. From
commercial banking, to stock broking, to mutual funds, to life insurance, to investment banking, the
group caters to the financial needs of individuals and corporate. As on March 31, 2007, the group has a
net worth of over Rs.3,200 crore, and the AUM across the group is around Rs. 224 billion and employs
over 10,800 employees in its various businesses. With a presence in 300 cities in India and offices in New
York, London, Dubai, Mauritius and Singapore, it services a customer base of over around 2.6 million.

The group specializes in offering top class financial services, catering to every segment of the industry.
The various group companies include:
• Kotak Mahindra Capital Company Limited
• Kotak Mahindra Bank
• Kotak Securities Limited
• Kotak Mahindra Asset Management Company Limited
• Kotak Life
• Kotak Mahindra Wealth Management
The company has a full-fledged research division involved in Macro Economic studies, Sectoral
research and Company Specific Equity Research combined with a strong and well networked
sales force which helps deliver current and up to date market information and news.
History of Kotak Securities Limited:
Originally established in 1994, Kotak Securities is a subsidiary of Kotak Mahindra Bank, which
services more than 7.4 lakh customers. The firm has a wide network of more than 1400 branches,
franchisees representative offices, and satellite offices across 448 cities in India and offices in
New York, London, Dubai, Mauritius and Singapore.
They process more than 400000 trades a day which is much higher than some of the renowned
international brokers.
The company is a corporate member of both The Bombay Stock Exchange (BSE) and The
National Stock Exchange of India (NSE). Their operations include stock broking services for
trading in stock markets through branches & internet and distribution of various financial
products including investments in IPOs, Mutual Funds and Currency Derivatives. Currently,
Kotak Securities is one of the largest broking houses in India with substantial geographical reach
to Asia Pacific, Europe, Middle East and America.
Kotak Securities Limited has Rs. 1,202 crore of Assets Under Management (AUM) as of 31st
Dec, 2011. Kotak securities have 25% equity participation from Goldman Sachs.
Kotak securities have been the largest in IPO distribution and were ranked no.1 in the year 2003-
2004 as book running lead managers in IPO’s by prime database. The core strengths are the
expertise in equity research and wide retail distribution network. It has an outstanding research
division involved in macro – economic studies, industry and company specific equity research
with analysts specializing in particular economic sectors and large cap stocks. Kotak securities
manage assets over rupees 1200 crores under portfolio management services.
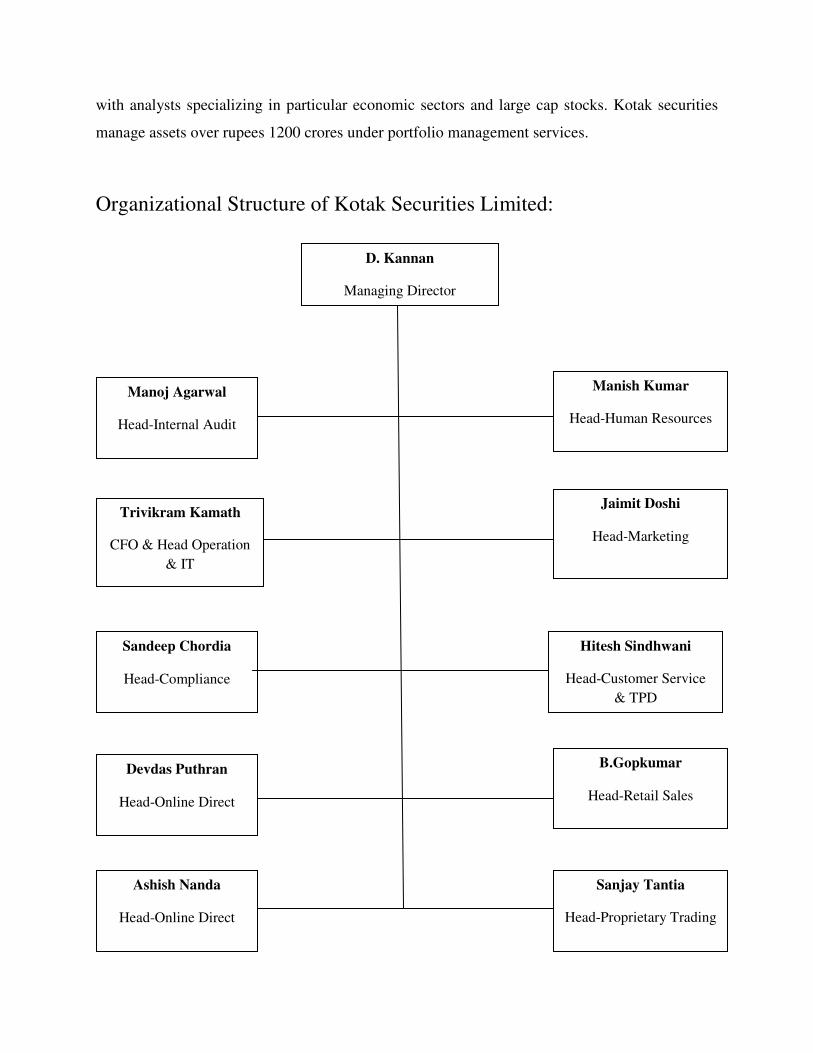
Organizational Structure of Kotak Securities Limited:
D. Kannan
Managing Director
Manoj Agarwal
Head-Internal Audit
Manish Kumar
Head-Human Resources
Trivikram Kamath
CFO & Head Operation
& IT
Jaimit Doshi
Head-Marketing
Sandeep Chordia
Head-Compliance
Hitesh Sindhwani
Head-Customer Service
& TPD
Devdas Puthran
Head-Online Direct
B.Gopkumar
Head-Retail Sales
Ashish Nanda
Head-Online Direct
Sanjay Tantia
Head-Proprietary Trading

Trivikram Kamath
CFO & Head Operation,
Finance & IT
Clifford Torres
Head-IT, Software
Mukul Rathi
Head-Risk Mgmt & Branch
Ops (Mah, Goa)
Shailesh Kumar
Head-Online Risk and
Operations
K. N. Srikrishnan
Head-PMS Ops, DP,
Primary Mkt & Branch Ops
(except Mah,Goa)
Kulin Thaker
Head-IT &
Networking
Girish Mhatre
Head-IT, Software E-
Broking
Mahesh Nirwan
Head-A/C opening &
sub broking Ops,
Settlements
Pradeep Kumar M.
Head- Legal
Vishwanath Eswar
Head- Treasury, Accounts
& Finance
1.2 Introduction of the present IP Company
Kotak Securities Ltd. (Agartala branch) was established on 10th August 2006. The main branch
of the company is in Mumbai. Kotak Securities Ltd., a 100% subsidiary of Kotak Mahindra
bank, is one of the oldest and largest stock brokers in the country. There are two important stock
exchanges in India viz. Bombay Stock Exchange (BSE) and National Stock Exchange (NSE).
Kotak Securities Ltd. mainly deals with NSE. NSE was established in 1994 and provides a
nationwide trading facility for equities, debts and hybrids. It is a ring less national computerized
exchange and it has two segments, the capital market segment and the wholesale debt market
segment. SEBI regulates the business in stock exchange and other securities market. Indices are
the statistical measure of change in securities market. Some of the indices in which Kotak
Securities Ltd.(Agartala) mainly deals with are Nifty, Bank Nifty, CNX IT, Sensex and sectoral
indices, such as Auto, FMCG, Metal, IT, Bank. Nifty is the most rigorously constructed stock
market index.
Some of the facts about Nifty are:
� It reflects the price movement of 50 stocks selected on market capitalization and
liquidity.
� It has a base value of 1000 points.
� The base period selected for Nifty index is close price on November 3, 1995.
� It is a value weighted index but uses the total market capitalization.
Kotak Securities Ltd. offers a diverse range of financial instruments like:
� Shares.
� Derivatives.
� Mutual funds.
� IPOs.
� Depository services.
� Primary debt.
Mainly used software by Kotak securities limited are as follows:
• BOSS: It is also called Back Office Support System. All the office related works and
information’s are recorded and audited by the operating system BOSS.

• CRPS: It stands for Centralized Receipts and Payments Systems by which all the
financial transactions of the company take place. Funds can be accepted from clients only
in the form of “A/c Payee Cheques” drawn in favor of “Kotak Securities Ltd.”. Cheques
received for pay in are captured in CRPS and deposited in bank with pay slip printed
from CRPS. DD is accepted only with bank letter giving details of source of funds. More
than one bank can be mapped/updated in CRPS for receipts.
• KRISP: It stands for Kotak human resource information system portal. It contains details
on organization, their various employee policies, all employee forms, information on the
organizational structure-key personnel and much more.
• TERMINAL: The Terminal is main area from which the total trading is take place. The
selling and buying of stock is done here through computer. The software name is ODIN
Client 10.0.0.2(Integrated). The computer keyboard is the main functional area.
More than 100 products are customized at client level and it provides payment gateway with
Banks, namely:
� Kotak Mahindra Bank.
� ICICI Bank.
� HDFC Bank.
� City Bank.
� Axis Bank.
Kotak Securities Limited offers stock broking services and distributes financial products in India.
The company offers secondary market broking services to foreign and Indian institutional
investors in Indian equities and derivatives, including local shares and global depository receipts.
It also provides professional portfolio management services to high net-worth individuals and
corporate. In addition, the company involves in the distribution and placement of a range of
financial products, which include company fixed deposits, mutual funds, initial public offerings,
private and secondary placement of debt and equity, insurance products, and small savings
schemes. Further, it offers depository services, including trading and settlement of
dematerialized shares. The company was founded in 1994 and is based in Mumbai, India. Kotak
Securities Limited operates as a subsidiary of Kotak Mahindra Bank Limited.

1.3 “3C” Report of the Company
1.3.1 Introduction of the company:
Kotak Securities Limited, a strategic joint venture between Kotak Mahindra Bank and Goldman
Sachs (holding 25% - one of the world’s leading investment banks and brokerage firms) is
India’s leading stock broking house with a market share of 5 - 6 %.Kotak Securities Limited is
one of the largest players in distribution of IPOs - it was ranked number One in 2003-04 as Book
Running Lead Manager in public equity offerings by PRIME Database. It has also won the Best
Equity House Award from Finance Asia – April 2004.The Company has a full-fledged Research
division involved in macroeconomic studies, sectoral research and Company specific equity
research combined with a strong and well networked sales force which helps deliver current and
up-to-date market information and news. The Company has 113 branches servicing around
100000 customers, through offices and a large franchisee network. It’s has an Online presence
through Kotak street.com, where we offer Internet Broking services and also online IPO and
Mutual Fund Investments. Kotak Securities Limited manages assets over Rs. 1700 crores
through its Portfolio Management Services (PMS) servicing high net worth clients with a large
investible surplus through its preferred client services in the mass affluent and wealth
management segments.
Kotak Securities Ltd is also a depository participant with National Securities Depository Limited
(NSDL) and Central Depository Services Limited (CDSL), providing dual benefit services
wherein the investors can use the brokerage services of the company for executing the
transactions and the depository services for settling them. Kotak Securities has 813 outlets
servicing more than 3, 15,000 customers and coverage of 277 Cities. Kotaksecurities.com, the
online division of Kotak Securities Limited offers Internet Broking services and also online IPO
and Mutual Fund Investments. Kotak Securities Limited manages assets around 2300 crores of
Assets Under Management (AUM) .The portfolio Management Services provides top class
service, catering to the high end of the market. Portfolio Management from Kotak Securities
comes as an answer to those who would like to grow exponentially on the crest of the
stock market, with the backing of an expert.

Main areas of business Kotak Securities are:
• Institutional broking business: This service primarily covers secondary market
broking. It caters to the needs of foreign and Indian institutional investors in Indian
equities Kotak Securities institutional business also incorporates a comprehensive
research cell with sector analysts who cover all the major areas of Indian economy.
• Private client group: Private client group is a special investment division for high net
worth individuals. Nonresident Indian investors trust corporate and banks the investments
product range at private client group is among the widest in the country and covers debt
and equity, mutual funds and specialized structured investment products.
• Client money management: This division provides professional portfolio
management services to high net worth individuals and corporate. Efficient fund
management is maintained at all times as well as complete accountability and
transparency. Its expertise in research and stock broking gives it the right perspectives
from which it provide its clients with investments advisory services that benefits the
clients.
• Retail distribution of financial products: Kotak Securities has a comprehensive
retail distribution network, comprising about 7000 agents, 13 branches and over 20
franchisees across India. This network is used for the distribution and placements of a
range of financial products that includes company fixed deposits, mutual funds, initial
public offerings, equity and small saving schemes.
• Depository services: Kotak Securities is a depository participant with national
securities depository limited for trading and settlement of dematerialized shares. Since it
is also in the broking business investors who use its depository services get dual benefit.
• Online trading: Kotak Securities online broking service kotaksecurities.com offer
services for retail investors who like to trade on net its unique product offering securities
as margins and its market watch facility with real time prices combined in an order
facility not offered by and other web site at present.

1.3.2 Customers of the company:
Kotak securities investing from customers perspective and make recommendations based on
customers’ needs. One of their important goals is to simplify investing for customer, along with
this they also provide long term values to their customers.
Kotak securities have a million reasons for customers to choose them. Listed below are a few:
• Stability: They are a subsidiary of Kotak Mahindra Bank and one of the oldest and
largest stock broking firms in the Industry. They have been the first and only NBFC to
receive the license to be converted into a bank.
• Innovators in the Industry: They have been the first in providing many products and
services which have now become industry standards. They are the first to provide Margin
Financing to the customers, first to enable investing in IPOs and Mutual Funds on the
phone, providing SMS alerts before execution of depository transactions launching of
Mobile application to track portfolio.
• Reliability: Their accolades are a testimony to their services and high standards.
They have been awarded as:
� Best Broker in India by Finance Asia for 2010 & 2009.
� UTI MF - CNBC TV18 Financial Advisor Awards - Best Performing Equity
Broker (National) for the year 2009.
� Best Brokerage Firm in India by Asia money in 2009, 2008, 2007 & 2006.
� Best Performing Equity Broker in India – CNBC Financial Advisor Awards
2008.
� Avaya Customer Responsiveness Awards (2007) in Financial Services Sector.
� The Leading Equity House in India' in Thomson Extel Surveys Awards for the
year 2007.
� Euro money Award (2006 & 2007) - Best Provider of Portfolio Management:
Equities.

• Value: Whether you are a customer with a small or large wallet size, you can expect
them to bring value to you in every form like:
� Quality Research
� Quick trade execution
� Low brokerages
� Accounts that suit your investment profile
� Risk Profiler
� Superior Customer Service
• Service: They believe in high standards of service and that's precisely what we offer. It's
an honor to be awarded the most customer responsive company award in the Financial
Institution sector by AVAYA Global Connect Award both in 2006 and 2007.
• Robust Technology: They have developed their own proprietary trading platform
which is robust and among the best in the industry. They have more than 150 technology
professionals constantly working on upgrading and speeding up all our systems.
• Centralized Risk Management System: Unlike many other players they have a
centralized risk management system. This allows them to offer the same levels of service
to customers across all locations.
• Exceptional Research: Unlike most other competitors they have their own in house
research team. There in house research team is among the best in the industry and they
have years of experience in the financial markets. They scan through the plethora of
stocks and find the scripts that have a high potential of providing you good returns. Their
investors get research Technical, Fundamental, Derivatives, Macro-economic and mutual
fund research.
• Large Presence: They are present in 448 cities with 1416 outlets all over the country.
Their employee strength extends about 3800.
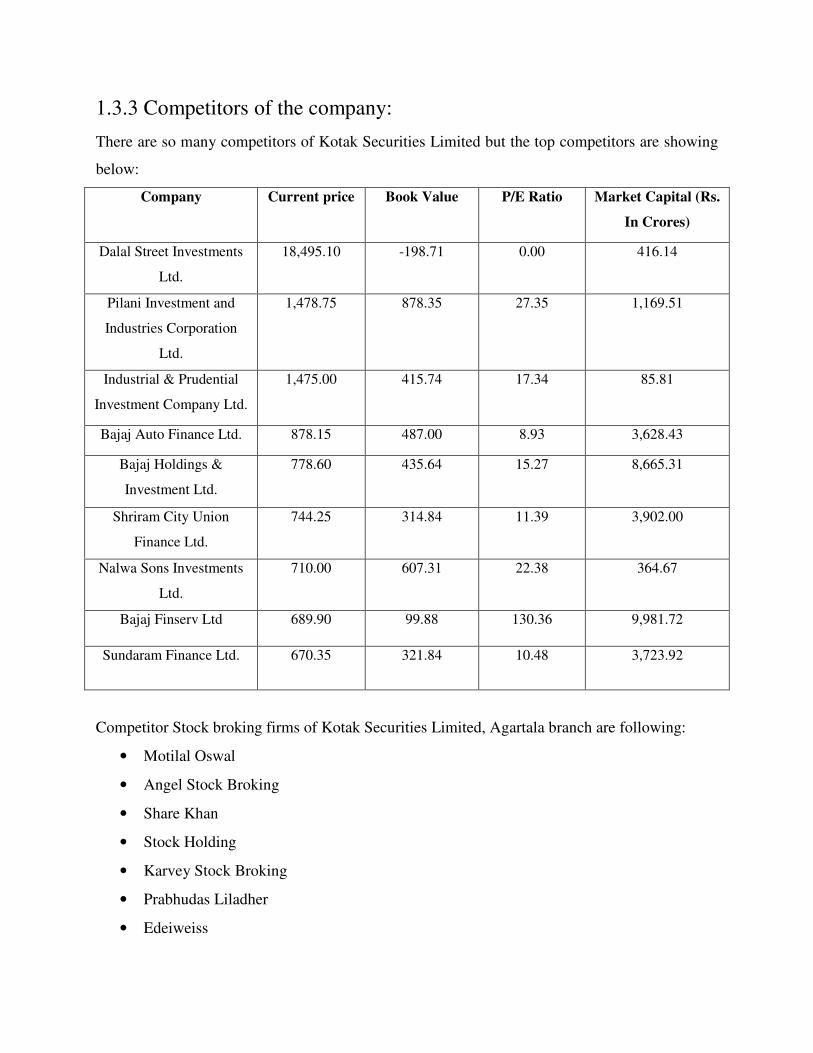
1.3.3 Competitors of the company:
There are so many competitors of Kotak Securities Limited but the top competitors are showing
below:
Company Current price Book Value P/E Ratio Market Capital (Rs.
In Crores)
Dalal Street Investments
Ltd.
18,495.10 -198.71 0.00 416.14
Pilani Investment and
Industries Corporation
Ltd.
1,478.75 878.35 27.35 1,169.51
Industrial & Prudential
Investment Company Ltd.
1,475.00 415.74 17.34 85.81
Bajaj Auto Finance Ltd. 878.15 487.00 8.93 3,628.43
Bajaj Holdings &
Investment Ltd.
778.60 435.64 15.27 8,665.31
Shriram City Union
Finance Ltd.
744.25 314.84 11.39 3,902.00
Nalwa Sons Investments
Ltd.
710.00 607.31 22.38 364.67
Bajaj Finserv Ltd 689.90 99.88 130.36 9,981.72
Sundaram Finance Ltd. 670.35 321.84 10.48 3,723.92
Competitor Stock broking firms of Kotak Securities Limited, Agartala branch are following:
• Motilal Oswal
• Angel Stock Broking
• Share Khan
• Stock Holding
• Karvey Stock Broking
• Prabhudas Liladher
• Edeiweiss
1.4 SWOT analysis of the Company
Strengths:
• Kotak Securities Ltd. is one of the largest players in distribution of IPO’s.
• Its brokerage charges are almost half of those with ICICI Web trade.
• Highly co-operative and skilled staff.
• Sales oriented organization.
• Aggressiveness of sales force in selling products.
• The company has expertise in managing big business.
• Effective and wider distribution network
• It has 113 branches serving around 1, 00,000 people.
• It is currently managing assets worth Rs.1700 crores.
• Product designed for every area of personal.
• The office hours of the company for the customers are from 9am to 6pm.
• The company enjoys a very high brand loyalty and recall value among its customers.
• The company has a presence in all metros as well as in the most of the major cities in the
country.
Weaknesses:
• No presence in the rural and semi-urban segment.
• Lack in making follow-ups.
• Lack of corporate agents.
• Lack of customer services and promotional activities.
Opportunities:
• There is continuous growth in this sector.
• People have started turning towards the organization as they know that facilities are far
better than the others.
• Market is fully vacant to capture because the branch has recently setup its business.
Threats:
• Competition in the sector is increasing with the entry of lots of private giants with the
collaboration of foreign giants.
• Selling attitude for the company always has to be maintained in order to compete with
other companies.
• Continuous follows up of the clients and customers.
As other organizations like ICICI web trade, India Info line, etc. are there in the city so it
is a little bit difficult for them to capture the market.
1.5 Business Objectives of the Company
• Kotak believe that ethics of a company help to deliver value to all the stake holders and
lead to success.
• Kotak Securities adheres to strict ethical practices and compliance that comprise of
commitments towards customers, associates, stakes holders and employees.
• Strong Internal Control team ensures that every individual delivers based on policies set
by the company and there is no compromise on the quality.
• Centralized Risk Management division regularly monitors the position of customers'
portfolios to reduce the loss at the time of market volatility.
Chapter 2
2.1 Introduction
While discussing about stocks and shares one of the first things that come to mind is the stock
market. But not all companies’ shares are traded in a stock market. The capital stock or stock of a
business entity represents the original capital paid into or invested in the business by its founders.
It serves as a security for the creditors of a business since it cannot be withdrawn to the detriment
of the creditors. Stock is different from the property and the assets of a business which may
fluctuate in quantity and value. The stock of a business is divided into multiple shares.
Stock Market:
A stock market has two main functions. The first function is to provide companies with a way of
issuing shares to people who want to invest in the company. This can be illustrated by an
example: Suppose a company has a mining lease over an area with some rich ore deposits. It
wants to exploit these deposits, but it doesn’t have any equipment. To buy the equipment it needs
money. One way to raise money is through the stock market. The company issues a prospectus,
which is a sort of advertisement informing people about the prospects of the company and
inviting them to invest some money in it. When the company is established on the stock market,
interested investors can become part-owners of the company by buying shares. If the company
operates at a profit, shareholders benefit in two ways-through the issuing of dividends in the
form of cash or more shares, and through growth of in the value of the shares. On the other hand,
if the company does not operate at a profit, the shareholders will probably lose money. The
second function of the stock market related to the first, is to provide a venue for the buying and
selling of shares/stocks.
Types of Stock Market:
Primarily there are two types of stock markets – the primary market and the secondary market.
Basically the primary market is the place where the shares are issued for the first time. So when a
company is getting listed for the first time at the stock exchange and issuing shares – this process

is undertaken at the primary market. That means the process of the Initial Public Offering or IPO
and the debentures are controlled at the primary stock market. On the other hand the secondary
market is the stock market where existing stocks are bought and sold by the retail investors
through the brokers. It is the secondary market that controls the price of the stocks. Generally
when talk about investing or trading at the stock market it means trading at the secondary stock
market. It is the secondary market where people can invest and trade in the stocks to get the
profit from their stock market investment.
Now the Indian stock markets can be divided into further categories depending on various
aspects like the mode of operation and the diversification in services. First of the two largest
stock exchanges in India can be divided on the basis of operation. While the Bombay stock
exchange or BSE is a conventional stock exchange with a trading floor and operating through
mostly offline trades, the National Stock Exchange or NSE is a completely online stock
exchange and the first of its kind in the country. The trading is carried out at the National Stock
Exchange through the electronic limit order book or the LOB. With the immense popularity of
the process and online trading facility other exchanges started to take up the online route
including the BSE where people can trade online as well. But the BSE is still having the offline
trading facility.
Apart from these classifications there are also different types of stock market in India and the
classification is made on the type of instrument that is being traded at the market. Both the
Bombay Stock Exchange and the National Stock Exchange have these types of stock markets.
Equity market or the cash segment:
The first type of market is the equity market or the cash segment where stocks are traded. In this
type of trading the buyers of the stocks book a buying order with a bid price and the order are
executed through the broker at a negotiated ask price offered by the sellers at the market. In most
cases the deal is closed or the stocks are brought at the best available ask price. In this type of
trading the buyer pays the entire amount of the value of the stocks that is determined by
multiplying the number stocks with the current price of the stock. Once the buyer pays the entire

amount along with the brokerage and taxes of the transaction the stocks are deposited to the DP
account of the buyer.
Derivative Market:
A derivative instrument is a contract between two parties that specifies conditions (especially the
dates, resulting values of the underlying variables, and notional amounts) under which payments
are to be made between the parties. In the derivative market trading is done mainly through two
instruments – the Future contract and the Option contract. In both these types of contracts the
stocks are bought and sold in lot. The number of stocks for each lot depends on the valuation of
the stock and the valuation of the lot is determined by the number of the stocks in a lot multiplied
with the current market price of the stock. For trading in derivative market people have to buy
either the future contract or the option contract. In a future contract it is agreed that specific
amount of a commodity or financial asset would be bought or sold at a specified future date at an
agreed price. The commodity can be wool, wheat, gold etc. The financial assets can be stocks,
currency or even just a statistical number like the stock market index or interest rates.
Accordingly, the types of futures contracts may be:
• Commodity Futures
• Stock Futures or Stock Market Futures
• Currency Futures
• Index Futures
• Interest rate Futures
Equity future contract is an agreement between the buyer and the seller to buy and sell stocks at a
certain date in future at a price determined today. There are 3 future contracts available anytime
in the market. They are near month which is current month future contracts, middle month which
is next month future contract, and far month which is 2 months down futures contracts. For
example, there could be Feb, Mar, and Apr contracts available in the month of Feb. Equity
futures are traded on stock exchanges and are standardized instruments. Equity futures are settled
every day.
To understand the comparison between equity and equity future stocks, three companies’ equity
stocks and equity future stocks are selected. These three companies’ company profiles are shown
below:
Company Profile of ICICI Bank Ltd.
ICICI Bank Ltd is a major banking and financial services organization in India. The Bank is the
second largest bank in India and the largest private sector bank in India by market capitalization.
They are a publicly held banking company engaged in providing a wide range of banking and
financial services including commercial banking and treasury operations. The Bank and their
subsidiaries offers a wide range of banking and financial services including commercial banking,
retail banking, project and corporate finance, working capital finance, insurance, venture capital
and private equity, investment banking, broking and treasury products and services. They offer
through a variety of delivery channels and through their specialized subsidiaries in the areas of
investment banking, life and non-life insurance, venture capital and asset management. The Bank
has a network of 2,035 branches and about 5,518 ATMs in India and presence in 18 countries.
They have subsidiaries in the United Kingdom, Russia and Canada, branches in United States,
Singapore, Bahrain, Hong Kong, Sri Lanka, Qatar and Dubai International Finance Centre and
representative offices in United Arab Emirates, China, South Africa, Bangladesh, Thailand,
Malaysia and Indonesia. The Bank's equity shares are listed in India on Bombay Stock Exchange
and the National Stock Exchange of India Limited and their American Depositary Receipts
(ADRs) are listed on the New York Stock Exchange. The Banks is the first Indian Bank listed on
New York Stock Exchange. ICICI Bank Ltd was incorporated in the year 1994 as a part of the
ICICI group with the name ICICI Banking Corporation Ltd. The initial equity capital was 75.0%
by ICICI and 25.0% by SCICI Ltd, a diversified finance and shipping finance lender of which
ICICI owned 19.9% at December 1996. Pursuant to the merger of SCICI into ICICI, ICICI Bank
became a wholly-owned subsidiary of ICICI. In September 10, 1999, the name of the Bank was
changed from ICICI Banking Corporation Ltd to ICICI Bank Ltd In March 10, 2001, ICICI Bank
acquired Bank of Madura, an old private sector bank, in an all-stock merger. ICICI Ltd along

with their wholly owned retail finance subsidiaries, namely ICICI Capital Services Ltd and ICICI
Personal Financial Services Ltd amalgamated with the Bank with effect from May 3, 2002. In
May 2003, the bank acquired the entire paid-up capital of Transamerica Apple Distribution
Finance Pvt Ltd which primarily engaged in financing in the two-wheeler segment. In September
12, 2003, the Bank incorporated ICICI Bank Canada as a 100% subsidiary company. In August
2005, the Bank acquired additional 6% of the equity share capital of Prudential ICICI Asset
Management Company Ltd and Prudential ICICI Trust Ltd from Prudential Corporation
Holdings Ltd and thus these two companies became the subsidiaries of the Bank. During the year
2006-07, ICICI Bank Canada incorporated ICICI Health Management Inc as a subsidiary
company. In April 2007, Sangli Bank Ltd merged with the Bank with effect from April 19, 2007.
During the year 2007-08, the Bank increased their branches & extension counter from 755 Nos
to 1,262 Nos, including the addition of about 200 branches through the merger of Sangli Bank.
They increased their ATM network from 3,271 ATMs to 3,881 ATMs. They launched mobile
banking service enabling a wide range of banking transactions using the mobile phone. They also
received licenses for 580 additional branches from RBI. They increased their ATM network to
4,713 ATMs from 3,881 ATMs. During the year 2009-10, the Bank increased their branches &
extension counter from 1,419 Nos to 1,707 Nos. They also increased their ATM network from
4,713 ATMs to 5,219 ATMs. ICICI Wealth Management Inc., a subsidiary of ICICI Bank
Canada, has been dissolved effective December 31, 2009. In January 2010, the Bank and First
Data, a company engaged in electronic commerce and payment services, formed a merchant
acquiring alliance and a new entity named ICICI Merchant Services, 81% owned by First Data,
was formed, which acquired ICICI Bank's merchant acquiring operations for a total
consideration of Rs. 3,744 million. In May 2010, the Bank approved the scheme of
amalgamation of Bank of Rajasthan Ltd with the Bank through share-swap in a non-cash deal
that values the Bank of Rajasthan at about Rs. 3,000 crore. Each 118 shares of Bank of Rajasthan
will be converted into 25 shares of ICICI Bank Ltd. In August 2010, as per the scheme of
amalgamation, Bank of Rajasthan was amalgamated with the Bank with effect from the close of
business on 12 August 2010. The merger of Bank of Rajasthan added over 450 branches to the
network. Including these, their branch network increased from 1,707 branches at March 31, 2010
to 2,529 branches at March 31, 2011. They also increased their ATM network from 5,219 ATMs
at March 31, 2010 to 6,055 ATMs at March 31, 2011.
Company Profile of ITC Ltd.
ITC was incorporated on August 24, 1910 under the name of 'Imperial Tobacco Company of
India Limited'. In recognition of the Company's multi-business portfolio encompassing a wide
range of businesses, the full stops in the Company's name were removed effective September 18,
2001 and the Company was rechristened as 'ITC Limited'.
ITC is one of India's foremost private sector companies with a market capitalization of over US $
33 billion and a turnover of US $ 7 billion. ITC is rated among the World's Best Big Companies,
Asia's 'Fab 50' and the World's Most Reputable Companies by Forbes magazine and among
India's Most Valuable Companies by Business Today. ITC ranks among India's '10 Most
Valuable (Company) Brands', in a study conducted by Brand Finance and published by the
Economic Times. ITC also ranks among Asia's 50 best performing companies compiled by
Business Week.
ITC has a diversified presence in FMCG, Hotels, Paperboards & Specialty Papers, Packaging,
Agri-Business, and Information Technology. While ITC is an outstanding market leader in its
traditional businesses of Cigarettes, Hotels, Paperboards, Packaging and Agri-Exports, it is
rapidly gaining market share even in its nascent businesses of Packaged Foods & Confectionery,
Branded Apparel, Personal Care and Stationery.
ITC's diversified status originates from its corporate strategy aimed at creating multiple drivers
of growth anchored on its time-tested core competencies: unmatched distribution reach, superior
brand-building capabilities, effective supply chain management and acknowledged service skills
in hoteliering. Over time, the strategic forays into new businesses are expected to garner a
significant share of these emerging high-growth markets in India.
ITC's Agri-Business is one of India's largest exporters of agricultural products. ITC's wholly
owned Information Technology subsidiary, ITC Infotech India Ltd, provides IT services and

solutions to leading global customers. ITC Infotech has carved a niche for itself by addressing
customer challenges through innovative IT solutions.
ITC's production facilities and hotels have won numerous national and international awards for
quality, productivity, safety and environment management systems. ITC was the first company
in India to voluntarily seek a corporate governance rating.
ITC employs over 26,000 people at more than 60 locations across India. The Company
continuously endeavors to enhance its wealth generating capabilities in a globalizing
environment to consistently reward more than 4, 10, 000 shareholders, fulfill the aspirations of
its stakeholders and meet societal expectations. ITC Limited operates in five business segments:
Fast Moving Consumer Goods (FMCG), Hotels, Paperboards, Paper & Packaging and Agri
Business. The FMCG segment includes Cigarettes, which consists of cigarettes, cigars and
smoking mixtures, and others, which include branded packaged foods (staples, biscuits,
confectionery and snack foods), garments, educational and other stationery products, matches,
agarbattis and personal care products. The hotel segment includes hoteliering. The paperboards,
paper and packaging segment includes paperboards, paper, including specialty paper, and
packaging including flexible. The Agri business segment includes agri commodities, such as
soya, coffee and leaf tobacco. Its Agri Business markets agri commodities in the export and
domestic markets. Other includes information technology services, filter rods etc. In September
2011, it acquired Russell Credit Ltd. On March 26, 2012, it purchased entire share capital of
Technico Pty Ltd.
Company Profile of ACC Ltd.
ACC (ACC Limited) is India's foremost manufacturer of cement and concrete. ACC's operations
are spread throughout the country with 16 modern cement factories, more than 40 Ready mix
concrete plants, 21 sales offices, and several zonal offices. It has a workforce of about 9,000
persons and a countrywide distribution network of over 9,000 dealers. ACC has a unique track
record of innovative research, product development and specialized consultancy services. The
company's various manufacturing units are backed by a central technology support services
centre - the only one of its kind in the Indian cement industry.
ACC has rich experience in mining, being the largest user of limestone. As the largest cement
producer in India, it is one of the biggest customers of the domestic coal industry, of Indian
Railways, and a considerable user of the country’s road transport network services for inward
and outward movement of materials and products. Among the first companies in India to include
commitment to environmental protection as one of its corporate objectives, the company
installed sophisticated pollution control equipment as far back as 1966, long before pollution
control laws came into existence. Today each of its cement plants has state-of-the art pollution
control equipment and devices.
ACC plants, mines and townships visibly demonstrate successful endeavors in quarry
rehabilitation, water management techniques and ‘greening’ activities. The company actively
promotes the use of alternative fuels and raw materials and offers total solutions for waste
management including testing, suggestions for reuse, recycling and co-processing. ACC has
taken purposeful steps in knowledge building. The main beneficiaries are youth from remote and
backward areas of the country.
ACC has made significant contributions to the nation building process by way of quality
products, services and sharing expertise. Its commitment to sustainable development, its high
ethical standards in business dealings and its on-going efforts in community welfare programs
have won it acclaim as a responsible corporate citizen. ACC’s brand name is synonymous with
cement and enjoys a high level of equity in the Indian market. It is the only cement company that
figures in the list of Consumer Super Brands of India.

2.2 Importance of the Internship area
Saving the money is not enough. Each of us also needs to invest one’s savings intelligently in
order to have enough money available for funding the higher education of one’s children, for
buying a house etc. The stock market is one of the most important sources for companies as well
as for people to raise money.
This allows businesses to be publicly traded, or raise additional financial capital for expansion by
selling shares of ownership of the company in a public market. The liquidity that an exchange
affords the investors gives them the ability to quickly and easily sell securities. This is an
attractive feature of investing in stocks, compared to other less liquid investments such as real
estate. Some companies actively increase liquidity by trading in their own shares.
History has shown that the price of shares and other assets is an important part of the dynamics
of economic activity, and can influence or be an indicator of social mood. An economy where
the stock market is on the rise is considered to be an up-and-coming economy. In fact, the stock
market is often considered the primary indicator of a country's economic strength and
development.
Rising share prices, for instance, tend to be associated with increased business investment and
vice versa. Share prices also affect the wealth of households and their consumption. Therefore,
central banks tend to keep an eye on the control and behavior of the stock market and, in general,
on the smooth operation of financial system functions. Financial stability is the raison d'être of
central banks.
Exchanges also act as the clearinghouse for each transaction, meaning that they collect and
deliver the shares, and guarantee payment to the seller of a security. This eliminates the risk to an
individual buyer or seller that the counterparty could default on the transaction.
The smooth functioning of all these activities facilitates economic growth in that lower costs and
enterprise risks promote the production of goods and services as well as possibly employment. In
this way the financial system is assumed to contribute to increased prosperity.
A portion of the funds involved in saving and financing, flows directly to the financial markets
instead of being routed via the traditional bank lending and deposit operations. The general
public interest in investing in the stock market, either directly or through mutual funds, has been
an important component of this process.

Statistics show that in recent decades shares have made up an increasingly large proportion of
households' financial assets in many countries. The major part of this adjustment is that financial
portfolios have gone directly to shares but a good deal now takes the form of various kinds of
institutional investment for groups of individuals, e.g., pension funds, mutual funds, hedge funds,
insurance investment of premiums, etc.
2.3 Description of assignments undertaken
To understand the stock market, need to know about National Stock Exchange (NSE), stock
indices, the equity market and future market, their advantages and disadvantages, margins in the
stock market, participants.
National Stock Exchange (NSE): The National Stock Exchange is India's largest financial
market. Established in 1992, the NSE has developed into a sophisticated, electronic market,
which ranks third in the world for transacted volume. The NSE conducts transactions in the
wholesale debt, equity and derivative markets.
Index: An Index is used to give information about the price movements of products in the
financial, commodities or any other markets. Stock market indices are meant to capture the
overall behavior of the equity markets. The stock market index is created by selecting a group of
stocks that are representative of the whole market or a specified sector or segment of the market.
The blue chip index of NSE is S&P CNX Nifty.
Major Indices in India:
These are few popular indices in India.
• BSE-30 Sensex
• BSE-100
• BSE-200
• BSE-500
• S & P CNX Nifty
• S & P CNX Nifty Jr.
• S & P CNX Midcap
• S & P CNX 500
The advantages of equity stocks are:
• It is a permanent source of funds without any repayment liability.
• It does not involve obligatory dividend payment.
• It forms the basis of further long term financing in the form of borrowing related to the
credit worthiness of the firm. The shareholders with limited liability exercise control and
share other ownership rights in the income of the firm.
Investors or equity stockholders may enjoy the following advantages:
• Equity stockholders are the residual claimant of the profits after meeting all the fixed
commitments. The company may add to the profits by trading on equity. Thus equity
capital may get dividend at high in boom period.
• Equity stockholders have voting rights and elect competent persons as directors to control
and manage the affairs of the company.
The disadvantages of equity stocks are:
• The cost of equity capital is high, usually the highest. The rate of return required by
equity shareholders is generally higher, than the rate of return required by other investors.
• Equity shareholders are the last to be paid, for payment of divided during the life time of
the company and payment of capital at the event of liquidation of the company. As a
result, they are facing the maximum risk from investor's point of view.
• Whenever new equity shares are issued, it dilutes the existing shareholders' earnings per
share (EPS) if the profits don't increase immediately in proportion to the increase in the
number of equity shares.
• Whenever new equity shares are to be issued, these are first offered to the existing
shareholders because Companies Act gives them a pre-emptive right to retain their
proportionate ownership.
Disadvantages to investors:
• The dividend on equity shares is subject to availability of profits and intention of the
Board of Directors and hence the income is quite irregular and uncertain. They may get
no dividend even three are sufficient profits.
• During recession or depression periods, the profits of the company come down and
consequently the rate of dividend also comes down. Due to low rate of dividend and
certain other factors the market value of equity shares goes down resulting in a capital
loss to the investors.
• In case, the company goes into liquidation, equity shareholders are the worst suffers.
They are paid in the last only if any surplus is available after every other claim including
the claim of preference shareholders is settled. It is evident from the advantages and
disadvantages of equity share capital discussed above that the issue of equity share
capital is a must for a company, yet it should not solely depend on it. In order to make its
capital structure flexible, it should raise funds from other sources also.
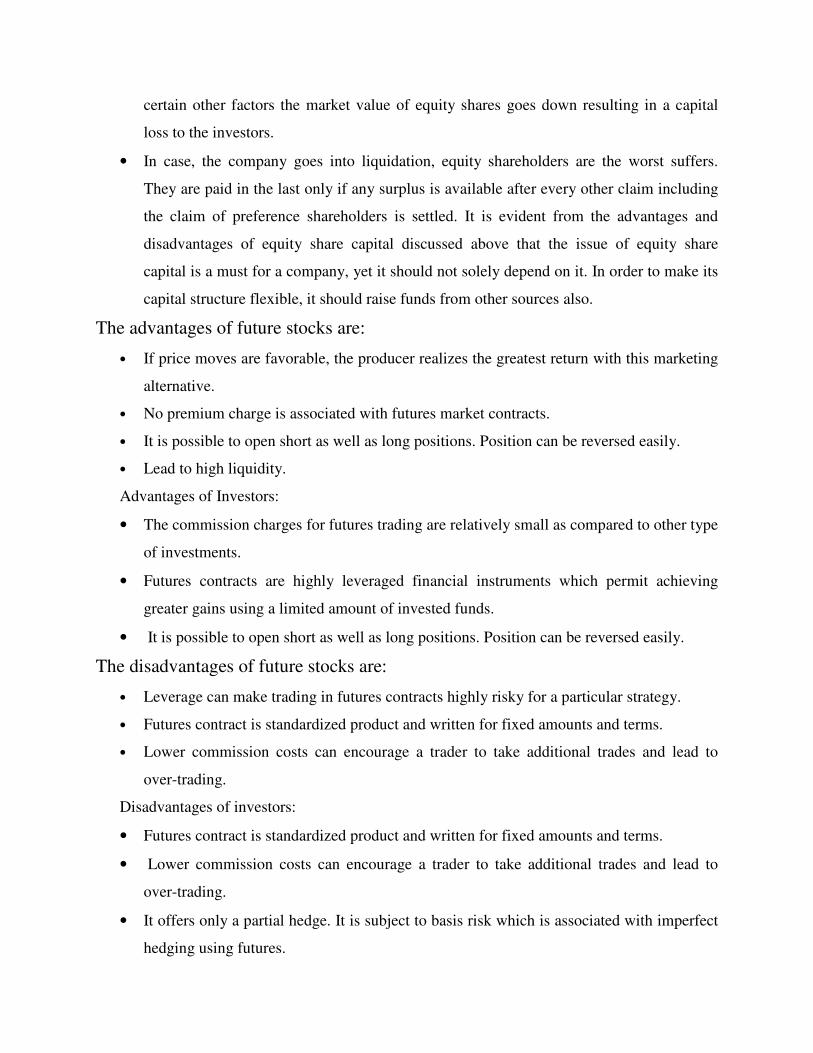
The advantages of future stocks are:
• If price moves are favorable, the producer realizes the greatest return with this marketing
alternative.
• No premium charge is associated with futures market contracts.
• It is possible to open short as well as long positions. Position can be reversed easily.
• Lead to high liquidity.
Advantages of Investors:
• The commission charges for futures trading are relatively small as compared to other type
of investments.
• Futures contracts are highly leveraged financial instruments which permit achieving
greater gains using a limited amount of invested funds.
• It is possible to open short as well as long positions. Position can be reversed easily.
The disadvantages of future stocks are:
• Leverage can make trading in futures contracts highly risky for a particular strategy.
• Futures contract is standardized product and written for fixed amounts and terms.
• Lower commission costs can encourage a trader to take additional trades and lead to
over-trading.
Disadvantages of investors:
• Futures contract is standardized product and written for fixed amounts and terms.
• Lower commission costs can encourage a trader to take additional trades and lead to
over-trading.
• It offers only a partial hedge. It is subject to basis risk which is associated with imperfect
hedging using futures.
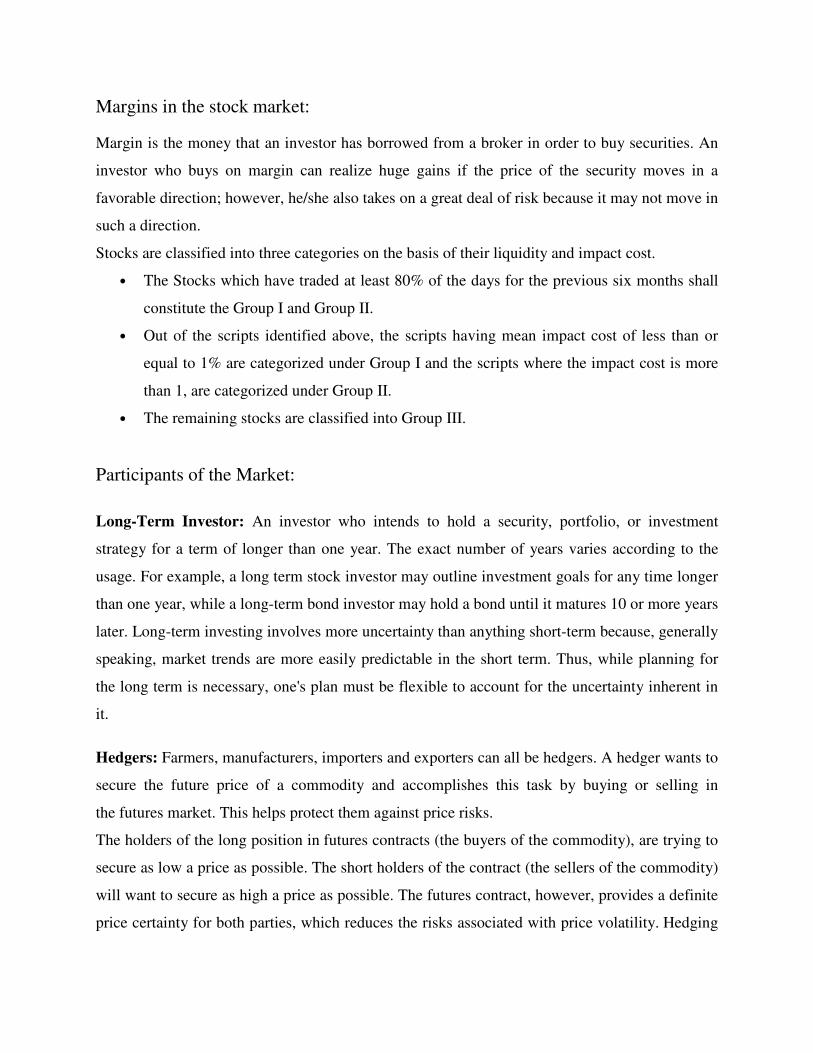
Margins in the stock market:
Margin is the money that an investor has borrowed from a broker in order to buy securities. An
investor who buys on margin can realize huge gains if the price of the security moves in a
favorable direction; however, he/she also takes on a great deal of risk because it may not move in
such a direction.
Stocks are classified into three categories on the basis of their liquidity and impact cost.
• The Stocks which have traded at least 80% of the days for the previous six months shall
constitute the Group I and Group II.
• Out of the scripts identified above, the scripts having mean impact cost of less than or
equal to 1% are categorized under Group I and the scripts where the impact cost is more
than 1, are categorized under Group II.
• The remaining stocks are classified into Group III.
Participants of the Market:
Long-Term Investor: An investor who intends to hold a security, portfolio, or investment
strategy for a term of longer than one year. The exact number of years varies according to the
usage. For example, a long term stock investor may outline investment goals for any time longer
than one year, while a long-term bond investor may hold a bond until it matures 10 or more years
later. Long-term investing involves more uncertainty than anything short-term because, generally
speaking, market trends are more easily predictable in the short term. Thus, while planning for
the long term is necessary, one's plan must be flexible to account for the uncertainty inherent in
it.
Hedgers: Farmers, manufacturers, importers and exporters can all be hedgers. A hedger wants to
secure the future price of a commodity and accomplishes this task by buying or selling in
the futures market. This helps protect them against price risks.
The holders of the long position in futures contracts (the buyers of the commodity), are trying to
secure as low a price as possible. The short holders of the contract (the sellers of the commodity)
will want to secure as high a price as possible. The futures contract, however, provides a definite
price certainty for both parties, which reduces the risks associated with price volatility. Hedging

by means of futures contracts can also be used as a means to lock in an acceptable price margin
between the cost of the raw material and the retail cost of the final product sold.
Speculators: Speculators are not trying to minimize risk but rather to benefit from the inherently
risky nature of the futures market. They aim to profit from the very price change that hedgers are
protecting themselves against. Hedgers want to minimize their risk no matter what they're
investing in, while speculators want to increase their risk and therefore maximize their profits.
In the futures market, a speculator buying a contract low in order to sell high in the future would
most likely be buying that contract from a hedger selling a contract low in anticipation of
declining prices in the future.
Arbitrators: A person who has been officially chosen to make a decision between two people or
groups who do not agree is known as Arbitrator. In commodity market Arbitrators are the person
who takes the advantage of a discrepancy between prices in two different markets. For example-
one could buy in the cash market and simultaneously sell in the future market. The person who
does this activity is called an arbitrageur.
2.4 Goal and Targets
Goal:
Compare the equity stocks and equity derivative (future) stocks of selected companies like ICICI
Bank, Associated Cement Companies (ACC), Indian Tobacco Company (ITC) with reference to
Kotak Securities Limited.
Targets:
• 04th
June to 08th
June: Gather knowledge about equity market and stocks, collecting
basic knowledge about Back office support system (BOSS) and centralized receipt
payment system (CRPS).
• 11th
June to 15th
June: Gather knowledge about advantages and disadvantages of equity
stocks, brief knowledge about terminal and observing the fluctuation of the equity and
future stocks of selected companies.

• 18th
June to 22nd
June: Introduction to derivative market and future stock and data
collection of selected equity and future stocks throughout the week.
• 25th
June to 29th
June: Gather knowledge about advantages and disadvantages of future
stocks, weekly data collection.
• 02nd
July to 06th
July: Collect the historical trading details of equity and future stocks of
selected companies throughout the week, analyzing and calculating risk and return.
• 09th
July to 13th
July: Compare equity and future stocks in terms of risk and return,
types of margin, duration, participants, expiry date of contract, etc.
• 16th
July to 20th
July: Interpretation of data and give recommendation and conclusion,
prepare the final report.
2.5 Expected Learning from the Internship
Most expected learning from this internship area is to understand the movement of the market. In
order to be successful in this field, as an investor needs to understand how the markets move and how to
interpret differences in the various market indexes and what they mean. All those movements are shown
in the Terminal as it is the main area from which the total trading is taken place.
Most traders are aware that market prices move because of buying and selling (i.e. trading), but
not many traders actually understand how buying and selling moves the market prices. This is
one of the most confusing aspects of trading (especially for new traders), but it is also one of the
most important.
The explanation of market price movement is composed of two parts. The first part explains how
buying volume and selling volume move the market price, and is quite easy to understand. The
second part explains how individual trades (as in individual transactions) are classified as either
buying or selling volume, and is the part that causes the most confusion for new traders.
Buying and Selling Volume
Every trade (as in every individual transaction) is either a buying trade or a selling trade. Buying
trades help move the market price upwards, and selling trades help move the market price
downwards. When there are more buying trades occurring in a market, the market price will
continue moving upwards. When they are more selling trades occurring in a market, the market
price will continue moving downwards.

Bid and Ask Volume
Every trade is classified as a buying trade or a selling trade based upon how the trade affects the
order book, and therefore the current market price.
The order book is composed of bid prices; ask prices, and the last price (i.e. the current market
price). The bid prices are the prices at which traders have placed limit orders to buy. The ask
prices are the prices at which traders have placed limit orders to sell. The last price is the most
recently traded price (i.e. the most recently filled order).
When a trader places a market order to buy, a trade will occur at the current ask price, because
the buy order is matched with the lowest available sell order. This causes the last price to change
to the ask price, as this is now the most recently traded price. As the ask price is always higher
than the bid price, the last price can only stay still or move up, and therefore this is classified as a
buying trade (i.e. buying volume).
Conversely, when a trader places a market order to sell, a trade will occur at the current bid
price, because the sell order is matched with the highest available buy order. This causes the last
price to change to the bid price, as this is now the most recently traded price. As the bid price is
always lower than the ask price, the last price can only stay still or move down, and therefore this
is classified as a selling trade (i.e. selling volume).
The software ODIN Client 10.0.0.2(Integrated) is used in terminal. The computer keyboard is
the main functional area. F1 is used to buy stocks, F2 is required to sell stocks, F3 is for order
booking, F5 is used to know the volume of particular stock, their opening, closing, high, low
prices, Alt F6 is used to the Net Client Position in a trading day, F8 is used to know the trading
details etc.
It is also learned that how to work in BOSS and CRPS. All the office related works and
information’s are recorded and audited by the operating system BOSS. It also helps to know
about the client’s demat account, his/her trading details, personal information. In CRPS all the
financial transactions of the company take place.

Chapter 3
3.1 Strategy Implementation
Details of resources:
For achieving objectives all the data/resources are collected through primary and secondary data
collection. The June month data of equity and future stocks of selected companies-ICICI Bank,
ITC, ACC are collected from the terminal screen of the computer after closing the market. This
data collection is called primary data collection. The previous two months i.e April and May
months data of equity and future stocks of selected companies-ICICI Bank, ITC, ACC are
collected from NSE website.
Planning efficiency:
For comparing the equity stocks and equity future contracts of the selected Companies, few
parameters are selected. The parameters are market returns, stock returns, standard deviations,
beta, expiry date, lot sizes, margin and duration. My plan to compare the equity stocks and equity
future contracts of the Companies includes –
1. Gathering basic knowledge about equity stocks and equity future contracts of the selected
Companies.
2. Observing the execution process of the terminal.
3. Observing the fluctuation of the selected equity stocks and equity future contracts.
4. Collecting the trading details of the selected equity stocks and equity future contracts.
5. Analyzing and comparing them based on the predetermined parameters.
Strategies applied:
To achieve the target I need to compare equity stocks and equity future contracts of the selected
companies on the basis of risk and return, types of margin, duration, expiry date of contract, lot
sizes. For this, I have applied few strategies. These are:
1. Calculation of Beta for comparing the risk and return of the selected stocks.
2. Descriptive statistics like tabular and graphical data representation (Column diagram) for
comparing the equity stocks and equity future contracts of the selected Companies.
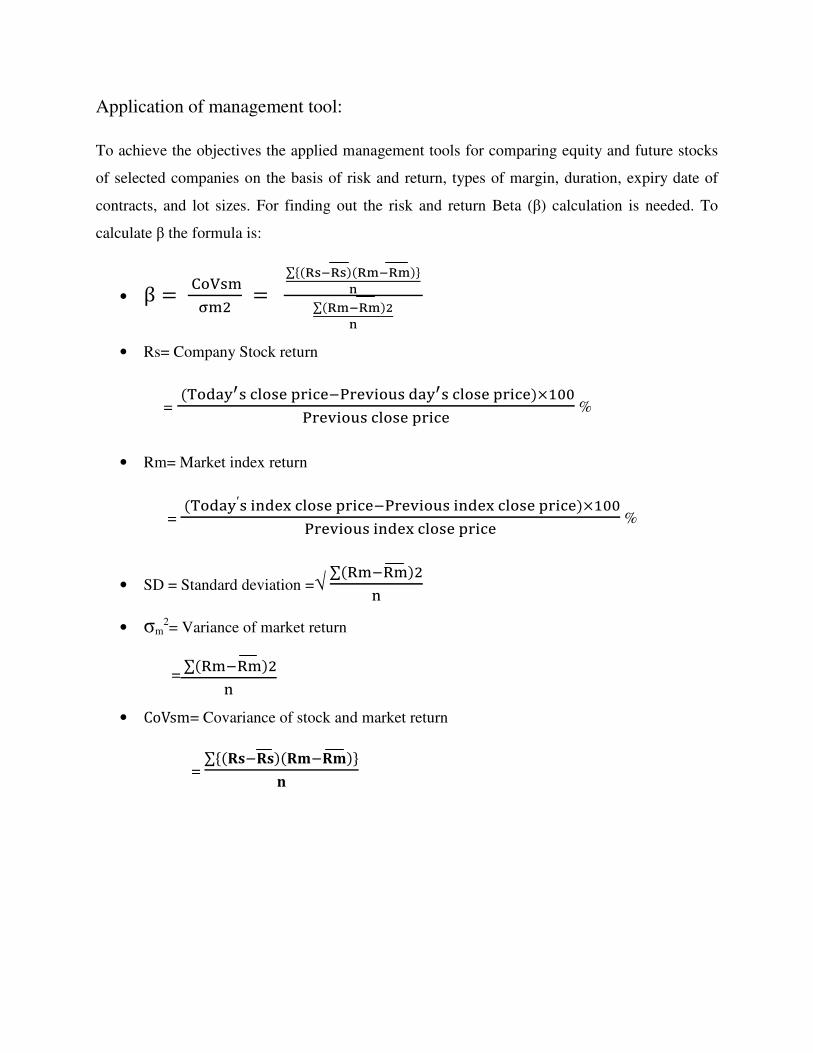
Application of management tool:
To achieve the objectives the applied management tools for comparing equity and future stocks
of selected companies on the basis of risk and return, types of margin, duration, expiry date of
contracts, and lot sizes. For finding out the risk and return Beta (β) calculation is needed. To
calculate β the formula is:
• β � �����
� �
∑� ������ ��������
∑ ��������
• Rs= Company Stock return
= ������� ����� �� ��!"��# �$� ����� ����� �� ���%&''
"��# �$� ����� �� �� %
• Rm= Market index return
= �����′� (��) ����� �� ��!"��# �$� (��) ����� �� ���%&''
"��# �$� (��) ����� �� �� %
• SD = Standard deviation =√ ∑ *�!*��
(
• σm2= Variance of market return
=
∑ *�!*��
(
• CoVsm= Covariance of stock and market return
= ∑� 01!01� 02!02��
3
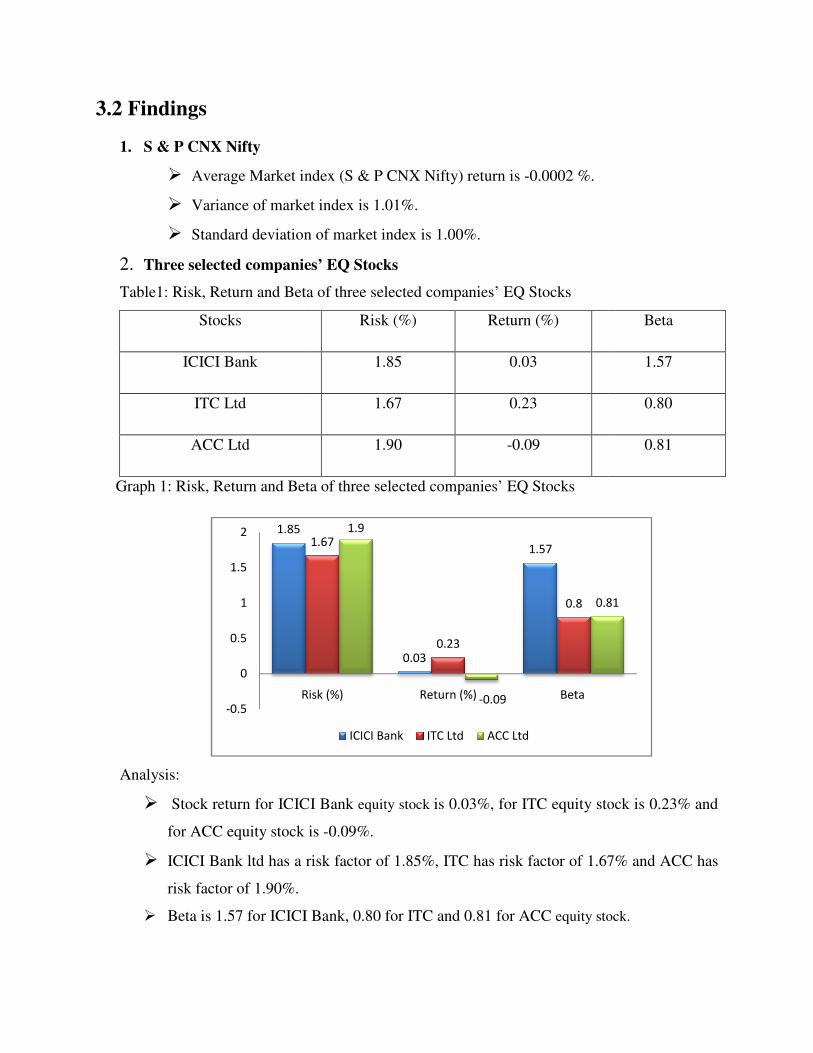
3.2 Findings
1. S & P CNX Nifty
� Average Market index
� Variance of market index
� Standard deviation of market index is 1.00%.
2. Three selected companies’
Table1: Risk, Return and Beta of three selected companies’ EQ Stocks
Stocks
ICICI Bank
ITC Ltd
ACC Ltd
Graph 1: Risk, Return and Beta of three selected companies’ EQ Stocks
Analysis:
� Stock return for ICICI Bank
for ACC equity stock is
� ICICI Bank ltd has a risk factor of 1.85%, ITC has risk factor of 1.67% and ACC has
risk factor of 1.90%.
� Beta is 1.57 for ICICI Bank
1.85
-0.5
0
0.5
1
1.5
2
Risk (%)
Market index (S & P CNX Nifty) return is -0.0002 %.
Variance of market index is 1.01%.
Standard deviation of market index is 1.00%.
Three selected companies’ EQ Stocks
Risk, Return and Beta of three selected companies’ EQ Stocks
Risk (%) Return (%)
1.85 0.03
1.67 0.23
1.90 -0.09
Risk, Return and Beta of three selected companies’ EQ Stocks
Stock return for ICICI Bank equity stock is 0.03%, for ITC equity stock is 0.23% and
for ACC equity stock is -0.09%.
ltd has a risk factor of 1.85%, ITC has risk factor of 1.67% and ACC has
for ICICI Bank, 0.80 for ITC and 0.81 for ACC equity stock
0.03
1.571.67
0.23
0.8
1.9
-0.09
0.81
Risk (%) Return (%) Beta
ICICI Bank ITC Ltd ACC Ltd
Beta
1.57
0.80
0.81
stock is 0.23% and
ltd has a risk factor of 1.85%, ITC has risk factor of 1.67% and ACC has
equity stock.
0.81

Interpretation:
� Beta of ICICI Bank ltd is
market as a whole. Risk of the stock is 1.85% and rate of return is only 0.03%.
� Beta of ITC ltd is 0.80
a whole. Risk of the stock is 1.67
� Beta of ACC ltd is 0.81
as a whole. Risk of the stock is 1.90% and rate of return is only
Table 2: Average risk of selected equity stocks
Factor ICICI Bank
Risk (%) 1.85
Average Risk= 4.6
7 % = 1.81%
Graph 2: Average risk of selected equity stocks
Analysis:
� ACC has the highest risk factor of 1.90% with 0.81
� ITC has the lowest risk factor of 1.67% with 0.80
� On an average, equity stocks have
1.85
0
1
2
3
4
5
6
ICICI Bank
Beta of ICICI Bank ltd is 1.57 which is more than 1. It shows more vol
market as a whole. Risk of the stock is 1.85% and rate of return is only 0.03%.
0.80 which is less than 1. It shows less volatility than the market as
whole. Risk of the stock is 1.67% and rate of return is only 0.23%.
0.81 which is less than 1. It shows less volatility than the market
as a whole. Risk of the stock is 1.90% and rate of return is only -0.09%.
Table 2: Average risk of selected equity stocks
ICICI Bank ITC ACC
1.85 1.67 1.90
% = 1.81%
Graph 2: Average risk of selected equity stocks
risk factor of 1.90% with 0.81 beta.
risk factor of 1.67% with 0.80 beta.
On an average, equity stocks have the risk factor of 1.81%.
1.67 1.9
5.42
ITC ACC Total
Risk (%)
which is more than 1. It shows more volatility than the
market as a whole. Risk of the stock is 1.85% and rate of return is only 0.03%.
volatility than the market as
which is less than 1. It shows less volatility than the market
0.09%.
Total
5.42

Interpretation:
Risk is a major factor influence all type
risk factor is 1.81% and the risk factor of the market is 1.00%, it is showing equities are more
risky.
Table 3: Average return of selected equity stocks
Factor ICICI Bank
Return (%) 0.03
Average Risk= '.&8
7 % = 0.06%
Graph 3: Average return of selected equity stocks
Analysis:
� ITC has got the highest return of 0.23
� ACC has got the lowest
� On an average, equity stocks have
Interpretation:
Return is a major factor influencing factor to all type of investors. In the above selected
equity stocks average return is 0.17, compared to market return
stock returns are good and it will attract more and more customers.
0.03
-0.15
-0.1
-0.05
0
0.05
0.1
0.15
0.2
0.25
ICICI Bank
Risk is a major factor influence all type of investors. In above selected equity stocks average
risk factor is 1.81% and the risk factor of the market is 1.00%, it is showing equities are more
rage return of selected equity stocks
ICICI Bank ITC ACC
0.03 0.23 -0.09
% = 0.06%
Graph 3: Average return of selected equity stocks
ITC has got the highest return of 0.23%.
lowest return of -0.09%.
On an average, equity stocks have got the return of 0.17%.
Return is a major factor influencing factor to all type of investors. In the above selected
equity stocks average return is 0.17, compared to market return of -0.0002%. Selected equity
stock returns are good and it will attract more and more customers.
0.03
0.23
-0.09
0.17
ICICI Bank ITC ACC Total
Return (%)
of investors. In above selected equity stocks average
risk factor is 1.81% and the risk factor of the market is 1.00%, it is showing equities are more
Total
0.17
Return is a major factor influencing factor to all type of investors. In the above selected
0.0002%. Selected equity
3. Three selected companies’ EQ
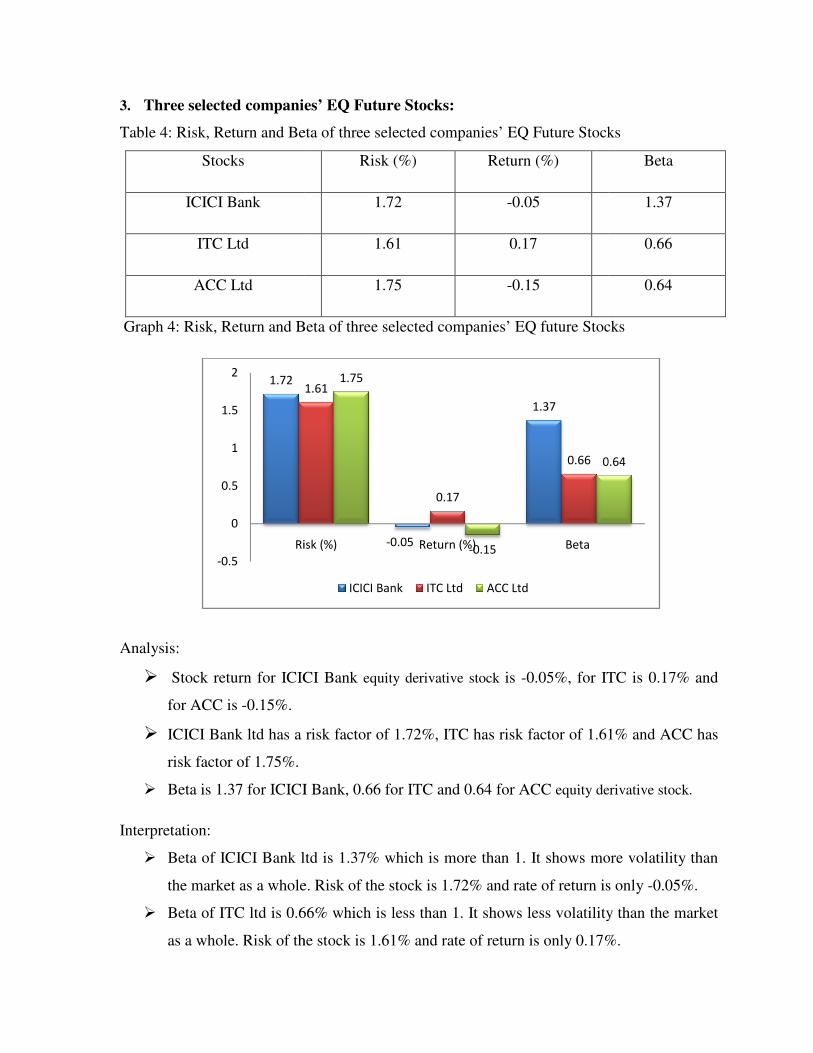
Table 4: Risk, Return and Beta of three selected companies’ EQ
Stocks
ICICI Bank
ITC Ltd
ACC Ltd
Graph 4: Risk, Return and Beta of three selected companies’ EQ
Analysis:
� Stock return for ICICI Bank
for ACC is -0.15%.
� ICICI Bank ltd has a risk factor of 1.72%, ITC has risk factor of 1.61
risk factor of 1.75%.
� Beta is 1.37 for ICICI Bank
Interpretation:
� Beta of ICICI Bank ltd is
the market as a whole. Risk of the stock is 1.72
� Beta of ITC ltd is 0.66
as a whole. Risk of the
1.72
-0.5
0
0.5
1
1.5
2
Risk (%)
Three selected companies’ EQ Future Stocks:
Risk, Return and Beta of three selected companies’ EQ Future Stocks
Risk (%) Return (%)
1.72 -0.05
1.61 0.17
1.75 -0.15
Risk, Return and Beta of three selected companies’ EQ future Stocks
Stock return for ICICI Bank equity derivative stock is -0.05%, for ITC
ltd has a risk factor of 1.72%, ITC has risk factor of 1.61
for ICICI Bank, 0.66 for ITC and 0.64 for ACC equity derivative
Beta of ICICI Bank ltd is 1.37% which is more than 1. It shows more volatility than
whole. Risk of the stock is 1.72% and rate of return is only
0.66% which is less than 1. It shows less volatility than the market
as a whole. Risk of the stock is 1.61% and rate of return is only 0.17%.
-0.05
1.37
1.61
0.17
0.66
1.75
-0.15
0.64
Risk (%) Return (%) Beta
ICICI Bank ITC Ltd ACC Ltd
Stocks
Beta
1.37
0.66
0.64
Stocks
%, for ITC is 0.17% and
ltd has a risk factor of 1.72%, ITC has risk factor of 1.61% and ACC has
derivative stock.
7% which is more than 1. It shows more volatility than
% and rate of return is only -0.05%.
% which is less than 1. It shows less volatility than the market
%.
0.64
� Beta of ACC ltd is 0.64
as a whole. Risk of the stock is 1.
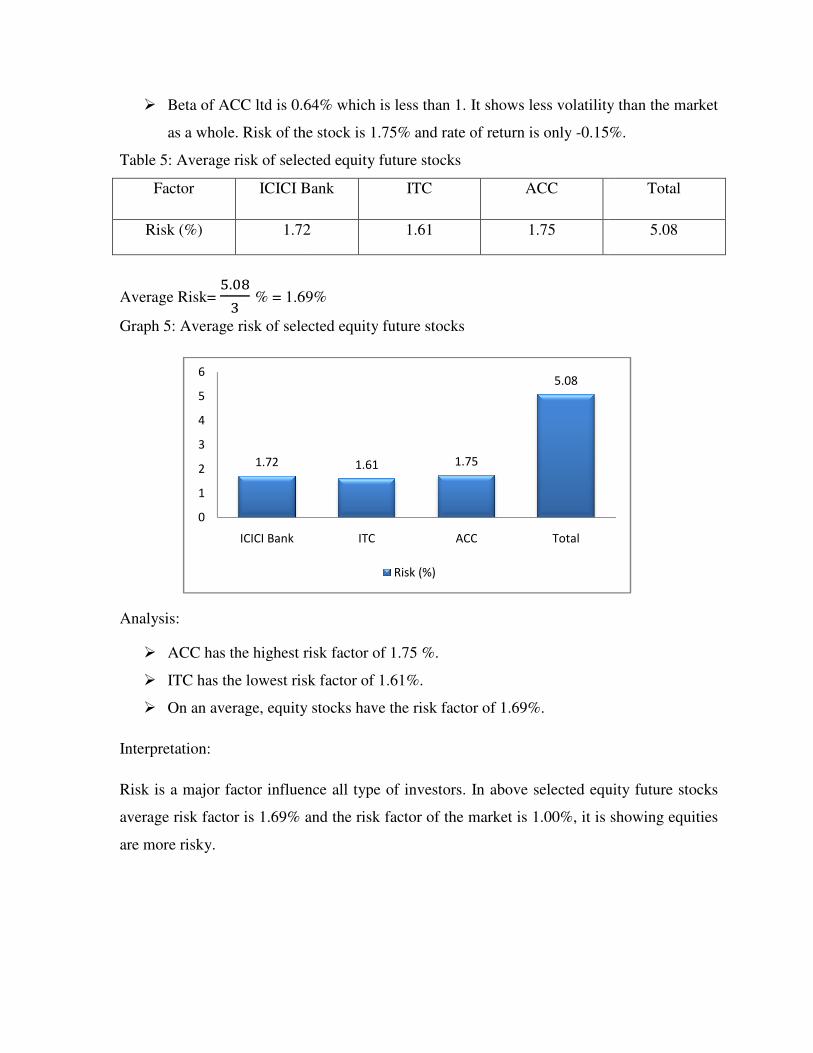
Table 5: Average risk of selected equity
Factor ICICI Bank
Risk (%) 1.72
Average Risk= 4.'9
7 % = 1.69
Graph 5: Average risk of selected equity
Analysis:
� ACC has the highest risk factor of 1.
� ITC has the lowest risk factor of 1.61%
� On an average, equity stock
Interpretation:
Risk is a major factor influence all type of investors. In above selected equity
average risk factor is 1.69% and the risk factor of the market is 1.00%, it is showin
are more risky.
1.72
0
1
2
3
4
5
6
ICICI Bank
0.64% which is less than 1. It shows less volatility than the market
as a whole. Risk of the stock is 1.75% and rate of return is only -0.15
: Average risk of selected equity future stocks
ICICI Bank ITC ACC
72 1.61 1.75
= 1.69%
: Average risk of selected equity future stocks
ACC has the highest risk factor of 1.75 %.
s the lowest risk factor of 1.61%.
On an average, equity stocks have the risk factor of 1.69%.
Risk is a major factor influence all type of investors. In above selected equity
% and the risk factor of the market is 1.00%, it is showin
1.61 1.75
5.08
ITC ACC Total
Risk (%)
% which is less than 1. It shows less volatility than the market
0.15%.
Total
5.08
Risk is a major factor influence all type of investors. In above selected equity future stocks
% and the risk factor of the market is 1.00%, it is showing equities
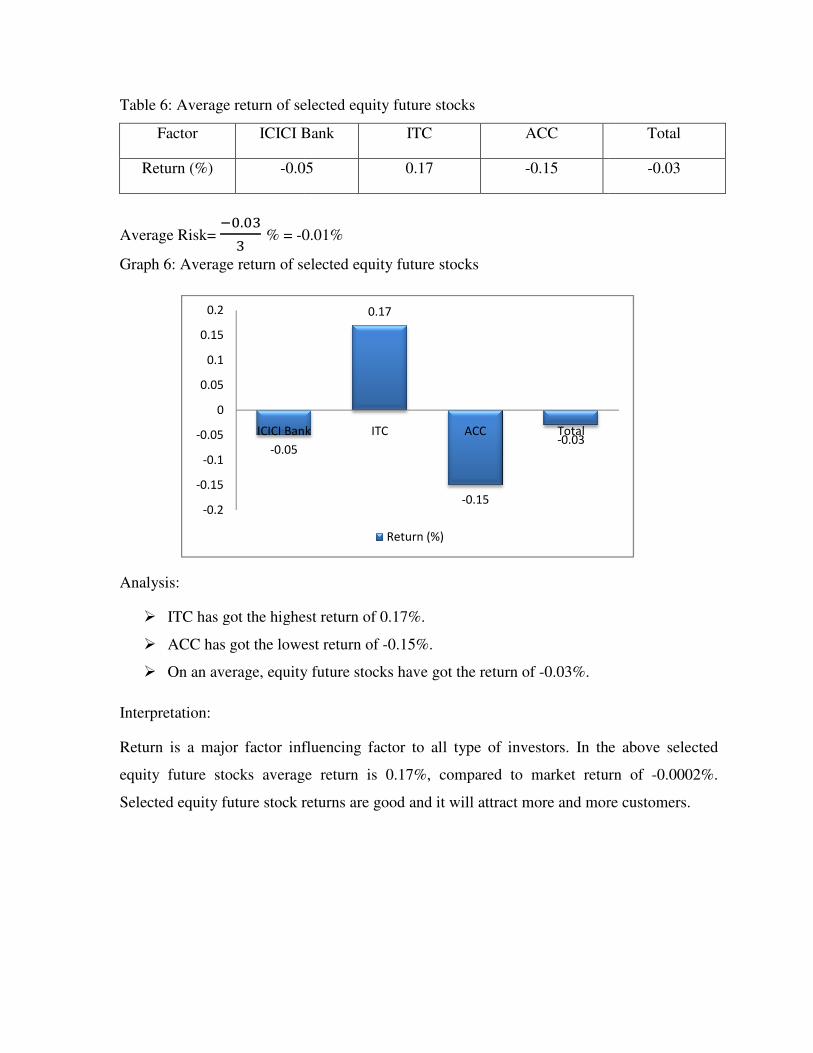
Table 6: Average return of selected equity
Factor ICICI Bank
Return (%) -0.05
Average Risk= !'.'7
7 % = -0.01
Graph 6: Average return of selected equity
Analysis:
� ITC has got the highest return of
� ACC has got the lowest return of
� On an average, equity
Interpretation:
Return is a major factor influencing factor to all type of investors. In the above selected
equity future stocks average return is 0.17
Selected equity future stock returns are good and it will attract more and more
-0.05
-0.2
-0.15
-0.1
-0.05
0
0.05
0.1
0.15
0.2
ICICI Bank
: Average return of selected equity future stocks
ICICI Bank ITC ACC
05 0.17 -0.15
0.01%
: Average return of selected equity future stocks
ITC has got the highest return of 0.17%.
ACC has got the lowest return of -0.15%.
On an average, equity future stocks have got the return of -0.03%.
Return is a major factor influencing factor to all type of investors. In the above selected
stocks average return is 0.17%, compared to market return of
stock returns are good and it will attract more and more
0.17
-0.15
-0.03ICICI Bank ITC ACC Total
Return (%)
Total
-0.03
Return is a major factor influencing factor to all type of investors. In the above selected
, compared to market return of -0.0002%.
stock returns are good and it will attract more and more customers.

4. Comparison between selected companies’ equity and equity future stocks in terms
of risk factor:
Table 7: Risk comparison
Factor
Risk (%)
Graph 7: Risk comparison
Analysis:
� Equity stocks have the risk on an average of 1.81%.
� Equity future stocks have the risk on an average
Interpretation:
Equity stocks and equity derivative stocks are subjected to market risk. Based on the above
analysis equity future stocks have an average risk of 1.69% which is compared to equity
stocks risk of 1.81% is lower. Those who would like to take risk can go for
1.6
1.65
1.7
1.75
1.8
1.85
Comparison between selected companies’ equity and equity future stocks in terms
Equity Stock Equity future Stock
1.81
have the risk on an average of 1.81%.
stocks have the risk on an average of 1.69%.
Equity stocks and equity derivative stocks are subjected to market risk. Based on the above
analysis equity future stocks have an average risk of 1.69% which is compared to equity
stocks risk of 1.81% is lower. Those who would like to take risk can go for equity stocks.
1.81
1.69
Equity Stock Equity future Stock
Risk (%)
Comparison between selected companies’ equity and equity future stocks in terms
Equity future Stock
1.69
Equity stocks and equity derivative stocks are subjected to market risk. Based on the above
analysis equity future stocks have an average risk of 1.69% which is compared to equity
equity stocks.
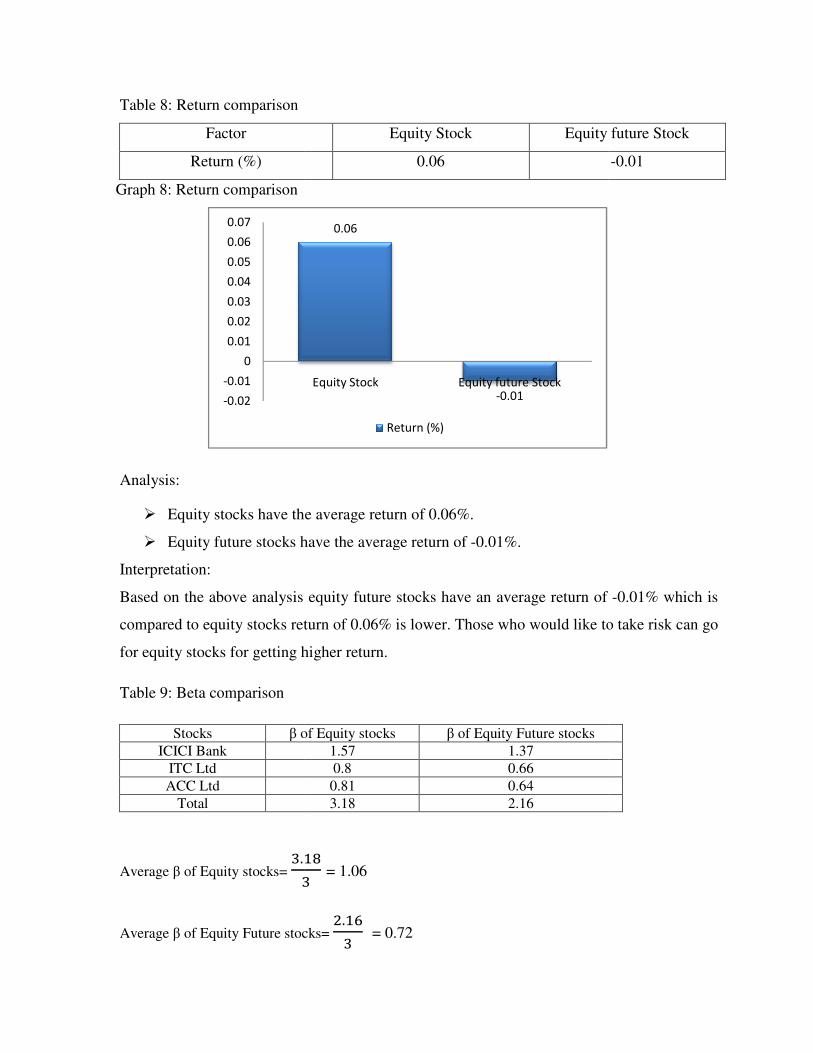
Table 8: Return comparison
Factor
Return (%)
Graph 8: Return comparison
Analysis:
� Equity stocks have the
� Equity future stocks have the average
Interpretation:
Based on the above analysis equity future stocks have
compared to equity stocks return of 0.06
for equity stocks for getting higher return.
Table 9: Beta comparison
Stocks β of Equity stocks
ICICI Bank
ITC Ltd
ACC Ltd
Total
Average β of Equity stocks= 7.&9
7
Average β of Equity Future stocks
-0.02
-0.01
0
0.01
0.02
0.03
0.04
0.05
0.06
0.07
Equity Stock Equity future Stock
0.06
have the average return of 0.06%.
stocks have the average return of -0.01%.
Based on the above analysis equity future stocks have an average return of
return of 0.06% is lower. Those who would like to take risk can go
stocks for getting higher return.
β of Equity stocks β of Equity Future stocks
1.57 1.37
0.8 0.66
0.81 0.64
3.18 2.16
&9
7 = 1.06
Future stocks= .&:
7 = 0.72
0.06
-0.01Equity Stock Equity future Stock
Return (%)
Equity future Stock
-0.01
an average return of -0.01% which is
% is lower. Those who would like to take risk can go
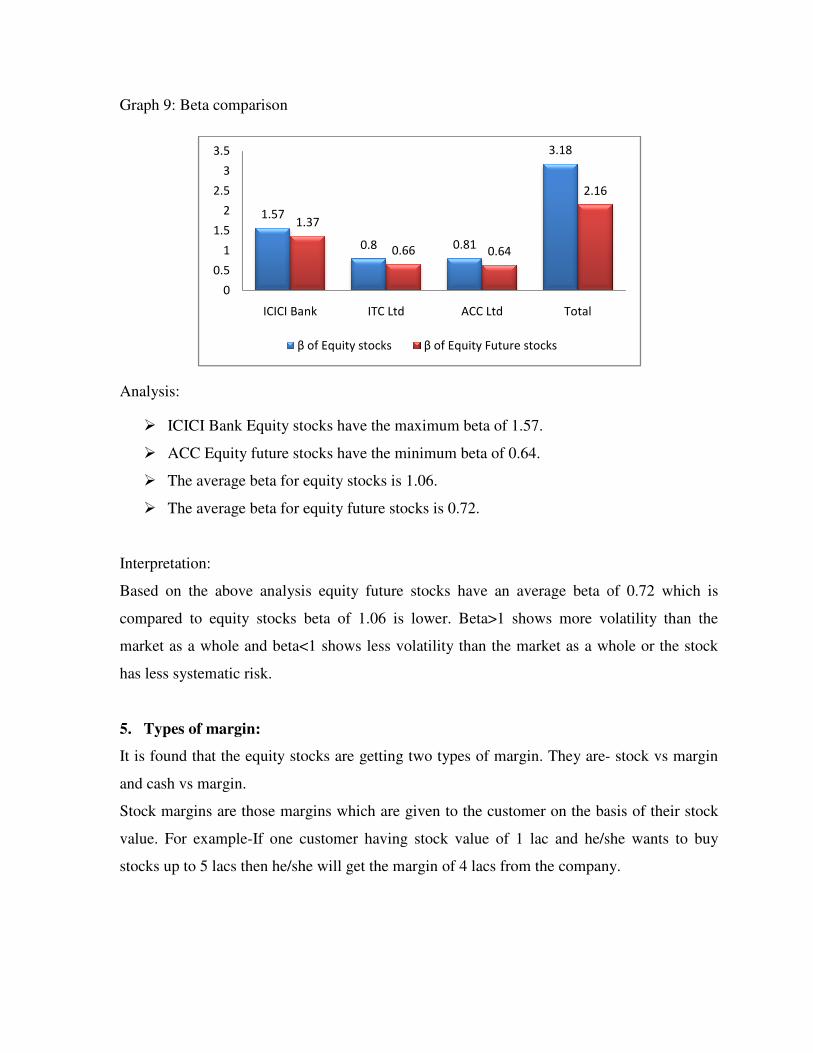
Graph 9: Beta comparison
Analysis:
� ICICI Bank Equity stocks
� ACC Equity future stocks have the
� The average beta for equity stocks is 1.06
� The average beta for equity future stocks is 0.72
Interpretation:
Based on the above analysis equity future stocks have an average
compared to equity stocks beta
market as a whole and beta<1 shows less volatility than the market as a whole
has less systematic risk.
5. Types of margin:
It is found that the equity stocks are gett
and cash vs margin.
Stock margins are those margins which
value. For example-If one customer having stock value of 1 lac and he/she wants to buy
stocks up to 5 lacs then he/she will get the margin of 4 lacs from the company.
1.571.37
0
0.5
1
1.5
2
2.5
3
3.5
ICICI Bank
β
Equity stocks have the maximum beta of 1.57.
stocks have the minimum beta of 0.64.
beta for equity stocks is 1.06.
or equity future stocks is 0.72.
the above analysis equity future stocks have an average beta of
beta of 1.06 is lower. Beta>1 shows more volatility than the
market as a whole and beta<1 shows less volatility than the market as a whole
d that the equity stocks are getting two types of margin. They are-
Stock margins are those margins which are given to the customer on the basis of their stock
If one customer having stock value of 1 lac and he/she wants to buy
stocks up to 5 lacs then he/she will get the margin of 4 lacs from the company.
0.8 0.81
3.18
1.37
0.66 0.64
2.16
ICICI Bank ITC Ltd ACC Ltd Total
β of Equity stocks β of Equity Future stocks
of 0.72 which is
Beta>1 shows more volatility than the
market as a whole and beta<1 shows less volatility than the market as a whole or the stock
- stock vs margin
are given to the customer on the basis of their stock
If one customer having stock value of 1 lac and he/she wants to buy
stocks up to 5 lacs then he/she will get the margin of 4 lacs from the company.
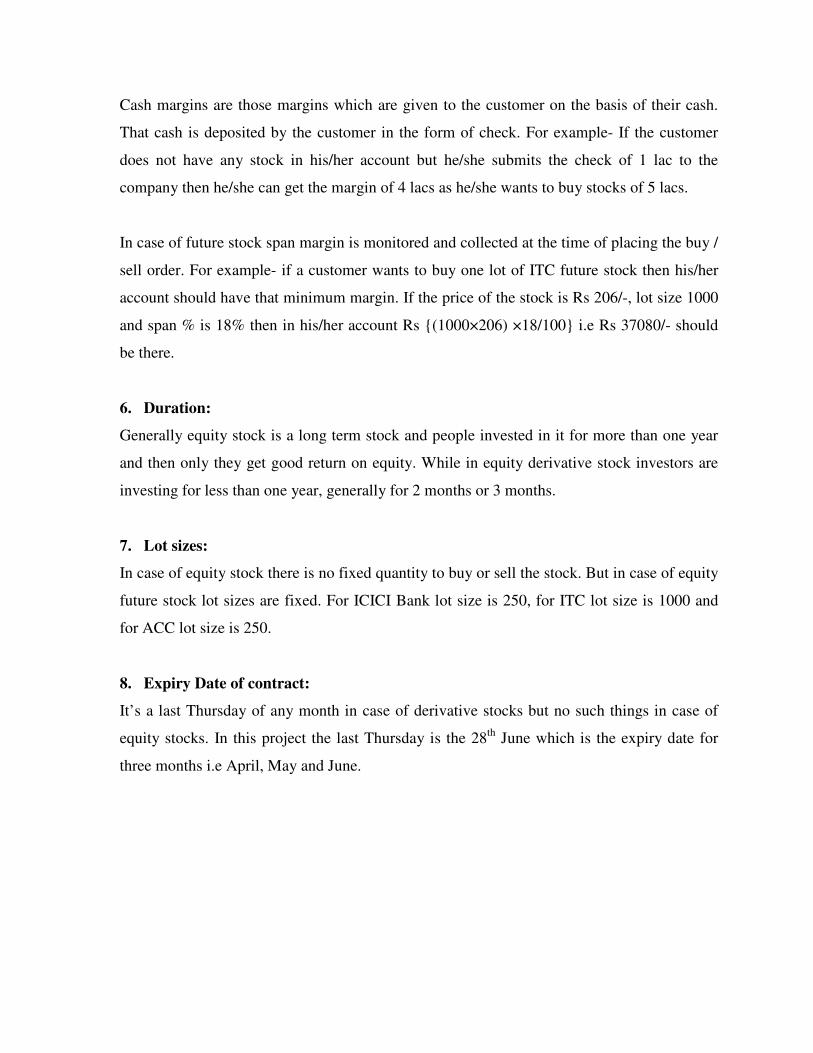
Cash margins are those margins which are given to the customer on the basis of their cash.
That cash is deposited by the customer in the form of check. For example- If the customer
does not have any stock in his/her account but he/she submits the check of 1 lac to the
company then he/she can get the margin of 4 lacs as he/she wants to buy stocks of 5 lacs.
In case of future stock span margin is monitored and collected at the time of placing the buy /
sell order. For example- if a customer wants to buy one lot of ITC future stock then his/her
account should have that minimum margin. If the price of the stock is Rs 206/-, lot size 1000
and span % is 18% then in his/her account Rs {(1000×206) ×18/100} i.e Rs 37080/- should
be there.
6. Duration:
Generally equity stock is a long term stock and people invested in it for more than one year
and then only they get good return on equity. While in equity derivative stock investors are
investing for less than one year, generally for 2 months or 3 months.
7. Lot sizes:
In case of equity stock there is no fixed quantity to buy or sell the stock. But in case of equity
future stock lot sizes are fixed. For ICICI Bank lot size is 250, for ITC lot size is 1000 and
for ACC lot size is 250.
8. Expiry Date of contract:
It’s a last Thursday of any month in case of derivative stocks but no such things in case of
equity stocks. In this project the last Thursday is the 28th June which is the expiry date for
three months i.e April, May and June.
3.3 Analyses of performance
From the above findings the analyses of the performances are follows:
� According to the first objective equity stocks have the average risk factor of 1.81% which
is more than the average risk factor 1.69% of equity derivatives stocks that means equity
stocks are more risky than equity derivatives stocks.
The average stock return of equity stocks is 0.06% and the average stock return of equity
derivatives stocks is -0.01%. That means those who would like to take risk can go for
equity stocks for getting higher return.
Based on the above analysis equity future stocks have an average beta of 0.72 which is
lower as compared to equity stocks beta of 1.06. Equity stocks Beta>1 shows more
volatility than the market as a whole or the stocks carry more unavoidable risk and equity
derivative stocks beta<1 shows less volatility than the market as a whole or the stock has
less systematic risk.
� According to the second objective margin for equity stocks are less risky than equity
derivative stocks. It will be easily understand by an example- If a customer buys an
equity stock of ICICI bank at Rs 860.10 and after that the price fells up to Rs 856.95 then
the customer can wait for next price increase. But if the same case is happened in equity
derivative stock then the loss amount should immediately deduct from his/her account.
In terms of duration equity stocks are invested for more than one year and equity
derivative stocks are invested for maximum three months.
There is no fixed lot size for buying or selling equity stocks. Customers can buy/sell as
much they want. But in case of equity derivative stocks lot size is fixed and customers are
bound to buy/sell that amount of stock. The person who buys/sells ITC equity derivative
stocks, the minimum quantity of stock is 1000. In case of ICICI Bank and ACC the
minimum quantity is 250.
Expiry date for derivative stocks is the last Thursday of any month. No such limit is there
for equity stocks.
� The third objective of the study is to provide information about the pros and cons of
investing in equity and equity derivative stocks. There are many advantages of investing
in those stocks if it is made with a systematic plan of investment and vice versa.
3.4 Limitations
The limitations of the study are:
� Three companies are selected for comparison. If the numbers of selected companies are
more, then the comparison will become more effective and fruitful.
� The three months data will collect for calculating the risk and return of those selected
companies but the risk and return will calculate for more than one year then the value of
beta will be more affective.
3.5 Conclusions
It can be concluded that the findings of the research are quite eye-opening and thus the objective
of this study has been successfully achieved in comparing the equity stocks and equity
derivatives stocks of the selected Companies. These findings are significant in the aspect that it
gives an insight to the volatility of the stocks so that the investors can easily choose the right
stock for investment. This research work can also be used by the broking firms to enhance their
customer service as well as brand image. They can utilize these findings to understand the actual
need of their customers and predict their behavior. And further research work needs to be done in
this area to analyze the situation critically.

Chapter 4
4.1 Annexure
S&P CNX NIFTY:
Calculation of Market Return and Standard Deviation
Date
Script Value
Return(Rm) in %
(Rm-Rm)
(Rm-Rm)2
30-Mar-2012 5295.55
02-Apr-2012 5317.90 0.42 0.4202 0.176568
03-Apr-2012 5358.50 0.76 0.7602 0.577904
04-Apr-2012 5322.90 -0.66 -0.6598 0.435336
09-Apr-2012 5234.40 -1.66 -1.6598 2.754936
10-Apr-2012 5243.60 0.18 0.1802 0.032472
11-Apr-2012 5226.85 -0.32 -0.3198 0.102272
12-Apr-2012 5276.85 0.96 0.9602 0.921984
13-Apr-2012 5207.45 -1.32 -1.3198 1.741872
16-Apr-2012 5226.20 0.36 0.3602 0.129744
17-Apr-2012 5289.70 1.22 1.2202 1.488888
18-Apr-2012 5300.00 0.19 0.1902 0.036176
19-Apr-2012 5332.40 0.61 0.6102 0.372344
20-Apr-2012 5290.85 -0.78 -0.7798 0.608088
23-Apr-2012 5200.60 -1.71 -1.7098 2.923416
24-Apr-2012 5222.65 0.42 0.4202 0.176568
25-Apr-2012 5202.00 -0.39 -0.3898 0.151944
26-Apr-2012 5189.00 -0.25 -0.2498 0.0624
27-Apr-2012 5190.60 0.03 0.0302 0.000912
28-Apr-2012 5209.00 0.35 0.3502 0.12264
30-Apr-2012 5248.15 0.75 0.7502 0.5628
02-May-2012 5239.15 -0.17 -0.1698 0.028832
03-May-2012 5188.40 -0.97 -0.9698 0.940512
04-May-2012 5086.85 -1.96 -1.9598 3.840816
07-May-2012 5114.15 0.54 0.5402 0.291816
08-May-2012 4999.95 -2.23 -2.2298 4.972008
09-May-2012 4974.80 -0.50 -0.4998 0.2498
10-May-2012 4965.70 -0.18 -0.1798 0.032328
11-May-2012 4928.90 -0.74 -0.7398 0.547304
14-May-2012 4907.80 -0.43 -0.4298 0.184728
15-May-2012 4942.80 0.71 0.7102 0.504384
16-May-2012 4858.25 -1.71 -1.7098 2.923416
17-May-2012 4870.20 0.25 0.2502 0.0626
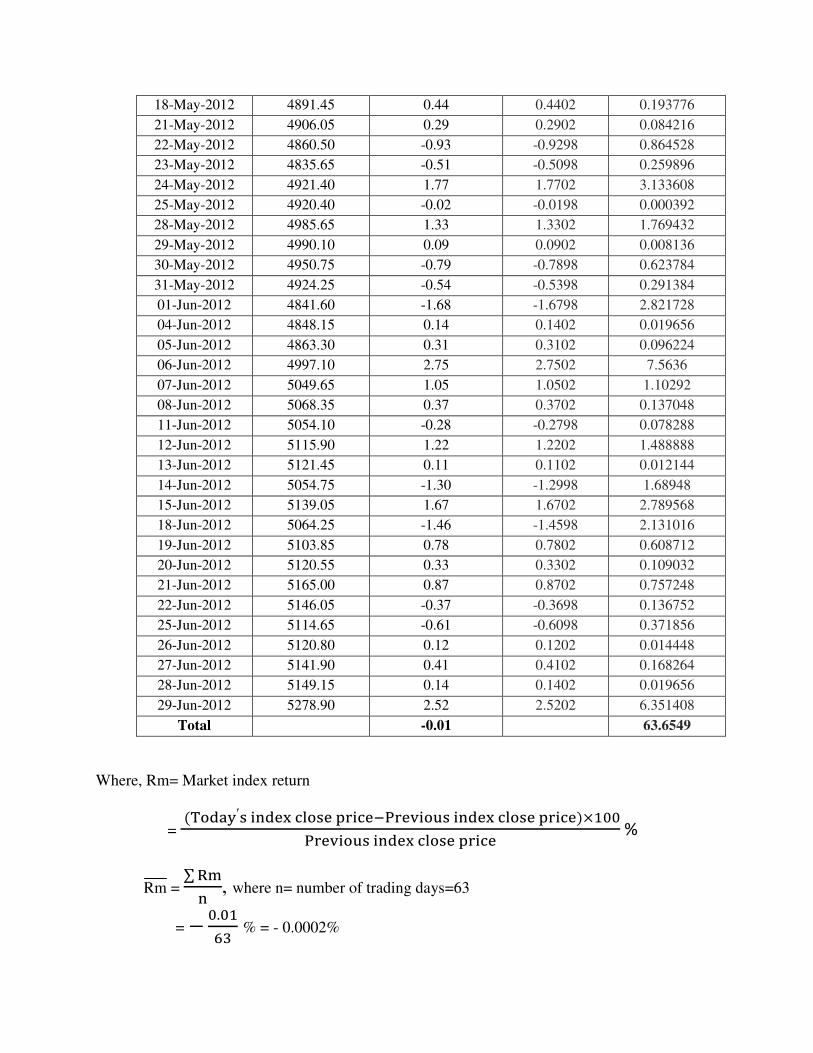
18-May-2012 4891.45 0.44 0.4402 0.193776
21-May-2012 4906.05 0.29 0.2902 0.084216
22-May-2012 4860.50 -0.93 -0.9298 0.864528
23-May-2012 4835.65 -0.51 -0.5098 0.259896
24-May-2012 4921.40 1.77 1.7702 3.133608
25-May-2012 4920.40 -0.02 -0.0198 0.000392
28-May-2012 4985.65 1.33 1.3302 1.769432
29-May-2012 4990.10 0.09 0.0902 0.008136
30-May-2012 4950.75 -0.79 -0.7898 0.623784
31-May-2012 4924.25 -0.54 -0.5398 0.291384
01-Jun-2012 4841.60 -1.68 -1.6798 2.821728
04-Jun-2012 4848.15 0.14 0.1402 0.019656
05-Jun-2012 4863.30 0.31 0.3102 0.096224
06-Jun-2012 4997.10 2.75 2.7502 7.5636
07-Jun-2012 5049.65 1.05 1.0502 1.10292
08-Jun-2012 5068.35 0.37 0.3702 0.137048
11-Jun-2012 5054.10 -0.28 -0.2798 0.078288
12-Jun-2012 5115.90 1.22 1.2202 1.488888
13-Jun-2012 5121.45 0.11 0.1102 0.012144
14-Jun-2012 5054.75 -1.30 -1.2998 1.68948
15-Jun-2012 5139.05 1.67 1.6702 2.789568
18-Jun-2012 5064.25 -1.46 -1.4598 2.131016
19-Jun-2012 5103.85 0.78 0.7802 0.608712
20-Jun-2012 5120.55 0.33 0.3302 0.109032
21-Jun-2012 5165.00 0.87 0.8702 0.757248
22-Jun-2012 5146.05 -0.37 -0.3698 0.136752
25-Jun-2012 5114.65 -0.61 -0.6098 0.371856
26-Jun-2012 5120.80 0.12 0.1202 0.014448
27-Jun-2012 5141.90 0.41 0.4102 0.168264
28-Jun-2012 5149.15 0.14 0.1402 0.019656
29-Jun-2012 5278.90 2.52 2.5202 6.351408
Total -0.01 63.6549
Where, Rm= Market index return
= �����′� (��) ����� �� ��!"��# �$� (��) ����� �� ���%&''
"��# �$� (��) ����� �� �� %
Rm = ∑ *�
(, where n= number of trading days=63
= ; '.'&
:7 % = - 0.0002%
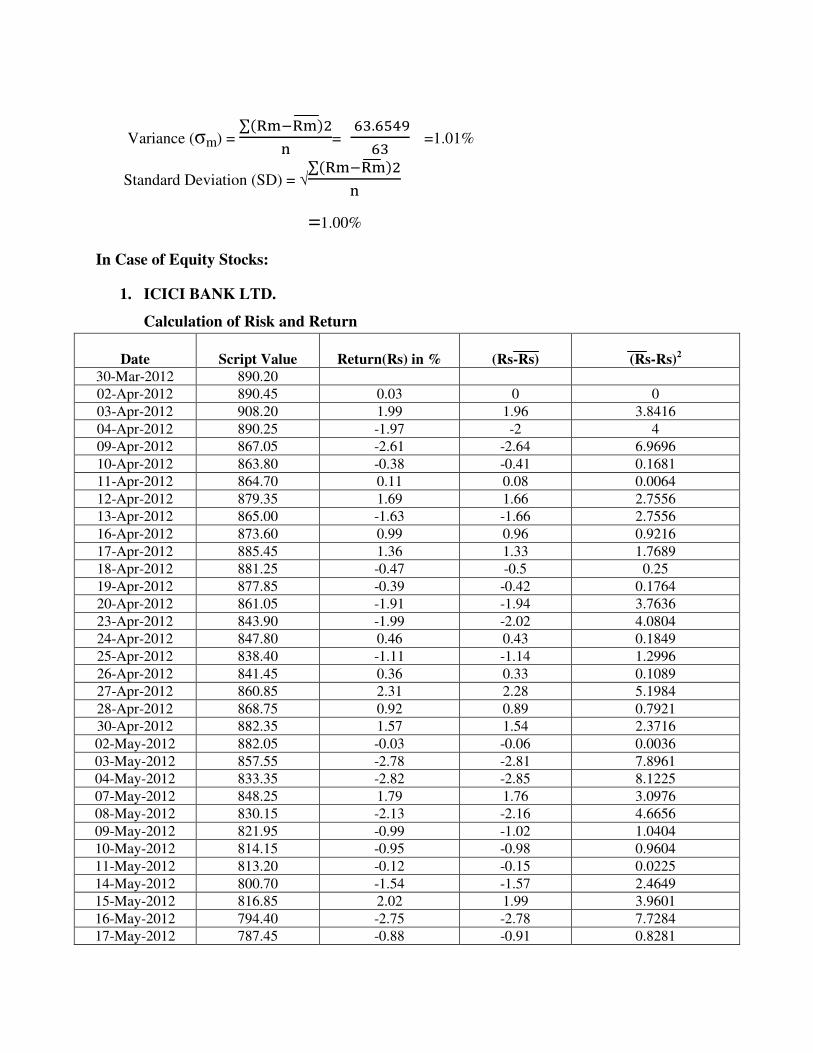
Variance (σm) = ∑ *�!*��
(=
:7.:46<
:7 =1.01%
Standard Deviation (SD) = √∑ *�!*��
(
=1.00%
In Case of Equity Stocks:
1. ICICI BANK LTD.
Calculation of Risk and Return
Date
Script Value
Return(Rs) in %
(Rs-Rs)
(Rs-Rs)2
30-Mar-2012 890.20
02-Apr-2012 890.45 0.03 0 0
03-Apr-2012 908.20 1.99 1.96 3.8416
04-Apr-2012 890.25 -1.97 -2 4
09-Apr-2012 867.05 -2.61 -2.64 6.9696
10-Apr-2012 863.80 -0.38 -0.41 0.1681
11-Apr-2012 864.70 0.11 0.08 0.0064
12-Apr-2012 879.35 1.69 1.66 2.7556
13-Apr-2012 865.00 -1.63 -1.66 2.7556
16-Apr-2012 873.60 0.99 0.96 0.9216
17-Apr-2012 885.45 1.36 1.33 1.7689
18-Apr-2012 881.25 -0.47 -0.5 0.25
19-Apr-2012 877.85 -0.39 -0.42 0.1764
20-Apr-2012 861.05 -1.91 -1.94 3.7636
23-Apr-2012 843.90 -1.99 -2.02 4.0804
24-Apr-2012 847.80 0.46 0.43 0.1849
25-Apr-2012 838.40 -1.11 -1.14 1.2996
26-Apr-2012 841.45 0.36 0.33 0.1089
27-Apr-2012 860.85 2.31 2.28 5.1984
28-Apr-2012 868.75 0.92 0.89 0.7921
30-Apr-2012 882.35 1.57 1.54 2.3716
02-May-2012 882.05 -0.03 -0.06 0.0036
03-May-2012 857.55 -2.78 -2.81 7.8961
04-May-2012 833.35 -2.82 -2.85 8.1225
07-May-2012 848.25 1.79 1.76 3.0976
08-May-2012 830.15 -2.13 -2.16 4.6656
09-May-2012 821.95 -0.99 -1.02 1.0404
10-May-2012 814.15 -0.95 -0.98 0.9604
11-May-2012 813.20 -0.12 -0.15 0.0225
14-May-2012 800.70 -1.54 -1.57 2.4649
15-May-2012 816.85 2.02 1.99 3.9601
16-May-2012 794.40 -2.75 -2.78 7.7284
17-May-2012 787.45 -0.88 -0.91 0.8281
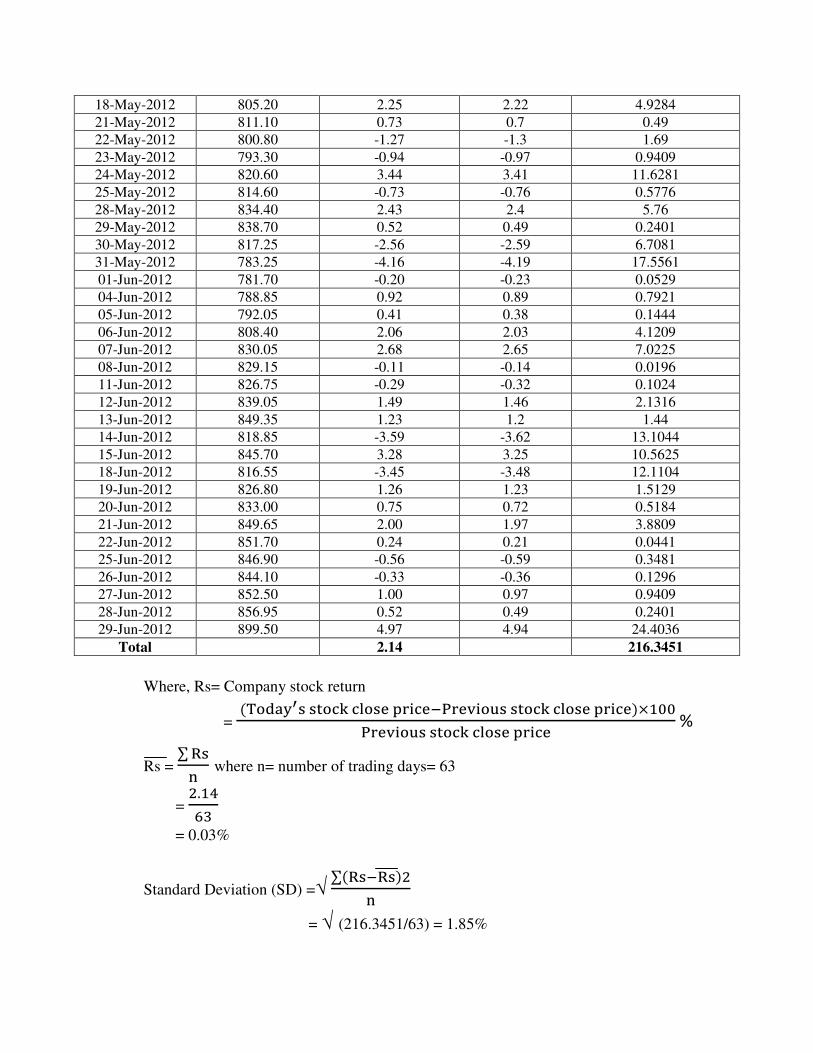
18-May-2012 805.20 2.25 2.22 4.9284
21-May-2012 811.10 0.73 0.7 0.49
22-May-2012 800.80 -1.27 -1.3 1.69
23-May-2012 793.30 -0.94 -0.97 0.9409
24-May-2012 820.60 3.44 3.41 11.6281
25-May-2012 814.60 -0.73 -0.76 0.5776
28-May-2012 834.40 2.43 2.4 5.76
29-May-2012 838.70 0.52 0.49 0.2401
30-May-2012 817.25 -2.56 -2.59 6.7081
31-May-2012 783.25 -4.16 -4.19 17.5561
01-Jun-2012 781.70 -0.20 -0.23 0.0529
04-Jun-2012 788.85 0.92 0.89 0.7921
05-Jun-2012 792.05 0.41 0.38 0.1444
06-Jun-2012 808.40 2.06 2.03 4.1209
07-Jun-2012 830.05 2.68 2.65 7.0225
08-Jun-2012 829.15 -0.11 -0.14 0.0196
11-Jun-2012 826.75 -0.29 -0.32 0.1024
12-Jun-2012 839.05 1.49 1.46 2.1316
13-Jun-2012 849.35 1.23 1.2 1.44
14-Jun-2012 818.85 -3.59 -3.62 13.1044
15-Jun-2012 845.70 3.28 3.25 10.5625
18-Jun-2012 816.55 -3.45 -3.48 12.1104
19-Jun-2012 826.80 1.26 1.23 1.5129
20-Jun-2012 833.00 0.75 0.72 0.5184
21-Jun-2012 849.65 2.00 1.97 3.8809
22-Jun-2012 851.70 0.24 0.21 0.0441
25-Jun-2012 846.90 -0.56 -0.59 0.3481
26-Jun-2012 844.10 -0.33 -0.36 0.1296
27-Jun-2012 852.50 1.00 0.97 0.9409
28-Jun-2012 856.95 0.52 0.49 0.2401
29-Jun-2012 899.50 4.97 4.94 24.4036
Total 2.14 216.3451
Where, Rs= Company stock return
= ������� �=��> ����� �� ��!"��# �$� �=��> ����� �� ���%&''
"��# �$� �=��> ����� �� �� %
Rs = ∑ *�
( where n= number of trading days= 63
= .&6
:7
= 0.03%
Standard Deviation (SD) =√ ∑ *�!*��
(
= √ (216.3451/63) = 1.85%
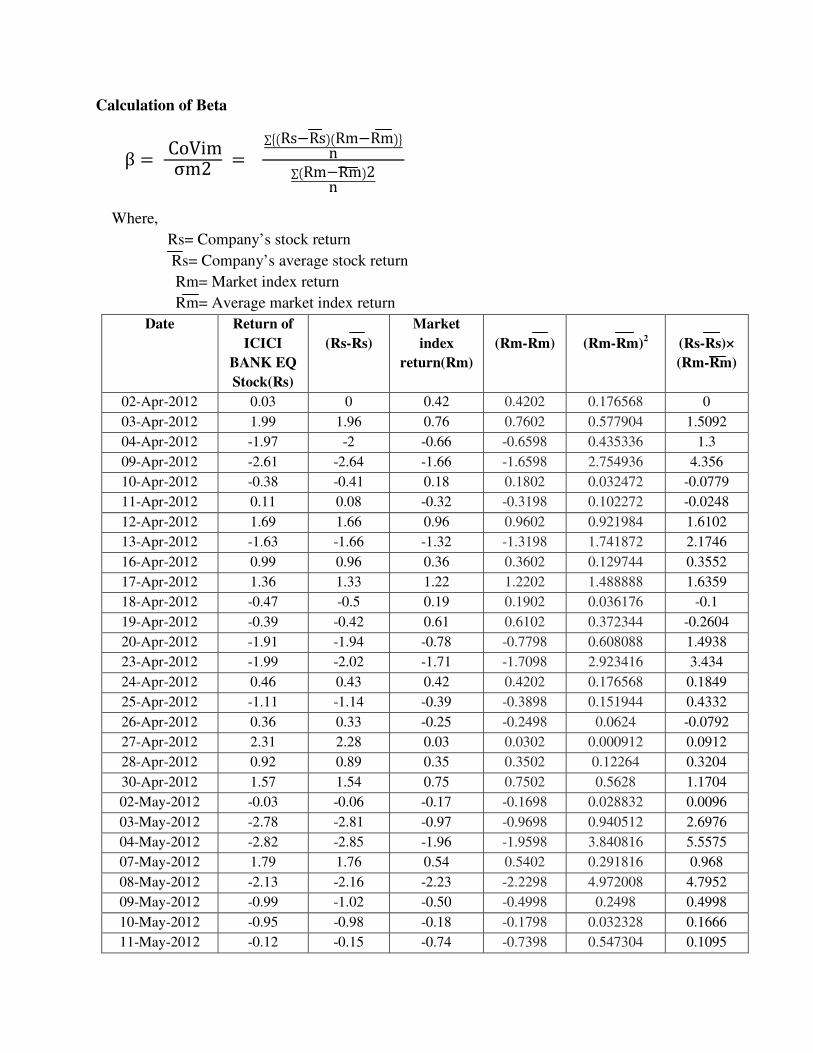
Calculation of Beta
β � CoVimσm2 �
∑BCRs;RsECRm;RmEFn
∑CRm;RmE2n
Where,
Rs= Company’s stock return
Rs= Company’s average stock return
Rm= Market index return
Rm= Average market index return
Date Return of
ICICI
BANK EQ
Stock(Rs)
(Rs-Rs)
Market
index
return(Rm)
(Rm-Rm)
(Rm-Rm)2
(Rs-Rs)×
(Rm-Rm)
02-Apr-2012 0.03 0 0.42 0.4202 0.176568 0
03-Apr-2012 1.99 1.96 0.76 0.7602 0.577904 1.5092
04-Apr-2012 -1.97 -2 -0.66 -0.6598 0.435336 1.3
09-Apr-2012 -2.61 -2.64 -1.66 -1.6598 2.754936 4.356
10-Apr-2012 -0.38 -0.41 0.18 0.1802 0.032472 -0.0779
11-Apr-2012 0.11 0.08 -0.32 -0.3198 0.102272 -0.0248
12-Apr-2012 1.69 1.66 0.96 0.9602 0.921984 1.6102
13-Apr-2012 -1.63 -1.66 -1.32 -1.3198 1.741872 2.1746
16-Apr-2012 0.99 0.96 0.36 0.3602 0.129744 0.3552
17-Apr-2012 1.36 1.33 1.22 1.2202 1.488888 1.6359
18-Apr-2012 -0.47 -0.5 0.19 0.1902 0.036176 -0.1
19-Apr-2012 -0.39 -0.42 0.61 0.6102 0.372344 -0.2604
20-Apr-2012 -1.91 -1.94 -0.78 -0.7798 0.608088 1.4938
23-Apr-2012 -1.99 -2.02 -1.71 -1.7098 2.923416 3.434
24-Apr-2012 0.46 0.43 0.42 0.4202 0.176568 0.1849
25-Apr-2012 -1.11 -1.14 -0.39 -0.3898 0.151944 0.4332
26-Apr-2012 0.36 0.33 -0.25 -0.2498 0.0624 -0.0792
27-Apr-2012 2.31 2.28 0.03 0.0302 0.000912 0.0912
28-Apr-2012 0.92 0.89 0.35 0.3502 0.12264 0.3204
30-Apr-2012 1.57 1.54 0.75 0.7502 0.5628 1.1704
02-May-2012 -0.03 -0.06 -0.17 -0.1698 0.028832 0.0096
03-May-2012 -2.78 -2.81 -0.97 -0.9698 0.940512 2.6976
04-May-2012 -2.82 -2.85 -1.96 -1.9598 3.840816 5.5575
07-May-2012 1.79 1.76 0.54 0.5402 0.291816 0.968
08-May-2012 -2.13 -2.16 -2.23 -2.2298 4.972008 4.7952
09-May-2012 -0.99 -1.02 -0.50 -0.4998 0.2498 0.4998
10-May-2012 -0.95 -0.98 -0.18 -0.1798 0.032328 0.1666
11-May-2012 -0.12 -0.15 -0.74 -0.7398 0.547304 0.1095
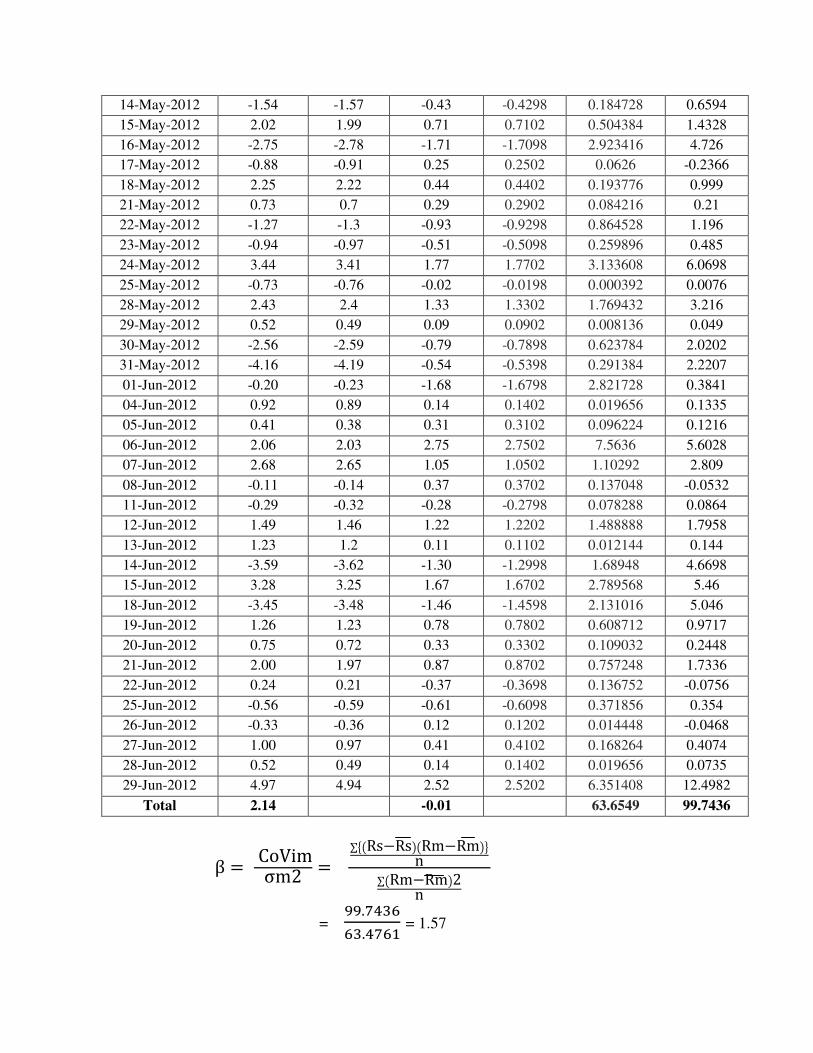
14-May-2012 -1.54 -1.57 -0.43 -0.4298 0.184728 0.6594
15-May-2012 2.02 1.99 0.71 0.7102 0.504384 1.4328
16-May-2012 -2.75 -2.78 -1.71 -1.7098 2.923416 4.726
17-May-2012 -0.88 -0.91 0.25 0.2502 0.0626 -0.2366
18-May-2012 2.25 2.22 0.44 0.4402 0.193776 0.999
21-May-2012 0.73 0.7 0.29 0.2902 0.084216 0.21
22-May-2012 -1.27 -1.3 -0.93 -0.9298 0.864528 1.196
23-May-2012 -0.94 -0.97 -0.51 -0.5098 0.259896 0.485
24-May-2012 3.44 3.41 1.77 1.7702 3.133608 6.0698
25-May-2012 -0.73 -0.76 -0.02 -0.0198 0.000392 0.0076
28-May-2012 2.43 2.4 1.33 1.3302 1.769432 3.216
29-May-2012 0.52 0.49 0.09 0.0902 0.008136 0.049
30-May-2012 -2.56 -2.59 -0.79 -0.7898 0.623784 2.0202
31-May-2012 -4.16 -4.19 -0.54 -0.5398 0.291384 2.2207
01-Jun-2012 -0.20 -0.23 -1.68 -1.6798 2.821728 0.3841
04-Jun-2012 0.92 0.89 0.14 0.1402 0.019656 0.1335
05-Jun-2012 0.41 0.38 0.31 0.3102 0.096224 0.1216
06-Jun-2012 2.06 2.03 2.75 2.7502 7.5636 5.6028
07-Jun-2012 2.68 2.65 1.05 1.0502 1.10292 2.809
08-Jun-2012 -0.11 -0.14 0.37 0.3702 0.137048 -0.0532
11-Jun-2012 -0.29 -0.32 -0.28 -0.2798 0.078288 0.0864
12-Jun-2012 1.49 1.46 1.22 1.2202 1.488888 1.7958
13-Jun-2012 1.23 1.2 0.11 0.1102 0.012144 0.144
14-Jun-2012 -3.59 -3.62 -1.30 -1.2998 1.68948 4.6698
15-Jun-2012 3.28 3.25 1.67 1.6702 2.789568 5.46
18-Jun-2012 -3.45 -3.48 -1.46 -1.4598 2.131016 5.046
19-Jun-2012 1.26 1.23 0.78 0.7802 0.608712 0.9717
20-Jun-2012 0.75 0.72 0.33 0.3302 0.109032 0.2448
21-Jun-2012 2.00 1.97 0.87 0.8702 0.757248 1.7336
22-Jun-2012 0.24 0.21 -0.37 -0.3698 0.136752 -0.0756
25-Jun-2012 -0.56 -0.59 -0.61 -0.6098 0.371856 0.354
26-Jun-2012 -0.33 -0.36 0.12 0.1202 0.014448 -0.0468
27-Jun-2012 1.00 0.97 0.41 0.4102 0.168264 0.4074
28-Jun-2012 0.52 0.49 0.14 0.1402 0.019656 0.0735
29-Jun-2012 4.97 4.94 2.52 2.5202 6.351408 12.4982
Total 2.14 -0.01 63.6549 99.7436
β � CoVimσm2 �
∑BCRs;RsECRm;RmEFn
∑CRm;RmE2n
= <<.867:
:7.68:& = 1.57

2. ITC LTD.
Calculation of Risk and Return
Date
Script Value
Return(Rs) in %
(Rs-Rs)
(Rs-Rs)2
30-Mar-2012 226.90
02-Apr-2012 226.95 0.02 -0.21 0.0441
03-Apr-2012 227.10 0.07 -0.16 0.0256
04-Apr-2012 227.40 0.13 -0.1 0.01
09-Apr-2012 224.05 -1.47 -1.7 2.89
10-Apr-2012 229.35 2.37 2.14 4.5796
11-Apr-2012 229.75 0.17 -0.06 0.0036
12-Apr-2012 234.75 2.18 1.95 3.8025
13-Apr-2012 236.25 0.64 0.41 0.1681
16-Apr-2012 241.05 2.03 1.8 3.24
17-Apr-2012 246.20 2.14 1.91 3.6481
18-Apr-2012 241.75 -1.81 -2.04 4.1616
19-Apr-2012 244.05 0.95 0.72 0.5184
20-Apr-2012 245.20 0.47 0.24 0.0576
23-Apr-2012 244.75 -0.18 -0.41 0.1681
24-Apr-2012 245.05 0.12 -0.11 0.0121
25-Apr-2012 245.95 0.37 0.14 0.0196
26-Apr-2012 249.05 1.26 1.03 1.0609
27-Apr-2012 245.80 -1.31 -1.54 2.3716
28-Apr-2012 246.90 0.45 0.22 0.0484
30-Apr-2012 245.50 -0.57 -0.35 0.1225
02-May-2012 244.60 -0.37 -0.6 0.36
03-May-2012 241.70 -1.19 -1.42 2.0164
04-May-2012 238.15 -1.47 -1.7 2.89
07-May-2012 236.35 -0.76 -0.99 0.9801
08-May-2012 226.90 -4.00 -4.23 17.8929
09-May-2012 239.90 5.73 5.5 30.25
10-May-2012 239.25 -0.27 -0.5 0.25
11-May-2012 234.25 -2.09 -2.32 5.3824
14-May-2012 234.50 0.11 -0.12 0.0144
15-May-2012 230.85 -1.56 -1.79 3.2041
16-May-2012 227.30 -1.54 -1.77 3.1329
17-May-2012 234.75 3.28 3.05 9.3025
18-May-2012 239.55 2.05 1.82 3.1324
21-May-2012 234.85 -1.96 -2.19 4.7961
22-May-2012 232.75 -0.89 -1.12 1.2544
23-May-2012 231.70 -0.45 -0.68 0.4624
24-May-2012 233.35 0.71 0.48 0.2304
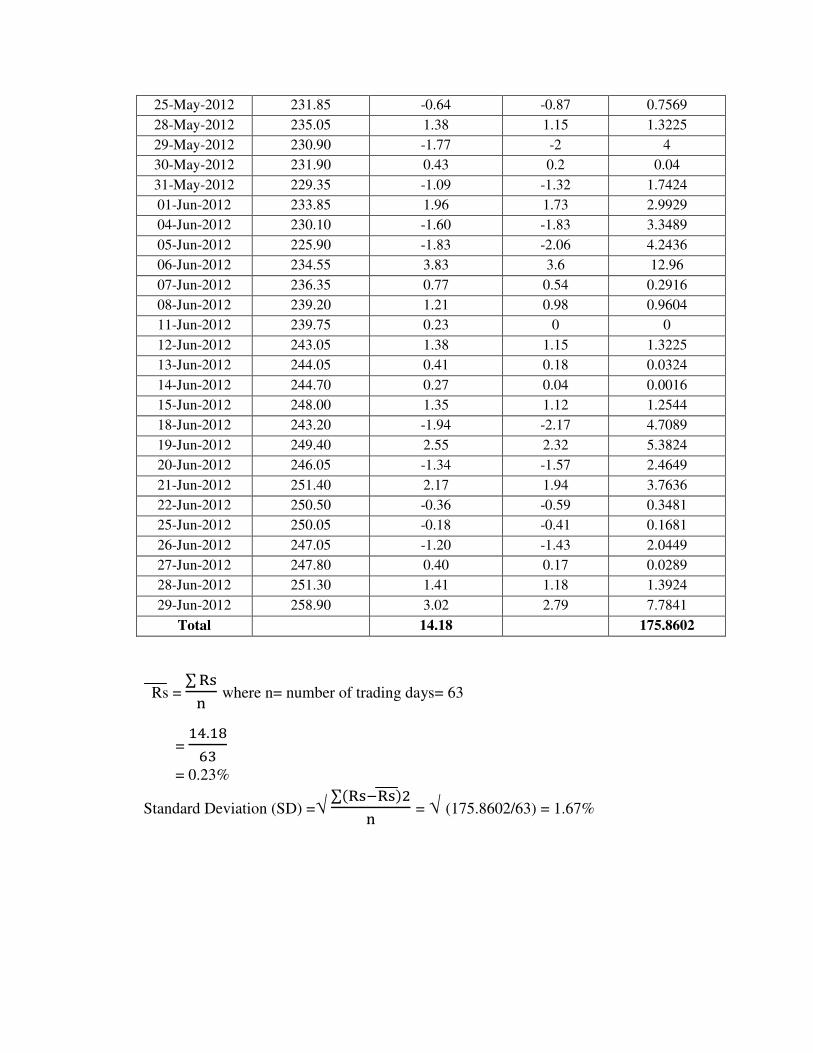
25-May-2012 231.85 -0.64 -0.87 0.7569
28-May-2012 235.05 1.38 1.15 1.3225
29-May-2012 230.90 -1.77 -2 4
30-May-2012 231.90 0.43 0.2 0.04
31-May-2012 229.35 -1.09 -1.32 1.7424
01-Jun-2012 233.85 1.96 1.73 2.9929
04-Jun-2012 230.10 -1.60 -1.83 3.3489
05-Jun-2012 225.90 -1.83 -2.06 4.2436
06-Jun-2012 234.55 3.83 3.6 12.96
07-Jun-2012 236.35 0.77 0.54 0.2916
08-Jun-2012 239.20 1.21 0.98 0.9604
11-Jun-2012 239.75 0.23 0 0
12-Jun-2012 243.05 1.38 1.15 1.3225
13-Jun-2012 244.05 0.41 0.18 0.0324
14-Jun-2012 244.70 0.27 0.04 0.0016
15-Jun-2012 248.00 1.35 1.12 1.2544
18-Jun-2012 243.20 -1.94 -2.17 4.7089
19-Jun-2012 249.40 2.55 2.32 5.3824
20-Jun-2012 246.05 -1.34 -1.57 2.4649
21-Jun-2012 251.40 2.17 1.94 3.7636
22-Jun-2012 250.50 -0.36 -0.59 0.3481
25-Jun-2012 250.05 -0.18 -0.41 0.1681
26-Jun-2012 247.05 -1.20 -1.43 2.0449
27-Jun-2012 247.80 0.40 0.17 0.0289
28-Jun-2012 251.30 1.41 1.18 1.3924
29-Jun-2012 258.90 3.02 2.79 7.7841
Total 14.18 175.8602
Rs = ∑ *�
( where n= number of trading days= 63
= &6.&9
:7
= 0.23%
Standard Deviation (SD) =√ ∑ *�!*��
( = √ (175.8602/63) = 1.67%
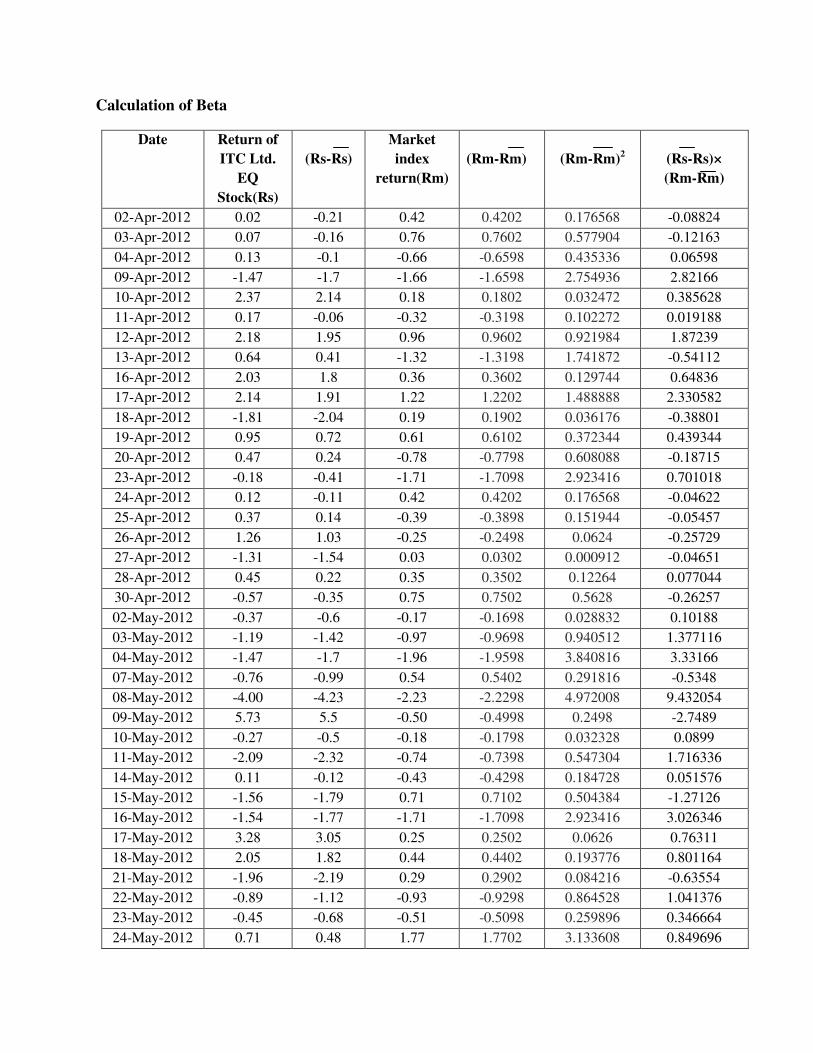
Calculation of Beta
Date Return of
ITC Ltd.
EQ
Stock(Rs)
(Rs-Rs)
Market
index
return(Rm)
(Rm-Rm)
(Rm-Rm)2
(Rs-Rs)×
(Rm-Rm)
02-Apr-2012 0.02 -0.21 0.42 0.4202 0.176568 -0.08824
03-Apr-2012 0.07 -0.16 0.76 0.7602 0.577904 -0.12163
04-Apr-2012 0.13 -0.1 -0.66 -0.6598 0.435336 0.06598
09-Apr-2012 -1.47 -1.7 -1.66 -1.6598 2.754936 2.82166
10-Apr-2012 2.37 2.14 0.18 0.1802 0.032472 0.385628
11-Apr-2012 0.17 -0.06 -0.32 -0.3198 0.102272 0.019188
12-Apr-2012 2.18 1.95 0.96 0.9602 0.921984 1.87239
13-Apr-2012 0.64 0.41 -1.32 -1.3198 1.741872 -0.54112
16-Apr-2012 2.03 1.8 0.36 0.3602 0.129744 0.64836
17-Apr-2012 2.14 1.91 1.22 1.2202 1.488888 2.330582
18-Apr-2012 -1.81 -2.04 0.19 0.1902 0.036176 -0.38801
19-Apr-2012 0.95 0.72 0.61 0.6102 0.372344 0.439344
20-Apr-2012 0.47 0.24 -0.78 -0.7798 0.608088 -0.18715
23-Apr-2012 -0.18 -0.41 -1.71 -1.7098 2.923416 0.701018
24-Apr-2012 0.12 -0.11 0.42 0.4202 0.176568 -0.04622
25-Apr-2012 0.37 0.14 -0.39 -0.3898 0.151944 -0.05457
26-Apr-2012 1.26 1.03 -0.25 -0.2498 0.0624 -0.25729
27-Apr-2012 -1.31 -1.54 0.03 0.0302 0.000912 -0.04651
28-Apr-2012 0.45 0.22 0.35 0.3502 0.12264 0.077044
30-Apr-2012 -0.57 -0.35 0.75 0.7502 0.5628 -0.26257
02-May-2012 -0.37 -0.6 -0.17 -0.1698 0.028832 0.10188
03-May-2012 -1.19 -1.42 -0.97 -0.9698 0.940512 1.377116
04-May-2012 -1.47 -1.7 -1.96 -1.9598 3.840816 3.33166
07-May-2012 -0.76 -0.99 0.54 0.5402 0.291816 -0.5348
08-May-2012 -4.00 -4.23 -2.23 -2.2298 4.972008 9.432054
09-May-2012 5.73 5.5 -0.50 -0.4998 0.2498 -2.7489
10-May-2012 -0.27 -0.5 -0.18 -0.1798 0.032328 0.0899
11-May-2012 -2.09 -2.32 -0.74 -0.7398 0.547304 1.716336
14-May-2012 0.11 -0.12 -0.43 -0.4298 0.184728 0.051576
15-May-2012 -1.56 -1.79 0.71 0.7102 0.504384 -1.27126
16-May-2012 -1.54 -1.77 -1.71 -1.7098 2.923416 3.026346
17-May-2012 3.28 3.05 0.25 0.2502 0.0626 0.76311
18-May-2012 2.05 1.82 0.44 0.4402 0.193776 0.801164
21-May-2012 -1.96 -2.19 0.29 0.2902 0.084216 -0.63554
22-May-2012 -0.89 -1.12 -0.93 -0.9298 0.864528 1.041376
23-May-2012 -0.45 -0.68 -0.51 -0.5098 0.259896 0.346664
24-May-2012 0.71 0.48 1.77 1.7702 3.133608 0.849696

25-May-2012 -0.64 -0.87 -0.02 -0.0198 0.000392 0.017226
28-May-2012 1.38 1.15 1.33 1.3302 1.769432 1.52973
29-May-2012 -1.77 -2 0.09 0.0902 0.008136 -0.1804
30-May-2012 0.43 0.2 -0.79 -0.7898 0.623784 -0.15796
31-May-2012 -1.09 -1.32 -0.54 -0.5398 0.291384 0.712536
01-Jun-2012 1.96 1.73 -1.68 -1.6798 2.821728 -2.90605
04-Jun-2012 -1.60 -1.83 0.14 0.1402 0.019656 -0.25657
05-Jun-2012 -1.83 -2.06 0.31 0.3102 0.096224 -0.63901
06-Jun-2012 3.83 3.6 2.75 2.7502 7.5636 9.90072
07-Jun-2012 0.77 0.54 1.05 1.0502 1.10292 0.567108
08-Jun-2012 1.21 0.98 0.37 0.3702 0.137048 0.362796
11-Jun-2012 0.23 0 -0.28 -0.2798 0.078288 0
12-Jun-2012 1.38 1.15 1.22 1.2202 1.488888 1.40323
13-Jun-2012 0.41 0.18 0.11 0.1102 0.012144 0.019836
14-Jun-2012 0.27 0.04 -1.30 -1.2998 1.68948 -0.05199
15-Jun-2012 1.35 1.12 1.67 1.6702 2.789568 1.870624
18-Jun-2012 -1.94 -2.17 -1.46 -1.4598 2.131016 3.167766
19-Jun-2012 2.55 2.32 0.78 0.7802 0.608712 1.810064
20-Jun-2012 -1.34 -1.57 0.33 0.3302 0.109032 -0.51841
21-Jun-2012 2.17 1.94 0.87 0.8702 0.757248 1.688188
22-Jun-2012 -0.36 -0.59 -0.37 -0.3698 0.136752 0.218182
25-Jun-2012 -0.18 -0.41 -0.61 -0.6098 0.371856 0.250018
26-Jun-2012 -1.20 -1.43 0.12 0.1202 0.014448 -0.17189
27-Jun-2012 0.40 0.17 0.41 0.4102 0.168264 0.069734
28-Jun-2012 1.41 1.18 0.14 0.1402 0.019656 0.165436
29-Jun-2012 3.02 2.79 2.52 2.5202 6.351408 7.031358
Total 14.18 -0.01 63.6549 51.00853
β � CoVimσm2 �
∑BCRs;RsECRm;RmEFn
∑CRm;RmE2n
= 4&.''947
:7.:46<
= 0.80

3. ACC LTD.
Calculation of Risk and Return
Date
Script Value
Return(Rs) in %
(Rs-Rs)
(Rs-Rs)2
30-Mar-2012 1359.45
02-Apr-2012 1342.00 -1.28 -1.19 1.4161
03-Apr-2012 1364.25 1.66 1.75 3.0625
04-Apr-2012 1344.70 -1.43 -1.34 1.7956
09-Apr-2012 1312.10 -2.42 -2.33 5.4289
10-Apr-2012 1300.05 -0.92 -0.83 0.6889
11-Apr-2012 1236.50 -4.89 -4.8 23.04
12-Apr-2012 1279.55 3.48 3.57 12.7449
13-Apr-2012 1258.75 -1.63 -1.54 2.3716
16-Apr-2012 1237.75 -1.67 -1.58 2.4964
17-Apr-2012 1254.70 1.37 1.46 2.1316
18-Apr-2012 1297.20 3.39 3.48 12.1104
19-Apr-2012 1247.60 -3.82 -3.73 13.9129
20-Apr-2012 1226.90 -1.66 -1.57 2.4649
23-Apr-2012 1243.45 1.35 1.44 2.0736
24-Apr-2012 1214.10 -2.36 -2.27 5.1529
25-Apr-2012 1194.70 -1.60 -1.51 2.2801
26-Apr-2012 1218.85 2.02 2.11 4.4521
27-Apr-2012 1195.05 -1.95 -1.86 3.4596
28-Apr-2012 1205.30 0.86 0.95 0.9025
30-Apr-2012 1237.15 2.64 2.73 7.4529
02-May-2012 1212.85 -1.96 -1.87 3.4969
03-May-2012 1206.85 -0.50 -0.41 0.1681
04-May-2012 1208.45 0.13 0.22 0.0484
07-May-2012 1235.00 2.20 2.29 5.2441
08-May-2012 1221.85 -1.07 -0.98 0.9604
09-May-2012 1201.90 -1.63 -1.54 2.3716
10-May-2012 1199.05 -0.24 -0.15 0.0225
11-May-2012 1165.95 -2.76 -2.67 7.1289
14-May-2012 1173.30 0.63 0.72 0.5184
15-May-2012 1174.35 0.09 0.18 0.0324
16-May-2012 1172.45 -0.16 -0.07 0.0049
17-May-2012 1170.90 -0.13 -0.04 0.0016
18-May-2012 1159.90 -0.94 -0.85 0.7225
21-May-2012 1145.10 -1.28 -1.19 1.4161
22-May-2012 1130.20 -1.30 -1.21 1.4641
23-May-2012 1130.45 0.02 0.11 0.0121
24-May-2012 1155.50 2.22 2.31 5.3361
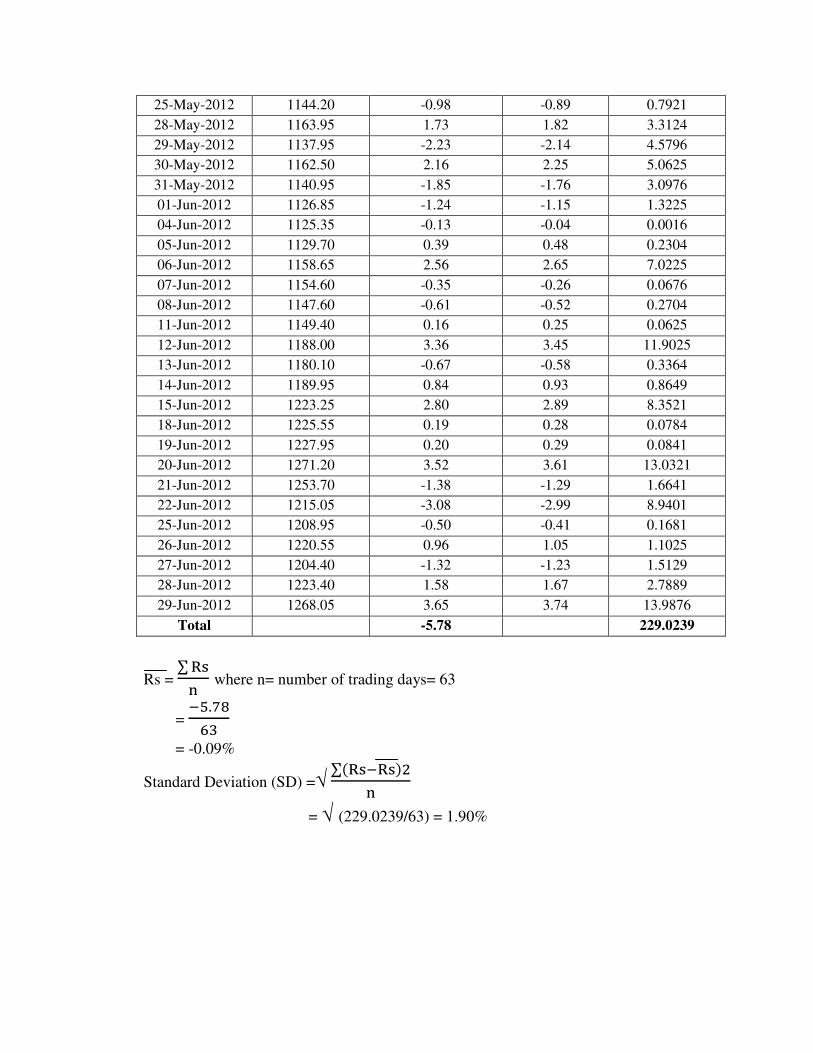
25-May-2012 1144.20 -0.98 -0.89 0.7921
28-May-2012 1163.95 1.73 1.82 3.3124
29-May-2012 1137.95 -2.23 -2.14 4.5796
30-May-2012 1162.50 2.16 2.25 5.0625
31-May-2012 1140.95 -1.85 -1.76 3.0976
01-Jun-2012 1126.85 -1.24 -1.15 1.3225
04-Jun-2012 1125.35 -0.13 -0.04 0.0016
05-Jun-2012 1129.70 0.39 0.48 0.2304
06-Jun-2012 1158.65 2.56 2.65 7.0225
07-Jun-2012 1154.60 -0.35 -0.26 0.0676
08-Jun-2012 1147.60 -0.61 -0.52 0.2704
11-Jun-2012 1149.40 0.16 0.25 0.0625
12-Jun-2012 1188.00 3.36 3.45 11.9025
13-Jun-2012 1180.10 -0.67 -0.58 0.3364
14-Jun-2012 1189.95 0.84 0.93 0.8649
15-Jun-2012 1223.25 2.80 2.89 8.3521
18-Jun-2012 1225.55 0.19 0.28 0.0784
19-Jun-2012 1227.95 0.20 0.29 0.0841
20-Jun-2012 1271.20 3.52 3.61 13.0321
21-Jun-2012 1253.70 -1.38 -1.29 1.6641
22-Jun-2012 1215.05 -3.08 -2.99 8.9401
25-Jun-2012 1208.95 -0.50 -0.41 0.1681
26-Jun-2012 1220.55 0.96 1.05 1.1025
27-Jun-2012 1204.40 -1.32 -1.23 1.5129
28-Jun-2012 1223.40 1.58 1.67 2.7889
29-Jun-2012 1268.05 3.65 3.74 13.9876
Total -5.78 229.0239
Rs = ∑ *�
( where n= number of trading days= 63
= !4.89
:7
= -0.09%
Standard Deviation (SD) =√ ∑ *�!*��
(
= √ (229.0239/63) = 1.90%
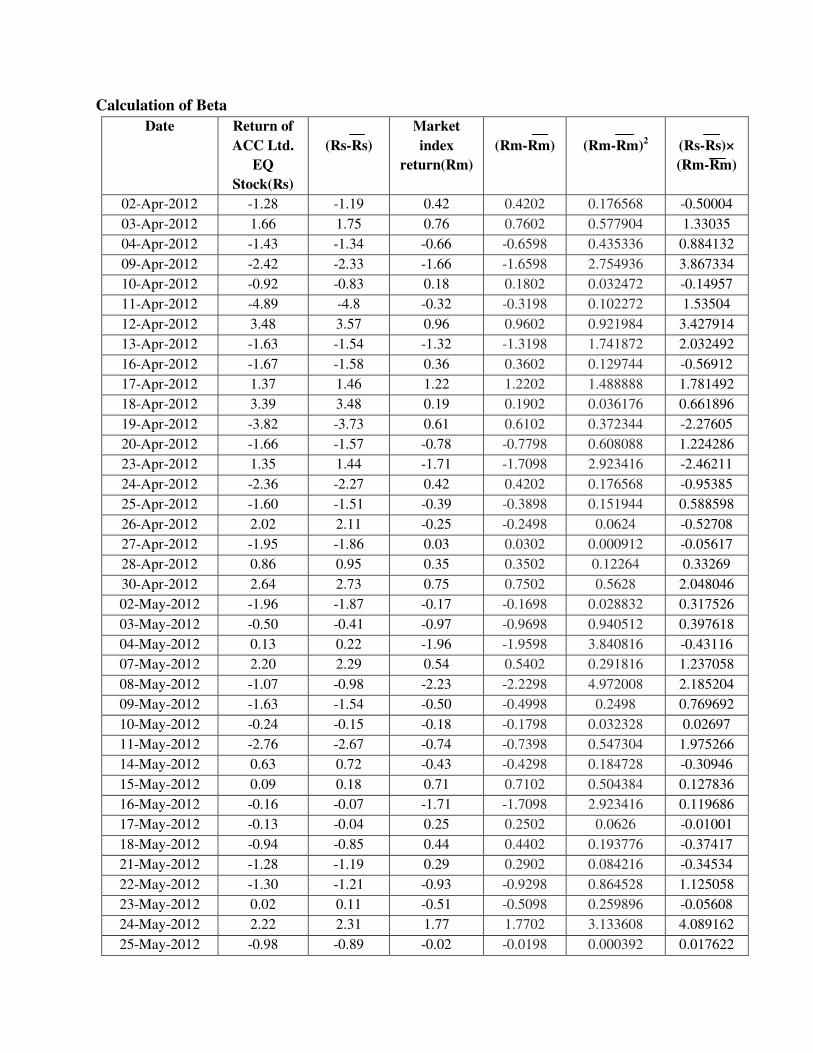
Calculation of Beta
Date Return of
ACC Ltd.
EQ
Stock(Rs)
(Rs-Rs)
Market
index
return(Rm)
(Rm-Rm)
(Rm-Rm)2
(Rs-Rs)×
(Rm-Rm)
02-Apr-2012 -1.28 -1.19 0.42 0.4202 0.176568 -0.50004
03-Apr-2012 1.66 1.75 0.76 0.7602 0.577904 1.33035
04-Apr-2012 -1.43 -1.34 -0.66 -0.6598 0.435336 0.884132
09-Apr-2012 -2.42 -2.33 -1.66 -1.6598 2.754936 3.867334
10-Apr-2012 -0.92 -0.83 0.18 0.1802 0.032472 -0.14957
11-Apr-2012 -4.89 -4.8 -0.32 -0.3198 0.102272 1.53504
12-Apr-2012 3.48 3.57 0.96 0.9602 0.921984 3.427914
13-Apr-2012 -1.63 -1.54 -1.32 -1.3198 1.741872 2.032492
16-Apr-2012 -1.67 -1.58 0.36 0.3602 0.129744 -0.56912
17-Apr-2012 1.37 1.46 1.22 1.2202 1.488888 1.781492
18-Apr-2012 3.39 3.48 0.19 0.1902 0.036176 0.661896
19-Apr-2012 -3.82 -3.73 0.61 0.6102 0.372344 -2.27605
20-Apr-2012 -1.66 -1.57 -0.78 -0.7798 0.608088 1.224286
23-Apr-2012 1.35 1.44 -1.71 -1.7098 2.923416 -2.46211
24-Apr-2012 -2.36 -2.27 0.42 0.4202 0.176568 -0.95385
25-Apr-2012 -1.60 -1.51 -0.39 -0.3898 0.151944 0.588598
26-Apr-2012 2.02 2.11 -0.25 -0.2498 0.0624 -0.52708
27-Apr-2012 -1.95 -1.86 0.03 0.0302 0.000912 -0.05617
28-Apr-2012 0.86 0.95 0.35 0.3502 0.12264 0.33269
30-Apr-2012 2.64 2.73 0.75 0.7502 0.5628 2.048046
02-May-2012 -1.96 -1.87 -0.17 -0.1698 0.028832 0.317526
03-May-2012 -0.50 -0.41 -0.97 -0.9698 0.940512 0.397618
04-May-2012 0.13 0.22 -1.96 -1.9598 3.840816 -0.43116
07-May-2012 2.20 2.29 0.54 0.5402 0.291816 1.237058
08-May-2012 -1.07 -0.98 -2.23 -2.2298 4.972008 2.185204
09-May-2012 -1.63 -1.54 -0.50 -0.4998 0.2498 0.769692
10-May-2012 -0.24 -0.15 -0.18 -0.1798 0.032328 0.02697
11-May-2012 -2.76 -2.67 -0.74 -0.7398 0.547304 1.975266
14-May-2012 0.63 0.72 -0.43 -0.4298 0.184728 -0.30946
15-May-2012 0.09 0.18 0.71 0.7102 0.504384 0.127836
16-May-2012 -0.16 -0.07 -1.71 -1.7098 2.923416 0.119686
17-May-2012 -0.13 -0.04 0.25 0.2502 0.0626 -0.01001
18-May-2012 -0.94 -0.85 0.44 0.4402 0.193776 -0.37417
21-May-2012 -1.28 -1.19 0.29 0.2902 0.084216 -0.34534
22-May-2012 -1.30 -1.21 -0.93 -0.9298 0.864528 1.125058
23-May-2012 0.02 0.11 -0.51 -0.5098 0.259896 -0.05608
24-May-2012 2.22 2.31 1.77 1.7702 3.133608 4.089162
25-May-2012 -0.98 -0.89 -0.02 -0.0198 0.000392 0.017622

28-May-2012 1.73 1.82 1.33 1.3302 1.769432 2.420964
29-May-2012 -2.23 -2.14 0.09 0.0902 0.008136 -0.19303
30-May-2012 2.16 2.25 -0.79 -0.7898 0.623784 -1.77705
31-May-2012 -1.85 -1.76 -0.54 -0.5398 0.291384 0.950048
01-Jun-2012 -1.24 -1.15 -1.68 -1.6798 2.821728 1.93177
04-Jun-2012 -0.13 -0.04 0.14 0.1402 0.019656 -0.00561
05-Jun-2012 0.39 0.48 0.31 0.3102 0.096224 0.148896
06-Jun-2012 2.56 2.65 2.75 2.7502 7.5636 7.28803
07-Jun-2012 -0.35 -0.26 1.05 1.0502 1.10292 -0.27305
08-Jun-2012 -0.61 -0.52 0.37 0.3702 0.137048 -0.1925
11-Jun-2012 0.16 0.25 -0.28 -0.2798 0.078288 -0.06995
12-Jun-2012 3.36 3.45 1.22 1.2202 1.488888 4.20969
13-Jun-2012 -0.67 -0.58 0.11 0.1102 0.012144 -0.06392
14-Jun-2012 0.84 0.93 -1.30 -1.2998 1.68948 -1.20881
15-Jun-2012 2.80 2.89 1.67 1.6702 2.789568 4.826878
18-Jun-2012 0.19 0.28 -1.46 -1.4598 2.131016 -0.40874
19-Jun-2012 0.20 0.29 0.78 0.7802 0.608712 0.226258
20-Jun-2012 3.52 3.61 0.33 0.3302 0.109032 1.192022
21-Jun-2012 -1.38 -1.29 0.87 0.8702 0.757248 -1.12256
22-Jun-2012 -3.08 -2.99 -0.37 -0.3698 0.136752 1.105702
25-Jun-2012 -0.50 -0.41 -0.61 -0.6098 0.371856 0.250018
26-Jun-2012 0.96 1.05 0.12 0.1202 0.014448 0.12621
27-Jun-2012 -1.32 -1.23 0.41 0.4102 0.168264 -0.50455
28-Jun-2012 1.58 1.67 0.14 0.1402 0.019656 0.234134
29-Jun-2012 3.65 3.74 2.52 2.5202 6.351408 9.425548
Total -5.78 -0.01 63.6549 51.5992
β � CoVimσm2 �
∑BCRs;RsECRm;RmEFn
∑CRm;RmE2n
= 4&.4<<
:7.:46< = 0.81
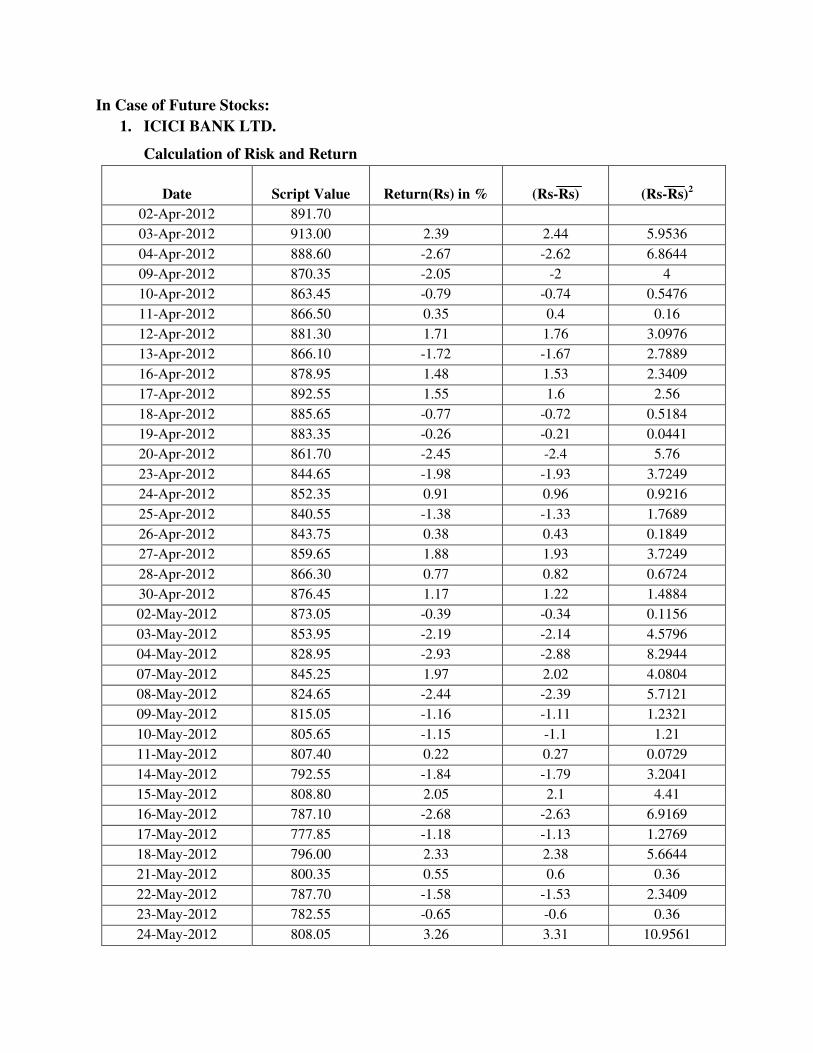
In Case of Future Stocks:
1. ICICI BANK LTD.
Calculation of Risk and Return
Date
Script Value
Return(Rs) in %
(Rs-Rs)
(Rs-Rs)2
02-Apr-2012 891.70
03-Apr-2012 913.00 2.39 2.44 5.9536
04-Apr-2012 888.60 -2.67 -2.62 6.8644
09-Apr-2012 870.35 -2.05 -2 4
10-Apr-2012 863.45 -0.79 -0.74 0.5476
11-Apr-2012 866.50 0.35 0.4 0.16
12-Apr-2012 881.30 1.71 1.76 3.0976
13-Apr-2012 866.10 -1.72 -1.67 2.7889
16-Apr-2012 878.95 1.48 1.53 2.3409
17-Apr-2012 892.55 1.55 1.6 2.56
18-Apr-2012 885.65 -0.77 -0.72 0.5184
19-Apr-2012 883.35 -0.26 -0.21 0.0441
20-Apr-2012 861.70 -2.45 -2.4 5.76
23-Apr-2012 844.65 -1.98 -1.93 3.7249
24-Apr-2012 852.35 0.91 0.96 0.9216
25-Apr-2012 840.55 -1.38 -1.33 1.7689
26-Apr-2012 843.75 0.38 0.43 0.1849
27-Apr-2012 859.65 1.88 1.93 3.7249
28-Apr-2012 866.30 0.77 0.82 0.6724
30-Apr-2012 876.45 1.17 1.22 1.4884
02-May-2012 873.05 -0.39 -0.34 0.1156
03-May-2012 853.95 -2.19 -2.14 4.5796
04-May-2012 828.95 -2.93 -2.88 8.2944
07-May-2012 845.25 1.97 2.02 4.0804
08-May-2012 824.65 -2.44 -2.39 5.7121
09-May-2012 815.05 -1.16 -1.11 1.2321
10-May-2012 805.65 -1.15 -1.1 1.21
11-May-2012 807.40 0.22 0.27 0.0729
14-May-2012 792.55 -1.84 -1.79 3.2041
15-May-2012 808.80 2.05 2.1 4.41
16-May-2012 787.10 -2.68 -2.63 6.9169
17-May-2012 777.85 -1.18 -1.13 1.2769
18-May-2012 796.00 2.33 2.38 5.6644
21-May-2012 800.35 0.55 0.6 0.36
22-May-2012 787.70 -1.58 -1.53 2.3409
23-May-2012 782.55 -0.65 -0.6 0.36
24-May-2012 808.05 3.26 3.31 10.9561
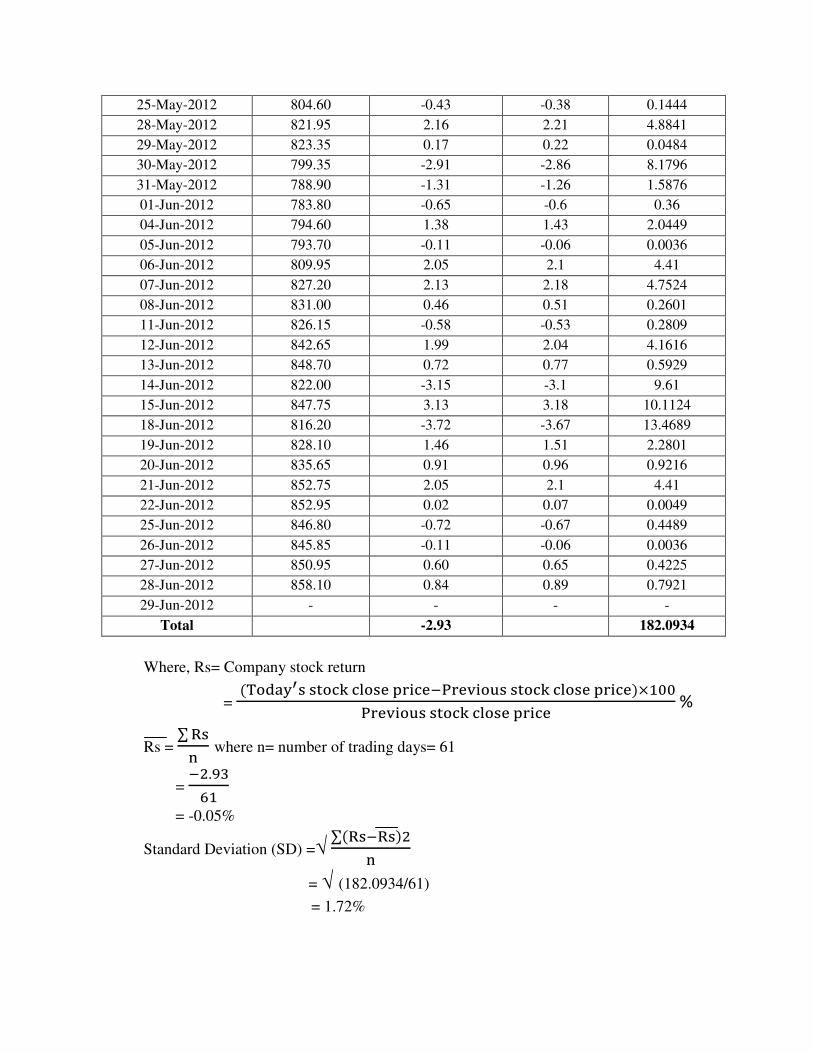
25-May-2012 804.60 -0.43 -0.38 0.1444
28-May-2012 821.95 2.16 2.21 4.8841
29-May-2012 823.35 0.17 0.22 0.0484
30-May-2012 799.35 -2.91 -2.86 8.1796
31-May-2012 788.90 -1.31 -1.26 1.5876
01-Jun-2012 783.80 -0.65 -0.6 0.36
04-Jun-2012 794.60 1.38 1.43 2.0449
05-Jun-2012 793.70 -0.11 -0.06 0.0036
06-Jun-2012 809.95 2.05 2.1 4.41
07-Jun-2012 827.20 2.13 2.18 4.7524
08-Jun-2012 831.00 0.46 0.51 0.2601
11-Jun-2012 826.15 -0.58 -0.53 0.2809
12-Jun-2012 842.65 1.99 2.04 4.1616
13-Jun-2012 848.70 0.72 0.77 0.5929
14-Jun-2012 822.00 -3.15 -3.1 9.61
15-Jun-2012 847.75 3.13 3.18 10.1124
18-Jun-2012 816.20 -3.72 -3.67 13.4689
19-Jun-2012 828.10 1.46 1.51 2.2801
20-Jun-2012 835.65 0.91 0.96 0.9216
21-Jun-2012 852.75 2.05 2.1 4.41
22-Jun-2012 852.95 0.02 0.07 0.0049
25-Jun-2012 846.80 -0.72 -0.67 0.4489
26-Jun-2012 845.85 -0.11 -0.06 0.0036
27-Jun-2012 850.95 0.60 0.65 0.4225
28-Jun-2012 858.10 0.84 0.89 0.7921
29-Jun-2012 - - - -
Total -2.93 182.0934
Where, Rs= Company stock return
= ������� �=��> ����� �� ��!"��# �$� �=��> ����� �� ���%&''
"��# �$� �=��> ����� �� �� %
Rs = ∑ *�
( where n= number of trading days= 61
= !.<7
:&
= -0.05%
Standard Deviation (SD) =√ ∑ *�!*��
(
= √ (182.0934/61)
= 1.72%

Calculation of Beta
Date Return of
ICICI
BANK
Future
Stock(Rs)
(Rs-Rs)
Market
index
return(Rm)
(Rm-Rm)
(Rm-Rm)2
(Rs-Rs)×
(Rm-Rm)
03-Apr-2012 2.39 2.44 0.76 0.767 0.588289 1.87148
04-Apr-2012 -2.67 -2.62 -0.66 -0.653 0.426409 1.71086
09-Apr-2012 -2.05 -2 -1.66 -1.653 2.732409 3.306
10-Apr-2012 -0.79 -0.74 0.18 0.187 0.034969 -0.13838
11-Apr-2012 0.35 0.4 -0.32 -0.313 0.097969 -0.1252
12-Apr-2012 1.71 1.76 0.96 0.967 0.935089 1.70192
13-Apr-2012 -1.72 -1.67 -1.32 -1.313 1.723969 2.19271
16-Apr-2012 1.48 1.53 0.36 0.367 0.134689 0.56151
17-Apr-2012 1.55 1.6 1.22 1.227 1.505529 1.9632
18-Apr-2012 -0.77 -0.72 0.19 0.197 0.038809 -0.14184
19-Apr-2012 -0.26 -0.21 0.61 0.617 0.380689 -0.12957
20-Apr-2012 -2.45 -2.4 -0.78 -0.773 0.597529 1.8552
23-Apr-2012 -1.98 -1.93 -1.71 -1.703 2.900209 3.28679
24-Apr-2012 0.91 0.96 0.42 0.427 0.182329 0.40992
25-Apr-2012 -1.38 -1.33 -0.39 -0.383 0.146689 0.50939
26-Apr-2012 0.38 0.43 -0.25 -0.243 0.059049 -0.10449
27-Apr-2012 1.88 1.93 0.03 0.037 0.001369 0.07141
28-Apr-2012 0.77 0.82 0.35 0.357 0.127449 0.29274
30-Apr-2012 1.17 1.22 0.75 0.757 0.573049 0.92354
02-May-2012 -0.39 -0.34 -0.17 -0.163 0.026569 0.05542
03-May-2012 -2.19 -2.14 -0.97 -0.963 0.927369 2.06082
04-May-2012 -2.93 -2.88 -1.96 -1.953 3.814209 5.62464
07-May-2012 1.97 2.02 0.54 0.547 0.299209 1.10494
08-May-2012 -2.44 -2.39 -2.23 -2.223 4.941729 5.31297
09-May-2012 -1.16 -1.11 -0.50 -0.493 0.243049 0.54723
10-May-2012 -1.15 -1.1 -0.18 -0.173 0.029929 0.1903
11-May-2012 0.22 0.27 -0.74 -0.733 0.537289 -0.19791
14-May-2012 -1.84 -1.79 -0.43 -0.423 0.178929 0.75717
15-May-2012 2.05 2.1 0.71 0.717 0.514089 1.5057
16-May-2012 -2.68 -2.63 -1.71 -1.703 2.900209 4.47889
17-May-2012 -1.18 -1.13 0.25 0.257 0.066049 -0.29041
18-May-2012 2.33 2.38 0.44 0.447 0.199809 1.06386
21-May-2012 0.55 0.6 0.29 0.297 0.088209 0.1782
22-May-2012 -1.58 -1.53 -0.93 -0.923 0.851929 1.41219
23-May-2012 -0.65 -0.6 -0.51 -0.503 0.253009 0.3018
24-May-2012 3.26 3.31 1.77 1.777 3.157729 5.88187
25-May-2012 -0.43 -0.38 -0.02 -0.013 0.000169 0.00494
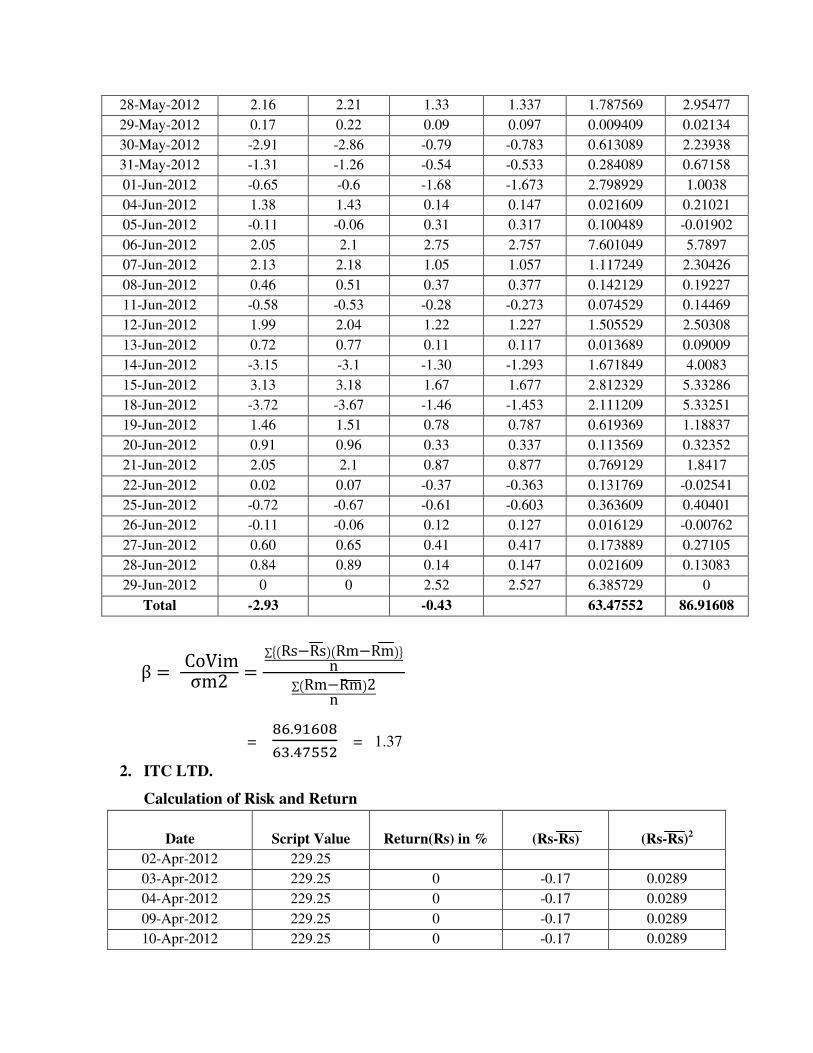
28-May-2012 2.16 2.21 1.33 1.337 1.787569 2.95477
29-May-2012 0.17 0.22 0.09 0.097 0.009409 0.02134
30-May-2012 -2.91 -2.86 -0.79 -0.783 0.613089 2.23938
31-May-2012 -1.31 -1.26 -0.54 -0.533 0.284089 0.67158
01-Jun-2012 -0.65 -0.6 -1.68 -1.673 2.798929 1.0038
04-Jun-2012 1.38 1.43 0.14 0.147 0.021609 0.21021
05-Jun-2012 -0.11 -0.06 0.31 0.317 0.100489 -0.01902
06-Jun-2012 2.05 2.1 2.75 2.757 7.601049 5.7897
07-Jun-2012 2.13 2.18 1.05 1.057 1.117249 2.30426
08-Jun-2012 0.46 0.51 0.37 0.377 0.142129 0.19227
11-Jun-2012 -0.58 -0.53 -0.28 -0.273 0.074529 0.14469
12-Jun-2012 1.99 2.04 1.22 1.227 1.505529 2.50308
13-Jun-2012 0.72 0.77 0.11 0.117 0.013689 0.09009
14-Jun-2012 -3.15 -3.1 -1.30 -1.293 1.671849 4.0083
15-Jun-2012 3.13 3.18 1.67 1.677 2.812329 5.33286
18-Jun-2012 -3.72 -3.67 -1.46 -1.453 2.111209 5.33251
19-Jun-2012 1.46 1.51 0.78 0.787 0.619369 1.18837
20-Jun-2012 0.91 0.96 0.33 0.337 0.113569 0.32352
21-Jun-2012 2.05 2.1 0.87 0.877 0.769129 1.8417
22-Jun-2012 0.02 0.07 -0.37 -0.363 0.131769 -0.02541
25-Jun-2012 -0.72 -0.67 -0.61 -0.603 0.363609 0.40401
26-Jun-2012 -0.11 -0.06 0.12 0.127 0.016129 -0.00762
27-Jun-2012 0.60 0.65 0.41 0.417 0.173889 0.27105
28-Jun-2012 0.84 0.89 0.14 0.147 0.021609 0.13083
29-Jun-2012 0 0 2.52 2.527 6.385729 0
Total -2.93 -0.43 63.47552 86.91608
β � CoVimσm2 �
∑BCRs;RsECRm;RmEFn
∑CRm;RmE2n
= 9:.<&:'9
:7.6844 = 1.37
2. ITC LTD.
Calculation of Risk and Return
Date
Script Value
Return(Rs) in %
(Rs-Rs)
(Rs-Rs)2
02-Apr-2012 229.25
03-Apr-2012 229.25 0 -0.17 0.0289
04-Apr-2012 229.25 0 -0.17 0.0289
09-Apr-2012 229.25 0 -0.17 0.0289
10-Apr-2012 229.25 0 -0.17 0.0289
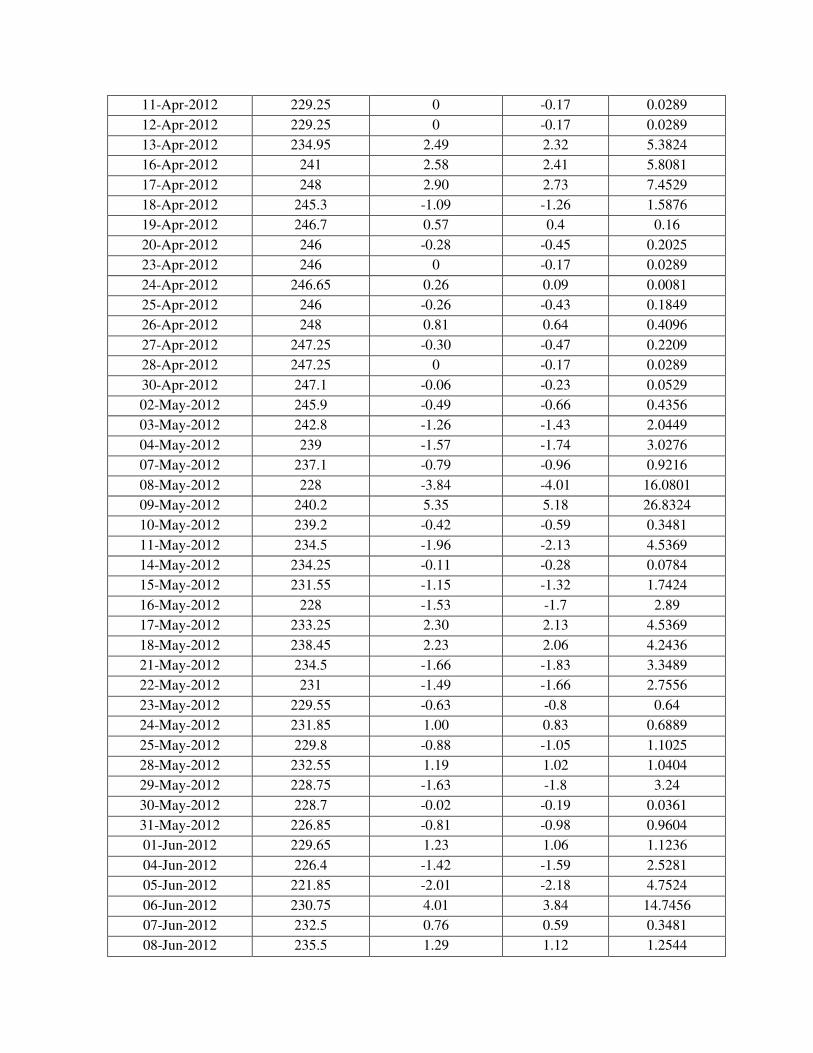
11-Apr-2012 229.25 0 -0.17 0.0289
12-Apr-2012 229.25 0 -0.17 0.0289
13-Apr-2012 234.95 2.49 2.32 5.3824
16-Apr-2012 241 2.58 2.41 5.8081
17-Apr-2012 248 2.90 2.73 7.4529
18-Apr-2012 245.3 -1.09 -1.26 1.5876
19-Apr-2012 246.7 0.57 0.4 0.16
20-Apr-2012 246 -0.28 -0.45 0.2025
23-Apr-2012 246 0 -0.17 0.0289
24-Apr-2012 246.65 0.26 0.09 0.0081
25-Apr-2012 246 -0.26 -0.43 0.1849
26-Apr-2012 248 0.81 0.64 0.4096
27-Apr-2012 247.25 -0.30 -0.47 0.2209
28-Apr-2012 247.25 0 -0.17 0.0289
30-Apr-2012 247.1 -0.06 -0.23 0.0529
02-May-2012 245.9 -0.49 -0.66 0.4356
03-May-2012 242.8 -1.26 -1.43 2.0449
04-May-2012 239 -1.57 -1.74 3.0276
07-May-2012 237.1 -0.79 -0.96 0.9216
08-May-2012 228 -3.84 -4.01 16.0801
09-May-2012 240.2 5.35 5.18 26.8324
10-May-2012 239.2 -0.42 -0.59 0.3481
11-May-2012 234.5 -1.96 -2.13 4.5369
14-May-2012 234.25 -0.11 -0.28 0.0784
15-May-2012 231.55 -1.15 -1.32 1.7424
16-May-2012 228 -1.53 -1.7 2.89
17-May-2012 233.25 2.30 2.13 4.5369
18-May-2012 238.45 2.23 2.06 4.2436
21-May-2012 234.5 -1.66 -1.83 3.3489
22-May-2012 231 -1.49 -1.66 2.7556
23-May-2012 229.55 -0.63 -0.8 0.64
24-May-2012 231.85 1.00 0.83 0.6889
25-May-2012 229.8 -0.88 -1.05 1.1025
28-May-2012 232.55 1.19 1.02 1.0404
29-May-2012 228.75 -1.63 -1.8 3.24
30-May-2012 228.7 -0.02 -0.19 0.0361
31-May-2012 226.85 -0.81 -0.98 0.9604
01-Jun-2012 229.65 1.23 1.06 1.1236
04-Jun-2012 226.4 -1.42 -1.59 2.5281
05-Jun-2012 221.85 -2.01 -2.18 4.7524
06-Jun-2012 230.75 4.01 3.84 14.7456
07-Jun-2012 232.5 0.76 0.59 0.3481
08-Jun-2012 235.5 1.29 1.12 1.2544
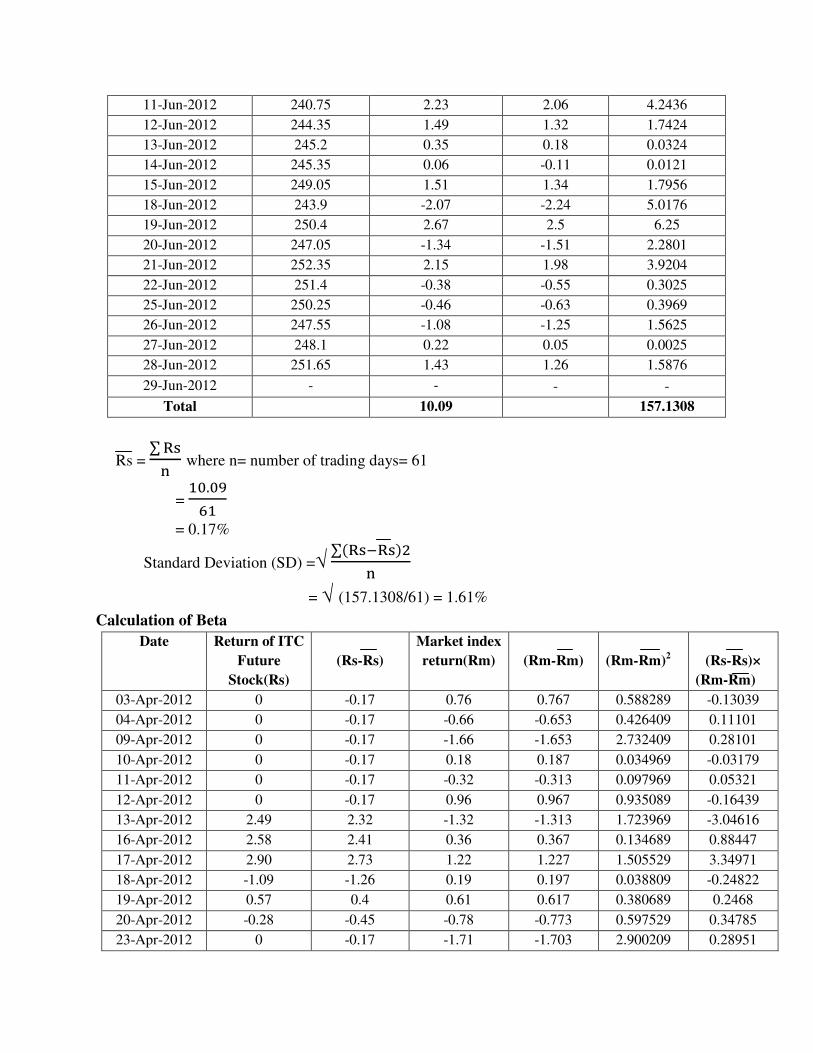
11-Jun-2012 240.75 2.23 2.06 4.2436
12-Jun-2012 244.35 1.49 1.32 1.7424
13-Jun-2012 245.2 0.35 0.18 0.0324
14-Jun-2012 245.35 0.06 -0.11 0.0121
15-Jun-2012 249.05 1.51 1.34 1.7956
18-Jun-2012 243.9 -2.07 -2.24 5.0176
19-Jun-2012 250.4 2.67 2.5 6.25
20-Jun-2012 247.05 -1.34 -1.51 2.2801
21-Jun-2012 252.35 2.15 1.98 3.9204
22-Jun-2012 251.4 -0.38 -0.55 0.3025
25-Jun-2012 250.25 -0.46 -0.63 0.3969
26-Jun-2012 247.55 -1.08 -1.25 1.5625
27-Jun-2012 248.1 0.22 0.05 0.0025
28-Jun-2012 251.65 1.43 1.26 1.5876
29-Jun-2012 - - - -
Total 10.09 157.1308
Rs = ∑ *�
( where n= number of trading days= 61
= &'.'<
:&
= 0.17%
Standard Deviation (SD) =√ ∑ *�!*��
(
= √ (157.1308/61) = 1.61%
Calculation of Beta
Date Return of ITC
Future
Stock(Rs)
(Rs-Rs)
Market index
return(Rm)
(Rm-Rm)
(Rm-Rm)2
(Rs-Rs)×
(Rm-Rm)
03-Apr-2012 0 -0.17 0.76 0.767 0.588289 -0.13039
04-Apr-2012 0 -0.17 -0.66 -0.653 0.426409 0.11101
09-Apr-2012 0 -0.17 -1.66 -1.653 2.732409 0.28101
10-Apr-2012 0 -0.17 0.18 0.187 0.034969 -0.03179
11-Apr-2012 0 -0.17 -0.32 -0.313 0.097969 0.05321
12-Apr-2012 0 -0.17 0.96 0.967 0.935089 -0.16439
13-Apr-2012 2.49 2.32 -1.32 -1.313 1.723969 -3.04616
16-Apr-2012 2.58 2.41 0.36 0.367 0.134689 0.88447
17-Apr-2012 2.90 2.73 1.22 1.227 1.505529 3.34971
18-Apr-2012 -1.09 -1.26 0.19 0.197 0.038809 -0.24822
19-Apr-2012 0.57 0.4 0.61 0.617 0.380689 0.2468
20-Apr-2012 -0.28 -0.45 -0.78 -0.773 0.597529 0.34785
23-Apr-2012 0 -0.17 -1.71 -1.703 2.900209 0.28951
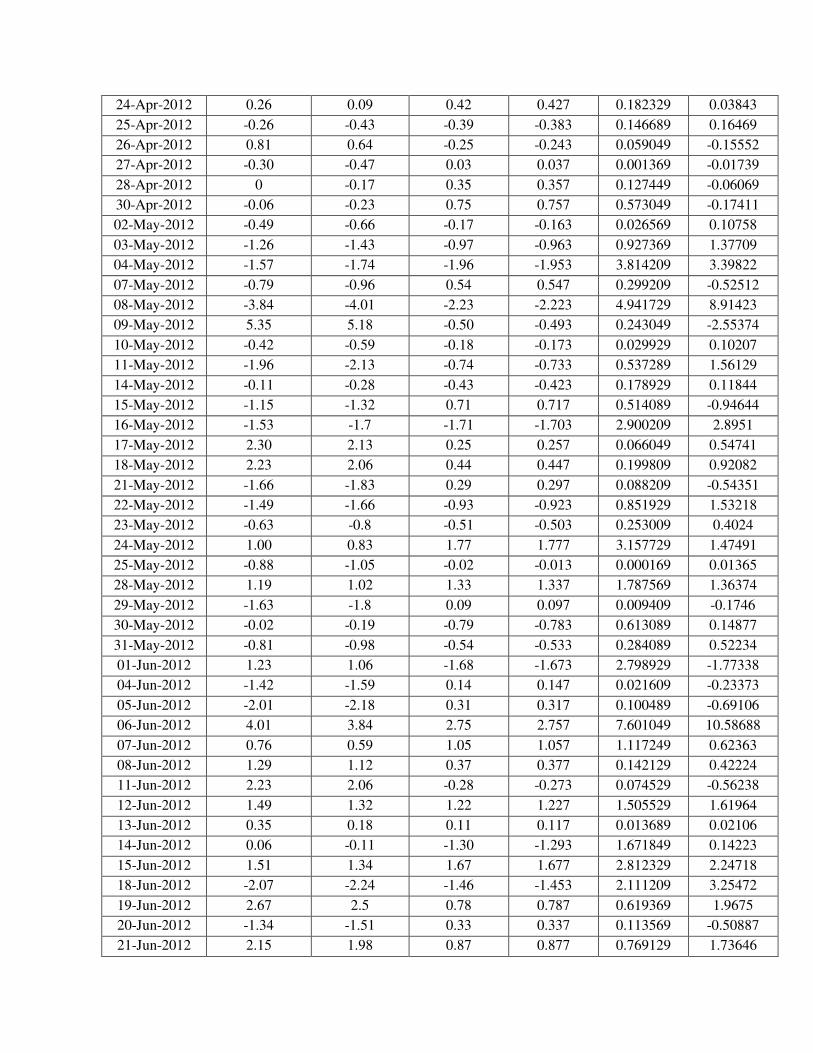
24-Apr-2012 0.26 0.09 0.42 0.427 0.182329 0.03843
25-Apr-2012 -0.26 -0.43 -0.39 -0.383 0.146689 0.16469
26-Apr-2012 0.81 0.64 -0.25 -0.243 0.059049 -0.15552
27-Apr-2012 -0.30 -0.47 0.03 0.037 0.001369 -0.01739
28-Apr-2012 0 -0.17 0.35 0.357 0.127449 -0.06069
30-Apr-2012 -0.06 -0.23 0.75 0.757 0.573049 -0.17411
02-May-2012 -0.49 -0.66 -0.17 -0.163 0.026569 0.10758
03-May-2012 -1.26 -1.43 -0.97 -0.963 0.927369 1.37709
04-May-2012 -1.57 -1.74 -1.96 -1.953 3.814209 3.39822
07-May-2012 -0.79 -0.96 0.54 0.547 0.299209 -0.52512
08-May-2012 -3.84 -4.01 -2.23 -2.223 4.941729 8.91423
09-May-2012 5.35 5.18 -0.50 -0.493 0.243049 -2.55374
10-May-2012 -0.42 -0.59 -0.18 -0.173 0.029929 0.10207
11-May-2012 -1.96 -2.13 -0.74 -0.733 0.537289 1.56129
14-May-2012 -0.11 -0.28 -0.43 -0.423 0.178929 0.11844
15-May-2012 -1.15 -1.32 0.71 0.717 0.514089 -0.94644
16-May-2012 -1.53 -1.7 -1.71 -1.703 2.900209 2.8951
17-May-2012 2.30 2.13 0.25 0.257 0.066049 0.54741
18-May-2012 2.23 2.06 0.44 0.447 0.199809 0.92082
21-May-2012 -1.66 -1.83 0.29 0.297 0.088209 -0.54351
22-May-2012 -1.49 -1.66 -0.93 -0.923 0.851929 1.53218
23-May-2012 -0.63 -0.8 -0.51 -0.503 0.253009 0.4024
24-May-2012 1.00 0.83 1.77 1.777 3.157729 1.47491
25-May-2012 -0.88 -1.05 -0.02 -0.013 0.000169 0.01365
28-May-2012 1.19 1.02 1.33 1.337 1.787569 1.36374
29-May-2012 -1.63 -1.8 0.09 0.097 0.009409 -0.1746
30-May-2012 -0.02 -0.19 -0.79 -0.783 0.613089 0.14877
31-May-2012 -0.81 -0.98 -0.54 -0.533 0.284089 0.52234
01-Jun-2012 1.23 1.06 -1.68 -1.673 2.798929 -1.77338
04-Jun-2012 -1.42 -1.59 0.14 0.147 0.021609 -0.23373
05-Jun-2012 -2.01 -2.18 0.31 0.317 0.100489 -0.69106
06-Jun-2012 4.01 3.84 2.75 2.757 7.601049 10.58688
07-Jun-2012 0.76 0.59 1.05 1.057 1.117249 0.62363
08-Jun-2012 1.29 1.12 0.37 0.377 0.142129 0.42224
11-Jun-2012 2.23 2.06 -0.28 -0.273 0.074529 -0.56238
12-Jun-2012 1.49 1.32 1.22 1.227 1.505529 1.61964
13-Jun-2012 0.35 0.18 0.11 0.117 0.013689 0.02106
14-Jun-2012 0.06 -0.11 -1.30 -1.293 1.671849 0.14223
15-Jun-2012 1.51 1.34 1.67 1.677 2.812329 2.24718
18-Jun-2012 -2.07 -2.24 -1.46 -1.453 2.111209 3.25472
19-Jun-2012 2.67 2.5 0.78 0.787 0.619369 1.9675
20-Jun-2012 -1.34 -1.51 0.33 0.337 0.113569 -0.50887
21-Jun-2012 2.15 1.98 0.87 0.877 0.769129 1.73646

22-Jun-2012 -0.38 -0.55 -0.37 -0.363 0.131769 0.19965
25-Jun-2012 -0.46 -0.63 -0.61 -0.603 0.363609 0.37989
26-Jun-2012 -1.08 -1.25 0.12 0.127 0.016129 -0.15875
27-Jun-2012 0.22 0.05 0.41 0.417 0.173889 0.02085
28-Jun-2012 1.43 1.26 0.14 0.147 0.021609 0.18522
29-Jun-2012 0 0 2.52 2.527 6.385729 0
Total 10.09 -0.43 63.47552 41.87384
β � CoVimσm2 �
∑BCRs;RsECRm;RmEFn
∑CRm;RmE2n
= 6&.98796
:7.6844 = 0.66
3. ACC LTD.
Calculation of Risk and Return
Date
Script Value
Return(Rs) in %
(Rs-Rs)
(Rs-Rs)2
02-Apr-2012 1354.8
03-Apr-2012 1380 1.86 2.01 4.0401
04-Apr-2012 1350 -2.17 -2.02 4.0804
09-Apr-2012 1350 0 0.15 0.0225
10-Apr-2012 1317.75 -2.39 -2.24 5.0176
11-Apr-2012 1249.8 -5.16 -5.01 25.1001
12-Apr-2012 1286.75 2.96 3.11 9.6721
13-Apr-2012 1286.75 0 0.15 0.0225
16-Apr-2012 1249 -2.93 -2.78 7.7284
17-Apr-2012 1261 0.96 1.11 1.2321
18-Apr-2012 1300.4 3.12 3.27 10.6929
19-Apr-2012 1271 -2.26 -2.11 4.4521
20-Apr-2012 1230.15 -3.21 -3.06 9.3636
23-Apr-2012 1245.9 1.28 1.43 2.0449
24-Apr-2012 1224.3 -1.73 -1.58 2.4964
25-Apr-2012 1208.25 -1.31 -1.16 1.3456
26-Apr-2012 1208.95 0.06 0.21 0.0441
27-Apr-2012 1207.4 -0.13 0.02 0.0004
28-Apr-2012 1205 -0.19 -0.04 0.0016
30-Apr-2012 1236.05 2.58 2.73 7.4529
02-May-2012 1216.5 -1.58 -1.43 2.0449
03-May-2012 1204.85 -0.96 -0.81 0.6561
04-May-2012 1206.2 0.11 0.26 0.0676
07-May-2012 1226.85 1.71 1.86 3.4596
08-May-2012 1213.25 -1.11 -0.96 0.9216
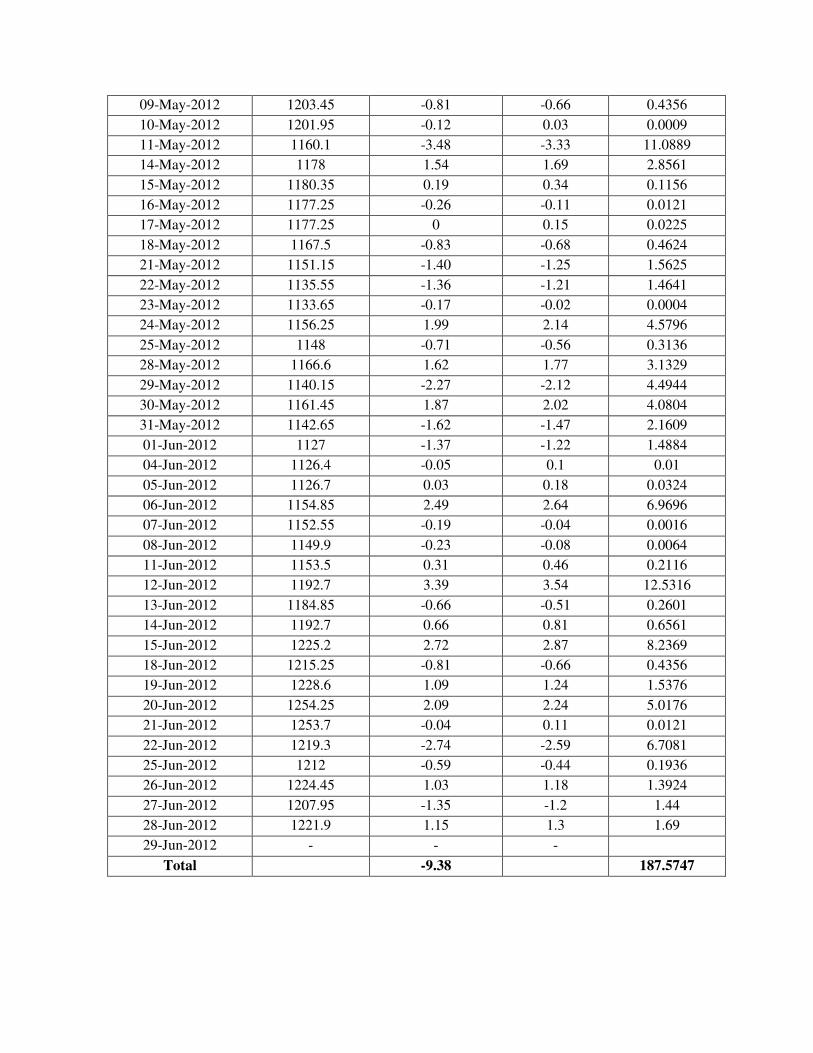
09-May-2012 1203.45 -0.81 -0.66 0.4356
10-May-2012 1201.95 -0.12 0.03 0.0009
11-May-2012 1160.1 -3.48 -3.33 11.0889
14-May-2012 1178 1.54 1.69 2.8561
15-May-2012 1180.35 0.19 0.34 0.1156
16-May-2012 1177.25 -0.26 -0.11 0.0121
17-May-2012 1177.25 0 0.15 0.0225
18-May-2012 1167.5 -0.83 -0.68 0.4624
21-May-2012 1151.15 -1.40 -1.25 1.5625
22-May-2012 1135.55 -1.36 -1.21 1.4641
23-May-2012 1133.65 -0.17 -0.02 0.0004
24-May-2012 1156.25 1.99 2.14 4.5796
25-May-2012 1148 -0.71 -0.56 0.3136
28-May-2012 1166.6 1.62 1.77 3.1329
29-May-2012 1140.15 -2.27 -2.12 4.4944
30-May-2012 1161.45 1.87 2.02 4.0804
31-May-2012 1142.65 -1.62 -1.47 2.1609
01-Jun-2012 1127 -1.37 -1.22 1.4884
04-Jun-2012 1126.4 -0.05 0.1 0.01
05-Jun-2012 1126.7 0.03 0.18 0.0324
06-Jun-2012 1154.85 2.49 2.64 6.9696
07-Jun-2012 1152.55 -0.19 -0.04 0.0016
08-Jun-2012 1149.9 -0.23 -0.08 0.0064
11-Jun-2012 1153.5 0.31 0.46 0.2116
12-Jun-2012 1192.7 3.39 3.54 12.5316
13-Jun-2012 1184.85 -0.66 -0.51 0.2601
14-Jun-2012 1192.7 0.66 0.81 0.6561
15-Jun-2012 1225.2 2.72 2.87 8.2369
18-Jun-2012 1215.25 -0.81 -0.66 0.4356
19-Jun-2012 1228.6 1.09 1.24 1.5376
20-Jun-2012 1254.25 2.09 2.24 5.0176
21-Jun-2012 1253.7 -0.04 0.11 0.0121
22-Jun-2012 1219.3 -2.74 -2.59 6.7081
25-Jun-2012 1212 -0.59 -0.44 0.1936
26-Jun-2012 1224.45 1.03 1.18 1.3924
27-Jun-2012 1207.95 -1.35 -1.2 1.44
28-Jun-2012 1221.9 1.15 1.3 1.69
29-Jun-2012 - - -
Total -9.38 187.5747
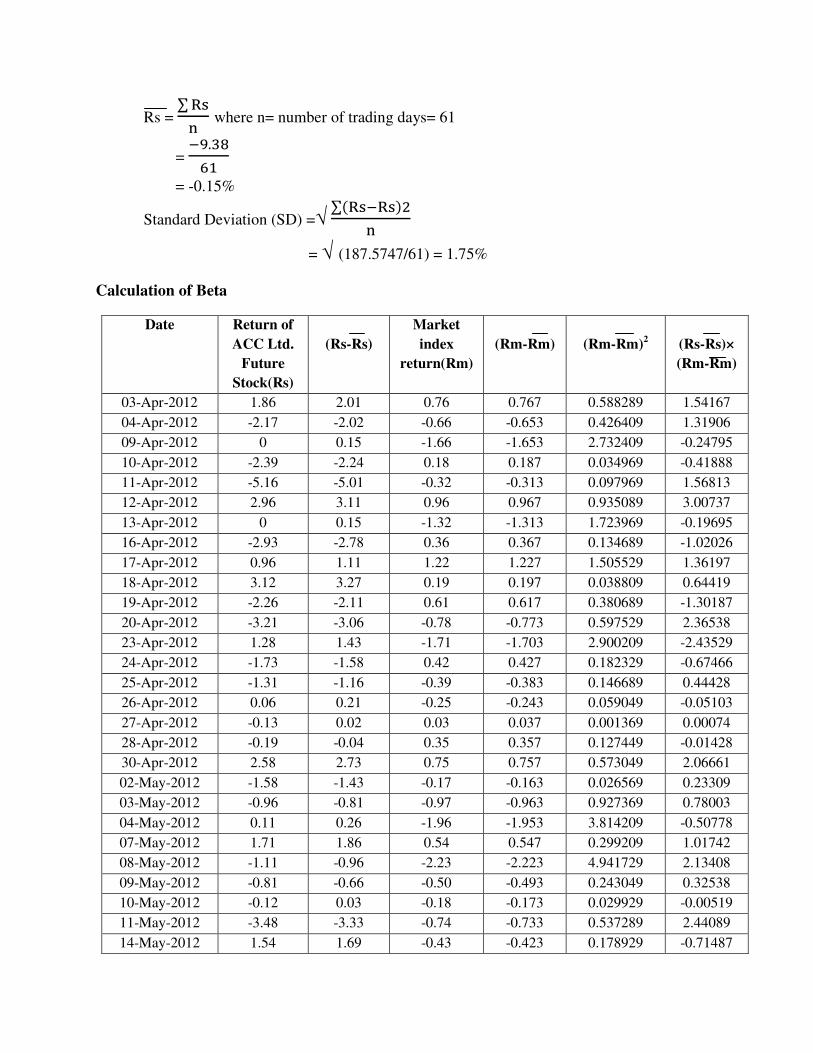
Rs = ∑ *�
( where n= number of trading days= 61
= !<.79
:&
= -0.15%
Standard Deviation (SD) =√ ∑ *�!*��
(
= √ (187.5747/61) = 1.75%
Calculation of Beta
Date Return of
ACC Ltd.
Future
Stock(Rs)
(Rs-Rs)
Market
index
return(Rm)
(Rm-Rm)
(Rm-Rm)2
(Rs-Rs)×
(Rm-Rm)
03-Apr-2012 1.86 2.01 0.76 0.767 0.588289 1.54167
04-Apr-2012 -2.17 -2.02 -0.66 -0.653 0.426409 1.31906
09-Apr-2012 0 0.15 -1.66 -1.653 2.732409 -0.24795
10-Apr-2012 -2.39 -2.24 0.18 0.187 0.034969 -0.41888
11-Apr-2012 -5.16 -5.01 -0.32 -0.313 0.097969 1.56813
12-Apr-2012 2.96 3.11 0.96 0.967 0.935089 3.00737
13-Apr-2012 0 0.15 -1.32 -1.313 1.723969 -0.19695
16-Apr-2012 -2.93 -2.78 0.36 0.367 0.134689 -1.02026
17-Apr-2012 0.96 1.11 1.22 1.227 1.505529 1.36197
18-Apr-2012 3.12 3.27 0.19 0.197 0.038809 0.64419
19-Apr-2012 -2.26 -2.11 0.61 0.617 0.380689 -1.30187
20-Apr-2012 -3.21 -3.06 -0.78 -0.773 0.597529 2.36538
23-Apr-2012 1.28 1.43 -1.71 -1.703 2.900209 -2.43529
24-Apr-2012 -1.73 -1.58 0.42 0.427 0.182329 -0.67466
25-Apr-2012 -1.31 -1.16 -0.39 -0.383 0.146689 0.44428
26-Apr-2012 0.06 0.21 -0.25 -0.243 0.059049 -0.05103
27-Apr-2012 -0.13 0.02 0.03 0.037 0.001369 0.00074
28-Apr-2012 -0.19 -0.04 0.35 0.357 0.127449 -0.01428
30-Apr-2012 2.58 2.73 0.75 0.757 0.573049 2.06661
02-May-2012 -1.58 -1.43 -0.17 -0.163 0.026569 0.23309
03-May-2012 -0.96 -0.81 -0.97 -0.963 0.927369 0.78003
04-May-2012 0.11 0.26 -1.96 -1.953 3.814209 -0.50778
07-May-2012 1.71 1.86 0.54 0.547 0.299209 1.01742
08-May-2012 -1.11 -0.96 -2.23 -2.223 4.941729 2.13408
09-May-2012 -0.81 -0.66 -0.50 -0.493 0.243049 0.32538
10-May-2012 -0.12 0.03 -0.18 -0.173 0.029929 -0.00519
11-May-2012 -3.48 -3.33 -0.74 -0.733 0.537289 2.44089
14-May-2012 1.54 1.69 -0.43 -0.423 0.178929 -0.71487

15-May-2012 0.19 0.34 0.71 0.717 0.514089 0.24378
16-May-2012 -0.26 -0.11 -1.71 -1.703 2.900209 0.18733
17-May-2012 0 0.15 0.25 0.257 0.066049 0.03855
18-May-2012 -0.83 -0.68 0.44 0.447 0.199809 -0.30396
21-May-2012 -1.40 -1.25 0.29 0.297 0.088209 -0.37125
22-May-2012 -1.36 -1.21 -0.93 -0.923 0.851929 1.11683
23-May-2012 -0.17 -0.02 -0.51 -0.503 0.253009 0.01006
24-May-2012 1.99 2.14 1.77 1.777 3.157729 3.80278
25-May-2012 -0.71 -0.56 -0.02 -0.013 0.000169 0.00728
28-May-2012 1.62 1.77 1.33 1.337 1.787569 2.36649
29-May-2012 -2.27 -2.12 0.09 0.097 0.009409 -0.20564
30-May-2012 1.87 2.02 -0.79 -0.783 0.613089 -1.58166
31-May-2012 -1.62 -1.47 -0.54 -0.533 0.284089 0.78351
01-Jun-2012 -1.37 -1.22 -1.68 -1.673 2.798929 2.04106
04-Jun-2012 -0.05 0.1 0.14 0.147 0.021609 0.0147
05-Jun-2012 0.03 0.18 0.31 0.317 0.100489 0.05706
06-Jun-2012 2.49 2.64 2.75 2.757 7.601049 7.27848
07-Jun-2012 -0.19 -0.04 1.05 1.057 1.117249 -0.04228
08-Jun-2012 -0.23 -0.08 0.37 0.377 0.142129 -0.03016
11-Jun-2012 0.31 0.46 -0.28 -0.273 0.074529 -0.12558
12-Jun-2012 3.39 3.54 1.22 1.227 1.505529 4.34358
13-Jun-2012 -0.66 -0.51 0.11 0.117 0.013689 -0.05967
14-Jun-2012 0.66 0.81 -1.30 -1.293 1.671849 -1.04733
15-Jun-2012 2.72 2.87 1.67 1.677 2.812329 4.81299
18-Jun-2012 -0.81 -0.66 -1.46 -1.453 2.111209 0.95898
19-Jun-2012 1.09 1.24 0.78 0.787 0.619369 0.97588
20-Jun-2012 2.09 2.24 0.33 0.337 0.113569 0.75488
21-Jun-2012 -0.04 0.11 0.87 0.877 0.769129 0.09647
22-Jun-2012 -2.74 -2.59 -0.37 -0.363 0.131769 0.94017
25-Jun-2012 -0.59 -0.44 -0.61 -0.603 0.363609 0.26532
26-Jun-2012 1.03 1.18 0.12 0.127 0.016129 0.14986
27-Jun-2012 -1.35 -1.2 0.41 0.417 0.173889 -0.5004
28-Jun-2012 1.15 1.3 0.14 0.147 0.021609 0.1911
29-Jun-2012 - - 2.52 2.527 6.385729 0
Total -9.38 -0.43 63.47552 40.83049
β � ∑BCRs;RsECRm;RmEF
n ∑CRm;RmE2
n
= 6'.97'4
:7.6844
= 0.64
4.2 References
Books:
• Khan M Y, Jain P K, Financial Management, sixth edition, pp-22.1 to 22.4 & pp-28.1 to
28.3.
• Sasidharan K, Mathews Alex K, Security Analysis and Portfolio Management, pp-284 to
310.
Websites:
• http://www.sharetipsinfo.com/stock-market-types.html
Viewed at 12.20P.M on date July 14, 2012
• http://nseindia.com/products/content/equities/indices/historical_index_data.htm
Viewed at 4.30P.M on date July 2, 2012
• http://nseindia.com/products/content/equities/equities/eq_security.htm
Viewed at 4.00P.M on date July 3, 2012
• http://nseindia.com/products/content/derivatives/equities/historical_fo.htm
Viewed at 4.15P.M on date July 4, 2012
• http://www.slideshare.net/hemanthcrpatna/a-study-on-performance-evaluation-of-equity-
shares-mutual-funds
Viewed at 6.00P.M on date July 11, 2012
• http://www.scribd.com/doc/24538633/Comparative-Analysis-of-Equity-and-Derivative-
Market
Viewed at 6.15P.M on date July 12, 2012
• http://www.nseindia.com/content/nsccl/nsccl_eqcatmargins.htm
Viewed at 6.25P.M on date July 8, 2012
• http://financelearners.blogspot.in/2011/04/advantages-disadvantages-futures.html
Viewed at 7.00P.M on date June 16, 2012
• http://daytrading.about.com/od/daytradingbasics/a/MarketPricesMove.htm
Viewed at 7.45P.M on date July 16, 2012