comparative proteome analysis of 3t3-l1 adipocyte differentiation using itraq-coupled 2d lc-ms/ms
TRANSCRIPT

Comparative Proteome Analysis of 3T3-L1 AdipocyteDifferentiation Using iTRAQ-Coupled 2D LC-MS/MS
Feng Ye,1,2 Huoming Zhang,3 Yi-Xuan Yang,4 Huai-Dong Hu,4 Siu Kwan Sze,3 Wei Meng,3
Jingru Qian,3 Hong Ren,4 Bao-Lin Yang,1,2 Ming-Ying Luo,1,2 Xiaoqiong Wu,2 Wu Zhu,1
Wei-Jun Cai,1* and Jian-Bin Tong2*1Department of Histology & Embryology, Xiangya School of Medicine, Central South University, Changsha,Hunan 410078, China
2Department of Anatomy & Neurobiology, Xiangya School of Medicine, Central South University, Changsha,Hunan 410078, China
3School of Biological Science, Nanyang Technological University, 60 Nanyang Drive, Singapore 637551, Singapore4Key Laboratory of Molecular Biology for Infectious Diseases, Ministry of Education of China,The Second Affiliated Hospital, Chongqing Medical University, Chongqing 400010, China
ABSTRACTAdipose tissue is critical in obesity and type II diabetes. Blocking of adipocyte differentiation is one of the anti-obesity strategies targeting on
strong rise in fat storage and secretion of adipokine(s). However, the molecular basis of adipocyte differentiation and its regulation remains
obscure. Therefore, we exposed 3T3-L1 cell line to appropriate hormonal inducers as adipocyte differentiation model. Using iTRAQ-coupled
2D LC-MS/MS, a successfully exploited high-throughput proteomic technology, we nearly quantitated 1,000 protein species and found 106
significantly altered proteins during adipocyte differentiation. The great majority of differentially expressed proteins were related to
metabolism enzymes, structural molecules, and proteins involved in signal transduction. In addition to previously reported differentially
expressed molecules, more than 20 altered proteins previously unknown to be involved with adipogenic process were firstly revealed (e.g.,
HEXB, DPP7, PTTG1IP, PRDX5, EPDR1, SPNB2, STEAP3, TPP1, etc.). The partially differential proteins were verified by Western blot and/or
real-time PCR analysis. Furthermore, the association of PCX and VDAC2, two altered proteins, with adipocyte conversion was analyzed using
siRNA method, and the results showed that they could contribute considerably to adipogenesis. In conclusion, our data provide valuable
information for further understanding of adipogenesis. J. Cell. Biochem. 112: 3002–3014, 2011. � 2011 Wiley-Liss, Inc.
KEY WORDS: 3T3-L1 ADIPOCYTES; PROTEOMICS; DIFFERENTIATION; iTRAQ
O besity is one of the most frequent physiological disorders
that is associated with a wide variety of conditions including
type II diabetes, cardiovascular diseases and cancer [Thompson and
Wolf, 2001]. It is characterized by excess of body fat mass, which is
mostly stored in adipose tissue. There are indications that obesity
is fast becoming a serious health problem worldwide [Bray and
Tartaglia, 2000; Thompson and Wolf, 2001].
Accumulating evidence has indicated that adipocyte differentia-
tion, an increase in fat cell number, plays an important role in
obesity, and adipose tissue is a highly active endocrine organ
capable of secreting a number of signal molecules called adipokines
(including leptin, adiponectin, resistin, etc.) [Bray and Tartaglia,
2000; Rosen and Spiegelman, 2006; Trujillo and Scherer, 2006;
Molina et al., 2009; Ye et al., 2010]. Leptin has actions in the
metabolism, development, immune system, reproduction, hemo-
poiesis, angiogenesis, and bone formation [Bornstein et al., 2000;
Cock and Auwerx, 2003; Rondinone, 2006; Than et al., 2010].
Resistin participates in obesity, type II diabetes, and inflammation-
Journal of CellularBiochemistry
ARTICLEJournal of Cellular Biochemistry 112:3002–3014 (2011)
3002
Abbreviations used: 2D, two-dimensional; LC, liquid chromatography; MS, mass spectrometry; iTRAQ, isobaric tagsfor relative and absolute quantification; SILAC, stable isotope labeling with amino acids in cell culture; DIGE,differential gel electrophoresis; ICAT, isotope-coded affinity tag.
The authors declare that there is no conflict of interest that could be perceived as prejudicing the impartiality of thisscientific work.
Grant sponsor: Natural Sciences Funds of China; Grant numbers: 30971532, 30771134, 30930082, 30900507, 30801348.
*Correspondence to: Prof. Wei-Jun Cai, MD, PhD, Jian-Bin Tong, MD, PhD, 172 Tong-Zhi-Po Road, Changsha, Hunan410078, P.R. China. E-mail: [email protected], [email protected]
Received 15 March 2011; Accepted 3 June 2011 � DOI 10.1002/jcb.23223 � � 2011 Wiley-Liss, Inc.
Published online 15 June 2011 in Wiley Online Library (wileyonlinelibrary.com).
related diseases. In a summary, adipose tissue plays key roles in the
regulation of energy homeostasis, lipoprotein metabolism and other
physiological functions via adipokines [Miner, 2004; Rondinone,
2006; Rosen and Spiegelman, 2006; Trujillo and Scherer, 2006; Lago
et al., 2007, 2009]. A plenty of adipokines were consequently
released to play multifaceted roles through both central and
peripheral mechanisms due to the excessive increase of sheer
number and volume of adipocytes. Targeting on adipocyte
differentiation became one approach among the anti-obesity and
related diseases strategies targeting on strong rise in fat storage and
secretion of adipokine(s) [Bray and Tartaglia, 2000; Rosen and
Spiegelman, 2006; Trujillo and Scherer, 2006; Kim et al., 2008].
Previous studies demonstrated that many transcription factors and
metabolism enzymes are altered during various stages of adipogen-
esis and play roles in adipocyte differentiation (e.g., CCAAT/
enhancer binding proteins (C/EBPs), cAMP response element-
binding protein (CREB), peroxisome proliferator-activated receptor
(PPAR)-gamma, fatty acid synthase (FAS), pyruvate carboxylase
(PCX), superoxide dismutase (SOD), and lipoprotein lipase (LPL) that
are differentially expressed during adipocyte differentiation).
Indeed, differentiation of adipocyte may be regulated by a complex
network of adipogenic transcription factors [Shao and Lazar, 1997;
Zhou et al., 1999; Hackl et al., 2005], and matured adipocytes act as
endocrine cells [Miner, 2004]. These factors affect each other and
regulate the expression of adipokines positively or negatively [Zhou
et al., 1999; Hackl et al., 2005].
However, until now, the mechanisms and regulation of adipocyte
differentiation and secretion are inadequately understood. Several
studies using proteomic approaches have been reported. These
studies have used 2D electrophoresis technology [Renes et al., 2005;
Atiar Rahman et al., 2008; Kim et al., 2009; Choi et al., 2004] or
SILAC [Molina et al., 2009], and might have missed many low
abundance proteins that are important to the adipogenic process.
Recently, there has been great progress in comparative proteomic
approaches, including DIGE, iTRAQ, 18O, ICAT, and SILAC. Among
these methods, iTRAQ technology has gained great popularity in
quantitative proteomics applications due to its high sensitivity,
accurate quantitation and reproducibility [Hu et al., 2010; Zhang
et al., 2011]. Murine 3T3-L1 cells, a most frequent adipogenesis
model, are used to study adipocytes in vitro. To our best knowledge,
there is no report that profiled proteome during 3T3-L1 adipocyte
differentiation using iTRAQ-coupled 2D LC-MS/MS. The present
study was designed to find proteins involved in regulation of
adipocyte differentiation and secretion of adipokine(s) using this
high-throughput proteomic technology. We screened 106 differen-
tially expressed proteins during adipocyte differentiation. This
systematic proteomic approach led to the discovery of novel
proteins targeting on obesity.
MATERIALS AND METHODS
REAGENTS
The iTRAQ kit was purchased from Applied Biosystems Company
(MA). Two-dimentional Quant Kit was purchased from GE
Healthcare (WI). Sequence grade modified Trypsin was purchased
from Promega (WI). Bromophenol blue, Bis, TEMED, coomassie
brilliant blue G-250, low molecular weight marker, Tris-base,
nitrocellulose membrane, and protein assay kit based on Bradford
method were purchased from Bio-Rad Company (CA). Polyclonal
antibodies, secondary antibodies, and siRNA kits were purchased
from Santa Cruz Biotechnology (CA). Pierce chemiluminescent
substrate kit was purchased from Thermo Scientific (USA).
Lipofectamine 2000 reagent was obtained from Invitrogen
Corporation (Carlsbad, CA). Commercial triglyceride kit was
purchased from Zhongsheng Company (Beijing, China). Unless
otherwise noted, all other reagents were from Sigma Company
(USA).
CELL CULTURE AND DIFFERENTIATION
Murine 3T3-L1 fibroblasts (American Type Culture Collection, MD)
were initially cultured in DMEM medium (Gibco, Rockville, MD)
supplemented with 10% heat-inactivated bovine calf serum (Gibco)
and 1% penicillin–streptomycin (Gibco) at 378C in a humidified
atmosphere of 5% CO2/95% air. Differentiation of 3T3-L1 fibroblasts
to adipocytes was induced similarly as previously described [Shao
and Lazar, 1997]. After 3T3-L1 fibroblasts reached confluence for
2 days (referred as day 0), cells were cultured in the differentiation
medium for 2 days, which is DMEM medium supplemented with
10% fetal bovine serum (FBS), 1mM dexamethasone, 10mg/ml
insulin, and 0.5mM isobutyl-1-methylxanthine. The cells were then
maintained in the medium containing 10% FBS and 10mg/ml
insulin for 2 days and replenished with the DMEM containing 10%
FBS. Differentiation was monitored by the visual appearance of fat
droplets in the cells. In this series of experiments, we set two groups:
(1) 3T3-LI fibroblasts. They were collected after cells reached
confluence; (2) 3T3-LI adipocytes. On day 10 of differentiation, cells
were harvested. The samples prepared for protein or total RNA
extraction. At the same time, adipogenesis was evaluated by Oil Red
staining (a specific lipid staining) and triglyceride analysis. Oil Red O
staining was used to monitor the adipogenic process. It was
performed as previously described with minor modifications
[Akerblad et al., 2005]. In brief, cells were washed twice in ice-
cold PBS and fixed in PBS containing 4% formaldehyde. After a
single wash in water, cells were stained with Oil Red O for 30min. Oil
Red O was prepared by diluting a stock solution [0.6 g of Oil Red O
(Sigma Company) in 100ml of isopropanol] with water (3:2)
followed by filtration. After elution of Oil Red O with isopropanol,
the extent of adipocyte differentiation was quantitated by
determining the amount of extracted dye as measured by the
optimal absorbance at 520 nm. The triglyceride produced by the
cells was taken as an index of adipocyte differentiation. 3T3-L1 cells
were collected and homogenized by sonication. Cellular triglyceride
content was determined by using Triglyceride GPO-POD Assay Kit
(Zhongsheng Company) according to the manufacturer’s protocol.
This procedure involves enzymatic hydrolysis by lipase of the
triglycerides to glycerol and free fatty acids. The increase in
absorbance at 500 nm is directly proportional to triglyceride
concentration of the sample.
PROTEIN SAMPLES PREPARATION
The cells were collected and then re-suspended in lysis buffer (0.5M
triethylammonium bicarbonate (TEAB) and 1% SDS) at 48C. The cell
JOURNAL OF CELLULAR BIOCHEMISTRY iTRAQ ANALYSIS OF 3T3-L1 ADIPOCYTE DIFFERENTIATION 3003

lysate was subjected to intermittent sonication using a Vibra CellTM
high intensity ultrasonic processor (Jencon, Leighton Buzzard,
Bedfordshire, UK). The remaining unbroken cells and debris were
removed by centrifugation at 48C at 12,000g for 10min. Protein
concentration of cleared lysates was quantified using the 2D Quant
Kit (GE Healthcare). A standard curve was made using BSA as a
control.
PROTEIN DIGESTION AND iTRAQ LABELING
Each sample was equally divided into two tubes. The proteins were
reduced with 5mM tris-carboxyethyl phosphine hydrochloride
(TCEP) for 1 h at 378C, alkylated with 10mM methylethanethio-
sulfonate (MMTS) for 20min at room temperature (RT); and then
diluted 10 times with deionized water prior to digestion with
sequence grade modified trypsin (Promega) overnight at 378C at a
1 part trypsin to 50 part protein mass ratio and then dried using a
Speedvac (Thermo Electron). Peptides generated were labeled with
iTRAQ reagents according to the manufacturer’s protocol (Applied
Biosystems Company). Briefly, digested proteins were reconstituted
in 30ml of 0.5M TEAB buffer and mixed with 70ml of ethanol-
suspended iTRAQ reagents (one iTRAQ reporter tag per protein
sample). The samples were labeled with the respective tags as
followed: control 3T3-LI fibroblasts¼ iTRAQ 114; 3T3-LI adipocy-
tes¼ iTRAQ 115. Labeling reactions were carried out for 1 h at RT
before all the samples were mixed into a tube and dried using a
Speedvac. To increase the coverage of protein identification and/or
the confidence of the data generated, independent two experiments
were performed.
STRONG CATION EXCHANGE FRACTIONATION
The combined iTRAQ labeled samples were reconstituted with buffer
A (10mM KH2PO4, pH 3.0, 25%, v/v, acetonitrile), and loaded into a
PolySULFOETHYL A column (200mm length� 4.6mm ID, 200-A
pore size, 5mm particle size) (PolyLC, MD) on a prominence HPLC
system (Shimadzu, Kyoto, Japan). The sample was fractionated
using a gradient of 100% buffer A for 5min, 5–30% buffer B
(10mM KH2PO4, pH 3.0, 500mM KCl, and 25%, v/v, acetonitrile) for
40min, 30–100% buffer B for 5min, and finally 100% buffer B for
5min, at a constant flow rate of 1ml/min for a total of 1 h. The eluted
fractions were monitored through a UV detector at 214 nm
wavelength. Fractions were collected at 1-min intervals and
consecutive fractions with low peak intensity were combined.
Finally a total of 20 fractions were obtained and dried in a Speedvac
(Thermo Electron). Each fraction was reconstituted in 0.1%
trifluoroacetic acid and desalted using a Sep-Pak C-18 SPE cartridge
(Waters, Milford, MA). Desalted samples were dried in a Speedvac
(Thermo Electron) and stored at �208C prior to mass spectrometric
analysis.
MASS SPECTROMETRIC ANALYSIS USING Q-STAR
Each dried fraction was reconstituted in 100ml of 0.1% formic acid
and 2% acetonitrile and then analyzed times using a Q-Star Elite
mass spectrometer (Applied Biosystems Company; MDS-Sciex),
coupled to a prominence HPLC system (Shimadzu). For each
analysis, 100ml of peptide mixture was injected in a Zorbax peptide
trap (Agilent, CA) and separated on a nanobored C18 column with a
picofrit nanospray tip (75mm ID� 15 cm, 5mm particles) (New
Objectives, Wubrun, MA). The separation was performed at a
constant flow rate of 0.3ml/min with a 2 h gradient. The mass
spectrometer was set to perform data acquisition in the positive ion
mode, with a selected mass range of 300–2,000m/z. Peptides with
þ2 to þ4 charge states were selected for MS/MS and the time
of summation of MS/MS events was set to 2 s. The three most
abundantly charged peptides above a 5-count threshold were
selected for MS/MS and dynamically excluded for 30 s with
�30mmu mass tolerance.
DATA ANALYSIS AND INTERPRETATION
Peptide and protein identification were performed using ProteinPi-
lotTM Software v2.0.1 (Applied Biosystems Company) by searching
data against the International Protein Index (IPI) mouse database.
The Paragon algorithm in ProteinPilot software was used whereby
trypsin was selected as the digestion agent and cysteine modifica-
tion of methylethanethiosulfonate. The search also allows for the
possibilities of more than 80 biological modifications using the
BLOSUM 62 matrix. All proteins reported had at least two unique
peptide matches with iTRAQ ratios, and at least one of them must
have an expectation value <0.05. Finally, a concatenated target-
decoy database search strategy was also performed to estimate the
rate of false positives and was determined to be<1% for the current
analysis. To account for small differences in protein loading, all
protein ratios have been normalized using the overall ratios for all
proteins in the sample, as recommended by Applied Biosystems
Company.
WESTERN BLOT ANALYSIS
Total protein lysates extracted from the experiments as described
above for the LC/MS /MS analysis were used for the Western blot
analysis. Specifically, total proteins from each of the two types of
cells were separated on the SDS–polyacrylamide gels using a Mini-
Protean Tetra cell, and then transblotted onto the nitrocellulose
membrane using a Mini-Transblot apparatus at 48C (Bio-Rad Lab).
The protein signals were amplified using Pierce Qentix Western blot
signal enhancer kit (Thermo Scientific), followed by blocking for 2 h
at 48C with 5% non-fat dry milk in TBST buffer (10mmol/L Tris,
150mmol/L NaCl, and 0.05% Tween-20, pH 7.5), followed by 4–6 h
of incubation with specific primary antibodies (see below; 1:100–
800; Santa Cruz Biotechnology) in TBST buffer containing 5% non-
fat dry milk at RT. After washing three times with TBST buffer, the
membranes were incubated with a secondary antibody-conjugated
horseradish peroxidase (1:3,000–6,000; Thermo Scientific) for 4–5 h
at RT. After the membranes were washed three times in TBST
buffer, the reactions were visualized with Pierce chemiluminescent
substrate kit (Thermo Scientific). The results were then scanned
using Bio-Rad’s Densitometer and analyzed using Bio-Rad’s Quality
One software. The antibodies used in this study were as follows:
(1) Destrin; (2) Nucleolin; (3) Zyx protein; (4) Transgelin 2; (5) b-
actin; (6) Voltage-dependent anion-selective channel protein 2
(VDAC2); (7) Voltage-dependent anion-selective channel protein 3
(VDAC3); (8) Cytochrome b5; and (9) PCX. All samples were
normalized by protein content that was measured using the
protein assay kit (Bio-Rad Lab) based on Bradford method.
3004 iTRAQ ANALYSIS OF 3T3-L1 ADIPOCYTE DIFFERENTIATION JOURNAL OF CELLULAR BIOCHEMISTRY
Intracellular b-actin served as a loading control. Independent
triplicate experiments were performed.
REAL-TIME PCR
Cells were cultured for RNA isolation using RNeasy mini kit
(Qiagen). The iSCRIPT One-step RT-PCR kit (Bio-Rad) was used for
the real-time quantification of RNA targets. SYBR Green was used as
a dye to emit the fluorescence signal. The following primer
sequences were specific to cDNAs which displayed changes in the
respective protein level. The specific primers for Annexin A1
were 50-AAGTAGGAAAGTTGCTTTGG-30 (sense) and 50-AAGT-GACTTGCTTATGGGGC-30 (antisense), for Cytochrome b5 were 50-GTTTCTCGAAGAGCATCCTG-30 (sense) and 50-GAAGGCTTGGC-TATCTTTGA-30 (antisense), for EEF1A1 were 50-TAATCAGTGGTG-GAAGAACGG-30 (sense) and 50-AATGGTCCACAACATTCTTTCC-30
(antisense), for VDAC2 were 50-GGCTCACGTATGTGCAGTTAC-30
(sense) and 50-TATTGTAATCTCAAAGACCTCG-30 (antisense), for
Ribosomal protein SA were 50-CATCCAGCAGTTCCCCAC-30 (sense)and 50-CAGCAGATCAGGACCACTCA-30 (antisense), for Nucleolin
were 50-ACTTAAAGGGATCCCTTTAA-30 (sense) and 50-AGG-CATGGCATTCTCCTGGCA-30 (antisense), for Transgelin 2 were 50-GCAGCAGAAGATTGAGAAGC-30 (sense) and 50-ATCTTCTT-TACTGGGGCCTG-30 (antisense), and for b-actin were 50-CCCCATT-GAACATGGCATTG-30 (sense) and 50-ACGACCAGAGGCATACAGG-30 (antisense), respectively. These primers were designed to amplify
these products around 150–300 bp in size to reduce non-specific-
binding of SYBR Green. Quantification was performed by
calculating the fluorescence density during the amplification cycle.
The disassociation analysis was routinely carried out by acquiring
fluorescent reading for one degree increase from 55 to 958C. Thedata including amplification analysis, melting curve analysis, and
threshold cycle number were provided automatically by optical
system software (Bio-Rad). Real-time PCR analysis was repeated at
least three times.
ADMINISTRATION OF PCX OR VDAC2 siRNA TO CELLS
The cells were transfected with PCX siRNA (sc-45532), or VDAC2
siRNA (sc-42358) (Santa Cruz Biotechnology) using Lipofectamine
2000 reagent according to the manufacturer’s instructions. Control
siRNA (sc-37007, Santa Cruz Biotechnology) served as a negative
control according to the manufacturer’s protocol. Briefly, cells were
plated into six-well plates. After 3T3-L1 fibroblasts reached
confluence for 2 days, they were transfected with specific siRNA,
and control siRNA after a pre-incubation for 15min with siRNA
transfection reagent in siRNA transfection medium. After 6 h of
transfection, the medium was replaced with growth medium
containing 10% fetal calf serum. After 3 days, repeated above
procedures until day 10 of differentiation. Adipocyte conversion
was evaluated by the visual appearance of fat droplets in the cells,
Oil Red staining and triglyceride analysis. PCX or VDAC2 expression
level was determined by Western blot analysis described above.
STATISTICAL ANALYSIS
In this study, results are expressed as means� SEM. All values were
evaluated by the unpaired Student’s t-test. P< 0.05 was considered
to be statistically significant.
RESULTS
ADIPOCYTE DIFFERENTIATION
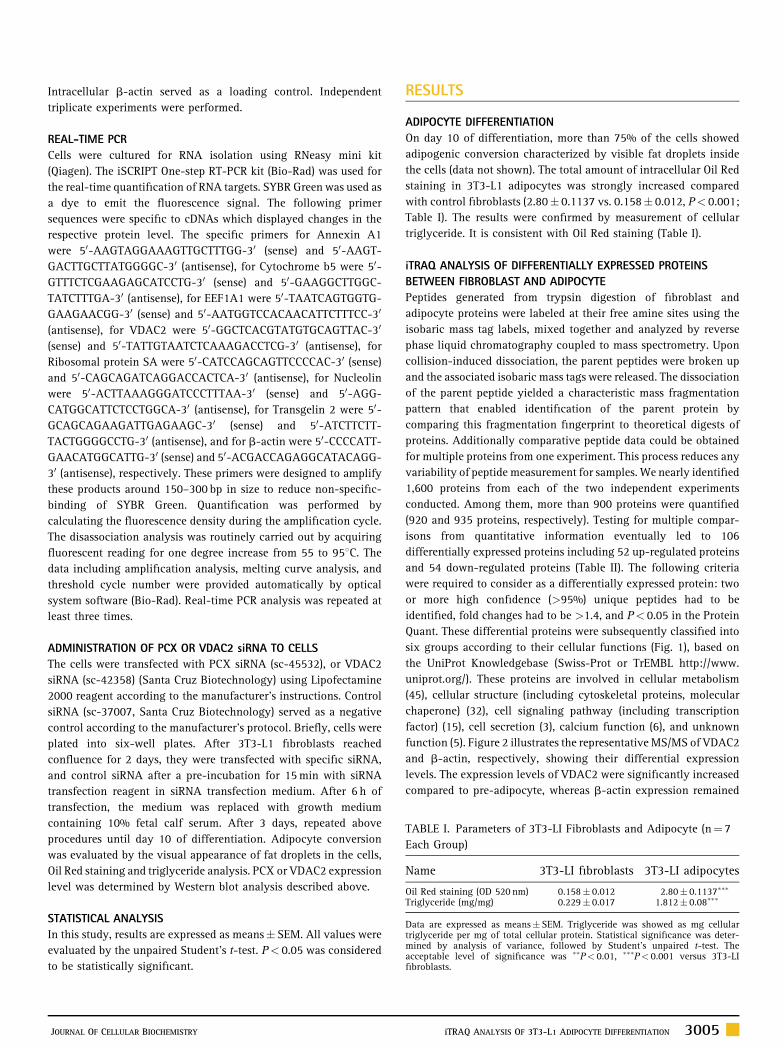
On day 10 of differentiation, more than 75% of the cells showed
adipogenic conversion characterized by visible fat droplets inside
the cells (data not shown). The total amount of intracellular Oil Red
staining in 3T3-L1 adipocytes was strongly increased compared
with control fibroblasts (2.80� 0.1137 vs. 0.158� 0.012, P< 0.001;
Table I). The results were confirmed by measurement of cellular
triglyceride. It is consistent with Oil Red staining (Table I).
iTRAQ ANALYSIS OF DIFFERENTIALLY EXPRESSED PROTEINS
BETWEEN FIBROBLAST AND ADIPOCYTE
Peptides generated from trypsin digestion of fibroblast and
adipocyte proteins were labeled at their free amine sites using the
isobaric mass tag labels, mixed together and analyzed by reverse
phase liquid chromatography coupled to mass spectrometry. Upon
collision-induced dissociation, the parent peptides were broken up
and the associated isobaric mass tags were released. The dissociation
of the parent peptide yielded a characteristic mass fragmentation
pattern that enabled identification of the parent protein by
comparing this fragmentation fingerprint to theoretical digests of
proteins. Additionally comparative peptide data could be obtained
for multiple proteins from one experiment. This process reduces any
variability of peptide measurement for samples. We nearly identified
1,600 proteins from each of the two independent experiments
conducted. Among them, more than 900 proteins were quantified
(920 and 935 proteins, respectively). Testing for multiple compar-
isons from quantitative information eventually led to 106
differentially expressed proteins including 52 up-regulated proteins
and 54 down-regulated proteins (Table II). The following criteria
were required to consider as a differentially expressed protein: two
or more high confidence (>95%) unique peptides had to be
identified, fold changes had to be >1.4, and P< 0.05 in the Protein
Quant. These differential proteins were subsequently classified into
six groups according to their cellular functions (Fig. 1), based on
the UniProt Knowledgebase (Swiss-Prot or TrEMBL http://www.
uniprot.org/). These proteins are involved in cellular metabolism
(45), cellular structure (including cytoskeletal proteins, molecular
chaperone) (32), cell signaling pathway (including transcription
factor) (15), cell secretion (3), calcium function (6), and unknown
function (5). Figure 2 illustrates the representative MS/MS of VDAC2
and b-actin, respectively, showing their differential expression
levels. The expression levels of VDAC2 were significantly increased
compared to pre-adipocyte, whereas b-actin expression remained
TABLE I. Parameters of 3T3-LI Fibroblasts and Adipocyte (n¼ 7
Each Group)
Name 3T3-LI fibroblasts 3T3-LI adipocytes
Oil Red staining (OD 520 nm) 0.158� 0.012 2.80� 0.1137���
Triglyceride (mg/mg) 0.229� 0.017 1.812� 0.08���
Data are expressed as means� SEM. Triglyceride was showed as mg cellulartriglyceride per mg of total cellular protein. Statistical significance was deter-mined by analysis of variance, followed by Student’s unpaired t-test. Theacceptable level of significance was ��P< 0.01, ���P< 0.001 versus 3T3-LIfibroblasts.
JOURNAL OF CELLULAR BIOCHEMISTRY iTRAQ ANALYSIS OF 3T3-L1 ADIPOCYTE DIFFERENTIATION 3005

TABLE II. iTRAQ Analysis of Differentially Expressed Proteins in the Adipocytes Compared to Fibroblasts
Number Accession Gene Protein 115:114P-value,115:114 Function
1 IPI00115530.1 HEXB Beta-hexosaminidase beta chainprecursor
7.30� 3.09E�06 Carbohydrate metabolic process, cellular calciumion homeostasis, beta-N-acetylglucosaminidaseactivity, beta-N-acetylhexosaminidase activity
2 IPI00377642.2 PTTG1IP Pituitary tumor-transforminggene 1 protein-interactingprotein precursor
6.18� 0.0003 Protein import into nucleus, molecular functionunknown
3 IPI00387497.1 DPP7 Dipeptidylpeptidase 7 5.30� 1.2E�03 Metabolic enzymes4 IPI00116705.5 FABP4 Fatty acid-binding protein,
adipocyte4.16 0.0015 Binding, lipid binding, brown fat cell
differentiation, cellular response to lithium ion5 IPI00165730.4 1300012G16Rik Isoform 1 of putative phospholipase
B-like 2 precursor3.54� 1.9E�03 Metabolic enzymes
6 IPI00221426.3 GNS N-acetylglucosamine-6-sulfataseprecursor
3.20 1.6E�03 Metabolic enzymes
7 IPI00316989.7 EPDR1 Isoform 1 of mammalianependymin-related protein 1precursor
3.08� 1.8E�04 Secreted protein
8 IPI00130661.1 TPP1 Tripeptidyl-peptidase 1 precursor 3.00� 2.7E�02 Metabolic enzymes, lysosomal serine proteasewith tripeptidyl-peptidase I activity
9 IPI00381303.5 MAN2B1 Lysosomal alpha-mannosidaseprecursor
2.78 1.0E�03 Metabolic enzymes, necessary for the catabolism ofN-linked carbohydrates released duringglycoprotein turnover
10 IPI00306723.3 CEBPZ CCAAT/enhancer-binding proteinzeta
2.67 0.005 Regulation of transcription
11 IPI00226563.4 TTYH3 Isoform 1 of protein tweetyhomolog 3
2.65 1.3E�02 Ca(2þ) signal transduction
12 IPI00117842.2 MAN2B2 Epididymis-specificalpha-mannosidase precursor
2.64 2.3E�03 Plays an important role in the early step ofspermatogenesis
13 IPI00755338.2 LPL Lipoprotein lipase 2.53 0.031961 Fatty acid biosynthetic process, lipid catabolicprocess, catalytic activity, heparin binding
14 IPI00134961.1 ACADM Medium-chain specific acyl-CoAdehydrogenase, mitochondrialprecursor
2.48� 0.0004 Cardiac muscle cell differentiation, carnitinebiosynthetic process, acyl-CoA dehydrogenaseactivity
15 IPI00230113.5 CYB5 Cytochrome b5 2.43 5.1E�03 Cellular structure, It is also involved in several stepsof the sterol biosynthesis pathway,particularly in the C-5 double bond introductionduring the C-5 desaturation
16 IPI00653231.1 SFXN3 Sideroflexin 3, full insert sequence 2.41 8.7E�03 Cation transmembrane transporter activity17 IPI00111960.2 GAA Lysosomal alpha-glucosidase
precursor2.40 4.1E�03 Essential for the degradation of glycogen to
glucose in lysosomes18 IPI00223713.5 HIST1H1C Histone H1.2 2.37 1.5E�06 The condensation of nucleosome chains into higher
order structures19 IPI00113389.5 NIBAN Niban protein 2.36� 1.6E�03 Molecular function unknown, positive regulation
of protein phosphorylation20 IPI00132314.1 NUCB1 Nucleobindin-1 precursor 2.35� 1.0E�03 Calcium-binding protein, calcium homeostasis21 IPI00113517.1 CTSB Cathepsin B precursor 2.30 5.1E�03 Metabolic enzymes, tumor invasion and metastasis22 IPI00114710.2 PCX Pyruvate carboxylase 2.26 4.2E�05 Metabolic enzymes23 IPI00122547.1 VDAC2 Voltage-dependent anion-selective
channel protein 22.22 2.6E�04 Cellular structure
24 IPI00116896.1 MT-ATP8 ATP synthase protein 8 2.19 5.3E�03 Metabolic enzymes, ATP synthase25 IPI00223092.5 HADHA Trifunctional enzyme subunit al-
pha, mitochondrial precursor2.14 6.0E�05 Metabolic enzymes, bifunctional subunit
26 IPI00318614.9 IDH2 Isocitrate dehydrogenase [NADP],mitochondrial precursor
2.07 0.0056 Glyoxylate cycle, isocitrate metabolic process
27 IPI00380136.3 LOXL1 Lysyl oxidase homolog 1 precursor 2.07 1.1E�02 Metabolic enzymes, active on elastin and collagensubstrates
28 IPI00115626.1 PPAP2B Lipid phosphatephosphohydrolase 3
2.066 0.0075 Catalytic activity, hydrolase activity, blood vesseldevelopment, canonical Wnt receptor signalingpathway
29 IPI00877201.1 CREB1 cAMP responsive element bindingprotein 1 isoform C
2.06 0.002 DNA binding, double-stranded DNA binding
30 IPI00314726.3 NAGLU Alpha-N-acetylglucosaminidase 2.04 4.4E�02 Metabolic enzymes31 IPI00128450.1 MBC2 Isoform 1 of extended-
synaptotagmin-12.03� 9.4E�03 Calcium-regulated intrinsic membrane protein
32 IPI00620256.3 LMNA Isoform A of lamin-A/C 1.99 3.6E�17 Cellular structure33 IPI00230540.1 VDAC1 Isoform Mt-VDAC1 of voltage-
dependent anion-selectivechannel protein 1
1.96� 8.7E�06 Cellular structure, signal transduction
34 IPI00330497.4 KANK2 Isoform 1 of KN motif and ankyrinrepeat domain-containingprotein 2
1.96� 2.2E�03 Molecular function unknown, negative regulationof stress fiber assembly
35 IPI00828222.1 FBN1 Mutant fibrillin-1 1.92� 3.9E�02 Calcium ion binding, chitin binding36 IPI00620222.2 MYO1C Isoform A of myosin-Ic 1.85 7.1E�03 Intracellular movements37 IPI00319830.7 SPNB2 Isoform 1 of spectrin beta chain,
brain 11.76� 7.3E�09 Secretion, interacts with calmodulin in a calcium-
dependent manner and is thus candidate for thecalcium-dependent movement of thecytoskeleton at the membrane
(Continued )
3006 iTRAQ ANALYSIS OF 3T3-L1 ADIPOCYTE DIFFERENTIATION JOURNAL OF CELLULAR BIOCHEMISTRY

TABLE II. (Continued )
Number Accession Gene Protein 115:114P-value,115:114 Function
38 IPI00116074.1 ACO2 Aconitate hydratase, mitochondrialprecursor
1.76 2.0E�04 Catalytic activity
39 IPI00606510.1 PCCB Propionyl-CoA carboxylase betachain, mitochondrial precursor
1.76 3.1E�02 Catalytic activity
40 IPI00330941.3 STEAP3 Isoform 2 of metalloreductaseSTEAP3
1.75� 2.4E�02 Signal transduction, may play a role downstream ofp53/TP53 to interface apoptosis and cell cycleprogression. indirectly involved in exosomesecretion by facilitating the secretion of proteinssuch as TCTP
41 IPI00319973.3 PGRMC1 Membrane-associated progesteronereceptor component 1
1.74 6.4E�03 Cellular structure, receptor for progesterone
42 IPI00129571.3 COl3A1 Collagen alpha-1(III) chainprecursor
1.73 1.1E�06 Cellular structure, collagen type III occurs in mostsoft connective tissues
43 IPI00848492.1 LOC10045699 Similar to electron transferringflavoprotein, beta polypeptideisoform 2
1.73� 2.4E�04 Molecular function unknown
44 IPI00555055.3 H2AFV Histone H2AV 1.71 1.4E�02 Cellular structure, cell division45 IPI00876341.1 VDAC3 Voltage-dependent anion-selective
channel protein 31.71� 5.9E�04 Cellular structure, forms a channel
46 IPI00468203.3 ANXA2 Annexin A2 1.67 5.0E�09 Cellular structure47 IPI00130589.8 SOD1 Superoxide dismutase 1.65 1.0E�02 Destroys radicals which are normally produced
within the cells and which are toxic to biologicalsystems
48 IPI00886077.1 PRDX5 Prdx5 protein 1.65� 3.8E�03 Oxidoreductase activity49 IPI00658539.1 CTSA Cathepsin A isoform a 1.62 4.2E�02 The activity of beta-galactosidase and
neuraminidase, carboxypeptidase and candeamidate tachykinins. Catalytic activity
50 IPI00653158.1 ACAA2 14 days embryo liver cDNA, RIKENfull length enriched library,clone: I530029G20 product:acetyl
1.61 9.7E�03 Metabolic enzymes
51 IPI00399958.3 CALU Calumenin isoform 2 1.59� 1.4E�03 Calcium ion binding52 IPI00223987.1 LNPEP Leucyl-cystinyl aminopeptidase 1.59 4.3E�02 Metabolic enzymes, aminopeptidase activity,
angiotensin receptor activity, degrades peptidehormones maintaining homeostasis duringpregnancy
53 IPI00830884.1 TPM1 33 kDa protein 0.70 2.3E�02 Cellular structure, muscle contraction stabilizingcytoskeleton actin filaments
54 IPI00224740.6 PFN1 Profilin-1 0.69 3.3E�03 Binds to actin and affects the structure of thecytoskeleton, signal transduction it inhibits theformation of IP3 and DG
55 IPI00457852.3 EG432502 Similar to ribosomal protein L6 0.67� 1.9E�04 Molecular function unknown56 IPI00230395.5 ANXAL Annexin A1 0.66 3.5E�05 Membrane fusion and exocytosis, this protein reg-
ulates phospholipase A2 activity57 IPI00317794.5 NCL Nucleolin 0.65 4.4E�04 Cellular structure, transcription factor58 IPI00474446.4 EIF2S1 Eukaryotic translation initiation
factor 2 subunit 10.64 2.9E�02 Cellular structure, protein synthesis
59 IPI00856927.1 RPS19 23 kDa protein 0.64� 1.2E�02 Protein binding erythrocyte differentiation gastransport
60 IPI00626106.3 TAGLN2 Transgelin 2 0.64 6.2E�03 Calponin family61 IPI00130883.1 RBM3 Putative RNA-binding protein 3 0.63 2.7E�02 Cellular structure62 IPI00874931.1 FUBP1 Isoform 1 of Far upstream
element-binding protein 10.63 2.8E�02 Transcription factor
63 IPI00331552.4 PABPC1 Poly A binding protein, cytoplasmic1, full insert sequence
0.62 9.9E�04 Cellular structure, transcription factor
64 IPI00454016.5 MAT2A S-adenosylmethionine synthetaseisoform type-2
0.62 5.1E�03 Catalyzes the formation of S-adenosylmethionine
65 IPI00849793.1 RP112 60S ribosomal protein L12 0.61 1.3E�02 Binds directly to 26S ribosomal RNA66 IPI00626628.1 RP127A EG665189 ribosomal protein L27a 0.61 2.3E�02 Cellular structure67 IPI00462445.2 NEDD4 E3 ubiquitin-protein ligase NEDD4 0.61� 3.7E�03 E3 ubiquitin-protein ligase which accepts
ubiquitin from an E2 ubiquitin-conjugatingenzyme in the form of a thioester and thendirectly transfers the ubiquitin to targetedsubstrates Involved in the embryonicdevelopment and differentiation of the centralnervous system
68 IPI00263863.8 HSPE1 10 kDa heat shock protein,mitochondrial
0.61� 1.1E�03 Molecular chaperone, mitochondrial proteinbiogenesis
69 IPI00473728.1 RP114 Ribosomal protein L14, cytosolichomolog
0.60 5.9E�03 Cellular structure
70 IPI00136912.1 SRM Spermidine synthase 0.59 3.2E�04 Metabolic enzymes, catalytic activity, spermidinesynthase activity, S-adenosylmethioninamineþputrescine¼ 50-S-methyl-50-thioadenosineþspermidine
71 IPI00314748.7 WDR1 WD repeat-containing protein 1 0.58 5.2E�04 Induces disassembly of actin filaments
(Continued )
JOURNAL OF CELLULAR BIOCHEMISTRY iTRAQ ANALYSIS OF 3T3-L1 ADIPOCYTE DIFFERENTIATION 3007

TABLE II. (Continued )
Number Accession Gene Protein 115:114P-value,115:114 Function
72 IPI00315488.1 RARS Arginyl-tRNA synthetase,cytoplasmic
0.57 4.0E�04 Aminoacyl-tRNA ligase activity, arginine binding.ATPþ L-arginineþ tRNA(Arg)¼AMPþdiphosphateþ L-arginyl-tRNA(Arg)
73 IPI00752985.1 EG666501 EG666738 similar to ribosomal pro-tein L23a
0.57 1.4E�02 Cellular structure
74 IPI00467296.2 PFDN1 Prefoldin 1 0.57 3.3E�02 Binds specifically to cytosolic chaperonin (c-CPN)and transfers target proteins to it, binds tonascent polypeptide chain and promotes foldingin an environment in which there are manycompeting pathways for non-native proteins
75 IPI00116277.3 CCT4 T-complex protein 1 subunit delta 0.56 1.1E�03 Molecular chaperone76 IPI00321308.4 AARS Alanyl-tRNA synthetase,
cytoplasmic0.56 8.0E�03 ATPþ L-alanineþ tRNA(Ala)¼AMPþ
diphosphateþ L-alanyl-tRNA(Ala)77 IPI00122928.1 TUBB6 Tubulin beta-6 chain 0.56 2.7E�02 Cellular structure78 IPI00458337.4 29 kDa protein 29 kDa protein 0.55 5.9E�05 Molecular function unknown79 IPI00112555.3 GARS Glycyl-tRNA synthetase 0.55 1.8E�02 ATPþ glycineþ tRNA(Gly)¼AMPþ
diphosphateþ glycyl-tRNA(Gly).80 IPI00223757.4 AKR1B3 Aldose reductase 0.55 1.9E�02 Catalytic activity81 IPI00277930.6 CAPG Capping protein (actin filament),
gelsolin0.54� 3.3E�04 Calcium-sensitive protein, macrophage function
regulating cytoplasmic and/or nuclear structuresbind DNA
82 IPI00845840.1 PKM2 Isoform M1 of pyruvate kinase iso-zymes M1/M2
0.54 4.5E�03 Catalytic activity
83 IPI00850840.1 RPSA Ribosomal protein SA 0.53 5.2E�04 Enables malignant tumor cells to penetrate laminintissue and vessel barriers, activates precursorthymic anti-OFA/iLRP specific cytotoxic T cell.May induce CD8 T-suppressor cells secretingIL-10
84 IPI00408218.1 ZYX Zyx protein 0.52 1.2E�02 Adhesion plaque protein, transcription factor85 IPI00127942.4 DSTN Destrin 0.51 3.4E�04 Actin-depolymerizing protein86 IPI00469268.5 CCT8 T-complex protein 1 subunit theta 0.51 4.2E�06 Molecular chaperone87 IPI00409918.1 EIF4A2 Isoform 2 of eukaryotic initiation
factor 4A-II0.51 9.3E�05 Transcription factor, cellular structure
88 IPI00134621.3 RAN LOC100045999 GTP-binding nu-clear protein Ran
0.50 2.0E�03 GTP-binding protein, transcription factor, involvedin chromatin condensation and control of cellcycle
89 IPI00223415.3 NARS Activated spleen cDNA, RIKEN fulllength enriched library, clone:F830225J05 product: asparagi-nyl-tRNA synthetase, full insertsequence
0.49 8.1E�03 Catalytic activity
90 IPI00307837.6 EEF1A1 Elongation factor 1-alpha 1 0.49 2.0E�04 Protein biosynthesis91 IPI00462072.3 LOC100044223; EG433182; eno1 alpha-enolase 0.48 3.1E�04 Metabolic enzymes, multifunctional enzyme
(glycolysis, growth control, hypoxia toleranceand allergic responses), a receptor and activatorof plasminogen
92 IPI00555069.3 PGK1 Phosphoglycerate kinase 1 0.48 9.2E�05 ATPþ 3-phospho-D-glycerate¼ADPþ 3-phospho-D-glyceroyl phosphate
93 IPI00229080.7 HSP90AB1 Heat shock protein 84b 0.47 9.0E�04 Molecular chaperone94 IPI00230139.5 FKBP4 FK506-binding protein 4 0.46 2.9E�02 Signal transduction, androgen receptor signaling
pathway, copper ion transport, ATP binding,component of unactivated mammalian steroidreceptor complexes, rotamase activity, the intra-cellular trafficking of heterooligomeric forms ofsteroid hormone receptors
95 IPI00225961.5 PHGDH D-3-phosphoglyceratedehydrogenase
0.46 3.9E�06 3-phospho-D-glycerateþNADþ¼ 3-phosphonoox-ypyruvateþNADH
2-hydroxyglutarateþNADþ¼ 2-oxoglutarateþNADH
96 IPI00318841.4 EEF1G Elongation factor 1-gamma 0.45 2.2E�03 Translation elongation factor activity97 IPI00225201.5 IARS Isoleucyl-tRNA synthetase,
cytoplasmic0.44 3.1E�04 ATPþ L-isoleucineþ tRNA(Ile)¼AMPþ
diphosphateþ L-isoleucyl-tRNA(Ile).98 IPI00624863.1 PAICS Phosphoribosylaminoimidazole
carboxylase, phosphoribosyl-aminoribosylaminoimidazole,succinocarboxamide synthetase,full insert sequence
0.44 2.1E�02 Catalytic activity
99 IPI00407130.4 PKM2 Isoform M2 of pyruvate kinase iso-zymes M1/M2
0.43 0.0003 ATP biosynthetic process, glucose metabolicprocess
100 IPI00854035.1 LOC100047753 Similar to Nucleoside diphosphatekinase A
0.42 1.5E�03 The synthesis of nucleoside triphosphates, catalyticactivity
101 IPI00469103.1 KARS Lysyl-tRNA synthetase 0.40 2.4E�03 Catalytic activity102 IPI00555113.2 RPl18 60S ribosomal protein L18 0.39 7.3E�03 Cellular structure103 IPI00113223.2 FAS Fatty acid synthase 0.363 3.69E�05 Fatty acid biosynthetic process [acyl-carrier-
protein], S-acetyltransferase activity
(Continued )
3008 iTRAQ ANALYSIS OF 3T3-L1 ADIPOCYTE DIFFERENTIATION JOURNAL OF CELLULAR BIOCHEMISTRY

unchanged. In Table II, 11 proteins were altered threefold or more
between pre-adipocyte and adipocyte, many changes agree with
previous observations [Renes et al., 2005; Atiar Rahman et al., 2008;
Kim et al., 2009; Molina et al., 2009; Choi et al., 2011]. We
exemplified by LPL. LPL is an enzyme that hydrolyzes lipids in
lipoproteins. It is activated by insulin in adipocytes, but both LPL
and leptin has different secretory pathways. LPL is well-known
as an adipocyte specific gene and significantly induced in fully
differentiated adipocytes [Roh et al., 2001; Molina et al., 2009].
PPAR-gamma, a key component in the adipocyte differentiation,
directly stimulates LPL expressions [Kawachi et al., 2007]. Our study
demonstrated that LPL significantly increases, which is in agreement
with previous studies [Roh et al., 2001; Molina et al., 2009].
However, some contradictory protein expression effects are found.
FAS is a multi-enzyme that plays a key role in fatty acid synthesis.
Interestingly, expression levels of FAS and PGK1 were significantly
decrease, whereas PPAR-gamma expression was not significantly
changes on day 10 of adipocyte differentiation, which are not
consistent with previous studies [Hackl et al., 2005; Renes et al.,
2005; Jitrapakdee et al., 2008]. We propose that different
adipogenesis phases could be an important contributor to
expression of the above proteins.
VERIFY DIFFERENTIALLY EXPRESSED PROTEINS BY WESTERN BLOT
AND REAL-TIME PCR ANALYSIS
To assess if the protein changes as quantitated by iTRAQ coupled 2D
LC/MS/MS were significant, Western blot analysis was carried out
on nine proteins (Destrin; Nucleolin; Zyx protein; Transgelin 2;
VDAC2; VDAC3; Cytochrome b5; PCX; and b-actin). All showed
consistent results compared with their respective LC/MS-MS
analysis. Similarly to the iTRAQ analysis, results shown in
Figure 3 indicated that the level of proteins (Nucleolin; Transgelin
2; Destrin; and Zyx protein) were lower in adipocytes compared with
the level in the control pre-adipocytes. Quantification of the proteins
(Cytochrome b5; VDAC2; PCX; and VDAC3) showed significantly
increased compared with the level in the control pre-adipocytes.
Real-time PCR analysis of genes listed in Figure 4 was carried out to
assess differentially expressed proteins. Significant changes were
analyzed based on three independent experiments. These results are
consistent with their respective LC/MS-MS analysis. The mRNA of
genes (Cytochrome b5 and VDAC2) showed similar up-regulation
in adipocytes. Results shown in Figure 4 indicated that down-
regulated mRNA in adipocytes included Nucleolin, Transgelin 2,
Annexin A1, Ribosomal protein SA and Eukaryotic translation
elongation factor 1 alpha 1. Four proteins (Cytochrome b5, VDAC2,
Nucleolin and Transgelin 2) were validated by both real-time PCR
andWestern blot. Our real-time PCR results were consistent with the
Western blot analysis. These results confirm iTRAQ analysis at both
gene and protein levels.
THE ASSOCIATION OF PCX AND VDAC2 WITH ADIPOCYTE
DIFFERENTIATION
To study the functional roles of PCX and VDAC2 up-regulation in
3T3-LI adipocytes, cells were transfected with PCX or VDAC2
TABLE II. (Continued )
Number Accession Gene Protein 115:114P-value,115:114 Function
104 IPI00466069.3 EEF2 Elongation factor 2 0.33 7.0E�06 GTPase activity, GTP binding, this protein promotesthe GTP-dependent translocation of the nascentprotein chain from the A-site to the P-site of theribosome
105 IPI00877279.1 ANXA3 Annexin A3 0.31 4.4E�03 Inhibitor of phospholipase A2, anti-coagulantproperties
106 IPI00135189.3 AACS Acetoacetyl-CoA synthetase 0.30 8.5E�05 Activates acetoacetate to acetoacetyl-CoA involvedin utilizing ketone body for the fatty acid-synthesis during adipose tissue development
List of differential expressed proteins in adipocyte differentiation. A 115:114 is the ratio of different protein expression level in 3T3-LI adipocytes relative to 3T3-LIfibroblasts. The P-values indicated statistical significance of the observed differences, with P< 0.05 considered as statistically significant. In 115:114 column, an extraasterisk denotes a protein previously unknown to be involved with adipogenic process.
Fig. 1. Distribution of all altered proteins into different functional categories.
JOURNAL OF CELLULAR BIOCHEMISTRY iTRAQ ANALYSIS OF 3T3-L1 ADIPOCYTE DIFFERENTIATION 3009

siRNA. Firstly, siRNA-induced inhibitions of PCX or VDAC2
expression were determined by Western blot analysis. As shown
in Figure 5A, PCX or VDAC2 siRNA significantly decreased PCX or
VDAC2 protein levels, whereas PCX or VDAC2 protein expressions
were not significantly suppressed by control siRNA. From our
Western blot experiments, we observed that PCX and VDAC2
siRNAs silenced their targets by 33–45% and 40–50%, respectively
(data not shown). We next evaluated the effect of PCX or VDAC2
siRNA transfection on adipogenic conversion. Differentiation of
3T3-L1 cells for 10 days resulted in an accumulation of triglyceride
as shown by the red-colored cells, and Oil Red staining of
triglyceride was almost not observed in control 3T3-L1 fibroblasts
(Fig. 5B). These results were confirmed by measurement of the total
amount of triglyceride and intracellular Oil Red staining (Fig. 5C,D).
The content of triglyceride and intracellular Oil Red staining in
differentiated 3T3-L1 adipocytes was strongly increased compared
to pre-adipocytes. PCX or VDAC2 siRNA significantly reduced the
content of triglyceride (by 73.7% and 76.1%) and intracellular Oil
Red staining (by 66.7% and 69.8%).
DISCUSSION
The main findings of this study are; (1) a total number of 106
proteins differentially expressed were identified using iTRAQ-based
proteomic approach, of them, 24 proteins have not been reported
Fig. 2. A representative MS/MS spectrum showing the peptides from (A) VDAC2, (B) b-actin. The ion assignments are as follows: control 3T3-LI fibroblasts¼ iTRAQ 114;
3T3-LI adipocytes¼ iTRAQ 115. Compared with 3T3-LI fibroblasts, expression level of VDAC2 was significantly increased (A), whereas b-actin expressions was not significant
changes (B) in 3T3-LI adipocytes.
3010 iTRAQ ANALYSIS OF 3T3-L1 ADIPOCYTE DIFFERENTIATION JOURNAL OF CELLULAR BIOCHEMISTRY

before in 3T3-L1 adipocyte differentiation including HEXB, DPP7,
PTTG1IP, PRDX5, EPDR1, SPNB2, STEAP3, NIBAN, ACADM,
RPS19, NEDD4, KANK2, LOC10045699, EG432502, NUCB1,
MBC2, FBN1, CALU, CAPG, VDAC1, VDAC3, 1300012G16Rik,
HSPE1, and TPP1. (2) The association of PCX and VDAC2
with adipogenesis was verified, showing PCX siRNA and VDAC2
siRNA transfection could significantly inhibit 3T3-L1 adipocyte
differentiation.
Compared with 2-DE technique, iTRAQ has several advantages
such as high sensitivity in the detection of proteins in low
concentrations and hydrophobic membrane proteins, good sample
capacity, high reproducibility, and accurate quantitation [Hu et al.,
2010; Zhang et al., 2011]. Using this method, we screened 106
differentially expressed proteins. The majority of differential
proteins were related to metabolic enzymes and structural proteins.
Among those differential metabolic enzymes, many were consistent
with previous results [Zhang et al., 1995; Roh et al., 2001; Wilson-
Fritch et al., 2003; Renes et al., 2005; Atiar Rahman et al., 2008;
Molina et al., 2009], but seven were first discovered in 3T3-L1
differentiation. PCX is a regulatory metabolic enzyme that provides
acetyl-CoA and NADPH for the de novo biosynthesis of fatty acids.
Cellular expression of PCX was regulated by glucagon, glucocorti-
coids, insulin, and PPAR-gamma. PCX plays a role in lipogenesis
and gluconeogenesis, in glucose-induced insulin secretion by
pancreatic islets, and in the biosynthesis of neurotransmitters
[Zhang et al., 1995; Jitrapakdee et al., 2005, 2008], and a 2.26 of fold
change was found in this study which is in agreement with previous
studies [Zhang et al., 1995;Wilson-Fritch et al., 2003]. Therefore, the
possible role of PCX up-regulation in the adipocyte differentiation
was further investigated by siRNA method. Oil Red staining and
triglyceride results showed that PCX siRNA transfection could
significantly inhibit adipogenesis, suggesting that PCX plays a
pivotal role during adipocyte conversion. The function of PKM2 in
adipose tissue remains poorly defined. However, the data from other
cell species demonstrate that PKM2 plays an important role in cell
proliferation. PKM2 is increased in proliferating cells [Li et al.,
2010]. In addition, Christofk et al. [2008] applied RNAi to knock
down PKM2 expression in H1299 cells, resulting in reduced
glycolysis and decreased cell proliferation. Taken together with our
data that low level of PKM2was present in adipocyte differentiation,
we suppose that most likely PKM2 suppressed adipogenesis. The
down-regulation of PHGDH may decrease the exit of 3-phospho-
glycerate from the glycolytic pathway and consequently stimulate
the conversion of glucose into acetyl-CoA [Renes et al., 2005].
Additional, both FAS and LOC100044223 are involved in fatty acid
Fig. 3. Western blot analysis of protein levels of (1) Destrin; (2) Nucleolin; (3) Zyx protein; (4) Transgelin 2; (5) VDAC2; (6) VDAC3; (7) Cytochrome b5; (8) PCX; and
(9) b-actin in 3T3-LI fibroblasts and adipocytes. b-Actin in the cell lysate served as a loading control.
Fig. 4. Real-time PCR analysis of mRNA levels of (1) Annexin A1; (2)
Cytochrome b5; (3) Eukaryotic translation elongation factor 1 alpha 1; (4)
VDAC2; (5) Ribosomal protein SA; (6) Nucleolin; (7) Transgelin 2; (8) b-actin
in 3T3-LI fibroblasts and adipocytes. Compared with 3T3-LI fibroblasts, 3T3-LI
adipocytes had an obvious up-regulation of Cytochrome b5 and VDAC2 and
down-regulation of Ribosomal protein SA, Eukaryotic translation elongation
factor 1 alpha 1, Nucleolin, Transgelin 2, and Annexin A1, which were identical
with the protein level changes in iTRAQ analysis. The statistics (mean� SEM)
was obtained from 3–4 experiments. The values normalize with b-actin
mRNA levels. �P< 0.05 considered as statistically significant. ��P< 0.01,���P< 0.001 versus 3T3-LI fibroblasts.
JOURNAL OF CELLULAR BIOCHEMISTRY iTRAQ ANALYSIS OF 3T3-L1 ADIPOCYTE DIFFERENTIATION 3011

synthesis and glycolytic activity [Jitrapakdee et al., 2008; Kang
et al., 2008].
Here, we also observed a differential expression of structural
proteins (including cytoskeletal proteins, molecular chaperone).
Among them, the increased expression of FABP4 is in agreement
with enhanced fatty acid synthesis [Kawachi et al., 2007; Karakas
et al., 2009]. Voltage-dependent anion channels (VDACs) are a class
of porin ion channel located on the outer mitochondrial membrane
[Hoogenboom et al., 2007]. Vertebrates have at least three members
(VDAC1, VDAC2, and VDAC3), and three mammalian isoforms may
each have some distinct physiological role [Cheng et al., 2003].
VDAC proteins constitute the major pathway for metabolic
exchange across mitochondrial outer membrane (MOM). Although
neither VDAC2 protein levels nor mRNA levels were further
validated, two studies indicated VDAC2 significantly increased in
adipogenesis using cDNA microarray or 2-DE analysis [Tan et al.,
2006; Kim et al., 2009]. Furthermore, our results agree with above-
mentioned observations. Interestingly, our data show that all three
members were markedly increased in adipogenesis, and VDAC2
showed the largest changes (2.22 of fold change) in protein
expression among them. Whether increased VDAC2 is mechanisti-
cally related to adipocyte differentiation? To our best knowledge, it
has not yet been reported. To study the functional role of VDAC2 up-
regulation during adipocyte induction, 3T3-L1 cells were trans-
fected with siRNA against VDAC2. We firstly demonstrated that the
suppression of VDAC2 expression markedly inhibited adipocyte
differentiation. Thus, it suggests that some structural proteins can
contribute to adipogenesis. As we know that both VDAC2 and
VDAC1 are components of the permeability transition pore
complex (PTPC) of the mitochondrial inner and outer membranes,
respectively. The subsequent dissipation of mitochondrial inner
membrane potential and release of cytochrome c through the outer
mitochondrial membrane are critical events in the early stages of
apoptosis. VDACs have been proposed in several reports as a
participant in cell death [Zamzami and Kroemer, 2001; Cheng et al.,
2003; Yagoda et al., 2007]. Yagoda et al. [2007] indicated that
ligands to VDACs induce non-apoptotic cell death selectively in
some tumor cells harboring activating mutations in the RAS–RAF–
MEK pathway. We suppose that VDAC2 is crucial in maintaining the
viability of pre-adipocytes during adipogenesis, and decreased
VDAC2 expression induces differentiating pre-adipocytes apoptosis.
In additional, Cheng et al. [2003] consolidated that VDAC2, but not
VDAC1 or VDAC3, significantly inhibited apoptosis mediated by
BAK. Critical questions are what roles, if any, does these proteins
play in adipogenesis, and whether would VDACs activate different
signal pathways regulating adipogenesis? Further study will
be necessary to fully understand the molecular events during
adipogenic process. Another up-regulated cellular structure protein
is cytochrome b5 which passes electrons from NADH, NADPH, and
ascorbate to the cyanide-sensitive factor where fatty acid
desaturation takes place. Reduced cytochrome b5 then provides
reducing equivalents for the biosynthesis of selected lipids and
drugs [Canova-Davis and Waskell, 1984; Stayton et al., 1988].
However, there have been few studies on the changes of adipose
tissue cytochrome b5 contents in obesity. Previous studies suggested
that cytoskeletal remodeling occurs during adipogenesis. Many
Fig. 5. A: Western blot analysis showed that transfection of 3T3-LI cells with
PCX or VDAC2 siRNA significantly reduced PCX or VDAC2 protein levels,
whereas PCX or VDAC2 protein expressions were not significantly suppressed
by control siRNA and Lipofectamine 2000. b-Actin in the cell lysate served as a
loading control. Lipofectamine 2000 (a cationic lipid, Invitrogen Corporation),
cells treated with Lipofectamine 2000 only. B–D: Furthermore, Oil Red staining
(B,C) and triglyceride assay (D) showed that transfection of 3T3-LI cells with
PCX or VDAC2 siRNA could inhibit in adipocyte differentiation. Triglyceride
was showed as mg cellular triglyceride per mg of total cellular protein. The
experiments were repeated in triplicate. Values are mean� SEM. �P< 0.05
considered as statistically significant. ��P< 0.01, ���P< 0.001 versus 3T3-LI
fibroblasts. ##P< 0.01, ###P< 0.001 versus 3T3-LI adipocytes.
3012 iTRAQ ANALYSIS OF 3T3-L1 ADIPOCYTE DIFFERENTIATION JOURNAL OF CELLULAR BIOCHEMISTRY

proteins such as Annexin, MYO1C, and Destrin are involved in
differentiation process. Our study is similar with previous
observations [Hackl et al., 2005; Renes et al., 2005; Molina et al.,
2009]. Previous study indicated that cytoskeletal remodeling does
not hinder lipolysis [Brasaemle et al., 2000]. However, the behavior
of the cytoskeleton remains obscure during 3T3-L1 differentiation.
Other interesting proteins include CCT4, CCT8, HSPE1, and
HSP90AB1. Although underlying mechanisms remain to be further
elucidated, the expression levels of these four molecular chaperones
were decreased in adipocyte.
Among 15 differential proteins involved in signal transduction
(including growth-regulator), several proteins such as C/EBPs and
CREB were consistent with previous observations, but three proteins
involved in secretion (EPDR1, SPNB2, and STEAP3) were first
discovered in 3T3-L1 differentiation. EPDR1, a soluble transmem-
brane protein, is secreted from mouse fibroblasts too [Sleat et al.,
2006]. It was reported to be associated with extracellular matrix too
[Shashoua et al., 1990]. SPNB2 is involved in secretion. It also
interacts with calmodulin in a calcium-dependent manner and is
thus a candidate for the calcium-dependent movement of the
cytoskeleton at the membrane [Urzua et al., 2006]. STEAP3 shown to
facilitate the secretion of translationally controlled tumor protein
(TCTP) through a non-classical pathway [Amzallag et al., 2004].
However, the adipogenesis mechanisms involve these proteins have
not been elucidated. These questions remain to be further elucidated.
A total number of six calcium-related proteins differentially
expressed were showed. The calcium ion is a highly versatile
intracellular signal regulating many different cellular functions
[Bootman and Berridge, 1995]. Transient calcium signals are
transduced by calcium-binding proteins acting on downstream
effector proteins and various enzymes. The calcium-related protein
plays a crucial role in various cellular signaling cascades through
regulation of numerous target proteins in a calcium-dependent
manner. However, little is known about the roles of calcium-related
proteins during adipogenesis.
Our results reveal changes in the profile of 106 protein species.
Moreover, we found 24 proteins whose expression has not been
reported before in 3T3-L1 adipocyte differentiation, and association
of PCX and VDAC2 with adipogenesis was verified. The complex
etiology of obesity requires a full understanding of the molecular
events during adipogenesis. These data provide new targets for
future investigation studies with respect to obesity.
ACKNOWLEDGMENTS
This work was supported by Natural Sciences Funds of China(30971532, 30771134, 30930082, 30900507, and 30801348).
REFERENCES
Akerblad P, Mansson R, Lagergren A,Westerlund S, Basta B, Lind U, Thelin A,Gisler R, Liberg D, Nelander S, Bamberg K, Sigvardsson M. 2005. Geneexpression analysis suggests that EBF-1 and PPARgamma2 induce adipo-genesis of NIH-3T3cells with similar efficiency and kinetics. Physiol Geno-mics 23:206–216.
Amzallag N, Passer BJ, Allanic D, Segura E, Thery C, Goud B, Amson R,Telerman A. 2004. TSAP6 facilitates the secretion of translationally con-
trolled tumor protein/histamine-releasing factor via a nonclassical pathway.J Biol Chem 279:46104–46112.
Atiar Rahman M, Kumar SG, Lee SH, Hwang HS, Kim HA, Yun JW. 2008.Proteome analysis for 3T3-L1 adipocyte differentiation. J Microbiol Bio-technol 18:1895–1902.
Bootman MD, Berridge MJ. 1995. The elemental principles of calciumsignaling. Cell 83:675–678.
Bornstein SR, Abu-AsabM, Glasow A, Path G, Hauner H, Tsokos M, ChrousosGP, Scherbaum WA. 2000. Immnohistochemical and ultrastructural locali-zation of leptin and leptin receptor in human white adipose tissue anddifferentiating human adipose cells in primary culture. Diabetes 49:532–538.
Brasaemle DL, Levin DM, Adler-Wailes DC, Londos C. 2000. The lipolyticstimulation of 3T3-L1 adipocytes promotes the translocation of hormone-sensitive lipase to the surfaces of lipid storage droplets. Biochim BiophysActa 1483:251–262.
Bray GA, Tartaglia LA. 2000. Medicinal strategies in the treatment of obesity.Nature 404:672–677.
Canova-Davis E, Waskell L. 1984. The identification of the heat-stablemicrosomal protein required for methoxyflurane metabolism ascytochrome b5. J Biol Chem 259:2541–2546.
Cheng EH, Sheiko TV, Fisher JK, Craigen WJ, Korsmeyer SJ. 2003.VDAC2 inhibits BAK activation and mitochondrial apoptosis. Science301:513–517.
Choi KL,Wang Y, Tse CA, LamKS, Cooper GJ, XuA. 2004. Proteomic analysisof adipocyte differentiation: Evidence that alpha2 macroglobulin is involvedin the adipose conversion of 3T3 L1 preadipocytes. Proteomics 4:1840–1848.
Christofk HR, Vander Heiden MG, Wu N, Asara JM, Cantley LC. 2008.Pyruvate kinase M2 is a phosphotyrosine-binding protein. Nature 452:181–186.
Cock TA, Auwerx J. 2003. Leptin: Cutting the fat off the bone. Lancet 362:1572–1574.
Hackl H, Burkard TR, Sturn A, Rubio R, Schleiffer A, Tian S, Quackenbush J,Eisenhaber F, Trajanoski Z. 2005. Molecular processes during fat celldevelopment revealed by gene expression profiling and functional annota-tion. Genome Biol 6:R108.
Hoogenboom BW, Suda K, Engel A, Fotiadis D. 2007. The supramolecularassemblies of voltage-dependent anion channels in the native membrane.J Mol Biol 370:246–255.
Hu HD, Ye F, Zhang DZ, Hu P, Ren H, Li SL. 2010. iTRAQ quantitative analysisof multidrug resistance mechanisms in human gastric cancer cells. J BiomedBiotechnol 2010:571343.
Jitrapakdee S, Slawik M, Medina-Gomez G, Campbell M, Wallace JC, SethiJK, O’Rahilly S, Vidal-Puig AJ. 2005. The peroxisome proliferator-activatedreceptor-gamma regulates murine pyruvate carboxylase gene expression invivo and in vitro. J Biol Chem 280:27466–27476.
Jitrapakdee S, St Maurice M, Rayment I, Cleland WW, Wallace JC, AttwoodPV. 2008. Structure, mechanism and regulation of pyruvate carboxylase.Biochem J 413:369–387.
Kang HJ, Jung SK, Kim SJ, Chung SJ. 2008. Structure of human alpha-enolase (hENO1), a multifunctional glycolytic enzyme. Acta Crystallogr DBiol Crystallogr 64:651–657.
Karakas SE, Almario RU, Kim K. 2009. Serum fatty acid binding protein 4,free fatty acids, and metabolic risk markers. Metabolism 58:1002–1007.
Kawachi H, Moriya NH, Korai T, Tanaka SY, Watanabe M, Matsui T, KawadaT, Yano H. 2007. Nitric oxide suppresses preadipocyte differentiation in 3T3-L1 culture. Mol Cell Biochem 300:61–67.
Kim SH, Park HS, Lee MS, Cho YJ, Kim YS, Hwang JT, Sung MJ, Kim MS,Kwon DY. 2008. Vitisin A inhibits adipocyte differentiation throughcell cycle arrest in 3T3-L1cells. Biochem Biophys Res Commun 372:108–113.
Kim KB, Kim BW, Choo HJ, Kwon YC, Ahn BY, Choi JS, Lee JS, Ko YG. 2009.Proteome analysis of adipocyte lipid rafts reveals that gC1qR plays essential
JOURNAL OF CELLULAR BIOCHEMISTRY iTRAQ ANALYSIS OF 3T3-L1 ADIPOCYTE DIFFERENTIATION 3013

roles in adipogenesis and insulin signal transduction. Proteomics 9:2373–2382.
Lago F, Dieguez C, Gomez-Reino J, Gualillo O. 2007. Adipokines as emergingmediators of immune response and inflammation. Nat Clin Pract Rheumatol3:716–724.
Lago F, Gomez R, Gomez-Reino JJ, Dieguez C, Gualillo O. 2009.Adipokines as novel modulators of lipid metabolism. Trends Biochem Sci34:500–510.
Li SL, Ye F, Cai WJ, Hu HD, Hu P, Ren H, Zhu FF, Zhang DZ. 2010.Quantitative proteome analysis of multidrug resistance in human ovariancancer cell line. J Cell Biochem 109:625–633.
Miner JL. 2004. The adipocyte as an endocrine cell. J Anim Sci 82:935–941.
Molina H, Yang Y, Ruch T, Kim JW, Mortensen P, Otto T, Nalli A, Tang QQ,Lane MD, Chaerkady R, Pandey A. 2009. Temporal profiling of the adipocyteproteome during differentiation using a five-plex SILAC based strategy.J Proteome Res 8:48–58.
Renes J, Bouwman F, Noben JP, Evelo C, Robben J, Mariman E. 2005. Proteinprofiling of 3T3-L1 adipocyte differentiation and (tumor necrosis factoralpha-mediated) starvation. Cell Mol Life Sci 62:492–503.
Roh C, Roduit R, Thorens B, Fried S, Kandror KV. 2001. Lipoprotein lipase andleptin are accumulated in different secretory compartments in rat adipocytes.J Biol Chem 276:35990–35994.
Rondinone CM. 2006. Adipocyte-derived hormones, cytokines, and media-tors. Endocrine 29:81–90.
Rosen ED, Spiegelman BM. 2006. Adipocytes as regulators of energy balanceand glucose homeostasis. Nature 444:847–853.
Shao DL, Lazar MA. 1997. Peroxisome proliferator activated receptorgamma, CCAAT/enhancer-binding protein alpha, and cell cycle statusregulate the commitment to adipocyte differentiation. J Biol Chem 272:21473–21478.
Shashoua VE, Hesse GW, Milinazzo B. 1990. Evidence for the in vivopolymerization of ependymin: A brain extracellular glycoprotein. BrainRes 522:181–190.
Sleat DE, Zheng H, Qian M, Lobel P. 2006. Identification of sites ofmannose 6-phosphorylation on lysosomal proteins. Mol Cell Proteomics5:686–701.
Stayton PS, Fisher MT, Sligar SG. 1988. Determination of cytochromeb5 association reactions. Characterization of metmyoglobin and cytochrome
P-450cam binding to genetically engineered cytochrome b5. J Biol Chem263:13544–13548.
Tan SH, Reverter A, Wang Y, Byrne KA, McWilliam SM, Lehnert SA. 2006.Gene expression profiling of bovine in vitro adipogenesis using a cDNAmicroarray. Funct Integr Genomics 6:235–249.
Than A, Ye F, Xue R, Ong JW, Poh CL, Chen P. 2010. The crosstalks betweenadipokines and catecholamines. Mol Cell Endocrinol 332:261–270.
Thompson D, Wolf AM. 2001. The medical-care cost burden of obesity. ObesRev 2:189–197.
Trujillo ME, Scherer PE. 2006. Adipose tissue-derived factors: Impact onhealth and disease. Endocr Rev 27:762–778.
Urzua U, Roby KF, Gangi LM, Cherry JM, Powell JI, Munroe DJ. 2006.Transcriptomic analysis of an in vitro murine model of ovarian carcinoma:Functional similarity to the human disease and identification of prospectivetumoral markers and targets. J Cell Physiol 206:594–602.
Wilson-Fritch L, Burkart A, Bell G, Mendelson K, Leszyk J, Nicoloro S, CzechM, Corvera S. 2003. Mitochondrial biogenesis and remodeling during adi-pogenesis and in response to the insulin sensitizer rosiglitazone. Mol Cell Biol23:1085–1094.
Yagoda N, von Rechenberg M, Zaganjor E, Bauer AJ, Yang WS, Fridman DJ,Wolpaw AJ, Smukste I, Peltier JM, Boniface JJ, Smith R, Lessnick SL,Sahasrabudhe S, Stockwell BR. 2007. RAS-RAF-MEK-dependent oxidativecell death involving voltage-dependent anion channels. Nature 447:864–868.
Ye F, Than A, Zhao YY, Goh KH, Chen P. 2010. Vesicular storage, vesicletrafficking, and secretion of leptin and resistin: The similarities, differences,and interplays. J Endocrinol 206:27–36.
Zamzami N, Kroemer G. 2001. The mitochondrion in apoptosis: HowPandora’s box opens. Nat Rev Mol Cell Biol 2:67–71.
Zhang J, Xia WL, Ahmad F. 1995. Regulation of pyruvate carboxylase in3T3-L1cells. Biochem J 306(Pt 1): 205–210.
Zhang H, Zhao C, Li X, Zhu Y, Gan CS, Wang Y, Ravasi T, Qian PY, Wong SC,Sze SK. 2011. Study of monocyte membrane proteome perturbation duringlipopolysaccharide-induced tolerance using iTRAQ-based quantitativeproteomic approach. Proteomics 10:2780–2789.
Zhou YT, Wang ZW, Higa M, Newgard CB, Unger RH. 1999. Reversingadipocyte differentiation: Implications for treatment of obesity. Proc NatlAcad Sci USA 96:2391–2395.
3014 iTRAQ ANALYSIS OF 3T3-L1 ADIPOCYTE DIFFERENTIATION JOURNAL OF CELLULAR BIOCHEMISTRY