comparative lca of alternative scenarios for waste ... · comparative lca of alternative scenarios...
TRANSCRIPT
sustainability
Article
Comparative LCA of Alternative Scenarios for WasteTreatment: The Case of Food Waste Production by theMass-Retail Sector
Giovanni Mondello 1,*, Roberta Salomone 2,*, Giuseppe Ioppolo 2, Giuseppe Saija 2,Sergio Sparacia 3 and Maria Claudia Lucchetti 1
1 Department of Business Studies, University of Roma Tre, Via Silvio D’Amico n. 77, 00145 Rome, Italy;[email protected]
2 Department of Economics, University of Messina, Piazza Pugliatti n.1, 98122 Messina, Italy;[email protected] (G.I.); [email protected] (G.S.)
3 Department of Economics, Business and Statistics Science, University of Palermo, Viale delle Scienze,90128 Palermo, Italy; [email protected]
* Correspondence: [email protected] (G.M.); [email protected] (R.S.);Tel.: +39-090-771548 (G.M. & R.S.)
Academic Editor: Alessandro RuggieriReceived: 27 February 2017; Accepted: 10 May 2017; Published: 15 May 2017
Abstract: Food waste is one of the most important issues taken into account by the European Union dueto its negative environmental, economic and social impacts. The treatment of food waste throughrecycling processes represents a solution for food waste minimisation. Concerning, in particular,the retail sector, it is necessary to define strategies for retail-oriented sustainable food waste management.The aim of this study is to compare the potential environmental impacts related to five scenarios(landfill, incineration, composting, anaerobic digestion and bioconversion through insects) for thedisposal/treatment of food waste produced by a mass retail company operating in Messina (Italy)through the application of the Life Cycle Assessment method, in order to find the best treatmentsolution. Results based on the treatment of a functional unit of 1 tonne of food waste show that thebioconversion scenario represents the most preferable solution considering all of the impact categoriesanalysed through the CML 2 baseline 2000 method, except for Global Warming, for which higherenvironmental performances are connected to the anaerobic digestion scenario. The incinerationand the bioconversion scenarios show the highest environmental benefits when the production ofalternative energy sources and valuable materials is evaluated through the inclusion of the avoidedproductions in the analysis.
Keywords: food waste; Life Cycle Assessment; mass-retail; supermarkets; alternative scenarios;landfill; incineration; composting; biogas; bioconversion
1. Introduction
Food waste (FW) is one of the most significant problems taken into account by the EuropeanUnion and the international scientific community in recent years. Gustavsson et al. [1] estimatedthat the amount of global food waste and loss is about 1.3 billion tonnes per year, equivalent to onethird of food produced globally for human consumption. In particular, the amount of food wastedin the EU-28 is about 88 million tonnes per year (equivalent to 173 kg per capita), when consideringboth edible food and the inedible parts associated with food [2]. The increasing attention paid to FWissues is mainly due to its negative environmental, economic and social impacts [3,4]. For instance,the greenhouse gas (GHG) emissions related to the food wasted during the production phase wereestimated to be about 2.2 Gt CO2 equivalent (eq) in 2011 [5], while the costs associated with the
Sustainability 2017, 9, 827; doi:10.3390/su9050827 www.mdpi.com/journal/sustainability
Sustainability 2017, 9, 827 2 of 18
wastage were around 143 billion Euro per annum in the EU-28 [2]. In this context, the reduction ofFW and the optimisation of its management is a priority for the European Commission, which isworking to achieve a significant reduction in FW by 2020 by means of joint actions, in order to obtain aminimisation of loss and waste throughout the whole food supply chain [6]. The growing awarenessof the need for sustainable strategies for the FW management hierarchy is driving, on the one hand,towards an increase in research activities oriented towards waste prevention, which should be themost preferable solution [7]; and on the other, towards an increasing consideration of FW treatment atthe disposal/recycling stage.
1.1. Food Waste: A Life Cycle Perspective
Considering a life cycle perspective, it is important to highlight that FW production is not onlyrelated to one single stage, but is a phenomenon that includes all levels of food chain [8]. In particular,according to Stenmarck et al. [2], the largest contribution to FW production in the EU-28 is due to thehousehold sector (46.5 million tonnes per year), followed by the processing stage (16.9 million tonnesper year). Furthermore, even if the primary production sector causes the highest environmental impactin terms of the whole life cycle of the food chain [9], it contributes less to FW production, providingabout 9.1 million tonnes per year and contributing 11% to the total wasted food in the EU-28.
In contrast, the lowest FW production, from a life cycle perspective, is connected to the wholesaleand retail sectors, which cause about 5 million tonnes per year, corresponding to 5% of the total amountof FW produced in the EU-28. Nevertheless, these sectors show the highest contribution in terms ofedible food wasted (about 83%) and a high economic loss equivalent to 2768 Euro per tonne of edibleFW [2]. In addition, the retail sector is directly connected to the consumers that represent the laststep in the food supply chain, and who are the main contributors to household production of FW(about 53%) [2,3,10,11].
Due to this, it is necessary to define strategies for retail-oriented sustainable FW management,considering that the mass retail sector presents particular features that are not involved in the othersectors or, in particular, at the household level. Indeed, mass retail companies (MRCs) can be directlyinvolved in the selection of the best practices for FW’s collection and transport as well as for itstreatment, creating new business opportunities for FW utilisation following a circular economyapproach. Furthermore, the MRCs are directly involved in the quantitative and qualitative analysisof FW produced and this may allow a more detailed assessment of the FW management strategies.In this context, the analysis of different treatment systems for FW produced by the mass retail sectorshould be taken into account considering a life cycle thinking perspective.
1.2. Life Cycle Assessment Studies in a Food Waste Context
Notarnicola et al. [12] highlighted that the Life Cycle Assessment (LCA) method is able tooffer an important contribution to the analysis of FW management, allowing the proposal ofenvironmentally-friendly solutions (e.g., using recovered nutrients as fertilizers) or improvingmanagement options along the whole production chain in a circular economy context. The LCAmethod has been widely adopted in recent years to analyse FW management activities (e.g., [4,13–17]).
For instance, Salomone et al. [4] applied LCA in order to assess the FW bioconversion processinto compost (to be used as fertilizers) and dried larvae (to be adopted as fishmeal) by the action of theHermetia illucens insect (Black Soldier Fly). The main results underscored the fact that the bioconversionprocess contributed 30.2 kg CO2 in Global Warming Potential (GWP), 215.3 MJ in Energy Use, and0.661 m2a in Land Use per 1 tonne of FW.
Caputo et al. [16] adopted the Food Chain Model and the LCA method in order to analyse all thesteps of the food chain, and to assess the environmental impacts with the aim of proposing a means ofsustainable development related to the organisation of food demand and supply in an institutionalfood system, considering the food production, processing, consumption, and waste management atthe local level. In particular, the study focused attention on the quantification of the energy sources

Sustainability 2017, 9, 827 3 of 18
in the food supply chain. Results showed that the main sustainable strategies were connected tothe utilisation of seasonal, less energy-intensive, locally-sourced products. Furthermore, the authorsunderlined that a possible solution to manage FW may be represented by its conversion into energysources, such as biodiesel and bio-methane.
Schott et al. [13] carried out a review analysis of nineteen existing LCA studies on food wastemanagement in order to propose a general overview of the GWP related to different treatment systems,and to identify decisive factors that may cause changes in the impacts. The main results highlightedseveral methodological differences, in particular connected to the selection of system boundaries andvariation in the input data adopted to assess similar processes. In addition, the changing in GWP resultsis mainly related to the assumptions made in relation to the background system (e.g., assumptionsrelated to the interaction of the waste management system with the background energy system and/orbio-system).
Regarding the household sector, different LCA studies were implemented. For example,Naroznova et al. [18] assessed the GWP impacts based on a treatment of the proportions of individualmaterials found in organic household waste in Denmark, comparing anaerobic digestion andincineration systems. Results highlighted that anaerobic digestion allowed a GWP reduction when FW(and, in particular, animal and vegetable fractions, as well as kitchen towels) were treated.
In addition, Bernstad and la Cour Jansen [19] carried out an LCA study in order to analysethe environmental impacts (positive or negative) related to the management of the household’s FWproduced in a residential area in Malmö (Sweden), comparing three different treatment systems(decentralised composting, centralized anaerobic digestion and incineration) and including in theanalysis the use of the resources obtained by the treatment processes. GWP results showed that biogasdigestion caused the main environmental benefits, in particular when biogas is adopted as substitutefor the electricity coal power source.
A literature analysis conducted using the keywords “Life Cycle Assessment”, “food waste”and “supermarket” or “retail” in Science Direct and Web of Science (WoS) databases in April 2017underscored that only four LCA studies related to FW produced at the retail level were publishedbetween 2000 and 2017 in international scientific journals: Brancoli et al. [11] and Scholz et al. [20],Eriksson and Spångberg [21] and Eriksson et al. [22]. Furthermore, the literature analysis confirmedthat the assessment of the environmental impacts related to the FW produced by the mass retail sectorthrough the LCA method is a recent issue, since all four studies were carried out in the last two years.
Brancoli et al. [11] analysed the FW produced at a supermarket in Sweden in order to categoriseand quantify the FW fractions, to assess which portions present the highest environmental impacts, andto propose alternative treatment processes to the systems currently adopted. Results underscored thatbread had the largest contribution in terms of mass and economic costs, as well as in environmentalimpact, especially when ozone depletion, freshwater ecotoxicity and resource depletion were assessed.Regarding GWP impacts, the main contribution came from beef waste. The analysis of environmentalimpacts related to alternative treatment scenarios showed that the production of biogas through apre-separation of the FW from its packaging and the utilization of bread waste for feed productionwere the most preferable solutions.
Scholz et al. [20] applied LCA in order to assess the Carbon Footprint (CF) of FW coming fromdifferent departments of Swedish supermarkets. The products’ CF was calculated using the resultsfrom previous studies. The analysis highlighted that the main contribution to the CF came from fruitand vegetable departments, followed by meat departments.
Two similar LCA studies have been carried out by Eriksson and Spångberg [21] andEriksson et al. [22]. The authors performed, in both studies, comparative LCAs between different foodproducts treated by means of various systems in order to assess the CF or energy use. The main resultsof these studies highlighted that the best waste management scenario, as well as reductions in GHGemissions or in primary energy use, can be directly related to the type of food products treated.

Sustainability 2017, 9, 827 4 of 18
Instead, the literature overview underscored that many LCA studies focusing on FW managementhave been performed, but only four are directly related to the mass-retail channel. Furthermore, evenif different treatment systems for FW were investigated and compared (e.g., landfill, composting, etc.),some hypotheses have been less rigorously evaluated, such as the bioconversion process, which, inaccordance with Salomone et al. [4], may represent an attractive solution for FW treatment. Lastly,the four LCA studies on FW at the retail level focus on the assessment of FW management scenarioswithin a specific local food-chain or with a regional contextualisation (relating in particular to Sweden),but none of them aim at the identification of proper strategies for FW management directly related to aspecific MRC, considering, in particular, collection and transport activities.
In this context, the aim of this study is to compare the potential environmental impact relatedto five different scenarios (landfill, incineration, composting, anaerobic digestion, and bioconversioninto compost and feed through the action of the insect Hermetia illucens) for the disposal and recyclingof FW produced by an MRC operating in Messina (Italy), using the LCA method. Furthermore, thisstudy allows, on one hand, identification of the system with the lowest environmental impact inorder to support the MRCs in deciding on the adoption of sustainable FW management and treatmentstrategies; while on the other hand, adding environmental information useful for the evaluation ofnew business opportunities for FW treatment and utilisation.
2. Materials and Methods
The assessment of the potential environmental impacts related to five different scenarios ofdisposal/treatment of FW produced by an MRC operating in Messina (Italy) is carried out by meansof the Life Cycle Assessment (LCA) method. The LCA method is a standardized tool that allowsthe assessment of the potential environmental impact associated with a product, process, or servicethroughout its entire life cycle, from raw material extraction and processing, through manufacturing,transport, use and final disposal [23]. In accordance with ISO standards [24,25], an LCA study isstructured of four iterative phases: goal and scope definition, inventory analysis, impact assessmentand interpretation.
The assessment is carried out through a comparative LCA, that means that the comparison of theenvironmental profiles of different systems is made on the basis of equivalent functions. In particular,two FW disposal scenarios (representing the two options actually implemented by the investigatedMRC) are compared with alternative hypothetical treatment scenarios, in order to evaluate how theresults change when alternative FW treatment processes and an optimised localisation of treatmentfacilities are considered.
2.1. Goal and Scope Definition
The goal of this study is to assess the potential environmental impact associated with the treatmentof FW produced by a MRC operating in Messina (Italy), comparing five different scenarios. The LCAmethod is applied to analyse both disposal scenarios (landfill—scenario 1; and incineration—scenario 2)and alternative scenarios for the recycling/recovery of the organic fraction (composting—scenario 3;production of biogas—scenario 4; and production of compost and feed through the action of the insectHermetia illucens—scenario 5). Thus, this research is carried out in order to find the system with thelower environmental impacts, helping the mass retail company to select sustainable practices for thetreatment of FW.
System boundaries (Figure 1) include all the direct and indirect activities involved in themanagement of FW produced by the MRC, from FW collection at supermarkets to its final treatment.In this context, three main phases were investigated:
1. Collection—transportation of FW and its packaging from 12 retail stores of the MRC to the landfilland incineration plant through the collection centre (in scenarios 1 and 2), or transportation fromthe stores to the unpacking plant (for scenarios 3, 4 and 5), is considered;

Sustainability 2017, 9, 827 5 of 18
2. Pre-treatment—FW fraction is separated from its packaging in order to carry out the treatment inthe subsequent phase. This phase is only necessary for scenarios 3, 4 and 5; and
3. Treatment—FW is treated in the different plants under investigation (landfill, incinerator,composting, anaerobic digestion and bioconversion).
Sustainability 2017, 9, 827 5 of 17
Figure 1. System boundaries.
Furthermore, the avoided production of different energy sources and materials was also included in the system boundaries. The inclusion of avoided products means that FW treatment processes allow for the avoided production of conventional products and thereby a negative contribution to the environmental impacts. The treatment of packaging materials (plastic and paper) separated during the pre-treatment phase was assumed to be equal for each scenario (incineration with energy recovery). The utilisation of the products obtained from the treatment processes was not included in the system boundaries because these are outside the scope of this study.
In order to design the different scenarios, some estimations and assumptions were made. Firstly, a localisation in the same area at an average distance (about 30 km) among the supermarkets of the MRC is supposed for the de-packing and recycling/recovery plants in order to optimise the collection and transport of FW. Secondly, two plants situated in the Province of Messina (Italy) are considered for the localisation of the landfilling and the incineration systems, even if they were actually inactive (Figure 2). Finally, since the data related to the treatment phase is obtained from the international literature, the composition of FW sent to the treatment plants is assumed to be the same as was analysed in the baseline studies.
In accordance with other authors [4,26,27] who have implemented LCA studies related to FW management, a functional unit (FU) of 1 tonne of FW to be treated was selected in order to carry out the comparison between the investigated scenarios.
Figure 1. System boundaries.
Furthermore, the avoided production of different energy sources and materials was also includedin the system boundaries. The inclusion of avoided products means that FW treatment processesallow for the avoided production of conventional products and thereby a negative contribution to theenvironmental impacts. The treatment of packaging materials (plastic and paper) separated during thepre-treatment phase was assumed to be equal for each scenario (incineration with energy recovery).The utilisation of the products obtained from the treatment processes was not included in the systemboundaries because these are outside the scope of this study.
In order to design the different scenarios, some estimations and assumptions were made. Firstly,a localisation in the same area at an average distance (about 30 km) among the supermarkets of theMRC is supposed for the de-packing and recycling/recovery plants in order to optimise the collectionand transport of FW. Secondly, two plants situated in the Province of Messina (Italy) are consideredfor the localisation of the landfilling and the incineration systems, even if they were actually inactive(Figure 2). Finally, since the data related to the treatment phase is obtained from the internationalliterature, the composition of FW sent to the treatment plants is assumed to be the same as wasanalysed in the baseline studies.
In accordance with other authors [4,26,27] who have implemented LCA studies related to FWmanagement, a functional unit (FU) of 1 tonne of FW to be treated was selected in order to carry outthe comparison between the investigated scenarios.

Sustainability 2017, 9, 827 6 of 18Sustainability 2017, 9, 827 6 of 17
Figure 2. Localisation of the supermarkets/treatment plants and average distance for food waste transportation.
2.2. Inventory Analysis
Foreground data refer to the amount and transport of FW and its packaging, for which primary data were collected through specific questionnaires and direct interviews. Data were collected in 2015, and the total amount of the FW and its packaging produced by the 12 MRC stores was 112.77 tonnes, for which 98.7% was composed of the FW fraction and 1.3% was represented by the packaging fraction. The FW is mainly composed of fruits and vegetables, followed by meat and fish, deli products and dairy and cheese products (Figure 3). The average moisture content of the FW is about 75%.
Figure 3. Percentage composition of the food waste produced by the MRC stores.
Background data refer to secondary data obtained from the international literature and databases. In particular, data related to the pre-treatment phase, concerning the amount of electricity adopted during the unpacking process, are estimated using the data from Atritor Company [28]. In addition, previous LCA studies are used in order to collect the inventory data related to the hypothetical treatment plants in phase 3: Mendes et al. [29] for landfill and incineration, Righi et al. [30] for composting and anaerobic digestion, and Salomone et al. [4] for the bioconversion process.
The inventory (Table 1) includes foreground data and background data.
Figure 2. Localisation of the supermarkets/treatment plants and average distance for food waste transportation.
2.2. Inventory Analysis
Foreground data refer to the amount and transport of FW and its packaging, for which primarydata were collected through specific questionnaires and direct interviews. Data were collected in 2015,and the total amount of the FW and its packaging produced by the 12 MRC stores was 112.77 tonnes,for which 98.7% was composed of the FW fraction and 1.3% was represented by the packaging fraction.The FW is mainly composed of fruits and vegetables, followed by meat and fish, deli products anddairy and cheese products (Figure 3). The average moisture content of the FW is about 75%.
Sustainability 2017, 9, 827 6 of 17
Figure 2. Localisation of the supermarkets/treatment plants and average distance for food waste transportation.
2.2. Inventory Analysis
Foreground data refer to the amount and transport of FW and its packaging, for which primary data were collected through specific questionnaires and direct interviews. Data were collected in 2015, and the total amount of the FW and its packaging produced by the 12 MRC stores was 112.77 tonnes, for which 98.7% was composed of the FW fraction and 1.3% was represented by the packaging fraction. The FW is mainly composed of fruits and vegetables, followed by meat and fish, deli products and dairy and cheese products (Figure 3). The average moisture content of the FW is about 75%.
Figure 3. Percentage composition of the food waste produced by the MRC stores.
Background data refer to secondary data obtained from the international literature and databases. In particular, data related to the pre-treatment phase, concerning the amount of electricity adopted during the unpacking process, are estimated using the data from Atritor Company [28]. In addition, previous LCA studies are used in order to collect the inventory data related to the hypothetical treatment plants in phase 3: Mendes et al. [29] for landfill and incineration, Righi et al. [30] for composting and anaerobic digestion, and Salomone et al. [4] for the bioconversion process.
The inventory (Table 1) includes foreground data and background data.
Figure 3. Percentage composition of the food waste produced by the MRC stores.
Background data refer to secondary data obtained from the international literature and databases.In particular, data related to the pre-treatment phase, concerning the amount of electricity adoptedduring the unpacking process, are estimated using the data from Atritor Company [28]. In addition,previous LCA studies are used in order to collect the inventory data related to the hypotheticaltreatment plants in phase 3: Mendes et al. [29] for landfill and incineration, Righi et al. [30] forcomposting and anaerobic digestion, and Salomone et al. [4] for the bioconversion process.
The inventory (Table 1) includes foreground data and background data.

Sustainability 2017, 9, 827 7 of 18
Table 1. Main input and output data related to the functional unit of 1 tonne of FW to be treated.
UnitScenario 1 Scenario 2 Scenario 3 Scenario 4 Scenario 5
Landfill Incineration Composting Biogas H. illucens
InputTransport tkm 90.3 90.3 19.9 19.9 19.9Electricity kwh 665 161 145 89 68Diesel kg 0.8 5.8 0.5Natural gas m3 11Chemicals inorganic kg 10Auxiliary materials kg 2 0.1Water kg 61
OutputElectricity kWh 166 564Compost kg 210 220 335Biogas Nm3 85Dried larvae kg 30
In scenario 1, which represents the most common treatment system adopted in the local contextunder investigation, the disposal of FW with its packaging is sent to landfill. Data related to theelectricity and diesel consumption as well as the direct emissions due to waste treatment are considered.Furthermore, the production of biogas and the 30% energy recovery efficiency are assumed.
In scenario 2, the incineration of FW and its packaging by means of a mass-burn incinerator andthe recovery of heat and electricity with an energy efficiency of 15% are assumed. The inventory datainclude substances, electricity and natural gas utilisation during the process. The direct emissions andthe transportation and disposal of the ashes in the landfill are also included in the analysis.
In scenario 3, the FW fraction obtained by the unpacking process is treated by means of acomposting plant in order to produce compost to be used as fertilizer. The amount of compost obtainedby the process represents about 21% of the initial quantity of FW treated. Data connected to water,electricity and diesel consumption, as well as the emissions and the leachate disposal are considered.
In scenario 4, FW without its packaging is sent to an anaerobic digestion plant in order to obtainboth biogas and compost. The biogas is combusted in a Combined Heat & Power (CHP) unit in orderto produce electricity. The plant efficiency allows producing 85 Nm3 of biogas (converted in 175 kWhof electricity) and 220 kg of solid digested matter from 1 tonne of FW. Inputs and outputs related tothe system include materials, electricity and water consumption, and the direct emissions due to thetreatment process.
In scenario 5, after the unpacking process (as in scenarios 3 and 4), FW is treated in a bioconversionplant through the action of the H. illucens insect in order to produce compost and dried larvae to beused, respectively, as fertilizer and a possible source for fish feed formulation. In particular, the insectsare fed with FW and after the bioconversion process and the related production of the bio-digested(compost), H. illucens larvae are dried in order to produce feed. The waste reduction efficiency ofthe plant is about 67% and data related to materials, water and electricity consumption, and directemissions are considered in the inventory analysis.
International databases are adopted in order to include the inventory data regarding raw materialsand energy sources [31,32] as described in Table 2.

Sustainability 2017, 9, 827 8 of 18
Table 2. Data sources related to the international databases.
Scenario Phase Process Data Source
Landfill
Collection Transport, lorry, 7.5–16 tonnes, EURO4/RER U Ecoinvent [31]
Pre-treatment None None
Treatment
Diesel, at refinery/RER U Ecoinvent [31]
Electricity, high voltage, at grid/IT U Ecoinvent [31]
Electricity, medium voltage, at grid/IT U (AvPr) 1 Ecoinvent [31]
Incineration
Collection Transport, lorry, 7.5–16 tonnes, EURO4/RER U Ecoinvent [31]
Pre-treatment None None
Treatment
Electricity, high voltage, at grid/IT U Ecoinvent [31]
Electricity, natural gas, at power plant/IT U Ecoinvent [31]
Diesel, at refinery/RER U Ecoinvent [31]
Chemicals (inorganic) Ecoinvent [31]
Auxiliary materials Ecoinvent [31]
Electricity, medium voltage, at grid/IT U (AvPr) 1 Ecoinvent [31]
Composting
Collection Transport, lorry, 7.5–16 tonnes, EURO4/RER U Ecoinvent [31]
Pre-treatment Electricity, high voltage, at grid/IT U Ecoinvent [31]
Treatment
Diesel, at refinery/RER U Ecoinvent [31]
Electricity, high voltage, at grid/IT U Ecoinvent [31]
Urea (AvPr) 1 Ecoinvent [31]
Biogas
Collection Transport, lorry, 7.5–16 tonnes, EURO4/RER U Ecoinvent [31]
Pre-treatment Electricity, high voltage, at grid/IT U Ecoinvent [31]
Treatment
Electricity, high voltage, at grid/IT U Ecoinvent [31]
Electricity, natural gas, at power plant/IT U (AvPr) 1 Ecoinvent [31]
Urea (AvPr) 1 Ecoinvent [31]
H. illucens
Collection Transport, lorry, 7.5–16 tonnes, EURO4/RER U Ecoinvent [31]
Pre-treatment Electricity, high voltage, at grid/IT U Ecoinvent [31]
Treatment
Electricity, medium voltage, at grid/IT U Ecoinvent [31]
Tap water, at user/RER U Ecoinvent [31]
Transport, lorry 3.5–7.5 tonnes, EURO4/RER U Ecoinvent [31]
Urea (AvPr) 1 Ecoinvent [31]
Soy meal (AvPr) 1 LCA Food DK [32]1 Avoided Product (AvPr).
Due to the production of new valuable materials and energy sources through the FW treatment,the avoided production of similar conventional products was also considered in the present study(Table 3). The avoided products are selected in accordance with the previous studies used to include theinventory data related to phase 3. The reference substances for the avoided production are calculatedconsidering the content of total nitrogen for the compost, the amount of electricity produced fromthe biogas combustion for the anaerobic digestion, and the content of protein for the dried larvae.Furthermore, mineral fertiliser (urea) and electricity are assumed to be replaced by compost and biogas,while the dried larvae are considered to be a substitute for soy meal.

Sustainability 2017, 9, 827 9 of 18
Table 3. Recycled materials/energy sources and quantification of the avoided products related to thefunctional unit of 1 tonne of FW to be treated.
ScenarioRecycled Materials/Energy Sources Avoided Products
Material Unit Amount Material Unit Amount
Landfill Electricity kWh 166 Electricity kWh 166Incineration Electricity kWh 564 Electricity kWh 564Composting Compost kg 210 Urea kg 9
Anaerobic digestion Biogas Nm3 85 Electricity kWh 175Compost kg 220 Urea kg 9.4
BioconversionCompost kg 335 Fertilizer (N) kg 50
Dread larvae kg 30 Soy meal kg 28
2.3. Life Cycle Impact Assessment
SimaPro 8 software [33] is used to perform the analysis. The Life Cycle Impact Assessment (LCIA)has been carried out by means of CML 2 baseline 2000 method [34] in order to obtain a higher level ofdetail allowing to develop a detailed environmental picture of each scenario, considering ten differentimpact categories and the respective characterisation factors: Abiotic Depletion (ADP), Acidification(AP), Eutrophication (EP), Global Warming (GWP100), Ozone Layer Depletion (ODP), Human Toxicity(HTP), Fresh Water Aquatic Ecotoxicity (FAETP), Marine Aquatic Ecotoxicity (MAETP), TerrestrialEcotoxicity (TETP), Photochemical Oxidation (POCP). Furthermore, Energy Use (EU) (CumulativeEnergy Demand method [35,36]) and Land Use (LU) (CML 2001 method [37]) impact categorieswere also assessed, according to other LCA studies related to the specific field of FW management.In the present study only the compulsory phases of the LCA method according to ISO 14,044 [25]are implemented.
3. Results and Discussion
In this section, characterization results related firstly to the five scenarios without the inclusion ofthe avoided products are shown. Then, results with the inclusion of avoided production are evaluated.The inclusion of the avoided products in the analysis allows an understanding of what potentialenvironmental benefits may be connected with the substitution of a valuable substance or energysource produced by the treatment process with a related conventional material or energy source. In thiscontext, the results of the comparison between the scenarios in which the energy recovery representsthe main products obtained by the treatment of FW (scenarios 1, 2 and 4) is shown first, then thecomparison between systems with recovery of valuable materials, such as compost (scenarios 3 and 5),is analysed.
3.1. Characterisation Results without Avoided Product
The comparative analysis of the five scenarios excluding the avoided products (Table 4)underscores the fact that the highest potential environmental loads are related to landfill andincineration scenarios in all the impact categories, while the lower load is connected to H. illucensscenario, except for the global warming impact category, for which the biogas scenario shows thelowest impacts. Analysing each scenario, results highlight that the percentage contribution to thepotential environmental impacts for each category ranges from 80.8% for photochemical oxidation to48% for ozone layer depletion in scenario 1, from 35.7% for global warming to 8.1% for photochemicaloxidation in scenario 2, from 12.9% for acidification to 4.9% for global warming in scenario 3, from7.6% for fresh water aquatic ecotoxicity to 2.8% for global warming in scenario 4, and from 6.4% interrestrial ecotoxicity to 2.4% for photochemical oxidation in scenario 5.
The potential advantages related to the treatment of FW by means of the bioconversion process(scenario 5) in all impact categories except for global warming are mainly due to the lower electricityconsumption in the treatment phase which contributes less than 1.8% to the total impacts when

Sustainability 2017, 9, 827 10 of 18
compared with other scenarios. An in-depth analysis of GWP impacts shows that biogas and H. illucensscenarios, which present lower impacts, contribute 66.1 and 71 kg CO2 eq per FU, respectively.In particular, the main potential impacts associated with the biogas scenario are due to the use ofelectricity in the pre-treatment and treatment phases, which contributes 78.9%, while, in the H. illucensscenario, the highest impacts are related to electricity consumption and to GHG emissions during thebioconversion process in the treatment phase, which contribute 56.4% and 24.2%, respectively, to thetotal GWP impacts. Furthermore, the analysis underscore the fact that the potential environmentalimpacts related to the composting scenario are lower than landfill and incineration scenario, and higherthan the biogas and H. illucens scenarios in all impact categories analysed. In particular, regarding theGWP, the composting scenario shows a value of 99.2 kg CO2 eq, and the highest impacts are due to theconsumption of electricity during the treatment phase, contributing 51.9%. In addition, the treatmentof the packaging material through the incineration system in scenarios 3, 4 and 5 shows lower potentialenvironmental impact. For example, the contribution to the GWP impact is 10.5% in the compostingscenario, 15.8% in biogas scenario, and 14.7% in H. illucens scenario. The EU results show that thelowest contribution to the total impacts is connected to the H. illucens scenario which shows a value of772.62 MJ per FU, while the highest impact is related to the landfill scenario (6874.4 MJ), for whichthe main contribution to the EU impact category is due to the electricity consumption (94.5%) duringthe treatment phase. Furthermore, the biogas scenario shows the best environmental performance interms of LU (0.47 m2a per FU), followed by the H. illucens scenario (0.89 m2a per FU). On the contrary,the highest LU impacts are connected to the landfill scenario, which contributes to the impacts for3.18 m2a per FU.
Table 4. Comparison between the scenarios without the inclusion of the avoided products (functionalunit 1 tonne of food waste to be treated).
Impact Category UnitScenario 1 Scenario 2 Scenario 3 Scenario 4 Scenario 5
Landfill Incineration Composting Biogas H. illucens
Abiotic depletion kg Sb eq 2.91 1.54 0.65 0.42 0.33Acidification kg SO2 eq 1.99 0.88 0.50 0.29 0.22
Eutrophication kg PO4− eq 0.85 0.21 0.11 0.06 0.05
Global warming kg CO2 eq 1243.98 822.67 99.28 66.07 71.02Ozone layer depletion kg CFC-11 eq 3.40 × 10⁻⁵ 2.01 × 10⁻⁵ 7.75 × 10⁻⁶ 5.03 × 10⁻⁶ 4.02 × 10⁻⁶
Human toxicity kg 1.4-DB eq 93.83 41.05 20.82 13.32 10.64Fresh water aquatic ecotox. kg 1.4-DB eq 55.64 20.65 12.26 7.77 6.11Marine aquatic ecotoxicity kg 1.4-DB eq 133,965.36 49,607.83 29,476.41 18,608.93 14,609.60
Terrestrial ecotoxicity kg 1.4-DB eq 0.95 0.49 0.21 0.14 0.12Photochemical oxidation kg C2H4 eq 2.97 × 10⁻¹ 2.97 × 10⁻² 1.79 × 10⁻² 1.43 × 10⁻² 8.97 × 10⁻³
Energy use MJ 6874.40 3480.82 1543.14 982.36 772.62Land use m2a 3.18 1.24 0.70 0.47 0.89
The analysis of each phase (collection, pre-treatment and treatment) is shown in Figure 4.Results underscore the fact that the assumption regarding localisation in the same area at an averagedistance among all stores of the MRC for the unpacking and the recycling/recovery plants allows anoptimisation of transport activities, since the collection phase presents the lowest impacts comparedwith the pre-treatment and treatment phases. For instance, analysing the GWP impacts related to theH. illucens scenario, phase 1 contributes 6.2%, while phase 2 and phase 3 contribute 44.4% and 49.4%,respectively. Regarding the recycling/recovery scenarios, and in particular the anaerobic digestion andbioconversion systems, Figure 4 underlines the fact that the contribution of the pre-treatment phaseis higher than the collection and treatment phases in all impact categories, except for photochemicaloxidation in the biogas scenario and global warming in the H. illucens scenario. The contributionof phase 2 ranges from 44% for photochemical oxidation to 56.8% for marine aquatic ecotoxicity inscenario 4, and from 44.3% for GWP to 72.4% for marine aquatic ecotoxicity in scenario 5. The mainpotential environmental impacts connected to phase 2 are due to the consumption of electricityduring the unpacking process. It is important to underscore that the pre-treatment phase was not

Sustainability 2017, 9, 827 11 of 18
evaluated in scenarios 1 and 2, since FW was sent to the landfill and to the incineration plant with itspacking fraction.
For each scenario and each phase, the main hotspots are always represented by energyconsumption processes, highlighting that a key issue on which the strategies of retail-oriented FWmanagement should focus on are strongly energy related.Sustainability 2017, 9, 827 11 of 17
Figure 4. Characterisation results of the five scenarios: contribution analysis of the three main phases investigated (without the inclusion of the avoided products).
3.2. Characterisation Results with the Inclusion of Avoided Product
Results with the inclusion of the avoided production underscore a higher reduction of the potential environmental impacts when compared with the results excluding the avoided products (Table 5). In particular, the highest advantages are connected with the incineration, biogas and H. illucens scenarios, for which all of the impact categories show a high negative contribution to the impacts. Instead, the avoided production of a conventional electricity source, corresponding to the electricity obtained from the biogas produced in the landfill scenario, results in fewer benefits in terms of potential environmental impacts, since the percentage variation is from 45.26% in terrestrial ecotoxicity to 6.54% in photochemical oxidation.
Figure 4. Characterisation results of the five scenarios: contribution analysis of the three main phasesinvestigated (without the inclusion of the avoided products).
3.2. Characterisation Results with the Inclusion of Avoided Product
Results with the inclusion of the avoided production underscore a higher reduction of the potentialenvironmental impacts when compared with the results excluding the avoided products (Table 5).In particular, the highest advantages are connected with the incineration, biogas and H. illucensscenarios, for which all of the impact categories show a high negative contribution to the impacts.Instead, the avoided production of a conventional electricity source, corresponding to the electricityobtained from the biogas produced in the landfill scenario, results in fewer benefits in terms of potentialenvironmental impacts, since the percentage variation is from 45.26% in terrestrial ecotoxicity to 6.54%in photochemical oxidation.

Sustainability 2017, 9, 827 12 of 18
Table 5. Comparison of the characterisation results related to the functional unit of 1 tonne of FW to be treated, with and without avoided products (AvPr).
Impact Category UnitScenario 1—Landfill Scenario 2—Incineration Scenario 3—Composting Scenario 4—Biogas Scenario 5—H. illucens
Without With% 1 Without With
% 1 Without With% 1 Without With
% 1 Without With% 1
AvPr AvPr AvPr AvPr AvPr AvPr AvPr AvPr AvPr AvPr
Abiotic depletion kg Sb eq 2.91 2.21 ↓23.83 1.54 −0.81 ↓152.83 0.65 0.36 ↓44.85 0.42 −2.57 ↓717.00 0.33 −1.01 ↓408.58Acidification kg SO2 eq 1.99 1.51 ↓24.01 0.88 −0.74 ↓184.98 0.50 0.38 ↓24.60 0.29 −0.23 ↓179.16 0.22 −1.28 ↓681.51
Eutrophication kg PO4− eq 0.85 0.75 ↓12.05 0.21 −0.14 ↓163.86 0.11 0.07 ↓34.52 0.06 −0.04 ↓162.99 0.05 −0.19 ↓492.76
Global warming kg CO2 eq 1,243.98 1146.40 ↓7.84 822.67 491.13 ↓40.30 99.28 59.25 ↓40.32 66.07 −299.46 ↓553.26 71.02 −419.61 ↓690.81Ozone layer
depletion kg CFC-11 eq 3.40 × 10⁻⁵ 2.63 × 10⁻⁵ ↓22.61 2.01 × 10⁻⁵ −6.08 × 10⁻⁶ ↓130.28 7.75 × 10⁻⁶ 5.96 × 10⁻⁶ ↓23.11 5.03 × 10⁻⁶ −3.49 × 10⁻⁵ ↓793.79 4.02 × 10⁻⁶ −3.80 × 10⁻⁶ ↓194.54
Human toxicity kg 1.4-DB eq 93.83 69.32 ↓26.13 41.05 −42.24 ↓202.90 20.82 2.08 ↓90.02 13.32 −33.29 ↓350.04 10.64 5.33 ↓49.88Fresh water
aquatic ecotoxicity kg 1.4-DB eq 55.64 41.50 ↓25.41 20.65 −27.38 ↓232.58 12.26 7.38 ↓39.81 7.77 0.68 ↓91.22 6.11 3.80 ↓37.87
Marine aquaticecotoxicity kg 1.4-DB eq 133,965.36 99,913.94 ↓25.42 49,607.83 −66,084.95 ↓233.21 29,476.41 15,618.24 ↓47.01 18,608.93 −1,724.67 ↓109.27 14,609.60 11,948.60 ↓18.21
Terrestrialecotoxicity kg 1.4-DB eq 0.95 0.52 ↓45.26 0.49 −0.98 ↓300.99 0.21 0.00 ↓101.06 0.14 −0.15 ↓208.35 0.12 0.06 ↓53.18
Photochemicaloxidation kg C2H4 eq 2.97 × 10⁻¹ 2.78 × 10⁻¹ ↓6.54 2.97 × 10⁻² −3.64 × 10⁻² ↓222.74 1.79 × 10⁻² 1.32 × 10⁻² ↓26.14 1.43 × 10⁻² −1.70 × 10⁻² ↓219.14 8.97 × 10⁻³ −2.25 × 10⁻² ↓351.28
Notes: 1 The percentage variation is calculated assuming the results related to the scenarios “without AvPr” as 100%.

Sustainability 2017, 9, 827 13 of 18
Comparing the three scenarios with energy recovery (landfill, incineration, biogas), thecharacterisation results (Figure 5) underscore the fact that the lowest environmental loads are related toscenario 2 in all impact categories except for abiotic depletion, global warming and ozone layerdepletion, in which the biogas scenario shows the highest advantages. Specifically, the higherperformance connected with the incineration system is due to the substitution of conventionalelectricity with the energy recovered during the FW treatment, while the potential impacts relatedto the biogas scenario are −2.57 kg Sb eq per FU in abiotic depletion, −299.46 kg CO2 eq per FU inGWP, and −3.57 × 10⁻⁵ kg CFC-11 eq per FU in ozone layer depletion, respectively. The reduction ofthe potential environmental impacts connected with scenario 4 are mainly due to the substitution ofthe electricity conventionally produced from natural gas with the electricity produced through thecombustion of the biogas produced during the FW treatment, which contributes to the reduction of theimpacts by −0.763 kg Sb eq per FU in terms of abiotic depletion, −92.3 kg CO2 eq per FU in terms ofGWP, and 1.01 × 10⁻⁵ kg CFC-11 eq per FU in terms of ozone layer depletion, respectively. Instead,the highest contribution to the impacts is related to the landfill scenario for which the replacement of aconventional energy source with the electricity obtained by the disposal and treatment of FW does notallow a higher reduction of the potential environmental impacts.
Sustainability 2017, 9, 827 13 of 17
Comparing the three scenarios with energy recovery (landfill, incineration, biogas), the characterisation results (Figure 5) underscore the fact that the lowest environmental loads are related to scenario 2 in all impact categories except for abiotic depletion, global warming and ozone layer depletion, in which the biogas scenario shows the highest advantages. Specifically, the higher performance connected with the incineration system is due to the substitution of conventional electricity with the energy recovered during the FW treatment, while the potential impacts related to the biogas scenario are −2.57 kg Sb eq per FU in abiotic depletion, −299.46 kg CO2 eq per FU in GWP, and −3.57 × 10⁻⁵ kg CFC-11 eq per FU in ozone layer depletion, respectively. The reduction of the potential environmental impacts connected with scenario 4 are mainly due to the substitution of the electricity conventionally produced from natural gas with the electricity produced through the combustion of the biogas produced during the FW treatment, which contributes to the reduction of the impacts by −0.763 kg Sb eq per FU in terms of abiotic depletion, −92.3 kg CO2 eq per FU in terms of GWP, and 1.01 × 10⁻⁵ kg CFC-11 eq per FU in terms of ozone layer depletion, respectively. Instead, the highest contribution to the impacts is related to the landfill scenario for which the replacement of a conventional energy source with the electricity obtained by the disposal and treatment of FW does not allow a higher reduction of the potential environmental impacts.
Figure 5. Comparison among the energy-recovery scenarios including the avoided products (characterisation results per 1 tonne of FW to be treated).
The analysis of EU and LU impacts related to scenarios 1, 2 and 4 (Table 6) underscores the fact that the main potential environmental benefits are related to the avoided production of conventional electricity, substituted by the electricity obtained through the incineration of the FW and its packaging, allowing a reduction in EU and LU of 2085.10 MJ and −1.26 m2a, respectively. Environmental benefits are also related to the biogas, considering, in particular, the EU (−1658.47 MJ per FU) impact category, and are mainly due to the replacement of electricity by natural gas with the electricity produced through the combustion of the biogas obtained during the anaerobic digestion process, contributing about 94% to the reduction of the EU impacts. On the contrary, the landfill scenario shows the highest environmental impacts in both EU and LU, when compared with incineration and biogas scenarios.
Table 6. Energy use (EU) and land use (LU) results related to the landfill, incineration and biogas scenarios with the inclusion of the avoided products.
Impact Category Unit Scenario 1 Scenario 2 Scenario 4 Landfill Incineration Biogas
Energy use MJ 5236.21 −2085.10 −1658.47 Land use m2a 2.44 −1.26 −0.14
Figure 5. Comparison among the energy-recovery scenarios including the avoided products(characterisation results per 1 tonne of FW to be treated).
The analysis of EU and LU impacts related to scenarios 1, 2 and 4 (Table 6) underscores the factthat the main potential environmental benefits are related to the avoided production of conventionalelectricity, substituted by the electricity obtained through the incineration of the FW and its packaging,allowing a reduction in EU and LU of 2085.10 MJ and −1.26 m2a, respectively. Environmental benefitsare also related to the biogas, considering, in particular, the EU (−1658.47 MJ per FU) impact category,and are mainly due to the replacement of electricity by natural gas with the electricity producedthrough the combustion of the biogas obtained during the anaerobic digestion process, contributingabout 94% to the reduction of the EU impacts. On the contrary, the landfill scenario shows the highestenvironmental impacts in both EU and LU, when compared with incineration and biogas scenarios.
Sustainability 2017, 9, 827 14 of 18
Table 6. Energy use (EU) and land use (LU) results related to the landfill, incineration and biogasscenarios with the inclusion of the avoided products.
Impact Category UnitScenario 1 Scenario 2 Scenario 4
Landfill Incineration Biogas
Energy use MJ 5236.21 −2085.10 −1658.47Land use m2a 2.44 −1.26 −0.14
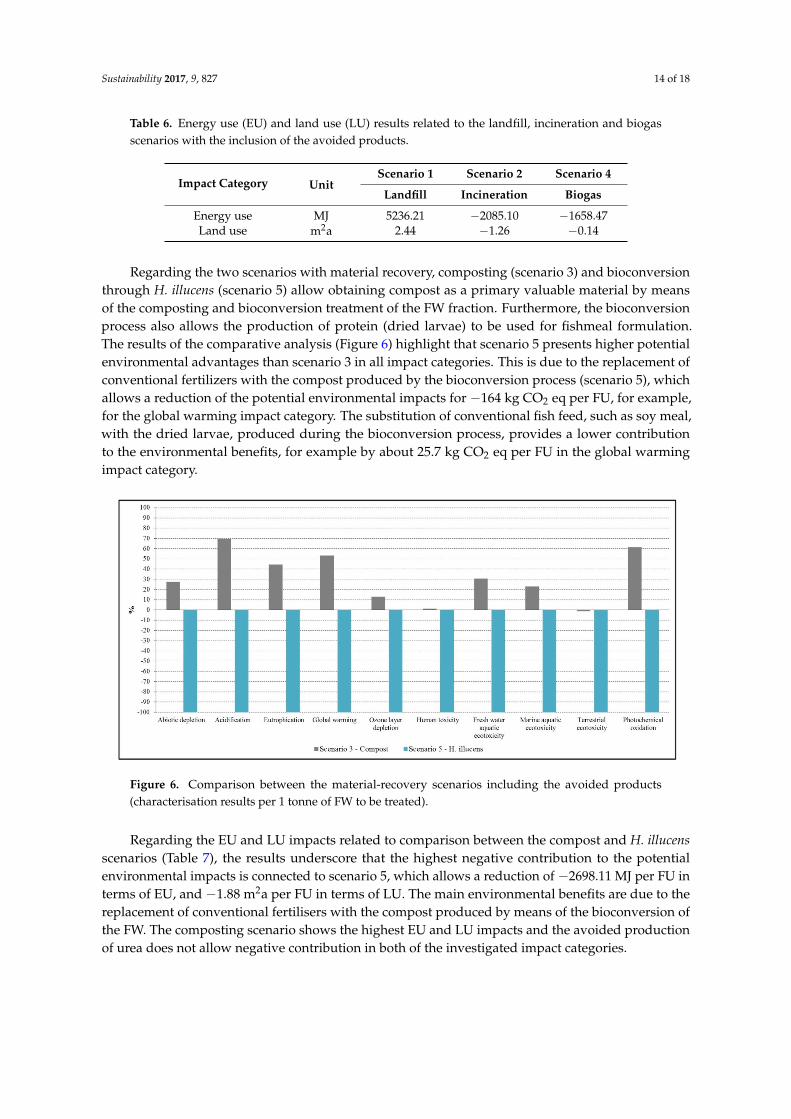
Regarding the two scenarios with material recovery, composting (scenario 3) and bioconversionthrough H. illucens (scenario 5) allow obtaining compost as a primary valuable material by meansof the composting and bioconversion treatment of the FW fraction. Furthermore, the bioconversionprocess also allows the production of protein (dried larvae) to be used for fishmeal formulation.The results of the comparative analysis (Figure 6) highlight that scenario 5 presents higher potentialenvironmental advantages than scenario 3 in all impact categories. This is due to the replacement ofconventional fertilizers with the compost produced by the bioconversion process (scenario 5), whichallows a reduction of the potential environmental impacts for −164 kg CO2 eq per FU, for example,for the global warming impact category. The substitution of conventional fish feed, such as soy meal,with the dried larvae, produced during the bioconversion process, provides a lower contributionto the environmental benefits, for example by about 25.7 kg CO2 eq per FU in the global warmingimpact category.
Sustainability 2017, 9, 827 14 of 17
Regarding the two scenarios with material recovery, composting (scenario 3) and bioconversion through H. illucens (scenario 5) allow obtaining compost as a primary valuable material by means of the composting and bioconversion treatment of the FW fraction. Furthermore, the bioconversion process also allows the production of protein (dried larvae) to be used for fishmeal formulation. The results of the comparative analysis (Figure 6) highlight that scenario 5 presents higher potential environmental advantages than scenario 3 in all impact categories. This is due to the replacement of conventional fertilizers with the compost produced by the bioconversion process (scenario 5), which allows a reduction of the potential environmental impacts for −164 kg CO2 eq per FU, for example, for the global warming impact category. The substitution of conventional fish feed, such as soy meal, with the dried larvae, produced during the bioconversion process, provides a lower contribution to the environmental benefits, for example by about 25.7 kg CO2 eq per FU in the global warming impact category.
Figure 6. Comparison between the material-recovery scenarios including the avoided products (characterisation results per 1 tonne of FW to be treated).
Regarding the EU and LU impacts related to comparison between the compost and H. illucens scenarios (Table 7), the results underscore that the highest negative contribution to the potential environmental impacts is connected to scenario 5, which allows a reduction of −2698.11 MJ per FU in terms of EU, and −1.88 m2a per FU in terms of LU. The main environmental benefits are due to the replacement of conventional fertilisers with the compost produced by means of the bioconversion of the FW. The composting scenario shows the highest EU and LU impacts and the avoided production of urea does not allow negative contribution in both of the investigated impact categories.
Table 7. Energy use (EU) and land use (LU) results related to the composting and H. illucens scenarios with the inclusion of the avoided products.
Impact Category Unit Scenario 3 Scenario 5
Composting H. illucens Energy use MJ 875.24 −2698.11 Land use m2a 0.18 −1.88
Lastly, the avoided production of conventional electricity due to the energy recovery during the incineration of the packaging materials results in the lowest environmental benefits in scenarios 3, 4 and 5, considering all the impact categories. For example, the contribution to the GWP impact is less than 9.5%, in all the scenarios.
Figure 6. Comparison between the material-recovery scenarios including the avoided products(characterisation results per 1 tonne of FW to be treated).
Regarding the EU and LU impacts related to comparison between the compost and H. illucensscenarios (Table 7), the results underscore that the highest negative contribution to the potentialenvironmental impacts is connected to scenario 5, which allows a reduction of −2698.11 MJ per FU interms of EU, and −1.88 m2a per FU in terms of LU. The main environmental benefits are due to thereplacement of conventional fertilisers with the compost produced by means of the bioconversion ofthe FW. The composting scenario shows the highest EU and LU impacts and the avoided productionof urea does not allow negative contribution in both of the investigated impact categories.

Sustainability 2017, 9, 827 15 of 18
Table 7. Energy use (EU) and land use (LU) results related to the composting and H. illucens scenarioswith the inclusion of the avoided products.
Impact Category UnitScenario 3 Scenario 5
Composting H. illucens
Energy use MJ 875.24 −2698.11Land use m2a 0.18 −1.88
Lastly, the avoided production of conventional electricity due to the energy recovery during theincineration of the packaging materials results in the lowest environmental benefits in scenarios 3, 4and 5, considering all the impact categories. For example, the contribution to the GWP impact is lessthan 9.5%, in all the scenarios.
4. Conclusions
The comparison of different scenarios for the disposal or recycling of FW produced by a mass retailcompany operating in Messina (Italy) through the application of LCA method has been performed inorder to propose the most preferable treatment solution in terms of potential environmental impacts.To the authors’ knowledge, this is the first LCA study that compares different FW treatment scenariosat the retail level, including in the system boundaries of the bioconversion process through the action ofH. illucens insects. The results underscore the fact that the main environmental impacts are connectedto the landfill and incineration scenarios, while the best environmental performances are related to theH. illucens scenario in all impact categories, except for GWP in which the anaerobic digestion treatmentshows the lowest environmental impacts. The percentage contribution of the bioconversion treatmentranges from 6.4% in terrestrial ecotoxicity to 2.4% in photochemical oxidation, while the GWP relatedto the biogas scenario is 66.07 kg CO2 eq per FU. Furthermore, the localisation in the same area,at an average distance among all sale points of the MRC, of the unpacking and the recycling/recoveryplants allows an optimisation of the transports during the collection phase. This underscores the factthat the utilisation of an organised transport network can allow higher environmental performance.Including the avoided production of conventional energy sources in the analysis and comparing thescenarios that allowed the production of alternative energy sources (landfill, incineration and biogasscenarios) through the treatment of FW, the incineration scenario showed higher environmental benefitsfollowed by the biogas scenario which presented significant advantages with respect to the abioticdepletion, global warming and ozone layer depletion impact categories. This is in accordance withdifferent authors [29,38], who underscored the higher environmental benefits related to the incinerationtreatment with energy recovery. Results also highlighted that, comparing the scenarios which allowthe production of valuable materials, such as compost (composting and H. illucens scenarios) and feed(H. illucens scenario), the bioconversion process showed higher environmental performances then thecomposting process in all impact categories. This highlights the fact that the treatment of FW throughthe bioconversion process can be an efficient solution.
The results of the study have some limitations connected with the influence of some of theanalysis choices, such as the impact category selected to carry out the analysis or the type of alternativeproducts obtained during the treatment process, accounted as avoided productions. In addition, FWand packaging composition could directly cause changes in the treatment process as well as in theefficiency of the plants, considering, in particular, the landfill and incineration scenarios. Furthermore,although the LCA is a non-site-specific method, the results of an analysis regarding FW treatmentcould change in consideration of a different region where different diet could allow the productionof different FW. In this context, the efficiency of the treatment process can be directly related to thecharacteristic of the FW, such as moisture content or lower heating value. Lastly, this study accountedfor the data from a small number of MRC stores (12) and analysed only five treatment scenarios, thusmore stores and treatment systems should be included in a further analysis.

Sustainability 2017, 9, 827 16 of 18
Anyhow, the results could be efficiently used to identify some best practices that the MRC mayinclude in its sustainable FW management strategy. In addition, since the assumptions are alsorelated to the hypothetical localisation of the treatment plants, further studies should be oriented tothe analysis of the costs related to the installation of the most preferable systems in the mentionedarea, and to transport activities, through the application of the Life Cycle Costing method. Thiswould allow supporting the MRC to achieve two of the three pillars related to the sustainabledevelopment, considering both environmental and economic issues connected to the specific contextof the FW management.
Acknowledgments: Special thanks to Despar Gruppo Fiorino (Fiorino S.r.l.) for providing the authors with dataand information on its mass-retail activities.
Author Contributions: The authors contributed fully and equally to this work. Giovanni Mondello and RobertaSalomone defined the research design and carried out the LCA analysis. Giuseppe Saija, Giuseppe Ioppolo, SergioSparacia and Maria Claudia Lucchetti analysed the sources and literature and carried out a detailed revision.All authors wrote the body of the paper and read and approved the final manuscript.
Conflicts of Interest: The authors declare no conflict of interest.
References
1. Gustavsson, J.; Cederberg, C.; Sonesson, U.; van Otterdijk, R.; Meybeck, A. Global Food Losses and Food Waste:Extent, Causes and Prevention; FAO: Rome, Italy, 2011; ISBN: 978-92-5-107205-9.
2. Stenmarck, Å.; Jensen, C.; Quested, T.; Moates, G.; Buksti, M.; Cseh, B.; Juul, S.; Parry, A.; Politano, A.;Redlingshofer, B.; et al. FUSIONS—Food waste data set for EU-28. New estimates and environmental impact.In European Commission’s Project. Reducing Food Waste through Social Innovation; IVL Swedish EnvironmentalResearch Institute: Stockholm, Sweden, 2016; ISBN: 978-91-88319-01-2.
3. Papargyropoulou, E.; Lozano, R.; Steinberger, J.K.; Wright, N.; Ujang, Z. Bin The food waste hierarchyas a framework for the management of food surplus and food waste. J. Clean. Prod. 2014, 76, 106–115.[CrossRef]
4. Salomone, R.; Saija, G.; Mondello, G.; Giannetto, A.; Fasulo, S.; Savastano, D. Environmental impact of foodwaste bioconversion by insects: Application of life cycle assessment to process using Hermetia illucens.J. Clean. Prod. 2017, 140, 890–905. [CrossRef]
5. Porter, S.D.; Reay, D.S.; Higgins, P.; Bomberg, E. A half-century of production-phase greenhouse gasemissions from food loss & waste in the global food supply chain. Sci. Total Environ. 2016, 571, 721–729.[CrossRef] [PubMed]
6. European Commission. Preparatory Study on Food Waste across EU 27; European Commission: Brussels,Belgium, 2010; Volume 33, ISBN: 978-92-79-22138-5.
7. European Parliament. Directive 2008/98/EC of the European Parliament and the Council of 19 November2008 on Waste and Repealing Certain Directives. Available online: http://eur-lex.europa.eu/legal-content/EN/ALL/?uri=CELEX:32008L0098 (accessed on 17 January 2017).
8. Zaman, A.U. Identification of key assessment indicators of the zero waste management systems. Ecol. Indic.2014, 36, 682–693. [CrossRef]
9. Notarnicola, B.; Salomone, R.; Petti, L.; Renzulli, P.A.; Cerutti, A.K.; Roma, R. Life Cycle Assessment in theAgri-Food Sector: Case Studies, Methodological Issues and Best Practices; Springer: Cham, Switzerland, 2015;ISBN: 978-3-319-11940-3.
10. European Union. Combating Food Waste: an Opportunity for the EU to Improve the Resource-Efficiency of the FoodSupply Chain; Special Report No 34 (EN); European Court of Auditors (ECA)—European Union: Luxembourg,2016; ISBN: 978-92-872-6416-9.
11. Brancoli, P.; Rousta, K.; Bolton, K. Life cycle assessment of supermarket food waste. Resour. Conserv. Recycl.2017, 118, 39–46. [CrossRef]
12. Notarnicola, B.; Serenella, S.; Assumpció, A.; McLarend, S.J.; Saouterb, E.; Sonesson, U. The role of life cycleassessment in supporting sustainable agri-food systems: A review of the challenges. J. Clean. Prod. 2017, 140,399–409. [CrossRef]
Sustainability 2017, 9, 827 17 of 18
13. Schott, A.B.S.; Wenzel, H.; la Cour Jansen, J. Identification of decisive factors for greenhouse gas emissions incomparative life cycle assessments of food waste management—An analytical review. J. Clean. Prod. 2016,119, 13–24. [CrossRef]
14. Carlsson, M.; Naroznova, I.; Møller, J.; Scheutz, C.; Lagerkvist, A. Importance of food waste pre-treatmentefficiency for global warming potential in life cycle assessment of anaerobic digestion systems. Resour. Conserv.Recycl. 2015, 102, 58–66. [CrossRef]
15. Kondusamy, D.; Kalamdhad, A.S.; Kondusamy, D.; Kalamdhad, A.S. Pre-treatment and anaerobic digestionof food waste for high rate methane production—A review. J. Environ. Chem. Eng. 2014, 2, 1821–1830.[CrossRef]
16. Caputo, P.; Ducoli, C.; Clementi, M. Strategies and tools for eco-efficient local food supply scenarios.Sustainability 2014, 6, 631–651. [CrossRef]
17. Bernstad, A.; la Cour Jansen, J. Review of comparative LCAs of food waste management systems—Currentstatus and potential improvements. Waste Manag. 2012, 32, 2439–2455. [CrossRef] [PubMed]
18. Naroznova, I.; Møller, J.; Scheutz, C. Global warming potential of material fractions occurring insource-separated organic household waste treated by anaerobic digestion or incineration under differentframework conditions. Waste Manag. 2016, 58, 397–407. [CrossRef] [PubMed]
19. Bernstad, A.; la Cour Jansen, J. A life cycle approach to the management of household food waste—ASwedish full-scale case study. Waste Manag. 2011, 31, 1879–1896. [CrossRef] [PubMed]
20. Scholz, K.; Eriksson, M.; Strid, I. Carbon footprint of supermarket food waste. Resour. Conserv. Recycl. 2015,94, 56–65. [CrossRef]
21. Eriksson, M.; Spångberg, J. Carbon footprint and energy use of food waste management options for freshfruit and vegetables from supermarkets. Waste Manag. 2017, 60, 786–799. [CrossRef] [PubMed]
22. Eriksson, M.; Strid, I.; Hansson, P.A. Carbon footprint of food waste management options in the wastehierarchy—A Swedish case study. J. Clean. Prod. 2015, 93, 115–125. [CrossRef]
23. Guinée, J.B. Handbook on life cycle assessment, operational guide to the ISO standards. Int. J. Life CycleAssess. 2002, 7, 311–313. [CrossRef]
24. International Organisation for Standardisation (ISO). ISO 14040:2006. Environmental Management—Life CycleAssessment—Principles and Framework; International Standards Organisation: Geneva, Switzerland, 2006.
25. International Organisation for Standardisation (ISO). ISO 14044:2006. Environmental Management—Life CycleAssessment—Requirements and Guidelines; International Standards Organisation: Geneva, Switzerland, 2006.
26. San Martin, D.; Ramos, S.; Zufía, J. Valorisation of food waste to produce new raw materials for animal feed.Food Chem. 2016, 198, 68–74. [CrossRef] [PubMed]
27. Ahamed, A.; Yin, K.; Ng, B.J.H.; Ren, F.; Chang, V.W.C.; Wang, J.Y. Life cycle assessment of the present andproposed food waste management technologies from environmental and economic impact perspectives.J. Clean. Prod. 2016, 131, 607–614. [CrossRef]
28. Atritor. Available online: http://www.turboseparator.co.uk/ (accessed on 10 January 2017).29. Mendes, M.R.; Aramaki, T.; Hanaki, K. Comparison of the environmental impact of incineration and
landfilling in São Paulo City as determined by LCA. Resour. Conserv. Recycl. 2004, 41, 47–63. [CrossRef]30. Righi, S.; Oliviero, L.; Pedrini, M.; Buscaroli, A.; Della Casa, C. Life cycle assessment of management systems
for sewage sludge and food waste: Centralized and decentralized approaches. J. Clean. Prod. 2013, 44, 8–17.[CrossRef]
31. Ecoinven Centre. Ecoinvent Data v2.0 Final Reports Ecoinvent; Swiss Centre for Life Cycle Inventories:Dübendorf, Switzerland, 2007.
32. Nielsen, P.H.; Nielsen, A.M.; Weidema, B.P.; Dalgaard, R.; Halberg, N. LCA Food Database. 2003. Availableonline: www.lcafood.dk (accessed on 17 January 2017).
33. PRè Consultant. Simapro 8; PRè Consultant: Amersfoort, The Netherlands, 2010.34. CML. CML 2 Baseline 2000; Centre of Environmental Science: New Delhi, India, 2000.35. Verein Deutscher Ingenieure (VDI) Cumulative energy demand terms, definitions, methods of calculation.
In VDI-Richtlinien 4600; Verein Deutscher Ingenieure: Düsseldorf, Germany, 1997.36. Frischknecht, R.; Jungbluth, N.; Althaus, H.J.; Bauer, C.; Doka, G.; Dones, R.; Hischier, R.; Hellweg, S.;
Humbert, S.; Köllner, T.; et al. Implementation of Life Cycle Impact Assessment Methods; Final Report Ecoinvent2000 No. 3; Swiss Centre for Life Cycle Inventories: Dübendorf, Switzerland, 2007.

Sustainability 2017, 9, 827 18 of 18
37. Guinée, J.B.; Gorée, M.; Heijungs, R.; Huppes, G.; Kleijn, R.; de Koning, A.; van Oers, L.; WegenerSleeswijk, A.; Suh, S.; de Haes, H.A.U.; et al. Life Cycle Assessment: An Operational Guide to the ISO Standards:Characterization and Normalization; Ministry of Housing, Spatial Planning and the Environment and Centre ofEnvironmental Science: Leiden, The Netherlands, 2001.
38. Arena, U.; Mastellone, M.L.; Perugini, F. The environmental performance of alternative solid wastemanagement options: A life cycle assessment study. Chem. Eng. J. 2003, 96, 207–222. [CrossRef]
© 2017 by the authors. Licensee MDPI, Basel, Switzerland. This article is an open accessarticle distributed under the terms and conditions of the Creative Commons Attribution(CC BY) license (http://creativecommons.org/licenses/by/4.0/).