comparative investment analysis for … investment analysis for small scale broiler and layer...
TRANSCRIPT

COMPARATIVE INVESTMENT ANALYSIS FOR SMALL SCALE
BROILER AND LAYER ENTERPRISES IN ZAMBIA
by
SOSTHENES MWANSA
B.S., University of Zambia, 2010
A THESIS
Submitted in partial fulfillment of the requirements
for the degree
MASTER OF AGRIBUSINESS
Department of Agricultural Economics
College of Agriculture
KANSAS STATE UNIVERSITY
Manhattan, Kansas
2013
Approved by:
Major Professor
Dr. Allen M. Featherstone
ABSTRACT
Small scale broiler and layer production constitutes a significant part of the poultry
industry in Zambia. However, the contribution of small scale enterprises to broiler
production is more pronounced than layers with statistics showing 60 and 30 percent for
broilers and layers, respectively. This study was carried out for the purpose of determining
the economic profitability of both broiler and layer enterprises and also to evaluate their
degree of attractiveness for investment. The thesis used the Net Present Value and Internal
Rate of Return methods to determine the economic profitability for both broiler and layer
enterprises. The data used in the analyses were obtained direct from the market and
additional data were extracted from the Cost of Doing Business Manual 2012, a publication
of the Zambian Development Agency. Additionally, the study used a capital investment of
US $50,000 for each enterprise, 25 percent opportunity cost of capital and an economic life
of five years.
The data were used in estimating the enterprise budgets for both broiler and layer
enterprises from which income statements were generated. The enterprise budget for
broiler production estimated revenue from the sale of live broiler chickens at a wholesale
price while the layer enterprise budget estimated its revenue from the sale of eggs and
culled hens. The sale prices used were US $5 per broiler chicken, US $3.60 per tray of eggs
and US $2 per culled hen as obtaining on the market at the time. In addition, production
was estimated at 60,000 broilers and 30,000 trays of eggs from 3,000 layers annually.
The cost of constructing brooder houses and purchase of production equipment
were the major cost components for the two enterprise budget estimates. The estimates

indicated that these two cost components amounted to US$27,090 and US$21,095 for
boiler and layer enterprises respectively. The other cost component was production cost
and it includes the cost of labor, feed, day old chicks, marketing, vaccines, transportation,
electricity, debeakers, heaters, stationery, etc. The cost of feed constituted about 65 percent
of total production cost for layer enterprises and about 60 percent for broiler enterprises.
The total production cost as a percentage of revenue was estimated at 80 percent and 70
percent for broiler and layer enterprises, respectively.
The analyses were completed under three alternative scenarios that included
optimistic, expected and pessimistic scenarios. The analyses across all scenarios show that
both broiler and layer enterprises are economically viable for investment though the broiler
enterprise is more economically profitable than the layer enterprise. They both show
positive NPVs and IRRs in excess of the 25 percent opportunity cost of capital used in the
analysis. The analysis for broiler enterprise showed a NPV of US $178,242 for the
optimistic scenario, US $122,742 for the expected scenario and US $30,550 for the
pessimistic scenario. Results obtained from layer enterprise analysis showed NPVs of US
$72,388, US $49,260 and US $11,186 for the optimistic, expected and pessimistic
scenarios, respectively. Consistent with the decision rules of the NPV and IRR methods,
both enterprises were found to be economically viable for investment. On a comparative
basis though, the small scale broiler enterprise was found to be more attractive for
investment than the small scale layer enterprise as indicated by the results of the NPVs and
IRRs. The lucrative nature of the broiler enterprise and easy of management could be used

as possible explanation to the current investment trends seen in the Zambian poultry
industry.

v
TABLE OF CONTENTS
List of Figures ......................................................................................................................... vi List of Tables ......................................................................................................................... vii Acknowledgments ................................................................................................................ viii CHAPTER ONE: INTRODUCTION .................................................................................. 1
1.1 Problem Statement ....................................................................................................... 3
1.2 Objectives ..................................................................................................................... 4
1.3 Rationale ....................................................................................................................... 4
CHAPTER TWO: OVERVIEW OF THE POULTRY INDUSTRY IN ZAMBIA ....... 6 2.1: Economic Performance and Policy Environment ...................................................... 7
2.2 Production of Day Old Chicks ................................................................................... 10
2.3 Broiler Production ...................................................................................................... 11
2.4 Layer Production ........................................................................................................ 14
2.5 Poultry Stock Feed Industry ....................................................................................... 16
2.6 Marketing of Poultry Products ................................................................................... 17
CHAPTER THREE: LITERATURE REVIEW .............................................................. 20 CHAPTER FOUR: CONCEPTUAL MODEL ................................................................ 24
4.1 Payback Period (PP) ................................................................................................... 24
4.2 Net Present Value (NPV) ........................................................................................... 25
4.3 Internal Rate of Return (IRR) .................................................................................... 27
4.4 Scenario Analysis ....................................................................................................... 28
CHAPTER FIVE: METHODS ........................................................................................... 29 5.1 Assumptions ............................................................................................................... 30
5.2 Procedure .................................................................................................................... 31
5.3 Cost and Production Estimates .................................................................................. 32
5.4 Scenario Analysis ....................................................................................................... 37
CHAPTER SIX: ANALYSIS .............................................................................................. 40 CHAPTER SEVEN: CONCLUSION ................................................................................ 48 REFERENCES ..................................................................................................................... 52

vi
LIST OF FIGURES
Figure 2.1: Production Trends of Broiler Meat and Eggs from 1980 - 2010. ................. 6 Figure 2.2: Trends in Zambia’s Real Per Capita GDP, 2000-2011 .................................. 9

vii
LIST OF TABLES
Table 2.1: Selected Macroeconomic Performance Indicators, 2005-2011 ....................... 8 Table 2.2: Average Environmental Requirements for Broiler Production ................... 12 Table 2.3: General Recommendation for Drinkers and Feeders for 1000 Birds ......... 13 Table 2.4: Quantity, Type of Feed and Duration to Feed Broilers ................................. 14 Table 2.5: Type and Amount of Feed Fed to Birds at a Given Age ............................... 16 Table 3.1: Feed Manufacturers, Breeders and Processors in Zambia .......................... 21 Table 5.1: Major Production Equipment Needed for Broiler and Layer Production . 33 Table 5.2: Cost of Key Production Inputs in Broiler and Layer Production ................ 34 Table 5.3: Budget Estimate for Production of 60,000 Broilers per Year ...................... 35 Table 5.4: Budget Estimate for Production of 30,000 Trays of Eggs ............................. 36 Table 5.5: Summary of Assumptions made for Optimistic, Expected and Pessimistic Scenarios ................................................................................................................................ 39 Table 6.1: Discounted Payback Periods for Broiler and Layer Enterprises ................. 40 Table 6.2: Net Present Value for Broiler Enterprise for a Period of 5 Years ............... 41 Table 6.3: Net Present Value for Layer Enterprise for a Period of 5 Years ................. 42 Table 6.4: NPV and IRR for Optimistic, Expected and Pessimistic Scenarios ............. 43
viii
ACKNOWLEDGMENTS
The author wishes to unreservedly thank Dr. Allen M. Featherstone for the
professional guidance and support that he rendered during the course of the study.
Gratitude is also extended to all the MAB staff for their unwavering support during and
after the MAB course sessions from which the author drew the necessary knowledge and
expertise that was used in conducting this research successfully.
The author would like also to pay special tribute to Dr. Vincent Amanor-Boadu,
PVCI-Zambia project Director for the PVCI scholarship that provided financial and
material support towards this study and the MAB programme in general. Furthermore, the
author wishes to extent appreciation to Dr. Gelson Tembo and colleagues from both
Zambia and overseas for their contribution during the MAB programme and specifically
during the preparation of this professional thesis.
Finally, the author wishes to thank his family for the understanding, patience and
encouragement rendered during the course of the MAB programme. To my wife Judith A.
Mwansa, I dearly thank you for providing me with unshaken emotional support during my
MAB programme.
1
CHAPTER ONE: INTRODUCTION
The poultry industry is a well recognised sector of the Zambian economy. It
currently contributes 4.8 percent to agriculture gross domestic product (GDP) and 48
percent to the livestock sector. Poultry provides a major income-generating activity from
the sale of eggs, broiler meat and culled hens for many small scale farm enterprises. It also
provides gainful employment for many semi-skilled and skilled labour forces. Ngosa
(2012) states that, “the poultry sector in Zambia generates direct and indirect income and
employment for about 80,000 people, 50,000 of which are permanent and 30,000 seasonal
jobs”. The industry is dominated by hybrid chicken species that provide quality meat in the
case of broiler strains and eggs for layers. Poultry meat continues to be the primary meat
consumed in Zambia accounting for an estimated 50 percent of total meat consumption
followed by beef at 28 percent; together pork and fish account for 16 percent, and others at
6 percent (Ngosa 2012).
Broiler production is widespread and encompasses both small and large scale
producers. Small scale producers dominate broiler production while large scale producers
dominate egg production. The total production of broiler meat for 2011 was 72,000 tonnes
of which the main product was the whole chicken, frozen or cooled, with growing
segments of cuts and industrialized chicken. In 2007, small scale producers were estimated
at slightly above 50 percent of the total broilers produced. The proportion increased to 60
percent in 2012, according to statistical estimates released by the Poultry Association of
Zambia (PAZ, 2012). Furthermore, the production of broilers is tightly concentrated
around the capital Lusaka, the Copperbelt province and other main towns, providing an
opportunity for producers to take advantage of the major cities and towns’ high table

2
chicken consumption rates due to the high population densities and high disposable income
in these areas (Mukabalai Ndiyoi 2008).
Egg production currently stands at 1.45 million eggs per day or 43.5 million eggs
per month translating into a consumption of 3.38 eggs per person per month or 41 eggs per
capita consumption (Ngosa 2012). Unlike the broiler subsector, egg production is
dominated by large scale producers that represent 70 percent of the total egg production.
The poultry industry has showed continued stronger growth than other industries in
the livestock sector. The future outlook is still very attractive. Currently, the industry is
growing at 25 percent for layers and 30 percent for broilers annually according to the
Poultry Association of Zambia. This growth has been influenced by both demand-side and
supply-side factors. Demand-side factors include increased human population, increased
disposable income from the emerging middle class and urbanization. Supply-side factors
also contribute significantly to growth due to factors such as advances in breeding that has
given rise to birds that meet specialized purposes and are increasingly productive though
they require expert management. The development and transfer of improved feed, slaughter
and processing technologies also have increased safety and efficiency though they favor
large scale units rather than small scale producers. The industry has developed capacity for
the production of quality feed, improved hybrid day old chicks as well as processing
capacity that encourages contract farming.
This thesis was completed to determine the economic profitability of small scale
broiler and layer enterprises. It further aimed at determining their degree of attractiveness
for investment. It also wanted to provide possible explanations to the investment trends that
are observed among small scale enterprises in the poultry industry.

3
1.1 Problem Statement
Investment in the poultry industry has been largely driven by the private sector both
domestic and foreign. Investment by small scale enterprises in the poultry industry has
focused largely on small scale commercial production with little or no value addition.
However, large enterprises are becoming more vertically integrated. Since the time of
economic liberalization of Zambia, there has been more investment in broiler production by
small scale enterprises compared to investment in layers. Statistics indicate that small scale
enterprises constitute 60 percent of broiler producers and 30 percent layers. However, it is
difficult to tell whether investment in either small scale broiler or layer production is
economically viable as there has not been any documented study to examine this.
Furthermore, no good explanation has been provided as to why more small scale
entrepreneurs invest in broiler production than in layers. It is also not clear as to which of
the two enterprises is more profitable at a small scale level.
From the investment point of view and in the context of a small scale enterprise,
this study focuses on answering the major question of how attractive is the small scale
broiler or layer enterprise for investment? Specific questions that are to be answered in this
thesis include:
1. Is investment in either small scale broiler or layer production economically viable?
2. If so, how comparable are their economic profitability?
3. Does economic profitability explain the investment patterns observed among small
scale poultry enterprises?
4
1.2 Objectives
The purpose of this thesis is to determine the economic profitability of both broiler
and layer production and also their degree of attractiveness for small scale investment. The
thesis also sought to understand whether the investment pattern in the two enterprises is
influenced by economic profitability.
The study investigated and analysed the two enterprises based on a small scale
enterprise definition provided by the Zambian Development Agency (ZDA). According to
the ZDA, “small scale enterprise shall be any business enterprise registered with the
Registrar of Companies whose total investment excluding land and buildings is between
US$30,000 and US$50,000”. However, for the purpose of this study, US$50,000 initial
investment was used for the analysis.
1.3 Rationale
The present business environment is very dynamic and requires making rational
investment decisions. It is important to note that every investor has the opportunity or
option but not the obligation to invest in a particular project of a particular industry at a
given time for a particular period of time. Because of the limited reversibility of investment
projects, it is important to consider many business opportunities and all associated risks
before making a final investment decision. The investment appraisal is the starting point in
determining the worthiness of a prospective project. The profitability of any kind of
investment in any industry is the return earned on the investment. The economic
profitability of each enterprise is used to determine the attractiveness of the enterprises. The
more economically profitable a project is, the more attractive it is for investment and vice
versa.

5
Net Present Value (NPV) and the Internal Rate of Return (IRR) were used to
determine the economic profitability of each enterprise mentioned. Microsoft Excel 2007
was used for all calculations related to the analysis.
The unit of measure used in this study is the US Dollar (US$) with the conversion
to Zambian Kwacha (ZMW) quoted at an exchange rate of KR5 to US $1 as reflected in
the Cost of Doing Business in Zambia (ZDA 2012).
Chapter 2 of the thesis discusses general overview of the poultry industry in
Zambia. Chapter 3 reviews the literature related to the poultry industry and investment.
Chapter 4 discusses the conceptual model of the study. The methodology used in the
analysis is presented in chapter 5. The results/findings are presented and discussed in
chapter 6 and chapter 7 presents conclusions and recommendations.

6
CHAPTER TWO: OVERVIEW OF THE POULTRY INDUSTRY IN ZAMBIA
The poultry industry consists of three distinctly separate branches, namely the day
old chicken supply, the layer and the broiler. The broiler industry is defined as all the
processes and actions revolving around the production, processing, marketing and
consumption of chicken meat, while broilers are defined as meat-type chicken strains that
are raised specifically for the production of meat (Ndiyoi, et al. 2007). In addition, the
layer industry involves all processes and actions revolving around the production,
processing, marketing and consumption of eggs and culled hens, while layers are chicken
strains that are specifically raised for the production of eggs (Ndiyoi, et al. 2007).
Production of poultry products in Zambia has been increasing since 1990s. Figure 1.1
shows production trends of broiler meat and eggs from 1980 to 2010.
Figure 2.1: Production Trends of Broiler Meat and Eggs from 1980 - 2010.
Source: FAO-Production Statistics
0
10
20
30
40
50
60
1980 1990 2000 2010
Qu
anti
ty p
rod
uce
d (
1000
ton
es)
Year
Broilers Eggs

7
Of the slightly more than 13 million people in Zambia, the majority are involved in
agriculture and agricultural related businesses. In 2000 for instance, it was estimated that
60 percent of the country’s population were involved in agricultural activities, of which
97.4 percent were involved in crop production while 67 percent were involved in poultry,
and while 29 percent were in livestock (Ndiyoi, et al. 2007). The poultry industry is an
important industry in the country and provides food, a source of income and is vital in job
creation. Poultry provides a major income-generating activity from the sale of eggs and
chicken meat. It provides gainful employment for many semi-skilled to skilled laborers.
According to Ngosa (2012), “the poultry sector generates direct and indirect income and
employment for about 80,000 people, 50,000 of which are permanent and 30,000 seasonal
jobs”. The poultry industry in Zambia can be regarded as dualistic, in that it involves both
small and large commercial producers each targeting a specific market segment. More than
60 percent of broiler meat is produced by small broiler enterprises compared to 30 percent
for egg production.
2.1: Economic Performance and Policy Environment
The growth of the poultry industry in Zambia can be attributed to many factors and
it is undeniable that the freeing of the Zambian economy from government control in 1993
as well as the good macroeconomic performance that the country has recorded in the recent
past has contributed to the growth and development of the poultry industry. Zambia’s
economic performance in the recent years has been positive with real Gross Domestic
Product (GDP) growth rising to 6.8 percent in 2011 from 5.3 percent in 2005. This was the
sixth year in a row in which the economy grew above 5 percent. The strong economic
performance the country has recorded is as a result of increased output in mining and

8
quarrying, construction, and agriculture. Table 2.1 shows selected macroeconomic
performance indicators for the country between 2005 and 2011.
Table 2.1: Selected Macroeconomic Performance Indicators, 2005-2011
2005 2006 2007 2008 2009 2010 2011 Real GDP growth (end-year %) 5.3 6.2 6.2 5.7 6.4 7.6 6.8 GDP per capita (end-year US $) 650 908 949 1,170 1,050 1,200 1,463 Annual Inflation end-period (%) 15.9 8.2 8.9 16.6 9.9 7.9 7.2
Source: ZDA, Investor Guide Handbook
Zambia has made many reforms in the economic sector that are aimed at promoting
private sector participation in the economic development of the country. Being a multi-
party democracy, the country has pursued a market-oriented liberalized economy with
investment laws that provide incentives for investment made in priority sectors of the
economy. These laws are aimed at increasing levels of foreign direct investment (FDIs),
domestic investment, increased international trade as well as increased domestic economic
growth. Furthermore, the government has abolished controls on prices, interest rates,
foreign exchange rates and provides free repatriation of debt repayment and offers 100
percent repatriation of profit. In addition, the government offers guarantees and security to
investors with legislated rights to full and market value compensation. For new businesses,
the government has provided for tax exemption for a duration of between three and five
years depending on the nature and amount of investment. Zambia, being a member of
regional bodies such as SADC and COMESA, offers duty free market access to more than
400 million people in the region.
The country has also seen a sustained increase in the real per capita income from
US $332 in 2000 to US $1,463 in 2011. The increase in the per capita income is a clear

9
indication of the country’s economic performance that has resulted in increased disposable
income for many Zambians. Figure 2.1 illustrates the trends in Zambia’s real per capita
GDP from 2000 to 2011.
Figure 2.2: Trends in Zambia’s Real Per Capita GDP, 2000-2011
Source: ZDA Investor Guide Handbook
Domestic policies such as market liberalization, regional integration and foreign
direct investment (FDI) have brought private companies and corporations into the supply
chains of most agricultural products. The arrival of large firms, especially in food retail and
processing, has been accompanied by increased concentration of the processing and retail
sectors of the food chain. The entry of supermarkets in the Zambian economy has been due
to the environment the government has created for FDIs and has significantly opened up
opportunities for large scale producers of poultry products. However, while the increased
involvement of supermarkets has opened up opportunities for local large scale farmers and
0
200
400
600
800
1000
1200
1400
1600
2000 2001 2002 2003 2004 2005 2006 2007 2008 2009 2010 2011
332 362 364 404490
654
902949
1174
1058
1237
1463
Rea
l GD
P p
er c
apit
a

10
processors, stringent quality and consistent supply requirements tend to exclude many
small-scale producers from participating in the modern supply channels.
Unlike crops, the poultry industry has seen little government intervention that
distorts market prices allowing market forces to drive the industry. The National
Agricultural Policy (NAP) stipulates the role of the government in the poultry industry and
this is to create an enabling environment for active private sector participation in the
improvement of the productive efficiency of the livestock sector in a sustainable manner
and support the marketing of both livestock and livestock products and contribute to food
security and income. The policy sets specific roles of government such as to promote,
facilitate and enhance the participation of the private sector in production, processing and
marketing of quality livestock products. However, the Minister of Agriculture and
Livestock has the power to impose import or export bans whenever deemed necessary for
the benefit of domestic producers and consumers. The poultry industry has been cited as an
infant industry in Zambia, hence, protectionist tendencies have been advanced by major
stakeholders that have seen the government impose a ban on importation of poultry
products such as broiler meat and table eggs.
2.2 Production of Day Old Chicks
Increased investment in the poultry industry has resulted in increased numbers of
hatcheries from two hatcheries before economic liberalization to eight major breeding and
hatching facilities with state of the art technology. There has been expansion in the breeder
sector with hatcheries increasing in capacity and in numbers. The hatcheries include:
Hybrid Poultry Farm (Z) Ltd, Ross Breeders Zambia, Bokomo Zambia, Progressive
11
Poultry (Tiger Chicks), Zambian Poultry Breeders, Panda Hill Hatchery, Chipata
Hatcheries and Chick Masters.
The increased investment in infrastructure and capacity has led to a significant
increase in the production of day old chicks, which has increased to an annual production
of 51 million day-old broiler chicks. For layers, the day-old chicks are supplied mainly by
Hybrid Poultry Farm and Bokomo. In addition, approximately 10% of the chicks for layers
are imported. The largest consumer of imported day old layer pullets is Golden Lay Farm.
Pullet chicks are usually imported if the order is larger than the local hatcheries are able to
hatch at that particular time.
2.3 Broiler Production
Broiler production is more widespread in Zambia and encompasses both small and
large commercial producers. More than 60 percent of broiler production involves small
scale producers. Broiler production is tightly concentrated around the capital Lusaka, the
Copperbelt province and other main towns, providing an opportunity for producers to take
advantage of the major cities and towns’ high table chicken consumption rates driven by
these areas’ high population densities and high disposable incomes.
Broiler production has increased to 51 million birds, providing more than 72,000
tons of table chicken meat annually. Private investment in processing facilities has resulted
in the establishment of four major broiler processors namely: Crest Chicken, Eureka
Chicken, Verino Country Choice Chickens and Zamchick. Since the processing plants are
located in Lusaka, with only one in the Central province, most producers are situated close
to these locations. Of the total number of broilers produced annually, approximately 65
percent of these are sold dressed, while the live bird market (dominated by small scale

12
producers) accounts for 35 percent (Ndiyoi, et al. 2007). According to PAZ, in 2012 the
amount of broilers processed per week through the processors within the industry were
around 700,000 broilers per week compared to the volume of production in 2009 that was
around 200,000 broilers per week. The increased demand for dressed chicken has been
attributed to the increase in demand for quality and safety, but is also due to shortage and
the high price of beef on the domestic market.
Broiler production for small scale commercial enterprises is mainly done
intensively in a deep litter system where birds are fully confined. In this production system,
the floor is covered with a deep litter of about 5 to 10 cm of wood shavings or a similarly
absorbent material. This means that the birds are provided with all their requirements such
as food, water, light and care. The primary aim of a broiler house is therefore not to keep
the birds in a confined area, but to create an environment that allows the broiler to achieve
its genetic potential in the most economical manner possible. Most of the housing units for
broilers are naturally ventilated hence orientation of the structure is important. The
recommended environmental requirements inside the house are as indicated in the table
below.
Table 2.2: Average Environmental Requirements for Broiler Production
Age Temperature (Degree Celsius)
Humidity (% RH)
Ventilation (m3/h/bird)
Light Intensity (watts/20m2)
Week 1 31-28 35-70 0.1-0.3 40–60
Week 2 28-25 35-70 0.3-0.6 40–60
Week 3 25-21 36-70 0.6-0.8 15
Week 4 21 36-70 0.8-1.0 15
Week 5 21 37-70 1.3-10 15
Week 6 21 37-70 1.7-14 15 Source: Livestock Services Cooperative Society

13
The management of the flock is one of the most important aspects in broiler
production. This starts as soon as the chicks are bought and placed into the brooder room.
It is important that adequate water, heat and feeders are provided for birds at all stages of
development. The table below shows the recommended number of drinkers and feeders for
1000 birds.
Table 2.3: General Recommendation for Drinkers and Feeders for 1000 Birds Number and type of equipment
Age Days Chick Fonts Automatic Drinkers Scratch Trays Tube Feeders
1 10 - 15 - 4 10 3 15 4 7 5 5 10 15 11 - 7 5 18 14 - 8 - 20 18 - 9 - 25 21 - 10 - 30 8 weeks - 11 - 30 20 weeks + - 12 - 30
Source: Livestock Services Cooperative Society
Feed is indispensable in the production process and requires proper attention.
Different types of feed are made for a particular stage of broiler development. The notable
types include starter, grower and finisher. The feed is provided through feeding troughs or
tubes. Optimal output requires that sufficient feed is provided to birds at every stage of
their development. This is done to avoid waste and requires a strict feeding regime as
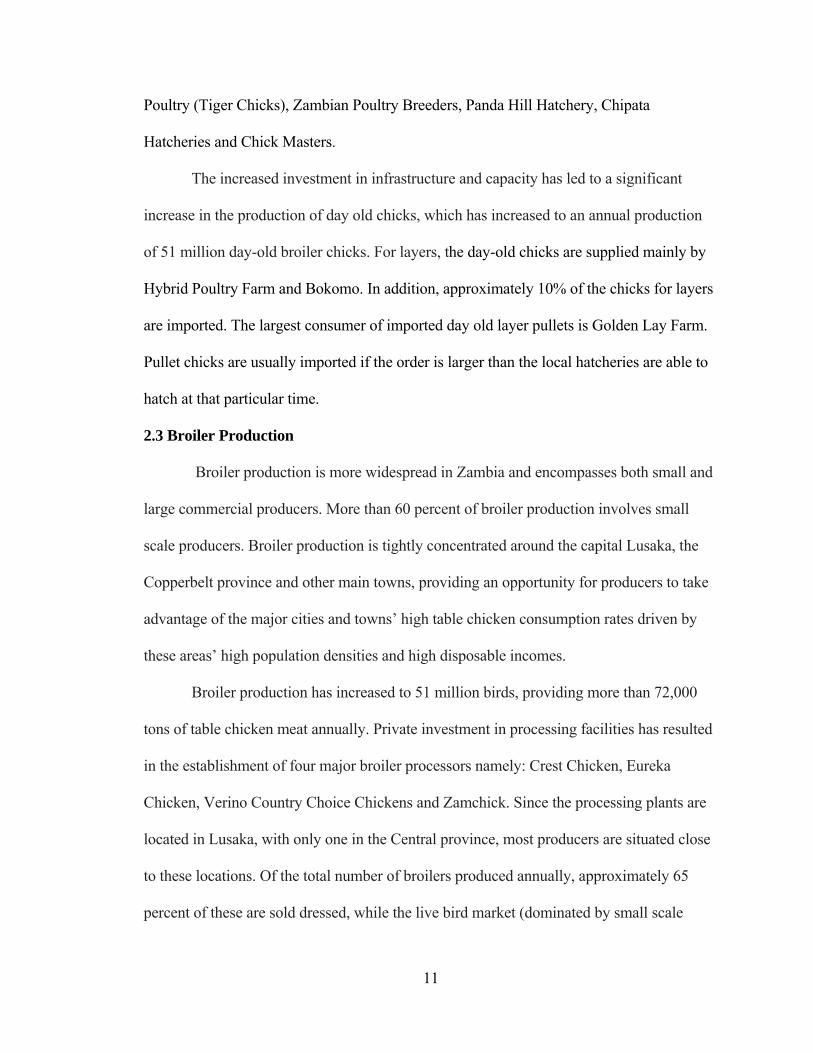
shown in table 2.4.
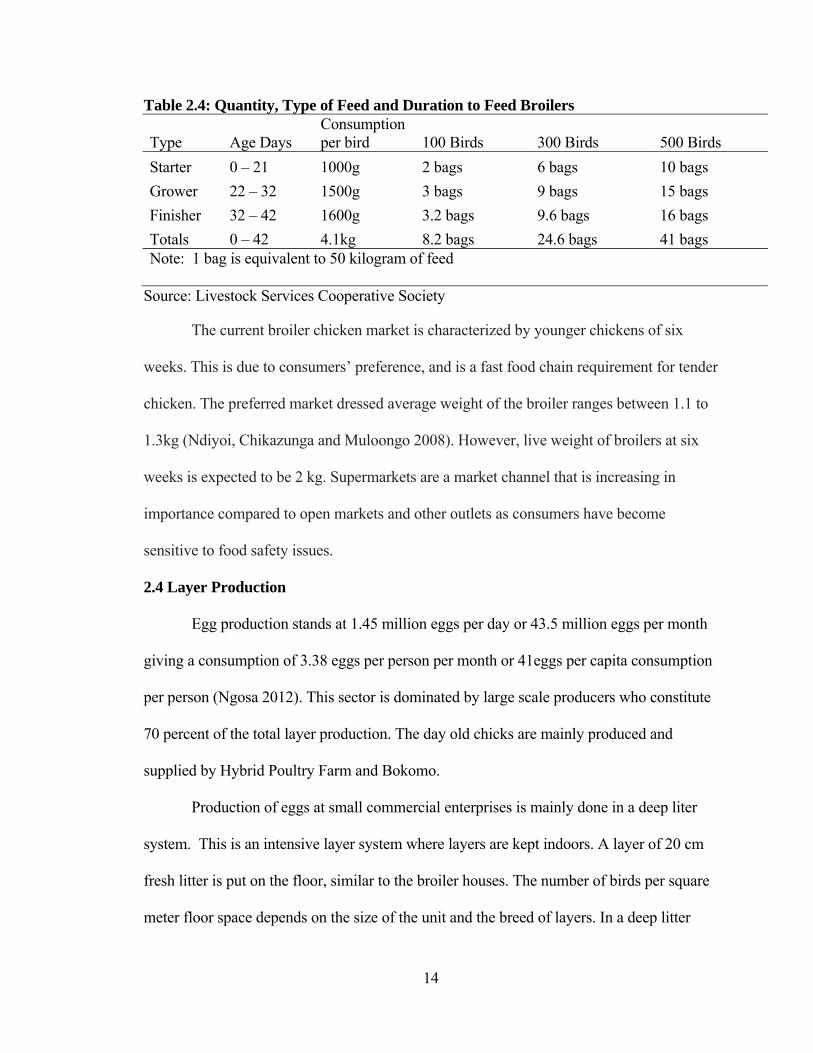
14
Table 2.4: Quantity, Type of Feed and Duration to Feed Broilers
Type Age Days Consumption per bird 100 Birds 300 Birds 500 Birds
Starter 0 – 21 1000g 2 bags 6 bags 10 bags
Grower 22 – 32 1500g 3 bags 9 bags 15 bags
Finisher 32 – 42 1600g 3.2 bags 9.6 bags 16 bags
Totals 0 – 42 4.1kg 8.2 bags 24.6 bags 41 bags Note: 1 bag is equivalent to 50 kilogram of feed
Source: Livestock Services Cooperative Society
The current broiler chicken market is characterized by younger chickens of six
weeks. This is due to consumers’ preference, and is a fast food chain requirement for tender
chicken. The preferred market dressed average weight of the broiler ranges between 1.1 to
1.3kg (Ndiyoi, Chikazunga and Muloongo 2008). However, live weight of broilers at six
weeks is expected to be 2 kg. Supermarkets are a market channel that is increasing in
importance compared to open markets and other outlets as consumers have become
sensitive to food safety issues.
2.4 Layer Production
Egg production stands at 1.45 million eggs per day or 43.5 million eggs per month
giving a consumption of 3.38 eggs per person per month or 41eggs per capita consumption
per person (Ngosa 2012). This sector is dominated by large scale producers who constitute
70 percent of the total layer production. The day old chicks are mainly produced and
supplied by Hybrid Poultry Farm and Bokomo.
Production of eggs at small commercial enterprises is mainly done in a deep liter
system. This is an intensive layer system where layers are kept indoors. A layer of 20 cm
fresh litter is put on the floor, similar to the broiler houses. The number of birds per square
meter floor space depends on the size of the unit and the breed of layers. In a deep litter
15
system, communal or single nests may be used for egg laying. Communal areas have an
area of at least 0.015 square metres per layer and one single nest is suitable for four to six
layers. In the deep litter house, feed is placed in troughs or tube feeders. The required feed
space is about 6 cm per bird and drinking water is provided in troughs or water fountains.
For drinking troughs, 1.5 cm linear drinking space is required per bird (LSCS 2007). The
production process requires simple equipment that is cost effective including water
dispensers, feeders, laying nests and debeakers.
The profitability of egg production depends on the quality of the day old chicks as
well as the quality of pullet management and eventually layers. It is important to ensure
that a good environment is provided for raising layers and that vaccinations are given to
chicks at the right time. Feed and water provision is critical for raising pullets. Clean water
must be provided at all times. The feeding regime usually follows the traditional way of
providing starter, grower, developer, and layer mash from point of lay to culling. It is
important that adequate feed is provided according to the feeding regime recommendation
by the hatchery that supplies day old chicks (Table 2.5).
Hens start laying eggs at 20 weeks old, though there could be a few eggs laid from
17 to 20 weeks. The period of laying eggs extends up to week 56, hence providing 36
weeks of continuous income inflow. The egg size at the beginning of production is usually
small and increase gradually and attain 40 grams weight at about 40 weeks. The size of the
egg is influenced by the rate of increase in light hours and intensity. Too rapid a rate will
force the layers to produce big eggs that results in prolapses or the chicken being egg-
bound in the uterus. A good hen of most breeds is expected to lay about 300 eggs in a 12
month laying period and about 340 in a 14 month period (LSCS 2007).

16
Table 2.5: Type and Amount of Feed Fed to Birds at a Given Age
Type of feed Age of bird Feed Consumption
Pullet Starter 0 - 8 weeks 1.764 kgs/bird
Pullet Grower 9 - 14 weeks 4.081 kgs/bird
Pullet Developer 15 - 20 weeks 1.743 kgs/bird
Layer Mash, supreme 96 20 - 35 weeks 110-120 g/day/bird
Layer Mash Supreme 105 36 - 55 weeks 110-120 g/day/bird
Layer Mash Supreme 115 56 – Culling 110-120 g/day/bird Source: Livestock Services Cooperative Society
Apart from feed and water provision, attention must also be paid to sanitation,
hygiene, lighting and light intensity levels. Vaccinations, debeaking and all the necessary
activities must be carried out according to recommended practices to avoid mortalities as
well as cannibalism. Attention must also be placed on hens when the egg laying starts so
that the poor layers are culled to avoid poor returns on feed costs. Additionally, proper
management demands that notable characteristics exhibited by good or poor laying hens
are easily identified through observation of the comb, abdomen, vent and feathers of the
layers.
Eggs just like broiler meat have two market channels of getting to the consumer and
these are supermarkets as well as the traditional informal markets. The informal market is a
window that is dominated by small scale producers and supermarkets are dominated by
large and mostly vertically integrated firms.
2.5 Poultry Stock Feed Industry
The feed industry is one of the most important support industries for both layer and
broiler enterprises. The growth of this industry both in quality and quantity of poultry feed
produced is another milestone that has increased the growth sustainability of the poultry
industry. The potential for commercial livestock feed production capacity is estimated at
450,000 metric tons per year. Currently, the poultry feed industry is producing 18,000

17
metric tons of commercial feed per month or 216,000 metric tons per year. The bulk of this
production is supplied by National Milling, Tiger Animal Feeds, Olympic Feeds, Novatek
and Nutri Feeds. Other smaller suppliers include: Quality Feeds, Hi-pro, Simba, CMR and
Wonder Feeds Milling in the eastern province of Zambia. In addition, several commercial
farmers manufacture their own feed as nutritional consultancy services are available in
Zambia.
2.6 Marketing of Poultry Products
The market structure for poultry products in Zambia can be generally described as
occurring in two distinct segments namely open/informal and formal markets. The number
and size of participants vary distinctively in these market systems.
The informal market is predominantly for small scale producers and involves the
sale of live chickens and unpackaged and ungraded eggs. Throughout the country, this
system is predominantly found within municipally run markets in all urban and pre-urban
centres. The sale of live chickens is still a significant channel for broilers in Zambia,
contributing more than 30 percent of broiler meat sold annually. There are many producers
who supply this market usually with rudimentary supply chains. Each producer is small in
relation to the entire market supply and it is important to note that no producer has any
advantage over the others. Entry into this market is easy and most producers enter and exit
the market without any difficult. However, with the changing trends in food retailing and
lifestyle, the demand for live chicken is slowly declining as most consumers prefer to shop
in well-developed formal markets such as supermarkets and mini markets. The demand for
eggs in this market is relatively high and is supplied by small scale producers. Just like

18
broilers, there are many egg producers supplying the informal market and no single
producer has the power to influence the market in any way.
The second type of market system is well developed, modern and dominated by a
few but large producers that have the capacity to process their products. The main market
channels for this system include supermarkets and mini-markets. This market system has a
well developed logistics system and has invested in refrigeration, transportation and human
resources. The participation of small scale producers in this market is limited to only a few
whose participation is purely through contract farming by processors. Because of this, the
participation of small producers in this market system is limited to areas surrounding the
capital Lusaka due to the location of processing facilities. All but one processing facility is
located in the Lusaka Province. This means that only small scale farmers located in these
geographical areas are able to engage in contract production and participate in the
developed market system. The suppliers of this market are few but have huge economies of
scale both for broiler meat as well as table eggs. For this market structure, it is clear that a
single producer has the power to affect or influence the entire market system
Out of the total number of broilers produced annually, 65 percent of the broilers are
sold dressed, while the live bird market (dominated by small scale producers) takes up 35
percent (Ndiyoi, et al. 2007). The market demand for high quality standards and
consistency in production remain the two primary constraints affecting small scale broiler
producers’ entry and participation in the table chicken market. Most of the eggs produced
by large scale enterprises are processed, packed and graded and found their way into
supermarkets or mini markets such as Zambeef outlets.

19
Entry into the developed market is difficult for many small scale producers due to
entry barriers of quality standards, volume consistency and safety measures. Most
participants in the developed market for poultry products are large producers that enjoy
large economies of scale. The market has been dominated by a few large producers, most
of whom are vertically integrated. The main participants in this market have access to
production and processing technology, advanced distribution systems and a highly skilled
labor force. The capital requirements for serving this market are very high as it requires
large investment in high tech production, processing and distribution systems and this
explains why a few large producers dominate this market channel. However, there is
growing demand for processed poultry products by consumers compared to unprocessed
ones thus future investment that are tailored to serve this market system has the potential to
offer a good return on investment.

20
CHAPTER THREE: LITERATURE REVIEW
Production, processing and marketing of poultry products is a well-recognized
commercial enterprise world over. In Zambia, the poultry industry is one of the agricultural
sub-sectors that has seen significant investment and enjoyed sustained growth since the
economy was liberalized in 1993. The contribution of the industry to agricultural GDP is
4.8 percent and livestock value added is 48 percent. Poultry is the primary meat consumed
in Zambia accounting for an estimated 50 percent of total meat consumption followed by
beef at 28 percent, pork and fish together at 16 percent and others at 6 percent (Ngosa
2012).
Investment in the poultry industry has expanded the breeder sector with hatcheries
increasing to eight hatcheries with state of the art technology from the initial two before
economic liberalization. Despite a decline in 2009, the industry has shown impressive
growth with annual growth rates for broiler and layer production estimated at 30 and 20
percent, respectively (Ngosa 2011). The increased investment in infrastructure and
capacity has led to a significant increase in the production of day old chicks that has since
increased to an annual production of 51 million (Ngosa 2012). For layers, day-old chicks
are supplied mainly by the Hybrid Poultry Farm and Bokomo. In addition, the importation
of chicks for layers has been reduced to approximately 10 percent, with the largest
consumer of imported day old layer pullets being Golden Lay Farm. The estimated number
of eggs produced during the same period is at more than 520 million eggs with table and
fertile eggs being exported to the Democratic Republic of Congo, Kenya and Tanzania.
According to Ngosa (2012), “the broiler sector is dominated by small enterprises that
constituent 60 percent of total production while for layers small scale production accounts

21
for only 30 percent of total production”. FAO estimates an annual consumption growth rate
of 6.3 percent for both broiler meat and egg production between the period 1990 and 2000
(Chilonda 2005).
Private investment in poultry infrastructure has improved capacity in feed
production, production of day old chicks and increased output in processed chicken meat.
Table 3.1 shows the existing feed manufacturers, breeders and chicken processors in the
country.
Table 3.1: Feed Manufacturers, Breeders and Processors in Zambia Feed Manufacturers Breeders Processors National Milling Hybrid Poultry Farm Crest Chicken Tiger Animal Feeds Ross Breeders Zambia Eureka Chicken Olympic Feeds Bokomo Zambia Country Choice Chicken Novatek (Zambeef) Progressive Poultry Zamchick (Zambeef) Nutri Feeds Zambian Poultry Breeders Quality Feeds Panda Hill Hatchery Hi-Pro Chipata Hatcheries Simba Chick Masters Wonder Feeds Milling
Almost all processing plants are located in Lusaka, with only one in Central
province and the implication is that most producers are around these locations. Out of the
total number of broilers produced annually, approximately 65 percent of these are sold
dressed, while the live bird market (dominated by small scale producers) accounts for 35
percent (Ndiyoi, et al. 2007). Ngosa (2012) estimates that, “for the year 2012, the amount
of processed chicken meat per week through the processors is approximately 700,000
broilers per week compared to volumes of production in 2009 that stood at 200,000 broilers
per week.” The increase in processing capacity has been driven by increased demand for
dressed chicken in the country. The drivers for the increased demand for dressed chicken
22
are attributed to increased quality and safety awareness as well as the shortages and high
prices of beef on the domestic market.
The evaluation of an investment in any type of business including the poultry
business is important for informed decision making. The basis for making sound
investment decisions lies in a well done investment appraisal for determination of
economic profitability as well as financial feasibility. The viability of a project can
beevaluated using several methods and NPV was chosen based on its simplicity and wide
appeal among financial experts and uninitiated (B.Sarpong and Al-hassan 2012). Net
present value provides a measure of the net value of the investment in today's dollars, while
the internal rate of return provides the farmer with a measure to compare this investment
with other investments (Prevatt, et al. 2005). The decision to invest involves committing
large sums of money to a project initially while income or benefits accrue over time.
Boehlje and Ehmke stress that, “because the benefits of investments are based on future
events and the ability to foresee the future is imperfect, it is important to make considerable
effort to evaluate investment alternatives as thoroughly as possible” (2007). Economic
profitability analysis is paramount in selecting a project that is capable of providing
desirable financial results. Economic profitability analysis is critical and requires a
thorough evaluation as it is the basis for investment decision making. The purpose of an
economic profitability analysis is to determine whether the investment will contribute long
run profits to the business.
Although various techniques can be used to evaluate alternative investments such as
the payback period and internal rate of return, the most commonly accepted technique is
net present value, otherwise known as “discounted cash flow” (Boehlje and Ehmke 2007).

23
Net present value recognizes an important financial principle known as the “time value of
money” which is: a dollar today is worth more than a dollar tomorrow. The time value of
money occurs because a dollar today can be invested to generate earnings in terms of
profits, capital gains or interest. Additionally, the uncertainty of receiving a dollar in the
future and inflation makes the future dollar less valuable than if it were received today
(Boehlje and Ehmke 2007). Therefore, using the correct methodology in appraising a
project for investment is a prerequisite for any successful venture as it provides a
foundation for quality decision-making and is used as a key factor for making an
investment decision.
24
CHAPTER FOUR: CONCEPTUAL MODEL
The goal of every investor is to maximize the profit of an investment; hence it
makes sense to use tools that help to make a credible investment decision. The resources
attempt to satisfy unlimited human needs so whenever investment decisions are made,
prudence in the allocation of resources to a project must be exercised. The choice of a
project for investment is primarily based on the economic profitability of the project.
Additionally, understanding the financial feasibility of a project is critical for enhanced
management of future cash flows especially for covering expected future obligations. In
addition, basing the investment on available capital is critical to ensure that considerations
are made within the scope of limited resources.
In practice, there are three traditional methods of evaluating investment proposals
namely the Discounted Payback Period method (PP), the Net Present Value method (NPV)
and the Internal Rate of Return (IRR). The advantage of these methods is, first of all,
simplicity and explicit interpretation of the results. All three methods use projected cash
flow that is discounted according to the time value of money.
4.1 Payback Period (PP)
The payback method may be used because it is an easy way to communicate project
profitability. This measure is easy to understand and interpret especially if time is of the
essence to the investor. A project’s payback period is found by counting the number of
years it takes before the cumulative discounted cash flow equals the initial investment. The
payback rule states that a project should be accepted if its payback period is less than some
specified cutoff period (Brealey, Myers and Allen 2011). The decision rule for this method
is to accept any project that is capable of paying back the initial investment within a given

25
period of time. To ensure that cost of capital is taken into account in determining the value
of the project, the cash flow can be discounted before computing the payback period and
thus called the discounted payback. The discounted payback answers questions such as
how many years does the project have to last for it to make sense in terms of net present
value? With this in mind, the computation of the payback period for this study was done
discounting the cash flows at a rate of 25 percent. The use of discounted payback is
important as it does not accept any project with a negative net present value (NPV).
The method focuses on how rapidly the project pays back its initial investment,
hence the cutoff date becomes the major determining factor in decision making. The
method however ignores all cash flows occurring after the cutoff period. Recognizing the
limitations of this method, this study used discounted payback method as an indicator for
short-term profitability and also for the purposes of informed discussions and not for
economic profitability evaluations.
4.2 Net Present Value (NPV)
Net present value is a financial model that calculates the net value of a project today
by discounting future cash flows over the lifetime of a project by an opportunity cost of
capital. The time value of money is the most basic concept of net present value and is the
most recognized application of the basic principle of finance: a dollar today is worth more
than a dollar tomorrow. A dollar in hand today can be invested to generate earnings in
terms of profits, capital gain or interest. Additionally, the uncertainty of receiving a dollar
in future and inflation make the future dollar less valuable than if it were received today
(Boehlje and Ehmke 2007). The time value of money is taken into account by the discount

26
factor which measures the value of $1 today that is received in future and is expressed as a
reciprocal of 1 plus a rate of return (r):
Discount factor =
The discount factor is a critical concept in NPV analysis and is often determined
using the opportunity cost of capital. The recognition of opportunity cost of capital is
important as this is a return foregone by investing in a chosen project with similar risk
rather than investing in other projects or in financial markets. The opportunity cost of
capital is the standard of profitability that is used to calculate how much the project is
worth. It is the expected rate of return offered by other assets/projects with the same risk as
the project being evaluated. The analysis of NPV is based on the forecasted cash flow of a
project under consideration and is applicable for both single cash flows as well as for a
stream of cash flows extending over a number of years. For NPV analysis, only cash flow
is relevant. Cash flow is estimated on an incremental basis and consistency is required in
the treatment of inflation (Brealey, Myers and Allen 2011).
The rule for adding present values for a stream of cash flows is simple summation
because present values are all expressed in current dollars. Below is an illustration of the
total present value for a discounted cash flow of a project:
PV =
This formula can be expressed in shorthand as:
PV = ∑
Ct
(1+r)t
+
C3
(1+r)3
1 (1+r)
C1
(1+r) + C2
(1+r)2 + C1
(1+r) + C2
(1+r)2 C1
(1+r) + + C2
(1+r)2 C1
(1+r) + + C2
(1+r)2 C1
(1+r) +
C3
(1+r)3 +
C2
(1+r)2 C1
(1+r) +
C3
(1+r)3 +
C2
(1+r)2 C1
(1+r) + +…………+ C3
(1+r)3 +
C2
(1+r)2 + + C2
(1+r)2 + C3
(1+r)3 + C2
(1+r)2 + C3
(1+r)3 ++
t = 1
T
CT
(1+r)T C3
(1+r)3 + C2
(1+r)2 +

27
where ∑ refers to the sum of the series, C is cash flow, r is discount rate and t is the time
period in years. To find the net present value (NPV), the initial cash flow (initial
investment which is usually negative) to the present value of a discounted cash flow:
NPV = C0 + PV = C0 + ∑
where C0 represents the cash flow at time 0 (today). C0 is a cash outflow hence bearing a
negative sign. The decision rule for Net Present Value is to accept investments that have a
positive net present value (Brealey, Myers and Allen 2011).
4.3 Internal Rate of Return (IRR)
An investment should only be made when the project to be invested is worth more
than its cost and this is the basis for NPV. The internal rate of return is simply the discount
rate that makes NPV equal to zero. The decision rule for IRR is to accept an investment in
a project if the opportunity cost of capital is less than the internal rate of return (Brealey,
Myers and Allen 2011). Internal rate of return and net present value analyses are very
comparable because if the opportunity cost of capital is less than IRR, then the project has a
positive NPV when discounted at the opportunity cost of capital. It is imperative to be
mindful of the pitfalls that come with IRR to use it correctly.
The discount rate used in this project was reached at by calculating the discount rate
offered for investing in government securities. The Bank of Zambia provides the formula
for calculating discount rate for investing in government securities and is as shown below:
Discount Rate = ( ) x x 100
where F is the Face Value, P is the Purchase Price (cost), D is the Number of Days in a
year (365), and n is the Maturity Period of Investment.
Ct
(1+r)t
t = 1
T
F - P
F
D
n

28
Prices are usually quoted in multiples of KR5,000 equivalents to US$1,000 for all
transactions (BOZ 2008). Using the above formula, the calculated discount rate is 19.6
percent; however for the nature of the investment under consideration, the risk is higher
than government securities hence a discount rate of 25 percent is arbitrary used for the
NPV analysis.
4.4 Scenario Analysis
Whenever a cash-flow forecast is made, it is important to discover what else can
happen besides the expected. Scenario analysis is critical in determining the riskiness and
viability of a project. Since the cash-flow forecasts depend on production and market
assumptions, it leaves room for uncertainty. It is important therefore to make alternative
assumptions to see how they can affect the viability of the projects under consideration.
This provides a good picture of a project if expected conditions do not occur. Those
conditions may be a mixture of expected and unexpected causing a project to over- or
under perform. A concern for any investment is the likelihood that a given project
significantly under performs as this may defeat the profitability of investment. To reduce
uncertainties surrounding the project’s performance, scenario analysis is used to assess the
effects of different scenarios on the NPV, IRR and Payback Period.

29
CHAPTER FIVE: METHODS
This study used net present value and other tools in determining the economic
profitability of both broiler and layer enterprises. The discounted Net Present Value (NPV)
was used in the study to determine the economic profitability of each enterprise under
consideration. NPV recognizes the time value of money and uses the forecasted cash flows
of the project and the opportunity cost of capital commonly known as discount rate. The
decision rule for NPV is to accept investments that have positive net present values. This
rule was applied in making recommendations as to whether the enterprise is viable for
investment. To have another view of the enterprise’s attractiveness, the internal rate of
return (IRR) that has roughly the same theoretical basis as NPV, was used in the analysis.
For the IRR method, the decision rule is to accept investments that offer rates of return in
excess of their opportunity cost of capital. The opportunity cost of capital used in the
analysis was calculated from a formula provided by the Bank of Zambia for investing in
government securities. Considerations were made with regard to the actual discount rate
used in this study to account for the higher risk of poultry enterprises compared with
government securities.
The focus of the analysis was on small scale commercial production enterprises and
the amount for investment was determined by the stipulated amount for small scale
enterprises defined by Zambia Development Agency (ZDA). According to ZDA (2012), a
“small scale enterprise shall be any business enterprise registered with the Registrar of
Companies, whose total investment, excluding land and buildings should be between
US$30,000 and US$50,000”. For purposes of this study, a US$50,000 initial investment
was used for the analysis. The US$50,000 covered capital investment as well as initial

30
production costs. The major cost components of the capital investment include brooder
house construction and production equipment while the production cost covers inputs,
labour, electricity, transport and marketing among others.
The data used in this study were collected from the Poultry Association of Zambia
(PAZ), Central Statistical Office (CSO), and Livestock Services Cooperative Society. In
addition, some data were extracted from ZDA Cost of Doing Business in Zambia Manual
2012 and the other data were obtained directly from the market. Data for costs of inputs,
equipment, and the prices of poultry products were collected from the market directly and
reflect market prices prevailing in December 2012.
5.1 Assumptions
The currency used in this study is the US Dollar (US$) at the exchange rate of KR5
to US$1. The exchange rate reflects the conversion rate quoted in the Cost of Doing
Business in Zambia (ZDA 2012). The assumption made for this study is that land is readily
available and that the US$50,000 investment would cover chicken housing construction,
production equipment and initial production costs. The government of the Republic of
Zambia has set a minimum wage for different categories of nonunionized workers and a
monthly wage of US$240 per employee was used in the analysis. For each enterprise, five
employees were assumed. It is also assumed that the financing of the project is from
savings. It was also assumed that production for broiler enterprise would be staggered in
two brooder houses with two weeks allowance for cleaning between each cycle of
production. A 3-year tax exemption for any small enterprise as set by the Zambia
Development Agency for micro and small enterprises was assumed (ZDA 2012).

31
5.2 Procedure
The data that were collected from the market and supplemented with the Cost of
Doing Business Manual were used in the budgeting process of the enterprises under
consideration. Construction of brooder houses was estimated at US $20,000 for the two
brooder houses for broiler enterprise and US$15,000 for a single brooder house for the
layer enterprise, respectively.
Revenue was estimated from the total number of broilers expected to be sold
annually from the broiler enterprise and the number of trays of eggs and culled hens
expected to be sold per year. The wholesale prices used in estimating revenue include eggs
at US$3.60 per tray, culled hens at US$2.00 per hen and US$5.00 per live broiler chicken.
Production costs for each enterprise were derived from the cost of feed, vaccination, day
old chick cost, labor, electricity, transport and others (communication and stationery). The
total production cost was then expressed as a percentage of revenue by using the annual
revenue and production costs.
The production targets for each enterprise were determined by considering a
realistic level of production using the US$50,000 initial investment available. Revenue was
estimated at mortality rates of 10, 5 and 0 percent respectively for both layer and broiler
enterprises. However, the 5 percent mortality rate was used for cash flow forecasting. A
straight line depreciation method was applied in the analysis with salvage values estimated
at US$20,000 and US$15,000 for broiler and layer enterprises respectively. The economic
life of the two enterprises was set at 5 years.
The income statements were estimated for three different scenarios. The NPV and
IRR were determined at the discount rate of 25 percent. The discount rate was obtained by

32
calculating the discount rate that could apply for investing US$50,000 in government
securities through the Bank of Zambia. Since money invested in government securities is
not prone to the same kind of risk as the one invested in poultry projects, consideration was
made to come up with an appropriate rate that was used in the analysis. The calculated rate
was 19 percent and this was adjusted upwards to 25 percent for use in the evaluation of the
two enterprises.
Microsoft Excel 2007 was used to calculate the enterprise budgets, income
statements and to calculate the discounted NPV and IRR based on the cash forecasts.
Revenue was estimated to increase at 8 percent annually. A 10 percent tax rate used in the
study was obtained from Zambia Revenue Authority (ZRA) and applies to local
agricultural enterprises. The 3 years tax free incentive that is provided for new enterprises
in priority sectors located in urban areas was also accounted for in the analysis.
5.3 Cost and Production Estimates
The construction of brooder houses was estimated at US$10,000 and US$15,000
for broiler and layer enterprises, respectively. Since broiler production would use two
brooder houses, a total of US$20,000 was allocated for construction of brooder houses for
the broiler enterprise. The remaining US$30,000 and US$35,000 for broiler and layer
enterprises was to cover cost of equipment and initial production inputs. Expenditures on
brooder houses and production equipment were treated as capital investment and were
depreciated using a straight line method. The major production equipment includes
drinkers, feeders, debeakers, heaters and cleaning tools. The total capital investment
according to the enterprise budgets were US$27,090 and US$21,095 for boiler and layer
enterprise respectively. Table 5.1 documents some key production equipment, unit cost

33
and quantity requirements for the estimated level of production for broiler and layer
enterprises respectively.
Table 5.1: Major Production Equipment Needed for Broiler and Layer Production
Equipment Quantity Required for
Broiler Enterprise Quantity Required
for Layer Enterprise Unit Cost
(US $)
Chick Fonts 50 X 2 40 11.29
Drinkers 50 X 2 40 16.76
Chick Feed Trays 75 X 2 60 3.10
Tube Feeders 150 X 2 100 12.00
Egg Trays (Bundles) 0 150 23.10
Apart from capital investment, there would also be substantial requirements for
initial production costs to cover wages, marketing, vaccines, feed, day old chicks,
transportation and electricity. Most of the costs that were used in estimating the cost of
production were obtained directly from the market with the exception of transportation,
marketing, communication and stationery that were extracted from the Cost of Doing
Business Manual 2012, a publication of the Zambia Development Agency. Furthermore,
the wage rate used in the analysis was obtained from the Ministry of Labour. Table 5.2
presents key inputs that constitute major production costs for broiler and layer enterprises
respectively.

34
Table 5.2: Cost of Key Production Inputs in Broiler and Layer Production
Item Unit Unit Cost (US$)
Day old Broiler Chick 1 0.90 Day old Layer Chick 1 1.20 Broiler Starter 50kg 29.20 Broiler Grower 50kg 28.40 Broiler Finisher 50kg 28.00 Pullet Starter 50kg 25.00 Pullet Grower 50kg 23.60 Pullet Developer 50kg 22.60 Layer Mash 50kg 24.00 Gumboro Vaccine 1000 doses 6.00 Lasota 1000 doses 4.00 Vitamin Trace 1 ltr 26.00
The above costs were used to develop enterprise budgets for both broiler and layer
production. The two enterprise budgets developed indicate broiler annual production of
60,000 birds and 30,000 trays of eggs equivalent to 900,000 eggs for the layer enterprise.
For the broiler enterprise, the production estimate of 60,000 birds annually is expected to
be produced from two brooder houses each producing a total of 6 batches per year. Each
batch is estimated to produce 5,000 broilers and a total of 12 batches would be produced
annually producing 60,000 broiler chickens per year. The layer enterprise generates
income from sale of eggs as well as culled layers. The production target for the layer
enterprise is set at 30,000 trays of eggs per year from 3,000 hens. The enterprise budgets
are presented in tables 5.3 and 5.4 for broiler and layer enterprises.
Using the enterprise budgets, the total production cost was estimated as a
percentage of total revenue for each enterprise and increased at the same rate as revenue.
The production costs estimates were found to be at 80 and 70 percent for broiler and layer
enterprises, respectively. The unit cost of producing one broiler was estimated at US$3.82

35
while the cost of producing one tray of eggs was US$2.56. These costs were arrived at by
dividing the total production cost with the expected output for each enterprise.
Table 5.3: Budget Estimate for Production of 60,000 Broilers per Year
Unit(US$)House A
(US$) House B
(US$) Year 1 Number of Birds 5,000 5,000 60,000 Number of Batches 1 1 12 Cash Revenue Broiler Birds 5.00
Mortality rate @ 0 % 5000 25,000.00 25,000.00 300,000.00 Mortality rate @ 5 % 4750 23,750.00 23,750.00 285,000.00
Mortality rate @ 10 % 4500 22,500.00 22,500.00 270,000.00 Production Costs
Day old chicks 0.90 4,500.00 4,500.00 54,000.00 Feed 2.33 11,650.00 11,650.00 139,800.00
Medication 0.13 625.00 625.00 7,500.00 Beddings 150.00 150.00 150.00 1,800.00
Disinfectants 200.00 200.00 200.00 2,400.00 Electricity 110.00 110.00 110.00 1,320.00 Transport 100.00 100.00 100.00 1,200.00
Marketing 200.00 200.00 200.00 2,400.00 Wages 1,200.00 600.00 600.00 14,400.00
Others(communication,stationery,etc) 941.00 941.00 1,882.00 Total Production Costs 19,076.00 19,076.00 226,702.00
Capital InvestmentBrooder House 10,000 10,000 10,000 20,000
Drinkers Chick Fonts 11.29 564.50 564.50 1,129.00
Drinkers 16.76 838.00 838.00 1,676.00 Feeders -
Chick Feed Trays 3.10 232.50 232.50 465.00 Tube Feeders 12.00 1,800.00 1,800.00 3,600.00
Others(Bulbs, Heaters, brooms, etc) 110.00 110.00 110.00 220.00 Total Capital Investment 13,545.00 13,545.00 27,090.00
Total Costs 32,621.00 32,621.00 253,792.00 Net Income
Mortality rate @ 0 % (7,621.00) (7,621.00) 46,208.00 Mortality rate @ 5 % (8,871.00) (8,871.00) 31,208.00
Mortality rate @ 10 % (10,121.00) (10,121.00) 16,208.00

36
Table 5.4: Budget Estimate for Production of 30,000 Trays of Eggs
Unit cost
(US$)
1- 20 weeks (US$)
20 - 52 weeks (US$) Year 1
Number of Birds
3,000 Number of egg trays 30,000 Cash Revenue
Wholesale price of eggs per tray
3.60
Sale of culled Birds
2.00
Revenue @ 0 % mortality rate 3,000 30,000 114,000.00
114,000.00
Revenue @ 5 % mortality rate 2,850
28,500
108,300.00
108,300.00
Revenue @ 10 % mortality rate 2,700 27,000
102,600.00 102,600.00 Production Costs
Day old chicks
1.20
3,600.00 - 3,600.00
Feed 0.48
11,232.00
38,880.00
50,112.00
Medication 0.15
450.00
450.00
Beddings
150.00
150.00
-
150.00
Disinfectants
200.00
200.00
-
200.00
Electricity 110.00
550.00
770.00
1,320.00
Transport
100.00
100.00
3,200.00
3,300.00
Marketing
300.00 300.00
2,100.00
2,400.00
Wages
1,200.00
6,000.00
8,400.00
14,400.00 Others (communication,
stationery & maintenance) 70.00 350.00
490.00
840.00
Total Production Costs
22,932.00
53,840.00
76,772.00 Capital Investment
Brooder House
15,000.00 15,000.00 -
15,000.00
Drinkers Chick Fonts 11.29 451.60 -
37
451.60
Drinkers
16.76 670.40
-
670.40 Feeders
Chick Feed Trays 3.10 186.00 -
186.00
Tube Feeders 12.12 1,211.60 -
1,211.60 Others(Bulbs, Heaters, brooms,
spade & wheelbarrow) 110.00 110.00 -
110.00
Egg Trays (150 bundles)
23.10 -
3,465.00
3,465.00
Total Equipment Cost 17,629.60
3,465.00
21,094.60
Total Costs
40,561.60
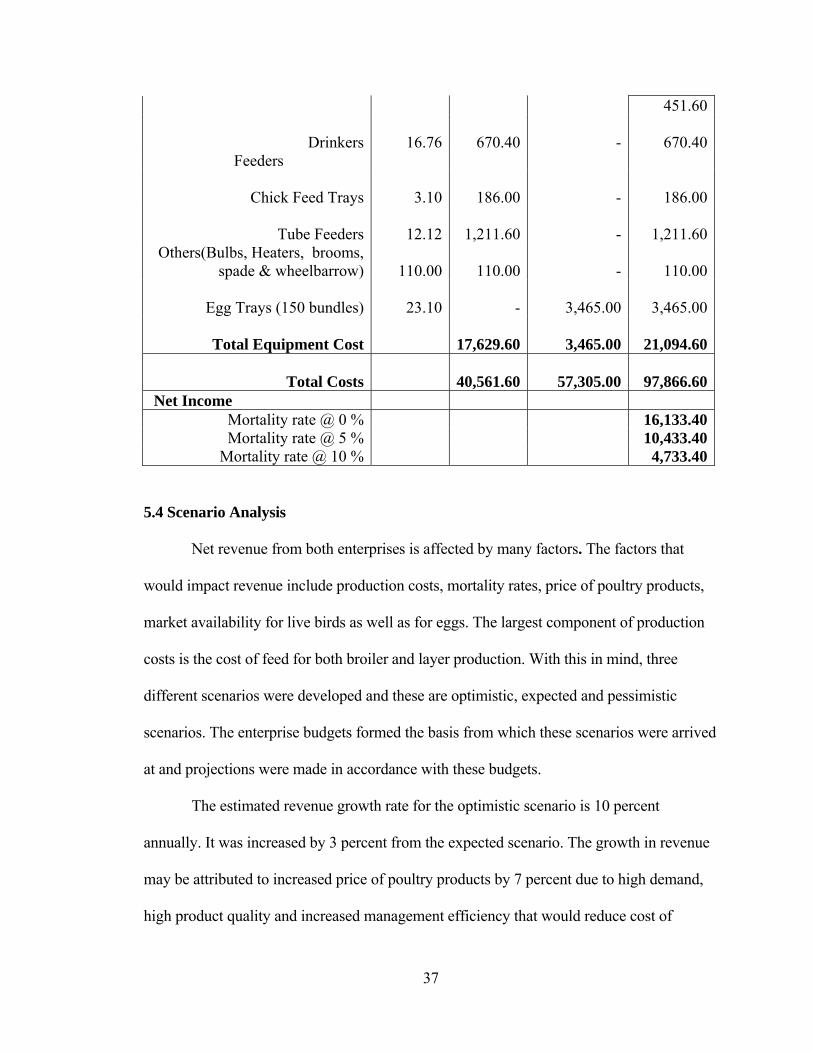
57,305.00 97,866.60 Net Income
Mortality rate @ 0 % 16,133.40 Mortality rate @ 5 % 10,433.40
Mortality rate @ 10 % 4,733.40
5.4 Scenario Analysis
Net revenue from both enterprises is affected by many factors. The factors that
would impact revenue include production costs, mortality rates, price of poultry products,
market availability for live birds as well as for eggs. The largest component of production
costs is the cost of feed for both broiler and layer production. With this in mind, three
different scenarios were developed and these are optimistic, expected and pessimistic
scenarios. The enterprise budgets formed the basis from which these scenarios were arrived
at and projections were made in accordance with these budgets.
The estimated revenue growth rate for the optimistic scenario is 10 percent
annually. It was increased by 3 percent from the expected scenario. The growth in revenue
may be attributed to increased price of poultry products by 7 percent due to high demand,
high product quality and increased management efficiency that would reduce cost of
38
production by 5 percent. Apart from improved efficiency, reduction in production costs
because of lower feed costs or other production inputs could also increase revenue. This
scenario used a lower mortality rate of 2 percent that could be attributed to proper
management of the poultry production and supply chain system.
The second scenario was the expected scenario. This is the anticipated scenario
bearing in mind that all assumptions occur. This scenario assumed growth in revenue of 8
percent, slightly above the current inflation rate of 7 percent. The mortality rate under the
expected scenario was 5 percent, slightly higher than the 3 percent in the industry. The
enterprise budgets presented in tables 5.3 and 5.4 provide details of expected revenue and
production costs. Using production costs as a percentage of revenue, the broiler enterprise
budget shows 80 percent of total revenue to cover the cost of production. The layer
enterprise on the other hand indicates a 70 percent of total revenue to cover production
cost. The experience that comes with enterprise establishment would also increase
production efficiency.
The pessimistic scenario considered revenue growth of 5 percent, 2 percent below
the anticipated inflation rate. This scenario sets a higher mortality rate of 10 percent. Feed
is the largest component of production costs and this scenario anticipates a rise in cost of
feed that could drive the production cost up by 10 percent annually. Table 5.5 shows the
summary of the assumptions for each scenario.

39
Table 5.5: Summary of Assumptions made for Optimistic, Expected and Pessimistic Scenarios
Optimistic Scenario Expected Scenario Pessimistic Scenario
Revenue growth rate 10% 8% 5%
Discount rate 25% 25% 25%
Mortality rate 2% 5% 10%
Tax rate 10% 10% 10%
Broilers production cost 75% 80% 90%
Layers production cost 65% 70% 80%
The results of the analysis are discussed in the following chapter. The key factors
for which each enterprise was evaluated on for economic profitability include the
discounted NPV value and IRR. The NPV and IRR rules were applied in making
assessments as to the degree of attractiveness of the two enterprises.

40
CHAPTER SIX: ANALYSIS
The calculations were done using Microsoft Excel 2007. The discounted payback
period was calculated to establish the number of years each enterprise would take to pay
back its initial investment. The results presented in table 6.1 show that the layer enterprise
would pay back in 3 years compared to broiler enterprise that needs a minimum of 2 years.
At first glance, the broiler enterprise looks more profitable than the layer enterprise. The
summary of the results obtained from the discounted payback period analysis are presented
in the table below.
Table 6.1: Discounted Payback Periods for Broiler and Layer Enterprises
Discounted Cash Flows
Discounted Payback Period (Years) NPV at 25%
Year 0 1 2 3Layer
Enterprise $(50,000.00)
$25,992.00
$22,457.09 $19,402.92 3 $17,852.01
Broiler Enterprise
$(50,000.00)
$45,600.00
$39,398.40 2 $34,998.40
Additional calculations for the NPV and IRR were also calculated using Excel
2007. NPV calculations used a constant discount rate of 25 percent, a tax rate of 10 percent
for income generated by the business and 35 percent for disposal of brooder houses after
the 5-year economic life of the projects. The cash flows were forecasted using the
enterprise budgets presented in tables 5.3 and 5.4 under the assumptions described in the
expected scenario. The results for broiler enterprise are presented in table 6.2 while table
6.3 shows the results for layer enterprise.
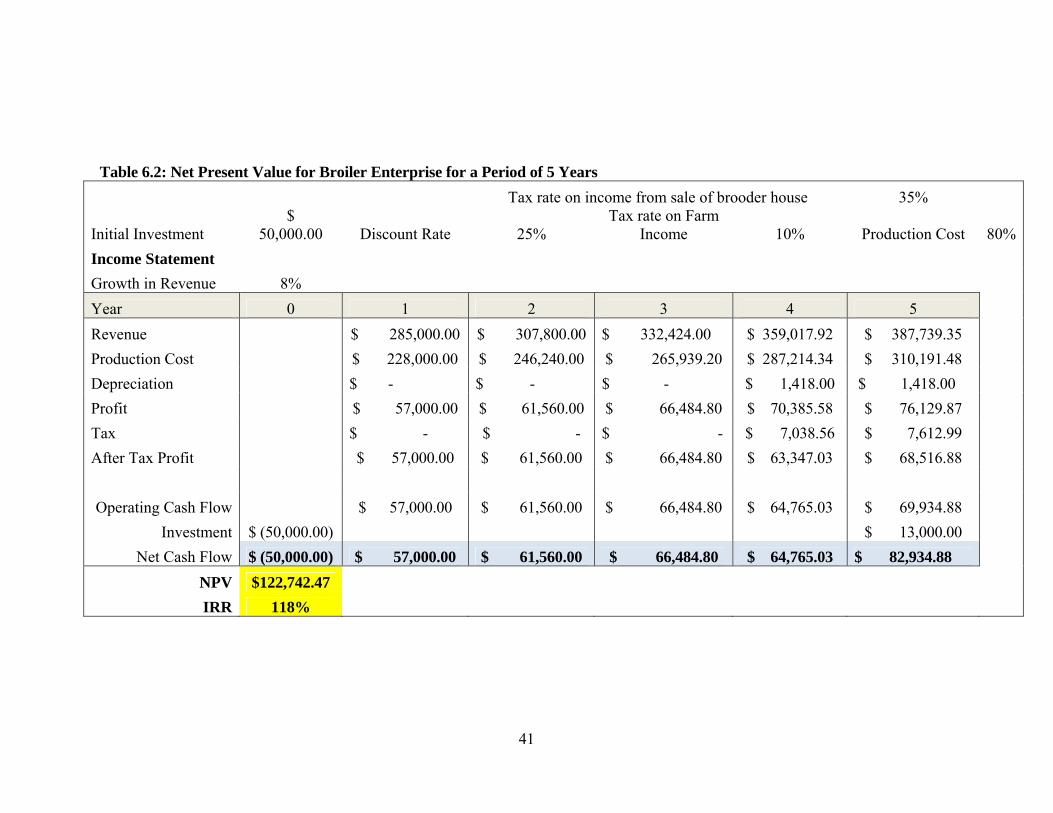
41
Table 6.2: Net Present Value for Broiler Enterprise for a Period of 5 Years
Tax rate on income from sale of brooder house 35%
Initial Investment $
50,000.00 Discount Rate 25% Tax rate on Farm
Income 10% Production Cost 80%
Income Statement
Growth in Revenue 8%
Year 0 1 2 3 4 5
Revenue $ 285,000.00 $ 307,800.00 $ 332,424.00 $ 359,017.92 $ 387,739.35
Production Cost $ 228,000.00 $ 246,240.00 $ 265,939.20 $ 287,214.34 $ 310,191.48
Depreciation $ - $ - $ - $ 1,418.00 $ 1,418.00
Profit $ 57,000.00 $ 61,560.00 $ 66,484.80 $ 70,385.58 $ 76,129.87
Tax $ - $ - $ - $ 7,038.56 $ 7,612.99
After Tax Profit $ 57,000.00 $ 61,560.00 $ 66,484.80 $ 63,347.03 $ 68,516.88
Operating Cash Flow $ 57,000.00 $ 61,560.00 $ 66,484.80 $ 64,765.03 $ 69,934.88
Investment $ (50,000.00) $ 13,000.00
Net Cash Flow $ (50,000.00) $ 57,000.00 $ 61,560.00 $ 66,484.80 $ 64,765.03 $ 82,934.88
NPV $122,742.47
IRR 118%
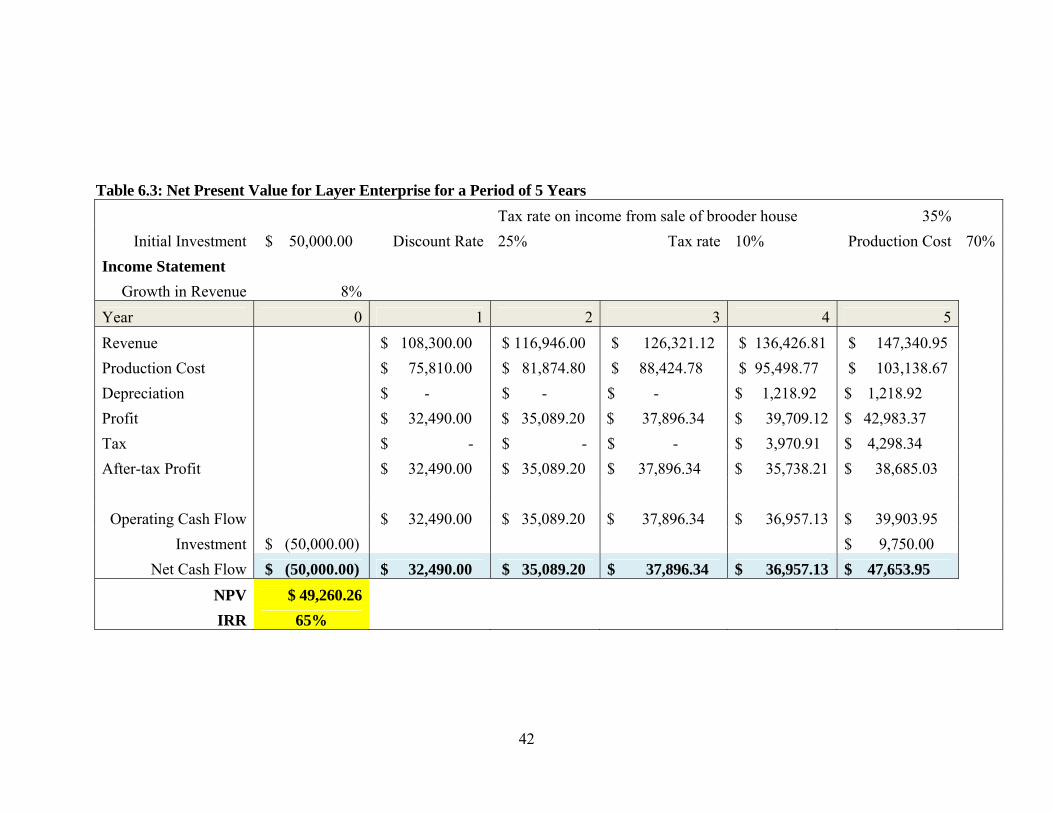
42
Table 6.3: Net Present Value for Layer Enterprise for a Period of 5 Years
Tax rate on income from sale of brooder house 35%
Initial Investment $ 50,000.00 Discount Rate 25% Tax rate 10% Production Cost 70%
Income Statement
Growth in Revenue 8%
Year 0 1 2 3 4 5
Revenue $ 108,300.00 $ 116,946.00 $ 126,321.12 $ 136,426.81 $ 147,340.95
Production Cost $ 75,810.00 $ 81,874.80 $ 88,424.78 $ 95,498.77 $ 103,138.67
Depreciation $ - $ - $ - $ 1,218.92 $ 1,218.92
Profit $ 32,490.00 $ 35,089.20 $ 37,896.34 $ 39,709.12 $ 42,983.37
Tax $ - $ - $ - $ 3,970.91 $ 4,298.34
After-tax Profit $ 32,490.00 $ 35,089.20 $ 37,896.34 $ 35,738.21 $ 38,685.03
Operating Cash Flow $ 32,490.00 $ 35,089.20 $ 37,896.34 $ 36,957.13 $ 39,903.95
Investment $ (50,000.00) $ 9,750.00
Net Cash Flow $ (50,000.00) $ 32,490.00 $ 35,089.20 $ 37,896.34 $ 36,957.13 $ 47,653.95
NPV $ 49,260.26
IRR 65%

43
The results from the broiler enterprise show a positive NPV of US$122,742 and IRR of
118 percent. The layer enterprise also shows a positive NPV of US$49,260 with IRR of 65
percent. The positive NPVs are a sign that both projects are economically viable for
investment. Positive NPV indicates that a project is economically profitable, hence
attractive for investment. Secondly, the results for both broiler and layer enterprises show
internal rates of return in excess of 25 percent opportunity cost of capital used in the
analysis. According to the decision rules for both NPV and IRR, the projects evaluated in
this thesis can be accepted for investment as they are seen to be economically sound for
prudent investment.
Calculations of NPV and IRR under different scenarios also showed positive NPVs
and IRR in excess of 25 percent. Table 6.4 summarizes the results for the optimistic,
expected and pessimistic NPVs and IRRs for broiler and layer enterprises respectively.
Table 6.4: NPV and IRR for Optimistic, Expected and Pessimistic Scenarios Optimistic Scenario
Expected Scenario
Pessimistic Scenario
Broiler NPV $ 178,242.48 $ 122,742.47 $ 30,550.13
Broiler IRR 154% 118% 51%
Layer NPV $ 72,260.90 $ 49,260.26 $ 11,185.91
Layer IRR 81% 65% 35%
The analysis under different scenarios shows that the NPV for the two enterprises
are positive and the IRRs are in excess of 25 percent (Table 6.4). This shows that the
enterprises are economically profitable for investment according to the decision rules for
both NPV and IRR. The broiler enterprise is more attractive across all scenarios than the
layer enterprise. According to the results, it can be said that broiler enterprise is more

44
attractive for investment than layer enterprise as it provides more dollars in return on each
dollar invested.
A simple sensitivity analysis shows that changes in cost of feed have a huge impact
on the overall cost of production indicating that cost of production is sensitive to changes in
the cost of feed. For instance, 10 percent increase in cost of feed increases production cost
by 5 percent in the layer enterprise and 4 percent in broiler enterprise. Increasing the cost of
transport and electricity by 10 percent only increases total production cost by 1 percent in
layers and a negligible increase in the overall cost of production for broiler enterprise.
Additionally, the revenue is equally sensitive to sharp drop in market prices of chicken
meat though this does not pose a danger to the enterprises because the prices of poultry
products on the market have remained relatively stable for more than a decade. If revenue
remained static for the period of 5 years while costs increased at 8 percent annually, the
results show the NPV of $12,606 and IRR of 40 percent for layer enterprise while for
broiler enterprise, the results indicate the NPV of $26,284 and IRR of 70 percent.
A break-even analysis was also conducted on the enterprise budgets presented in
tables 5.3 and 5.4 at 5 percent mortality rate and zero tax rates. The results showed that the
break-even price for broiler enterprise is US$4.49 per broiler for the production of 60,000
birds annually. Since the quantity produced affects both revenue and cost of production, it
was found that a production of 39,213 broiler birds annually or producing 3,268 birds per
batch can also break even. For layers, the breakeven price is US$3.20 per tray of eggs
while selling culled hen at US$2.00 and the breakeven quantity is 25,605 trays of eggs.
This is the minimum number of egg trays that is needed to cover all costs if sold at the

45
wholesale prices used in budget. It was also found that all costs can be covered by the sale
of eggs at US$3.43 per tray of eggs without accounting for culled hens.
It was also interesting to note that the production cost of the layer enterprise as a
percentage of revenue was lower than the production cost of broiler enterprise. A close
look at the two costs of production indicate that about 65 percent of total production cost is
spent on feed for layers compared to 60 percent for broiler enterprises. In addition, day old
chicks for the broiler enterprise make up 25 percent of total production cost compared to
4.7 percent for layers. Items such as disinfectants, beddings and medications contribute
substantially to the high cost of production in broiler production compared to layer
production. This is because in broiler production every production cycle requires new
beddings, disinfectant and the cumulative use of medication. Broiler production was found
to be more lucrative than layer production for investment.
In addition, the broiler enterprise has the quickest income generation period and
provides income at a specific short time interval. Unlike layers, broilers take 6 weeks to
complete one production cycle and just require two weeks for cleaning and sanitation
between successive cycles. The management of flocks is relatively easier in broilers than in
layers. On the other hand, layers take a minimum of 20 weeks before stable income begins
and it provides steady and continuous cash inflows that last for 32 to 48 weeks in one
production cycle. Layer enterprises on the other hand provide income from two streams:
eggs, as well as the sale of culled hens for meat. It is also important to note that once
broilers are ready for the market, they have to be sold immediately as any delay may result
in increased costs of production resulting from increased feed intake.

46
The market for poultry products is available in Zambia and other countries. The
poultry products can be supplied to fast foods outlets, hotels, lodges, households through
open markets and formal markets and can be exported to the wider market in the region.
However, the majority of small scale farm enterprises target household consumers through
open markets. The risk that small scale enterprises are faced with is the lack of a
guaranteed market and price whenever product is taken to the market. Sometimes it
becomes a cost for producers to keep feeding broilers that have already reached the market
weight if they cannot be sold at once.
Since the broiler enterprise is more attractive in terms of economic profitability than
the layer enterprise, this could be seen as a possible explanation as to why many small scale
producers prefer investing in broilers other than layers. In addition, the quick cash inflow,
lower management requirement and the lower feed cost per production cycle play an
important role in influencing many small scale farmers to engage more in broiler
production other than layer production.

47

48
CHAPTER SEVEN: CONCLUSION
The poultry industry is a well recognised sector of the economy in Zambia. It
currently contributes 4.8 percent to agriculture gross domestic product (GDP) and 48
percent to the livestock sector. The production capacity of stock feed, day old chicks and
output for layers and broilers has increased significantly since the 1990s. Production of
broiler meat increased from 19,000 tonnes in 1990 to 72,000 tonnes by 2011. Similarly the
egg output also increased significantly from 25,000 tonnes in 1990 to over 60,000 tonnes in
2011. The industry has shown growth in the past years with the growth rate for boiler and
layer production estimated at 30 and 20 percent respectively. Poultry meat continues to be
the primary meat consumed in Zambia accounting for an estimated 50 percent of total meat
consumption followed by beef at 28 percent; pork and fish together account for 16 percent
and others at 6 percent. The growth of the poultry industry has been influenced by both
demand-side and supply-side factors. Demand-side factors include an increase in
population, increased disposable income from the emerging middle class, urbanization and
higher prices of beef products. Supply-side factors include advances in breeding
technology, improved infrastructure for feed manufacturing and slaughter and processing
technologies among others.
This thesis used NPV and IRR tools to evaluate the economic profitability of both
the broiler and layer enterprises. The data used in the analysis were obtained from the
industry and other data were obtained from the Cost of Doing Business Manual 2012, a
publication of the Zambia Development Agency.
The data were used to estimate enterprise budgets for broiler and layer enterprises
respectively. The enterprise budget for broiler production estimated revenue from the sale
49
of broiler chickens at a wholesale price while the layer enterprise budget estimated its
revenue from the sale of eggs as well as culled hens. Revenue from the broiler enterprise
was estimated at US $5 per bird while the layer enterprise was expected to generate income
from sale of eggs at US $3.60 per tray and culled hen at US $2 per hen. In addition,
revenue was estimated to grow at a rate of 8 percent annually. The production estimates
were set at 60,000 broilers and 30,000 trays of eggs for broiler and layer enterprises
annually.
Production equipment and brooder house construction costs were the major capital
investment and were depreciated using a straight line method for a 5-year economic life.
The total capital investment was estimated at US$27,090 and US$21,095 for boiler and
layer enterprises, respectively. The cost of feed was the major component of production
costs for both broiler and layer production. The cost of feed constituted about 65 percent of
total production cost for the layer enterprise and about 60 percent for the broiler enterprise.
The total production cost as a percentage of revenue was estimated at 80 percent and 70
percent for broiler and layer enterprises, respectively. The major components making up
production costs include the cost of feed, vaccines, day old chicks, wages, marketing and
transportation.
Though the target market assumed for the sale of poultry products in both
enterprises is the open market system, there are two well established market systems for
poultry products in Zambia. These include the open/informal and the formal market
systems. The open/informal markets are predominately run the local councils while the
formal markets are run by business executives of national and multinational food chain
stores. The council run markets are referred to as informal because most of the market
50
participants have informal businesses that only have the permit to trade. The second type
which is the formal market system uses supermarkets and mini marts as market channels.
The small scale poultry producers are the major if not the only producers who supply the
open market system. There is little or no value addition to poultry products that are
supplied to this market and the supply chain is very short with rudimentary distribution
channels. The formal market system on the other hand has well developed supply chain
with very organized distribution channels and supply supermarkets and mini marts. This
market system is dominated by large producers who are mostly vertically integrated.
Though a window of opportunity exists for small scale producers to participate in the
formal and developed market system, very little occurs. Small scale producers only
participate through contract farming and at the moment only broiler producers located near
processing facilities are able to participate. The egg producers on the other hand have a
limited chance of participating in the formal supply chain due to low levels of production
as well as high demand from its traditional market, the open market. The open market still
offers large and attractive market for small scale poultry producers and these are found in
municipally run markets throughout the country.
In the analysis, three different scenarios that included optimistic, expected and
pessimistic were considered. All scenarios used a constant discount rate of 25 percent and a
tax rate of 10 percent. The optimistic scenario used a revenue growth rate of 10 percent,
mortality rate of 2 percent and a 5 percent reduction in the expected production cost. The
expected scenario used a revenue growth rate of 8 percent and 5 percent mortality rate in
addition to the projected production costs. Furthermore, the pessimistic scenario used 5

51
percent revenue growth rate, 10 percent mortality rate and increased production cost by 10
percent.
The analyses across all scenarios revealed that both broiler and layer enterprises are
economically viable as they both showed positive NPVs and IRRs in excess of the 25
percent opportunity cost of capital used in the analyses. The analysis for broiler enterprise
showed a NPV of US $178,242 for the optimistic scenario, US $122,742 for the expected
scenario and US $30,550 the pessimistic scenario. On the other hand, results obtained from
layer enterprise analysis showed NPVs of US $72,388, US $49,260 and US $11,186 for the
optimistic, expected and pessimistic scenarios, respectively. In addition, the IRRs for all
scenarios were in excess of the 25 percent opportunity cost of capital used in the study.
Both enterprises are economically viable for investment. However, the small scale broiler
enterprise is more attractive for investment than small scale the layer enterprise as reflected
by the NPVs and IRRs of the two enterprises. This explains the investment seen in the
Zambian poultry industry where 60 percent of broiler producers are small scale compared
to 30 percent involved in layer production.
For actual investment purposes, it must be emphasized that further considerations
such as market availability, technical management capabilities and others should be taken
into account before investing in any of the enterprises discussed. In addition, for purposes
of good risk management and stable cash flow, a mixed investment of the two enterprises
may be desirable. Looking at the current market trends, it is important that investment in
small to medium processing facilities is taken into account if investment in the broiler
enterprise is to meet the needs of future consumers. Contract production system is also
another valuable option to think about when producing at a small scale level.
52
REFERENCES
Agriculture, Minstry of. National Agricultural Policy. Lusaka: Government of the Republic of Zambia, 2004.
B.Sarpong, Daniel, and Ramatu Al-hassan. "Evaluating the Viability of Shea Butter Production: A comparative Analysis." Research Journal of Finance and Accounting, 2012: 45.
Boehlje, and Ehmke. "Capital Investment Analysis and Project Assessment." New York, 2007.
—. Capital Investment Analysis and Project Assessment. New York, 2007.
BOZ. Rules and Market Practices for the Zambian Government Securities Market. Lusaka, 2008.
Brealey, Richard, Steward Myers, and Franklin Allen. Principles of Corporate Finance. New York: McGraw-Hill/Irwin, 2011.
Chilonda, Pius. FAO-Zambia Livestock Sector Brief. Rome: FAO, 2005.
Hadelan, Lari. "Investment Analysis of Plum Brandy Production-Methodology Approach." Budapest, 2008.
LSCS. Poultry Egg Production Guidlines for Small Scale Enterprise. Lusaka, 2007.
Mukabalai Ndiyoi, Davison Chikazunga, Orient Muloongo. "Restructuring Food Markets in Zambia." Pretoria, 2008.
Ndiyoi, Mudenda C, Louw A, Chikazunga D, Hankuku C, and Ndanga L. "Restructuring Food Markets in Zambia: Dynamics in beef and chicken subsectors." Pretoria, 2007.
Ndiyoi, Mukabalayi, Davison Chikazunga, and Orient Muloongo. "Restructuring Food Markets in Zambia: Dynamics in beef and chicken subsectors." Pretoria, 2008.
Ngosa, Mathews. "Poultry Production in Zambia." Lusaka, 2011, 3.
Ngosa, Mathews. "The Poultry Industry in Zambia." Lusa, 2012.
Ngosa, Mathews. "The Poultry Industry in Zambia." Lusaka, 2012.
Ngosa, Mathews. "The Poultry Industry in Zambia." Lusaka, 2012.
Prevatt, Walt, Jamie Yeager, George Young, Gene Simpson, and Hal Pepper. "An Investment Analysis of a Southern Mixed Enterprise Farm: Broilers and Silvopasture." Journal of the ASFMRA, 2005.

53
USDA. 2010. http://www.ers.usda.gov/StateFacts/ (accessed April 10, 2011).
ZDA. "Cost of Doing Business in Zambia." Lusaka, 2012.
—. Investor Guide Handbook. Lusaka, 2012.
—. Zambia Development Agency. December 6, 2012. www.zda.org.zm.