comparative healthcare financing trends in … · comparative healthcare financing trends in europe...
TRANSCRIPT

An IHS Life Sciences report
May 2016
COMPARATIVE HEALTHCARE FINANCING TRENDS IN EUROPE
A RETROSPECTIVE AND FORWARD-LOOKING VIEW

I. Executive summary ..................................................................................................... 3
II. Introduction ............................................................................................................... 5
III. Comparative retrospective analysis .............................................................................. 7
3.1 Public healthcare spending ................................................................................................................................ 7
3.2 Private healthcare spending ............................................................................................................................ 12
3.3 Pharmaceutical spending ................................................................................................................................ 17
3.4 Categories of care spending ............................................................................................................................. 26
3.5 Distribution of direct cancer care costs ............................................................................................................ 28
IV. Future trends analysis ............................................................................................... 31
7.1 Forecast public healthcare spending ................................................................................................................ 31
7.2 Forecast private healthcare spending ............................................................................................................... 36
7.3 Forecast pharmaceutical spending ................................................................................................................... 40
7.4 Forecast oncology pharmaceutical spending .................................................................................................... 45
7.5 Projected budget impact of emerging therapy classes ...................................................................................... 50
V. Conclusions .............................................................................................................. 55
VI. Appendix .................................................................................................................. 57
7.1 Additional country details ............................................................................................................................... 57
7.1.1 France ............................................................................................................................................................ 57
7.1.2 Germany ........................................................................................................................................................ 58
7.1.3 The Netherlands ............................................................................................................................................. 61
7.1.4 Poland ............................................................................................................................................................ 62
7.1.5 Spain .............................................................................................................................................................. 64
7.1.6 The UK ........................................................................................................................................................... 67
7.2 Macroeconomic data ...................................................................................................................................... 69
7.3 Data sources ................................................................................................................................................... 80
7.3.1 Total and private healthcare expenditures ....................................................................................................... 81
7.3.2 Categories of care spending ............................................................................................................................. 82
7.3.3 Public pharmaceutical reimbursement spending .............................................................................................. 83
7.4 Budget impact methodology ........................................................................................................................... 88

I. EXECUTIVE SUMMARY
Even before the onset of the 2008 financial crisis, European countries faced an imperative to contain costs.
Ageing populations and the growing challenge of meeting the associated healthcare demands saw countries
turn to emergency measures or embark upon substantive reforms to consolidate cost savings. In the
recessionary period that followed, cost-containment measures intensified, leading to negative or subdued
real-terms growth in public healthcare expenditures from the -3.6% compound annual growth rate over
2010-2014 observed in France to the 1.7% observed in Poland.
Despite representing a considerably smaller share of total public healthcare expenditure relative to
inpatient and ambulatory care costs, pharmaceuticals were a key target for cost containment over the
2010-14 period. Overall public-sector outlays for reimbursement spending on medicines saw significant
year-on-year (y/y) contractions in most countries, reaching 15% y/y in Poland.
Most European countries also saw higher rates of growth in private healthcare expenditure over this
period, on average three-to-seven percentage points above growth in public outlays in real terms. Rising
private contributions were associated with increases in the out-of-pocket (OOP) burden facing patients,
concentrated on pharmaceuticals in particular. Spain, one of the countries worst impacted by the financial
crisis, is estimated to have seen OOP spending increase from 78% of total
private healthcare expenditure in 2010 to 86% a year later.
This rising burden has led to serious debates surrounding the impact on access
and health outcomes. With growth in public healthcare expenditure expected
to remain negative or subdued in real terms through 2020, this raises important
questions over the potential impact on outcomes if pharmaceuticals remain a
key target for cost containment.
A reflection of gradual economic recovery, growth in overall public
pharmaceutical spending through 2020 is forecast to pick up pace relative to
the 2010-14 period in most countries. Reimbursement expenditure on oncology is expected to outpace the
pharmaceutical market as a whole, given the significant number of innovative treatments in this therapy
area anticipated to enter the market.
However, high growth scenarios envision compound annual growth of 6% to
8.4% in this expenditure, with oncology forecast to account for a broadly
comparable share of overall drug reimbursement spending relative to recent
trends. Under the high growth scenario, oncology’s share is forecast to
represent between 9% and 11% on average, with the exception of Poland at
31.2%. Budget impact analyses of some of the most significant breakthrough
treatments in breast cancer and non-small cell lung cancer suggest these
agents will absorb no more than 2.5% of projected oncology drug
The rising out-of-pocket
burden concentrated on
pharmaceuticals has led
to serious concerns
surrounding the impact
on access and ultimately
health outcomes.
Current anxieties
surrounding
sustainability of funding
for the next generation of
breakthroughs in
oncology may be
exaggerated.

reimbursement spending.
These findings, based on the potential budget impact of new treatments in some of the most common
cancers, suggest that current anxieties surrounding sustainability of funding may be exaggerated in certain
countries. Taking stock of current policy tools and the opportunities countries possess to achieve cost
savings in those areas of care which dominate spending – in particular, inpatient hospital care – forecast
expenditure appears broadly manageable.
Certain countries such as Poland and Spain are forecast to experience more acute financing challenges
given pre-existing inequities in access, other funding priorities and/or ongoing struggles to reign in deficit
spending. In these countries, a combination of already anticipated policy reforms and new policy
innovations involving broad-based stakeholder dialogue may be necessary to support comprehensive
access to emerging treatments.
This report was commissioned by AstraZeneca. All research and analysis were undertaken
independently by IHS Life Sciences.

II. INTRODUCTION
The past five years have been accompanied by a major shift in thinking in the world of healthcare. With
the genericization of atorvastatin in 2011, the era of on-patent, primary-care blockbuster drugs seemed to
have reached its high watermark. Healthcare systems around the world were prepared to benefit from the
so-called patent cliff, seeing new levels of cost containment achievable on the back of generic uptake. The
pharmaceutical industry faced serious question marks over declining R&D productivity and a dearth of
pipeline candidates.
Since that time, a new reality has emerged. The primary-care blockbuster model typified by atorvastatin
has given way to a new era of biologic and innovative small-molecule drugs broadly targeting specialist
care. A focus on targeted therapies in diseases like non-small cell lung cancer and melanoma, coupled with
progress in orphan and ultra-orphan diseases, has seen niche indications associated with premium pricing
come to play an unprecedented role in the treatment landscape.
High-cost therapies do not only reflect a move toward smaller patient
populations. The arrival of next-generation hepatitis C drugs such as sofosbuvir
has seen entry onto the market of agents associated with remarkable cure rates
that hold the potential to revolutionize treatment for relatively large numbers of
patients. Against this backdrop, question marks over the sustainability of industry
pipelines have been replaced by question marks over the sustainability of
healthcare systems.
Over the next five years, a wealth of new treatments are expected to reach the
market. Many of these innovations will be in the cancer field, where advances in immuno-oncology have
shown the potential of breakthrough treatments to significantly extend survival. Oncology will also see an
unprecedented move toward combination therapies, as emerging and existing products are found to
significantly enhance outcomes in concert in both existing and new indications.
What is without question an immense wave of progress for patients is also
posing increasingly challenging questions for policymakers, payers and
healthcare stakeholders more broadly. Accentuated by the global financial
crisis, and driven by long-term dynamics such as ageing populations and a
slowing pace of economic growth, many countries are in the midst of, or
embarking upon, major cost-saving drives. The need to address systemic
shortfalls in government financing of healthcare is pronounced in a number of
European countries. This reality means that the next wave of treatment
breakthroughs coincides with a period when cost containment is firmly on the
healthcare system agenda.
Question marks over
the sustainability of
industry pipelines have
been replaced by
question marks over
the sustainability of
healthcare systems.
The next wave of
treatment
breakthroughs
coincides with a period
when cost
containment is firmly
on the healthcare
system agenda.

Although much has been said regarding the sustainability of pharmaceutical spending, and debate has
centred in particular on list prices of emerging therapies, what has been absent so far is a critical analysis
which helps to frame the discussion in terms of broader healthcare financing trends, both recent and
forecast. The present report aims to evolve the current debate by providing such an analysis, looking at
healthcare financing trends over the retrospective period of 2010 to 2014, as well as looking forward
through 2020.
This analysis focuses on France, Germany, the Netherlands, Poland, Spain and the United Kingdom
(sometimes focused specifically on England for reasons of data availability). These countries were chosen to
represent a cross-section of Europe, reflecting a diverse set of healthcare systems, pharmaceutical pricing
and reimbursement policies, economic conditions and political circumstances. The analysis is intended to
be broadly applicable to other countries inasmuch as similarities across these factors permit extrapolation
of findings.
This report considers the structure of the healthcare market in each country with regards to public and
private contributions, how expenditure is distributed across different categories of care, and the evolution
of pharmaceutical spending both in general and with a particular focus on oncology. Exploration of these
broad trends in financing is joined by a consideration of policies pursued by these countries which have
enabled them to support access to innovations in treatment while managing costs. This retrospective
analysis lays the groundwork for a forecast of future trends through to 2020, looking to identify how market
structures and government policies are likely to position countries going forward.
In order to forecast future trends in expenditure, the analysis relies on a number of data sources and
methodologies. Top-line projections for overall healthcare and pharmaceutical spending and the
components of private market expenditure come from the IHS World Markets Healthcare Forecasts service,
which derives its forecasts based on projected economic growth and historical relationships between that
growth and various healthcare expenditure indicators. Economic growth forecasts derive from the
comprehensive macroeconomic data comprising the IHS World Economic Service.
Literature review and analysis of recent expenditure patterns and policy and cost-containment measures
were relied upon to derive a number of scenarios for future public reimbursement spending on oncology
pharmaceuticals specifically. A budget impact modelling approach was developed for a number of therapy
classes in order to interrogate these forecasts and validate their ability to absorb the financing
requirements of significant new treatments.
This report is accompanied by a detailed appendix in section VII, which outlines the data sources utilised,
offers a glossary of terms, provides various macroeconomic indicators for all countries, and explains the
above methodologies relied upon to generate the relevant forecasts and budget impact scenarios. It also
provides additional commentary on the market and policy landscapes for readers wishing to acquire further
details on a specific country.

III. COMPARATIVE RETROSPECTIVE ANALYSIS
3.1 PUBLIC HEALTHCARE SPENDING
European countries entered the crisis with both shared and unique healthcare challenges
Trends in healthcare spending between 2010 and 2014 must be placed in the context of the extraordinary
economic circumstances impacting European countries over that period. This window of time spans the
latter part of the recession sparked by the 2008 financial crisis, as well as the roots of economic recovery
since 2012.
Leading up to 2008, European countries were united in facing the secular trend of ageing populations and
the growing challenge of meeting the associated healthcare demands, creating a broad-based focus on
cost containment. Against this backdrop, however, countries exhibited different priorities and spending
commitments, some associated with reforms designed to consolidate cost savings in the long run:
France: The country faced a longstanding agenda to address the deficits plaguing its social security
system, with the national target for public healthcare spending overrun on average by EUR1.5 billion
each year since 1997.i
Germany: Despite its statutory healthcare system benefiting from relatively strong reserves, like France
the country was focused on cost containment due to its ageing population, including preparation of
major reforms to its system of free pricing for innovative pharmaceuticals.
The Netherlands: The country saw erratic growth in healthcare expenditure in the run up to the crisis,
with temporary surges in spending associated with implementation of a new statutory health insurance
system in 2006.
Poland: The country witnessed marked economic growth from the mid-1990s, helping drive an
approximately five-fold increase in total healthcare expenditure by 2009 as the government sought to
improve the relatively poor level of access and address the high out-of-pocket burden.
Spain: Like the Netherlands, the country experienced erratic growth in healthcare expenditure, seeing
periodic upticks in spending after its 17 autonomous communities took control of their healthcare
budgets in 2002.
England: Starting with the Labour government which came to power in 1997, England sought to
increase public healthcare spending as a share of GDP to bring it in line with the European average.
All countries experienced a slowdown in real-terms healthcare spending growth relative to pre-crisis
levels
As illustrated in Figure 1, in nominal terms, countries can be divided into those which saw declines in public
healthcare spending at the start of the 2010-14 period, and those which witnessed rising expenditures
throughout that time window.
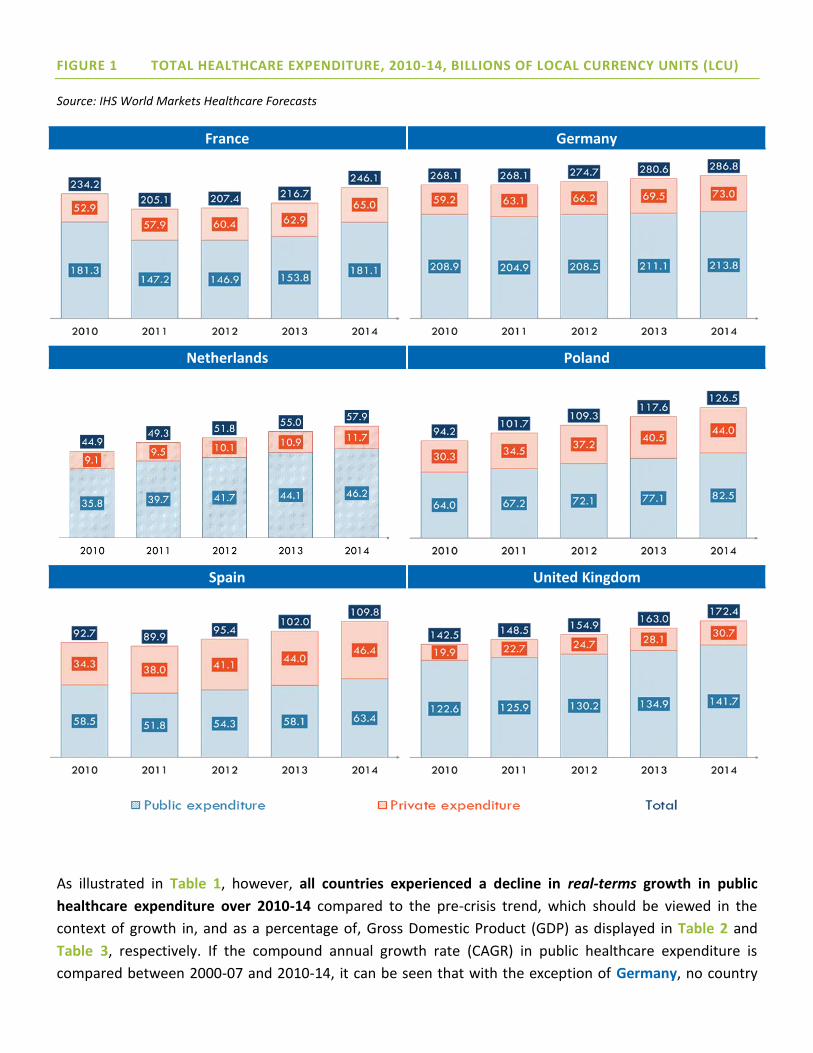
FIGURE 1 TOTAL HEALTHCARE EXPENDITURE, 2010-14, BILLIONS OF LOCAL CURRENCY UNITS (LCU)
Source: IHS World Markets Healthcare Forecasts
France Germany
Netherlands Poland
Spain United Kingdom
As illustrated in Table 1, however, all countries experienced a decline in real-terms growth in public
healthcare expenditure over 2010-14 compared to the pre-crisis trend, which should be viewed in the
context of growth in, and as a percentage of, Gross Domestic Product (GDP) as displayed in Table 2 and
Table 3, respectively. If the compound annual growth rate (CAGR) in public healthcare expenditure is
compared between 2000-07 and 2010-14, it can be seen that with the exception of Germany, no country

saw less than a four percentage-point drop in the real-terms CAGR in public healthcare spending between
the two periods.
TABLE 1 REAL-TERM COMPOUND ANNUAL GROWTH RATES IN PUBLIC HEALTHCARE EXPENDITURE,
2000-07 & 2010-14
2000-07 2010-14
France 3.1% -3.6%
Germany -1.2% -3.0%
The Netherlands 5.7% 1.6%
Poland 6.2% 1.7%
Spain 8.6% -0.9%
The UK 4.2% -1.2%
Source: IHS World Markets Healthcare Forecasts
TABLE 2 REAL AND NOMINAL YEAR-ON-YEAR GROWTH IN GROSS DOMESTIC PRODUCT, 2010-2014
2010 2011 2012 2013 2014
France Real 1.88% 2.09% 0.21% 0.75% 0.17%
Nominal 2.98% 3.05% 1.37% 1.51% 0.74%
Germany Real 3.94% 3.72% 0.62% 0.41% 1.58%
Nominal 4.87% 4.77% 1.91% 2.55% 3.35%
Netherlands Real 1.32% 1.66% -1.06% -0.41% 1.01%
Nominal 2.21% 1.81% 0.35% 0.93% 1.83%
Poland Real 3.71% 5.01% 1.55% 1.29% 3.35%
Nominal 6.11% 8.41% 3.99% 1.68% 3.79%
Spain Real 0.03% -1.00% -2.62% -1.67% 1.36%
Nominal 0.17% -0.97% -2.57% -1.11% 0.96%

The UK Real 1.54% 1.97% 1.18% 2.16% 2.85%
Nominal 4.70% 4.11% 2.82% 4.19% 4.74%
Source: IHS Global Economic Data
TABLE 3 GENERAL GOVERNMENT HEALTH EXPENDITURE AS A PERCENTAGE OF GROSS DOMESTIC
PRODUCT, 2010-2014
2010 2011 2012 2013 2014
France 8.68% 8.73% 8.83% 8.91% 9.02%
Germany 8.58% 8.31% 8.36% 8.57% 8.70%
The Netherlands 9.08% 9.09% 9.53% 9.62% 9.48%
Poland 4.90% 4.71% 4.58% 4.53% 4.51%
Spain 7.17% 7.00% 6.73% 6.50% 6.40%
The UK 7.94% 7.77% 7.80% 7.78% 7.58%
Source: World Health Organization Global Health Expenditure database
The downturn in the rate of healthcare spending growth does not necessarily reflect how severely each
country was impacted by the financial crisis. Poland, for example, avoided recession thanks to ongoing
public investments, but witnessed a decline in the CAGR in public healthcare spending of similar magnitude
to the Netherlands, where bursting of the country’s housing bubble led Dutch citizens to become some of
the most indebted in the Eurozone following the outbreak of the crisis.
Rather, these downturns reflect the extent to which different countries targeted healthcare – and in
many cases, pharmaceuticals in particular – in order to achieve cost savings in the public sector. That the
decline was relatively marginal in Germany indicates the extent to which some countries were already
undertaking significant cost-containment drives even before the onset of the crisis.
Growth in healthcare expenditure has remained subdued or faced significant cost-containment targets
since the roots of economic recovery
The roots of economic recovery saw public healthcare expenditure recover its losses by 2012 or 2013 in
France, Germany and Spain, leading to significant year-on-year (y/y) increases in some cases. However, by

period close, most countries were engaged in significant cost-savings drives or undertaking careful budget
management:
France: From 2010, the country’s annual target for health spending (l’Objectif National des Dépenses
d'Assurance Maladie: ONDAM) was limited to a maximum annual increase of 3%, subsequently revised
downwards in light of diminished economic growth prospects.
Germany: The country remained committed to cost containment, as evident even before the crisis,
with many of the associated policies focused on pharmaceutical expenditure (see discussion on trends
in pharmaceutical expenditure below).
The Netherlands: In the aftermath of the financial crisis, there was an increasing emphasis placed on
cost containment. Although the healthcare budget was allowed to grow despite a series of broader
austerity packages, growth was inevitably very subdued.
Poland: The public investments which helped Poland weather the financial crisis better than other
European countries subsequently led to concerns over the scale of public debt, weighing down on
growth in public spending relative to the pre-crisis period.
Spain: The worst impacted by the recession and Eurozone debt crisis amongst the countries considered
in this report, Spain’s economic recovery was delayed and still fragile, with persistently high levels of
unemployment and the consequent need to carefully manage outlays on healthcare as autonomous
communities struggled to balance their deficits.
The UK: The National Health Service (NHS) in England faced a target of GBP20 billion in efficiency
savings by 2015, with the scale of the deficits faced by provider organisations recognised to require
further cost savings in future.
KEY TAKE AWAY
The recent economic downturn led to significant declines in the rate of growth of public outlays on
healthcare in most European countries. However, even before the outbreak of the crisis, the secular trends
of ageing populations and reduced economic growth prospects in the developed world saw European
countries increasingly focused on cost containment. This reality meant that even countries such as Poland
and the UK, committed to aligning healthcare spending and outcomes with the European average, have had
to carefully manage new investments with cost savings.
The broad-based focus on cost containment, which has persisted beyond the recession, raises important
question marks over whether access to care and health outcomes have been negatively impacted. As the
discussion below on trends in private healthcare spending and pharmaceutical expenditure indicates, there
is reason to believe that the subdued rate of growth in healthcare spending has indeed restricted the
ability of European countries to maintain their commitment to universal access to comprehensive care.

3.2 PRIVATE HEALTHCARE SPENDING
Most European countries saw comparatively higher rates of growth in private healthcare expenditure
over 2010-14
Compared to the subdued rates of growth in public outlays on healthcare over the 2010-14 period, which in
real terms did not surpass approximately 2% y/y, European countries saw significantly higher growth in
real-terms private healthcare expenditure.
As shown in Table 4, with the exception of the Netherlands, which experienced a negative real-terms CAGR
in private healthcare spending over this time period, European countries saw private contributions toward
healthcare increase by approximately three-to-seven percentage points more y/y than public outlays in real
terms. This suggests that private sources of funding have plugged a gap left by the cost-containment
efforts characterising public-sector healthcare financing.
TABLE 4 REAL-TERM COMPOUND ANNUAL GROWTH RATES IN PRIVATE HEALTHCARE EXPENDITURE,
2010-14
2010-14 Difference relative to public outlays
France 1.5% 5.1%
Germany 1.6% 4.6%
The Netherlands -3.2% -4.8%
Poland 4.7% 3.1%
Spain 4.8% 5.7%
The UK 6.1% 7.4%
Source: IHS World Markets Healthcare Forecasts
Most European countries saw significant changes in the composition of private healthcare expenditure
over 2010-14 indicating increased financial burden on patients
Figure 2 illustrates the trajectory of private healthcare spending over 2010-14 in nominal terms, including
its composition by different funding sources.

FIGURE 2 PRIVATE HEALTHCARE EXPENDITURE, 2010-14, BILLIONS OF LCU
Source: IHS World Markets Healthcare Forecasts
France Germany
Netherlands Poland
Spain United Kingdom
N.B. The contribution of “private insurance” was removed from the graph for the Netherlands on the basis that the majority of spending in the voluntary health
insurance sector can be attributed to services such as plastic surgery or sports medicine, services which do not strictly qualify as healthcare-related for the
purposes of this report. Spending on such services may be captured in the “private insurance” contribution in other countries, thus challenging a completely like-
for-like comparison. However, due to the contribution of private insurance toward genuine healthcare-related items in these other countries, combined with
absence of data on the precise composition of this contribution, the private insurance indicator was otherwise retained, with the exception of the Netherlands.

Changes in the composition of private healthcare expenditure have been driven by trends unique to each
country:
France: The bulk of private spending is attributable to complementary insurance subscribed to by the
overwhelming majority of the population in order to offset the OOP costs otherwise required under the
public healthcare system. Due to austerity measures brought in to contain the spiraling healthcare
deficit (see the discussion on pharmaceutical expenditure below), the recessionary period saw a
dramatic increase in OOP payments, rising from 28% of overall private healthcare spending in 2010 to
34% in 2011. By period end, OOP payments accounted for 30% of the total, likely attributable to
government negotiations with the complementary insurance sector which subsequently saw the latter
expand patient coverage and contribute to the ongoing cost-savings drive.ii
Germany: In 2011, Germany’s Federal Cabinet agreed to raise the premiums paid for statutory health
insurance to the pre-crisis level of 15.5% of monthly salary – shouldered between employees and
employers – following a deficit reported by the country’s sick funds in 2010 for the first time in many
years.iii This saw OOP costs increase by a CAGR of 6.6% in nominal terms over 2010-14, rising to
account for 60% of overall private spending by period end, up from 56% in 2010.
The Netherlands: The country saw a significant increase in OOP spending, rising from 76.9% of total
private spending on healthcare to 83.8% in 2014; this trend can be explained by the steady increase in
the annual deductible required under the statutory health insurance package, more than doubling over
the period from 2009 to 2014.iv
Poland: The country made some progress with regards to its historically high levels of OOP spending
over the 2010-14 period, seeing this funding source decrease from 80% of total private expenditure on
health to 76% by period end. Over the same timeframe, growth in the country’s burgeoning market
for private insurance – dominated by employer-sponsored medical subscription packages – was
dramatic, rising to account for 9% of private healthcare expenditure in 2014, up from 4% in 2010.
Spain: Like France, the country saw a dramatic increase in OOP spending associated with
implementation of austerity measures, leading this contribution source to increase from 78% of total
private healthcare expenditure in 2010 to 86% a year later, before declining to 80% by 2014.
The UK: The country saw growth in the proportion of private healthcare spending attributable to the
private insurance market, dominated by employer-sponsored benefits.
What is noteworthy is that with the exception of France and Poland, no country exhibited a pattern of
increasing outlays from private insurance combined with reduced OOP spending, a pattern that would have
been indicative of insurers relieving the financial burden on patients imposed by the decline in public
expenditure. Even in Poland, the reduction in OOP spending had more to do with government reforms (see
discussion below) than growth in the voluntary insurance market. As such, the private insurance sector, as
it is currently structured in most European countries, would seem to have limited capacity to plug gaps in
public outlays on healthcare.

It is worth commenting on the composition of OOP spending in those countries where this funding source
accounts for an above-average share of overall private healthcare expenditure. For instance, while
prescription co-payments and spending on non-reimbursed over-the-counter medicines have historically
accounted for much of the OOP spend in Poland, Table 5 indicates that in Spain, pharmaceuticals have
actually accounted for a declining share of total OOP expenditure.
TABLE 5 PRIVATE SPENDING ON PHARMACEUTICALS IN ABSOLUTE VALUE AND AS A PERCENTAGE OF
TOTAL OUT-OF-POCKET EXPENDITURE IN SPAIN, 2010-2013
2010 2011 2012 2013
Private spending on
pharmaceutical products
(EUR mil)
3,475.40 3,520.11 3,594.27 3,738.84
Percentage of total OOP
spending 13.0% 10.7% 10.3% 10.2%
Source: EAE Business School report v
Changes in the composition of private healthcare expenditure have led to serious debates surrounding
the impact on access and health outcomes
Those countries which saw significant increases in OOP spending over the 2010-14 timeframe also
witnessed the emergence of political resistance or stakeholder concern surrounding the impact on patient
access. Whether due to introduction of new copayments as part of emergency austerity measures, or
increases in contributions to the statutory healthcare system, the rising burden on patients prompted
fears that patients would avoid seeking necessary care or face access restrictions:
In Spain, although in 2012 the Ministry of Health shifted 21 medicines, including many oral oncology
drugs, from the retail to the hospitals sector (accompanied by copayment elimination), there has been
increasing pressure to reduce reliance on this type of austerity measure. In fact, subsequent increases
to copayments for medicines, combined with proposals by the Ministry of Finance to increase user fees
in other parts of the healthcare system, led the Spanish Medical College Association to petition against
further reliance on these austerity measures in mid-2014, on the grounds it would defer patients from
seeking necessary treatment. In December of that year, the Socialist Party of Madrid proposed an
extraordinary budget item to eliminate copayments for vulnerable segments of the population,
including low-income pensioners and the disabled and unemployed without benefits, again over
concerns of the impact on access to care.vi,vii

In the Netherlands, in light of lower-than-anticipated healthcare spending, it has been suggested that
increases in cost-sharing dissuading patients from seeking care may have contributed to this
phenomenon.viii
In Germany, additional patient contributions under the statutory health insurance system have
provoked political debate, with the junior party in the governing coalition, the Social Democratic Party,
pushing for more of this additional payment to be covered by employers.
Even in those countries such as Poland where OOP spending has declined over the 2010-14 period, cost-
containment efforts targeting pharmaceuticals (see discussion below) have led manufacturers in some
cases to withdraw products from the market, with a significant potential impact on patient treatment and
outcomes. Thus, the absence of an increase in OOP burden as depicted in Figure 2 should not be equated
with lack of impact on patient access over this timeframe.
KEY TAKE AWAY
Subdued growth in public healthcare spending, driven by ongoing cost-containment efforts and worsened
by the recession, contributed to an uptick in private healthcare expenditure over the 2010-14 period. While
the composition of such spending differs across European countries, reflecting structural differences in
healthcare systems, many saw a significant increase in the OOP financial burden facing patients,
concentrated on pharmaceuticals in particular. This burden has prompted political debate and broader
stakeholder concern surrounding patient access.
3.3 PHARMACEUTICAL SPENDING
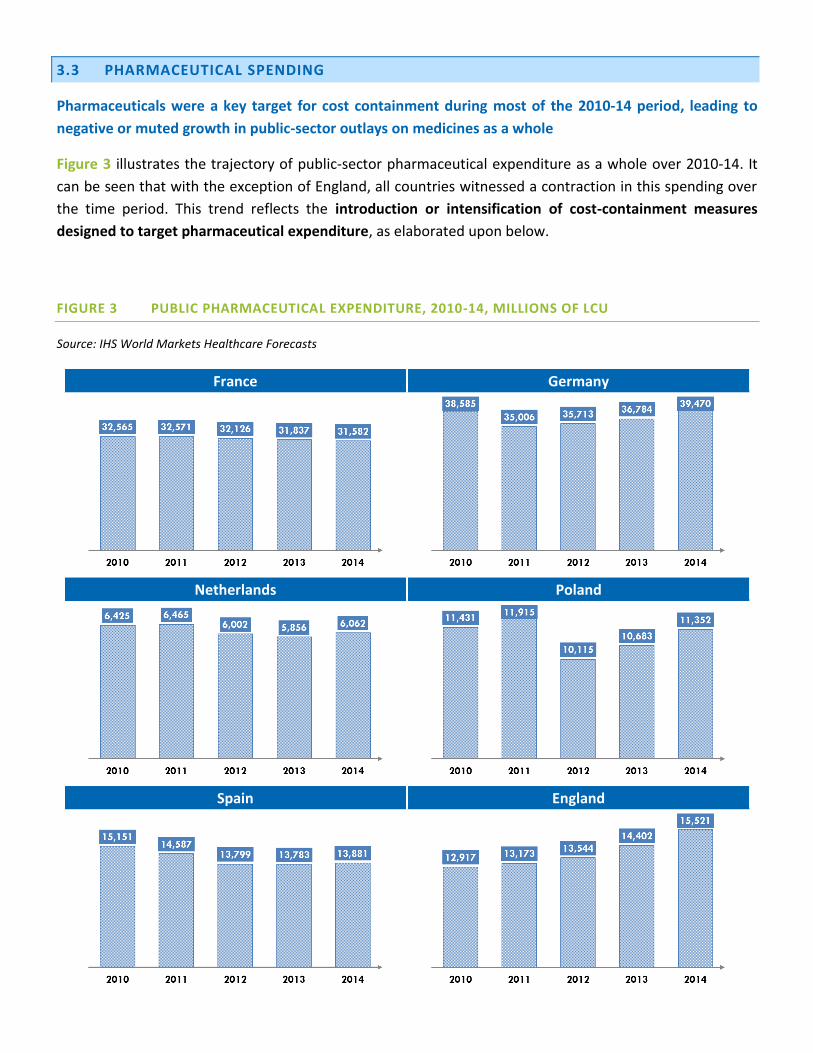
Pharmaceuticals were a key target for cost containment during most of the 2010-14 period, leading to
negative or muted growth in public-sector outlays on medicines as a whole
Figure 3 illustrates the trajectory of public-sector pharmaceutical expenditure as a whole over 2010-14. It
can be seen that with the exception of England, all countries witnessed a contraction in this spending over
the time period. This trend reflects the introduction or intensification of cost-containment measures
designed to target pharmaceutical expenditure, as elaborated upon below.
FIGURE 3 PUBLIC PHARMACEUTICAL EXPENDITURE, 2010-14, MILLIONS OF LCU
Source: IHS World Markets Healthcare Forecasts
France Germany
Netherlands Poland
Spain England

France: Cost-containment policies targeting pharmaceuticals during the recession continued the trend
of bringing in emergency measures to rein in healthcare spending in line with the ONDAM, which
generally saw the government look to achieve savings on the scale of EUR2 billion annually. This
explains the 1-2% y/y contractions seen in the market in nominal terms as displayed in Figure 3. During
the height of the recessionary period between 2010 and 2012, the government delisted and decreased
the reimbursement rates of medicines with lower Service Medical Rendu (SMR) ratings, negotiated
increasingly higher price cuts with pharmaceutical manufacturers, and increased substitution targets
and prescription controls to drive generics penetration.ix
Germany: Cost-containment measures focused heavily on pharmaceuticals, with the 2010 passage into
law of the Pharmaceutical Market Restructuring Act (Arzneimittelmarkt-Neuordnungsgesetz: AMNOG),
which ended the country’s free-pricing regime and introduced central negotiation over
reimbursement rates for innovative drugs. Throughout the recessionary period, and following deficits
reported by the statutory insurance funds for the first time in many years, the mandatory rebate for
medicines not subject to the country’s internal reference pricing system was increased from 6% to 16%,
and a price freeze (initially intended to last for three years but since extended) was introduced for all
reimbursed medicines. Large savings were also made over the period through the use of generic
discount contracts.x These policies help to explain the significant contraction in the market observed
over 2010-11 in Figure 3. The market then went on to recover its losses, driven in part by a reduction in
the mandatory rebate and entry onto the market in 2014 of a record number of innovative new
medicines, including next-generation hepatitis C therapies.xi
The Netherlands: Subdued growth in pharmaceutical expenditure stemmed from a mixture of policy
levers and market dynamics. The slowdown in spending in the community pharmacy sector was
dramatic, a 16% decline in outlays over the period from 2008 to 2013.xii One policy initiative helping to
explain this trend involved the shifting of expensive therapies from the outpatient sector to hospital
budgets, thereby reliving the basic health insurance providers of this expenditure. On top of routine
use of international reference pricing, it has been suggested that a focus on generics – aided by
preferential prescribing policies implemented by insurers – also contributed to this phenomenon.xiii
Meanwhile, the health minister entered into a coalition agreement limiting public hospital spending to
2.5% y/y over 2012-15, putting pressure on hospital drug budgets. Between 2013 and 2014, the market
showed positive growth of 4% in nominal terms, most likely attributable, as in Germany, to market
entry of expensive new medicines.
Poland: Trends in pharmaceutical expenditure must be viewed through the lens of the country’s
Reimbursement Act of 2012, a watershed year for reform of the pricing and reimbursement system.
This far-reaching piece of legislation aimed to expand access to innovative medicines while also seeking
cost savings allowing the government to meet this objective, with pharmaceutical reimbursement
spending not to exceed 17% of total public healthcare expenditure. Savings over the period relied on a
reduction in and broadening of reference pricing groups, and ongoing rounds of price negotiations with
manufacturers, with the government reportedly calling for high double-digit cuts.xiv This explains the
22% y/y contraction in the community pharmacy market in 2012, which led to a 15% contraction in
the public pharmaceutical market overall.

Spain: As in France, austerity measures targeting pharmaceuticals were brought in to curb costs during
the recessionary period, leading to y/y contractions of 3-5% at the level of the overall public
pharmaceutical market. As part of the Heath Pact entered into between the central government and
the autonomous communities, starting in 2010, reforms to the internal reference-pricing system,
generic price cuts and reimbursement limits on on-patent medicines with no generic competitors were
implemented, designed to save EUR1.5 billion.xv Mandatory discounts were introduced for innovative
medicines, price cuts were negotiated, and prescribing by active ingredient encouraged. In 2012, the
government significantly increased pharmaceutical copayments and withdrew over 400 drugs from the
reimbursement list.xvi Subsequent emergency measures, involving copayments on hospital drugs for
outpatients and a EUR1 charge on all prescriptions, saw the government backtrack following legal
challenges and resistance from the autonomous communities.xvii
England: Set against the backdrop of subdued or negative growth in public pharmaceutical expenditure
in the other countries under analysis, England is noteworthy for the upward trajectory it has shown in
such spending over the 2010-14 period, growing initially at 2-3% y/y before rising to 6-8% y/y. In
theory the country possesses a free-pricing regime, which helps to explain this trend, although in
practice most manufacturers participate in the Pharmaceutical Price Regulation Scheme (PPRS) which
imposes pricing restrictions, and price concessions offered as part of patient access schemes are a
common occurrence. The stronger growth is also a reflection of the relative lack of cost-containment
policies targeting pharmaceuticals under the NHS’ GBP20 billion cost savings drive.
The subdued growth in public-sector reimbursement spending on pharmaceuticals over the retrospective
period gave rise to concerns over patient access to treatments and the potential impact on health
outcomes
France: Debate over the impact of austerity measures targeting pharmaceuticals centered on the
ability of the complementary insurance sector to absorb additional copayments without passing
costs onto patients. Non-profit mutual insurers announced a 5% jump in their contributions directly
linked to 2010 reforms involving reimbursement cuts and daily hospital fee increases.xviii Mutualité
Française, the umbrella organisation for France's complementary insurance sector, stated that many
insurers would refuse to cover the cost of drugs subject to the new lowest reimbursement rate.
Subsequent reimbursement cuts on drugs with intermediate SMR ratings prompted insurers to
consider re-evaluating “blind” reimbursement of medicines, with calls for more selective coverage.xix
The data in Figure 2 indicate that the private insurance sector has since absorbed a significant share of
costs, but OOP payments borne by patients remain higher than at the start of the 2010 period.
Germany: The amount that patients covered by statutory health insurance made in additional
payments to make up the difference between reference prices and the actual prices of medicines
reportedly increased by 22% y/y in 2014, amounting to EUR115 million.xx The increase in the
proportion of medicines requiring additional payments rose from 4.1% of reimbursed medicines in
2013 to 6.1% during 2014. It was reported that a significant number of manufacturers opted not to
lower their prices to the level of the government’s reference prices given the ongoing cost-containment

drive. The discount contracting system, responsible for significant savings, meanwhile gave rise to
increasing reports of supply shortages impacting patient access to generic medicines.xxi
The Netherlands: As highlighted above, in light of the lower-than-anticipated outlays on community
pharmacy, it has been suggested that increases in cost-sharing may have potentially dissuaded
patients from seeking care. Over the period from 2008 to 2013, pharmacy expenditure for the
population aged 65 and over decreased by 9%, significantly above other segments of the population,
despite the expectation that expenditure on medicines might be higher in this group.xxii
Poland: Although the Reimbursement Act lowered patient copayments for medicines, continued
rounds of price negotiations have reportedly led producers to withdraw medicines from the
reimbursement system, compelling patients to pay their full cost.xxiii Where manufacturers have
agreed to the price cuts, this has reportedly contributed to large-scale parallel export, leading to
problems with medicine supply shortages.xxiv As a result, there are serious concerns regarding the
impact of the reforms on patient access to medicines as well as the consequent risk posed to health
outcomes.
Spain: As described above, continued expansion of copayments for medicines ultimately led the
government to backtrack or propose supplementary aid for the most vulnerable segments of the
population due to concerns over the impact on access and outcomes. It was reported that almost one
quarter of the drugs removed from the reimbursement list during 2012 either experienced price
increases or were withdrawn entirely from the country.xxv The cumulative impact led innovative
medicines to account for a steadily smaller share of public spending on pharmaceuticals in the retail
sector.xxvi
England: Despite continued growth in public pharmaceutical expenditure, the country continues to lag
behind some of its peers with regards to access. A report issued by Cancer Research UK in August 2015
highlighted the shortfall in molecular diagnostic testing associated with targeted therapies for solid
tumours.xxvii Based on cancer incidence data and extrapolation of testing rates from a survey of labs,
the charity estimates that in 2014, 15,929 patients missed out on molecular diagnostic testing, due
either to lack of funding or awareness. Based on mutation rates, this translates into an estimated 3,552
patients who may have otherwise been eligible for targeted therapies. These access challenges can be
compared to the system in France, for example, where a national network has led to comprehensive
biomarker testing.
The composition of public pharmaceutical expenditure in the retail sector has remained broadly
consistent over the 2010-14 period
Figure 4 illustrates the share of the public retail pharmaceutical market attributed to select therapeutic
classes over time for the years for which data are available in each country. It can be seen that
cardiovascular, alimentary tract and metabolism, and nervous system drugs (Anatomical Therapeutic

Chemical (ATC) classes C, A and N, respectively) accounted for the largest shares of such spending across
most countries.
FIGURE 4 PUBLIC RETAIL PHARMACEUTICAL EXPENDITURE BY THERAPEUTIC AREA, 2010-14
Source: IHS World Markets Healthcare Forecasts
France Germany
Netherlands Poland
Spain United Kingdom
The genericiation of a significant number of primary-care blockbuster medicines coincided with the
period under analysis – a phenomenon referred to as the “patent cliff” – helping governments to hold
down costs and contributing to the subdued growth seen in the public market for pharmaceuticals as a
whole.

ATC classes accounting for the largest shares of retail spending – namely, ATC classes A and C – benefited
more than most from the associated genericization and hence cost savings in the community pharmacy
budget.
A number of countries have reported increases in spending in the outpatient setting on categories of
medicines such as oncology which have traditionally functioned as key drivers of inpatient hospital costs.xxviii
However, it can be seen in Figure 4 that oncology accounted for only a small minority of the total public
retail market over 2010-14, staying stable over this period across countries.
Growth in public spending on hospital medicines has varied across countries, with the portion
attributable to oncology broadly comparable
Figure 5 illustrates the trajectory of public spending on hospital medicines over 2010-14. In contrast to the
negative or muted growth in public-sector outlays on medicines as a whole, it can be seen that spending in
this segment of the market varied markedly by country.
While Germany witnessed y/y contractions on the scale of 1-2%, the remaining countries saw positive
growth. That growth ranged from the 1-3% y/y observed in France and Spain to the 11-13% seen in the
Netherlands and the consistent 15% seen in England. These dramatically different trajectories in spending
can be attributed to very different policy landscapes and frameworks for cost containment as elaborated
upon above.
FIGURE 5 PUBLIC HOSPITAL PHARMACEUTICAL EXPENDITURE, 2010-14, MILLIONS OF LCU
Source: IHS World Markets Healthcare Forecasts
France Germany
Netherlands Poland

Spain United Kingdom
Of the countries which saw public outlays on hospital pharmaceuticals increase significantly, there are
varied reasons for this phenomenon, which in general diverges from the trend of the overall market
identified in Figure 3:
In Poland, nominal growth in spending ranging from 6-9% y/y can be attributed to the Reimbursement
Act which, at the same time that it sought substantial cost savings, also sought to channel some of the
liberated funds into enhanced access to innovative medicines, in particular in secondary care
In England, nominal growth of 15% y/y can be attributed to the introduction of new medicines and
increased use of specialist therapies despite the commercial concessions made as part of patient
access schemes. Notably, oncology’s share of total hospital drug expenditure appears to have declined
even over a period where the Cancer Drugs Fund (CDF) overran its budget, suggesting there have been
cost offsets in baseline commissioning of cancer therapies
In the Netherlands, the nominal growth of 10-13% y/y has been corrected for the shifting of expensive
therapies from the outpatient sector to hospital budgets over this period, indicating this phenomenon
represents genuine spikes in expenditure in sharp contrast to the trend in community pharmacy
Figure 5 also illustrates the share of public spending on hospital medicines attributable to oncology in
particular where these data are available. It can be seen that this share is broadly comparable across

countries, ranging from 20-27%. The higher and steadily increasing share in the Netherlands reflects the
addition of outpatient oncology medicines to the hospital budget as described above.
In those countries where routine estimates of public hospital drug spending by therapeutic area are
available, oncology accounts for the largest single category of spending by a fair margin. Figure 6 illustrates
the distribution of public reimbursement spending on hospital medicines across therapeutic areas in France
and Germany.
FIGURE 6 PUBLIC HOSPITAL PHARMACEUTICAL EXPENDITURE BY THERAPY AREA, FRANCE &
GERMANY
Source: l’Agence nationale de securite du medicament et des produits de santé; Bundesverband der Pharmazeutischen Industriexxix
France (2013)
Germany (2014)

KEY TAKE AWAY
Public reimbursement spending on pharmaceuticals saw negative or muted growth over most of the 2010-
14 period, reflecting the targeting of this sector for cost-containment efforts as well as the impact of the
“patent cliff” which helped governments hold down costs in community pharmacy. Trends in
reimbursement spending on pharmaceuticals in the hospital sector varied more markedly, but the share
attributable to oncology was broadly comparable.
The targeting of pharmaceuticals for cost containment gave rise to concerns over patient access to
treatments and the potential impact on health outcomes, key learnings applicable to ongoing and future
cost-containment efforts.

3.4 CATEGORIES OF CARE SPENDING
Over 2010-14, the composition of public healthcare expenditure across categories of care has remained
broadly consistent
Figure 7 illustrates the distribution of total public healthcare expenditure across discrete categories of care
for the years for which data were available.
FIGURE 7 PUBLIC HEALTHCARE EXPENDITURE BY CATEORIES OF CARE, 2010-14
Source: IHS World Markets Healthcare Forecasts
France Germany
Netherlands Poland
Spain England

The data should be interpreted with caution, as governments classify categories of care differently.
However, within each country, it can be seen that the composition of public healthcare spending has
remained essentially constant over the retrospective period. This consistency might be expected given the
short timeframe relative to the timescales necessary to see significant shifts in care delivery and
organisation.
Inpatient services continue to account for the largest portion of expenditure
The share of spending accounted for by inpatient services has remained largely stable, despite countries
pursuing reforms seeking operational efficiency savings in this sector. Rationalization of hospital costs
formed a key part of France’s austerity measures during the recession for example, with 50% of the EUR2.4
billion in savings in 2011 expected to come from this sector.
In England, hospital efficiencies played a key role in the GBP20 billion in savings required of the NHS by
2015. In an independent review by Lord Carter of Coles for the Department of Health (the “Carter review”),
unwarranted variation in resource utilization by NHS hospitals is estimated to cost the system an
additional GBP5 billion out of the GBP55.6 billion spent annually.xxx
The fact that inpatient hospital costs as a share of total public healthcare expenditure have remained flat,
or decreased only very marginally as in the Netherlands and Spain, suggests that the inpatient segment of
care – which continues to account for the bulk of healthcare spending by some margin – should be a key
target for cost containment.
Medicines account for a comparatively smaller share of overall public healthcare expenditure
In contrast, pharmaceuticals (either alone or in combination with other nondurable medical goods,
depending on how data are reported) account for a comparatively smaller share of overall public healthcare
spending. It can be seen in Figure 7 that this share has decreased over 2010-14 in nearly all of the
countries under analysis, generally falling by two-to-four percentage points.
KEY TAKE AWAY
Although most European countries have sought to shift care out of hospital and into the home or
community setting, the inpatient segment continues to dominate the bulk of care expenditure.
Pharmaceuticals were a key target for cost-containment efforts over the 2010-14 period, but represent a
comparatively smaller share of healthcare spending. Going forward, inpatient care presents a significant
opportunity to realise cost savings.

3.5 DISTRIBUTION OF DIRECT CANCER CARE COSTS
Inpatient services represent the bulk of direct cancer care costs across European countries
Data on overall cancer care costs and its distribution across discrete categories of care are not consistently
gathered across European countries, and the figures which do exist do not adhere to a standardised
framework. As such, it is difficult to make precise like-for-like comparisons among the national-level data
sets that do exist. With these caveats in mind, the data illustrated in Figure 8 and Figure 9 provide general
insights into the scale and structure of cancer care spending and whether, at a broad level, there are
similarities across countries.
FIGURE 8 DISTRIBUTION OF DIRECT CANCER CARE COSTS I
France Germany (2009)
Source: Institut National du Cancer
xxxi
Source: Luengo-Fernandez R et al. (2013)xxxii
Netherlands Poland (2011)
Source: Cost of illness tool, Volksgezondheidenzorg
xxxiii
Source: NFZ, 2014xxxiv

FIGURE 9 DISTRIBUTION OF DIRECT CANCER CARE COSTS II
Spain (2011) England (2009)
Source: Sociedad Española de Oncología Médica, 2013
xxxv
Source: London Cancer New Drugs Group, 2014xxxvi
Allowing for the inevitable differences in how items are assigned to care categories, it can be seen that
patterns of direct cancer care expenditure are broadly similar across countries. Inpatient hospital costs
have accounted for the largest share of direct cancer care costs.
In Germany, the Netherlands and Spain, figures for inpatient care, hospital and specialist care, and
hospital admissions are reported respectively. In Germany and Spain, this care accounted for 66% and
62% of direct cancer care costs in 2009 and 2011, respectively, while in the Netherlands, it increased
from 65.3% in 2003 to 72.6% in 2011. The higher share in the Netherlands may be attributable to the
inclusion of certain specialist care costs which are not captured in this category in the other countries.
A like-for-like comparison with the remaining countries is difficult as they split out costs on other items
such as surgery and radiotherapy, some of which will be attributable to the inpatient setting and some
of which pertain to procedures conducted on an outpatient basis. In terms of radiotherapy, France and
Poland reported a larger share of total costs attributable to this category, at 12% and 18.9%,
respectively, in comparison to Spain and England, both at 5%.
In comparison to the proportion of spending allocated to inpatient care, direct cancer care costs in the
ambulatory sector are limited. Primary care costs are split out in Germany and the Netherlands, where
they accounted for a similar 2% and 5% of expenditure respectively. Outpatient spending, presumed to
capture all ambulatory care distinct from that in the primary care sector, accounted for a similar 11% in
Germany and 8% in England. Spending on palliative care, reported in France and England, accounted for
approximately 5% of costs in both cases.

Pharmaceuticals make up a smaller share of direct cancer care costs
For those countries which split out chemotherapy costs from other spending categories, it can be seen that
this item accounted for a broadly similar share, ranging from 26% in Spain to 32% in France and 35.6% in
Poland. Drug costs as a whole were reported in Germany and England, both at 18%. Caution should be
taken when comparing chemotherapy and drug costs in particular, as it is not always apparent how
acquisition costs versus preparation and administration costs are allocated. Another caveat is that the
Spanish data do not include onco-haematological drugs.
KEY TAKE AWAY
Inpatient services account for the lion’s share of direct cancer care costs and largely overshadow the
expenditure incurred by oncology drugs. There is an argument for the continued cost-containment drive
to focus on improving efficiency savings in non-drug spending categories, particularly to accommodate the
future generation of pipeline medicines that are anticipated to require administration in the hospital
setting, even if on an outpatient basis.

IV. FUTURE TRENDS ANALYSIS
7.1 FORECAST PUBLIC HEALTHCARE SPENDING
Over 2015-20, growth in public healthcare expenditure is expected to remain negative or subdued in real
terms
Figure 10 illustrates the forecast for topline healthcare expenditures from 2015 to 2020.
FIGURE 10 FORECAST TOTAL HEALTHCARE EXPENDITURE, 2015-20, BILLIONS OF LCU
Source: IHS World Markets Healthcare Forecasts
France Germany
Netherlands Poland
Spain United Kingdom

Table 6 indicates the projected CAGRs of public healthcare expenditure in real terms, which should be
viewed in combination with the forecast for y/y growth in GDP as displayed in Table 7. In most countries,
the projected growth rates in public healthcare expenditure translate into an improvement relative to the
2010-14 period.
The improvement is forecast to be greatest in France, the UK and Germany, a reflection of stronger
forecast economic growth predicted to lift public outlays on healthcare, although as elaborated upon
below, specific cost-containment targets place limits on spending.
In comparison, the Netherlands and Poland are expected to see marginal improvements, a reflection of
the above-average CAGRs in public healthcare expenditure seen over 2010-14, when most countries
saw negative real-term CAGRs.
In Spain, real-terms growth in public healthcare expenditure is forecast to be negative, reflecting
comparatively weaker economic growth prospects and the need to contain costs in line with deficit
targets. In nominal terms, public healthcare spending is expected to grow 2-3% y/y, with cost-
containment likely to be derived from pharmaceutical policy, which may be more accentuated if a left-
wing coalition forms the next Spanish government.
TABLE 6 FORECAST COMPOUND ANNUAL GROWTH RATES IN PUBLIC HEALTHCARE EXPENDITURE,
2015-20
Real-terms CAGR Difference relative to 2010-14
France 2.1% 5.7%
Germany -0.9% 2.1%
The Netherlands 1.9% 0.3%
Poland 2.8% 1.1%

Spain -1.3% -0.4%
The UK 2.1% 3.3%
Source: IHS World Markets Healthcare Forecasts
TABLE 7 REAL AND NOMINAL FORECAST YEAR-ON-YEAR GROWTH IN GROSS DOMESTIC PRODUCT,
2015-2020
2015 2016 2017 2018 2019 2020 2014
France Real 1.16% 1.25% 1.39% 1.34% 1.30% 1.44%
Nominal 2.29% 2.39% 2.82% 3.24% 2.97% 3.22%
Germany Real 1.45% 1.85% 2.02% 1.72% 1.51% 1.67%
Nominal 3.53% 3.73% 3.78% 3.33% 3.04% 3.14%
Netherlands Real 1.99% 1.36% 1.97% 1.77% 1.79% 1.81%
Nominal 2.38% 3.27% 4.12% 3.58% 4.17% 3.91%
Poland Real 3.61% 3.75% 3.26% 3.24% 2.97% 2.96%
Nominal 4.13% 4.65% 5.40% 5.40% 5.22% 5.21%
Spain Real 3.21% 2.73% 2.37% 2.27% 2.12% 2.03%
Nominal 3.84% 3.60% 3.70% 3.89% 3.77% 3.68%
The UK Real 2.33% 1.92% 2.48% 2.37% 2.29% 2.30%
Nominal 2.61% 2.57% 4.22% 4.66% 4.48% 4.38%
Source: IHS Global Economic Data
Cost-containment targets and the need to carefully manage expenditure versus other priorities are
forecast to continue to weigh on healthcare outlays
In absolute terms, forecast growth rates remain subdued, and even in Germany, despite the improvement
relative to the 2010-14 period, growth is forecast to be negative in real terms. On a country by country
basis, the reasons for the continued plateau in public healthcare spending are varied:

France: Given the persisting challenge of tackling social security deficits, the country’s ONDAM has
been revised downwards, set to 1.75% for 2016. xxxvii This reduces spending growth to an historic low.
The country’s stability programme envisions an ambitious target of EUR50 billion in savings by 2017.
Marisol Touraine, the French health minister, announced a series of cost-containment measures in the
social security financing act for 2016, including promotion of generics, reductions in medicines prices
and efficiencies in hospital spending.
Germany: With a significant share of public hospitals in Germany recording deficits, in 2015 the country
passed a law intended to reduce overcapacity as well as unnecessary operations in secondary
care.xxxviii It has been predicted that the law will result in additional spending of up to EUR5.4 billion by
2020, although this includes setting up systems and collaborative networks that will enable a
streamlining of operations, so its ultimate goal will be one of cost containment. Combined with the
major focus on cost containment in pharmaceutical expenditure, this drive means Germany is one of
two countries alongside Spain predicted to see a negative CAGR in total public healthcare spending
over 2015-20.
The Netherlands: Government finances are improving given past fiscal consolidation efforts, and the
Rutte government has agreed an austerity package spanning 2014-17 in a bid to reach a structurally
balanced budget by 2017. Although there are specific cost-containment efforts centered on the
country’s expensive system for long-term care, the main approach for the broader healthcare system
relies on promoting market forces and efficiency improvements.xxxix A controversial proposal from the
government to allow insurers to restrict choice of providers to only the most efficient (free choice
would have been associated with a higher premium) has since been altered to offer patients who select
preferred providers discounts on their premiums after originally being rejected by the Senate.xl The
latest proposal is envisaged to generate savings of about EUR1 billion, in the absence of which it will be
difficult to make further progress controlling health spending prior to the government’s term ending in
2017.
Poland: While the dynamism of the economy in the early 2000s enabled the government to support
the country through the recession impacting the rest of Europe, concerns about the scale of debt have
since weighed on public spending. At the same time, with the recent election of the Law and Justice
(Prawo i Sprawiedliwość) party, the new government intends to increase the share of GDP spent on
public healthcare from just over 4% to 6%. However, set against a number of other expensive
campaign pledges, including bringing the retirement age back to its previous level and providing a
statutory monthly sum for families with two or more children, this ambition will only be realised with
significant cost savings achieved in other areas.
Spain: The future direction of healthcare will hinge on resolution of the continued political uncertainty
stemming from the indecisive December 2015 national election, as well as whether any of the tax cuts
(with the potential to increase the deficit) unveiled during the election year are reversed. The Socialists
pledged during the election campaign to petition the European Commission to relax deficit targets set
for Spain, which has been in the corrective arm of the Stability and Growth Pact since April 2009.
However, the next government is expected to make significant healthcare budget adjustments,

particularly pertaining to greater management of drug spending as recommended by the European
Commission, in order to meet deficit objectives.
England: The political agenda to improve the country’s standing relative to average European spending
on healthcare places limits on the degree of cost containment going forward. Nonetheless, the English
NHS faces serious budgetary challenges, with the anticipation that the funding gap will reach GBP30
billion in 2020, assuming funding rises in line with inflation and no efficacy savings are made.xli The
government therefore expects the NHS to make efficiency savings of some GBP22 billion by this time.
These savings are expected to be realised through measures such as better staff roster management,
procurement efficiencies, reduced unnecessary hospital admissions, and improved stock management
of medicines.xlii
KEY TAKE AWAY
The forecast trend for continued subdued or negative real-terms growth in public outlays on healthcare is a
reflection of diminished economic growth prospects across the developed world, combined with the
persistence of structural economic issues which were not resolved by austerity measures during the crisis.
A full decade of subdued growth – a phenomenon already apparent in some countries even before the
financial crisis – raises important questions over the potential impact on outcomes if pharmaceuticals
remain a key target for cost containment at a time when healthcare demands are increasing due to
ageing populations, and patients have already seen significant increases in OOP spending.

7.2 FORECAST PRIVATE HEALTHCARE SPENDING
Over 2015-20, rates of growth of private healthcare expenditures are once again predicted to exceed
those of public outlays
Figure 11 illustrates the forecast for private healthcare expenditures from 2015 to 2020.
FIGURE 11 FORECAST PRIVATE HEALTHCARE EXPENDITURE, 2015-20, BILLIONS OF LCU
Source: IHS World Markets Healthcare Forecasts
France Germany
Netherlands Poland
Spain United Kingdom

The marginal improvements in the forecast rates of growth in public outlays on healthcare mean that as in
the retrospective period, private spending will be required to offset likely shortfalls in public-sector ability
to cater to rising healthcare demand.
However, as captured in Table 8, the difference between the projected rates of growth of the private
market and public outlays are forecast to be weaker compared to the retrospective period (reflecting in
part the marginal improvements in public spending itself), raising questions over the extent to which the
private market will be able to absorb healthcare demand if public resources prove inadequate.
TABLE 8 FORECAST COMPOUND ANNUAL GROWTH RATES IN PRIVATE HEALTHCARE EXPENDITURE,
2015-20
Real Difference relative to public outlays
France 2.4% 0.3%
Germany 1.6% 2.5%
The Netherlands 1.9% 0%
Poland 5.5% 2.7%
Spain 3.2% 4.5%
The UK 3.9% 1.8%
Source: IHS World Markets Healthcare Forecasts
The period over 2015-20 is predicted to see changes in the composition of the private market in a number
of European countries, in particular leading to greater OOP burdens for patients
France: France’s system for national health expenditure targets is intended to achieve savings without
compromising quality of care or shifting significant additional cost burden onto patients. While reports
have been put forward considering reforms to the country’s system for reimbursement of chronic
diseases (known as Affection de Longue Dureé: ALD) as well as the general three-tier system of
reimbursement rates for medicines, in reality the political system is not perceived to be favourable to
such sweeping changes. xliii Furthermore, the complementary insurance sector has already absorbed
costs (as highlighted in Figure 2 above) and it is unclear what additional costs this sector can absorb
before they are passed on to patients in the form of increased cost-sharing. As such, unlike some of the
other countries under analysis, the composition of the private market is expected to remain broadly
stable in France.

Germany: Since the beginning of 2015, the “additional” contribution (Zusatzbeitrag) to the statutory
insurance system for which employees are liable (traditionally 0.9% of pre-tax salary) can be freely set
by funds within defined limits. Although the average additional contribution rate was expected to rise
to 1.1% by 2016, it was reported early that year that 25 funds were charging more than this rate.xliv This
increase in cost sharing, coupled with the trend for rising payments on pharmaceuticals priced above
the reference reimbursement rate (see discussion on trends in pharmaceutical expenditure above), is
forecast to see OOP spending account for a growing share of private market expenditure, and growth
of the latter at a higher rate relative to public outlays.
The Netherlands: OOP payments are projected to account for a rising share of the private
marketplace, increasing from 85.7% in 2015 to 92.1% in 2020. This trajectory reflects trends in cost
sharing under the Dutch statutory health insurance system which, as discussed above, saw the annual
deductible more than double over the period from 2008 to 2014 to reach EUR375 in 2015. In 2016, this
deductible increased by EUR10, and premiums were expected to increase by EUR7 to an average of
EUR103 per month owing to higher healthcare costs. Going forward, the government is anticipated to
be more wary of enabling insurers to continue to pass rising costs on to patients.
Poland: Private insurance is set to rise from representing 9% of total private healthcare spending in
2014 to accounting for 29.3% in 2020, representing a nominal-term CAGR of 30.1%. In tandem, OOP
payments are forecast to fall from representing 75.4% of the private market in 2014 to 69.7% in 2020,
indicating that the rising contribution from the private insurance sector is not associated with a
significant offset of the comparatively high OOP spending patterns. Rather, the category of total
“other” private spending (including spending, for example, by charities and other institutions not
otherwise captured) is set to see a dramatic decline at a CAGR of 38.1% through 2020. These trends
reflect a maturation of the market as more employers are projected to offer medical subscription
packages in the country’s bourgeoning voluntary insurance sector.
Spain: OOP payments are forecast to account for an increasing share of private healthcare spending,
rising from 38.2% in 2015 to 52.4% in 2020, and helping drive growth of the overall private market. This
trend reflects increasing cost shifting to patients under measures to combat the budget deficit, but
also the relatively stronger contribution of private sources toward overall healthcare spending in Spain.
With specialists' fees generally more affordable than in other European countries, a significant
proportion of citizens seek private healthcare. This is true not only of affluent classes in urban areas,
but is also relatively common in rural areas where private specialists are often seen as a priority for
children and the elderly.xlv There are signs of renewed uptake of private health insurance as
dissatisfaction with constrained public services increases amongst citizens who can afford to pay
premiums, and autonomous communities that reduced public healthcare spending in 2012 and 2013
saw a rise of market share in private health insurance, a trend that is likely to continue.xlvi However, this
will be set against fewer workers being covered by employer-sponsored policies and a still limited
culture of opting for individual private coverage.
The UK: The private market is expected to remain relatively stable in terms of composition. The
broad-based political consensus around universal access to care limits scope for greater user fees, and

individual purchases of private medical insurance have been shown to be unresponsive to tax relief
(leading the Labour government in England to abolish the subsidy in 1997), meaning that the market
for private healthcare remains largely reliant on trends in employer-sponsored insurance.xlvii
KEY TAKE AWAY
Subdued growth in public healthcare spending over 2010-14 contributed to an uptick in private healthcare
expenditure, a trend which is forecast to continue over the 2015-20 timeframe. However, a number of
European countries saw patients or private insurers absorb significant new costs over 2010-14, posing
potential challenges to their ability to accommodate additional future funding gaps in public healthcare
provision. In other countries, political resistance to increased user fees or private-sector involvement
represents a significant obstacle to the private market absorbing shortfalls in public outlays.

7.3 FORECAST PHARMACEUTICAL SPENDING
Over 2015-20, growth in overall public pharmaceutical spending is forecast to pick up pace relative to the
2010-14 period in most countries
Even before the close of the 2010-14 period, a number of European countries saw an uptick in
pharmaceutical expenditure, driven in part by entry onto the market of an above-average number of high-
cost innovative therapies, notably next-generation hepatitis C treatments. In 2014, 45 new active
substances became available in Germany for instance, the largest number of new innovative medicines for
any one year in history..xlviii
Looking forward to 2020, a large number of new therapies, many offering breakthroughs in treatment in
oncology in particular, are set to enter the market.xlix As in 2013-14, with many treatments with significant
potential budget impact entering the market over the same time period, there will almost certainly be an
uptick in drug reimbursement spending.
Figure 12 illustrates the 2015-20 forecast for public pharmaceutical reimbursement spending based on
projected economic growth and historical relationships between that growth and healthcare expenditure.
These forecasts assume continued economic recovery, leading to upticks in reimbursement spending which
will need to be stretched to accommodate emerging new treatments.
FIGURE 12 FORECAST PUBLIC PHARMACEUTICAL EXPENDITURE, 2015-20, BILLIONS OF LCU
Source: IHS World Markets Healthcare Forecasts
France Germany
Netherlands Poland

Spain England
The change in the forecast rate of growth of public pharmaceutical spending and how it relates to the 2010-
14 trend varies by country:
France: After contracting y/y over most of the 2010-14 period, growth in public pharmaceutical
spending is expected to increase at a nominal rate of 4-5% y/y going forward, reflecting medium-term
improvements in broader economic growth.
Germany: Growth in public pharmaceutical spending is projected to persist in line with the 2010-14
trend, averaging 1-2% y/y in nominal terms.
The Netherlands: Public pharmaceutical spending is forecast to increase at 1.5% y/y in nominal terms,
following the series of contractions observed over 2010-14. While there are forecast improvements in
broader economic growth given ongoing fiscal consolidation, cost containment remains high on the
government agenda, in particular for spending on drugs in hospital.
Poland: Growth in public pharmaceutical expenditure is forecast to temper slightly, down to a
nominal 3% y/y in comparison to the 4-6% y/y growth observed over 2010-14 (with the exception of
the contraction over 2011-12 due to implementation of the Reimbursement Act). The need to close the
gap in access to treatments with regards to peer countries means that pharmaceutical are expected to
continue to be prioritized to some degree, even against the backdrop of constrained public resources.
Spain: As in France, the retrospective period defined by successive contractions in public
pharmaceutical spending is forecast to give rise to growth at 3% y/y in nominal terms. This projection
is driven by improving economic growth prospects, although ongoing deficit challenges will constrain
resources and require the autonomous communities to manage budgets very carefully.
England: The government’s commitment to closing the gap in healthcare spending in relation to peer
countries, combined with improving economic growth prospects, means that public pharmaceutical
spending is forecast to grow at a nominal 4-5% y/y, roughly in line with the 3-7% y/y observed over
the 2010-14 period.
The trajectory of public pharmaceutical spending as a share of overall public healthcare expenditure is
forecast to vary across countries

The year 2014, for the reasons outlined above, represents a time when a significant number of high-cost
new treatments were entering the market while countries were simultaneously engaged in cost-
containment efforts. That year’s pharmaceutical spending as a share of overall healthcare expenditure can
thus be viewed as a conservative measure of what countries might need to contribute to drug expenditure
in order to maintain sufficient levels of access to new treatments.
As displayed in Table 9, in Germany, the Netherlands and Spain, pharmaceutical reimbursement is forecast
to account for a growing share of overall public healthcare expenditure relative to 2014, although in most
cases rising only marginally. In France, Poland and England, pharmaceutical reimbursement is forecast to
account for a declining share.
TABLE 9 FORECAST PUBLIC PHARMACEUTICAL SPENDING AS A SHARE OF TOTAL PUBLIC HEALTHCARE
EXPENDITURE, 2015-20
2015 2016 2017 2018 2019 2020
France 15.8% 15.4% 15.4% 15.5% 15.6% 15.6%
Germany 18.4% 18.5% 18.6% 18.7% 18.8% 19.0%
The Netherlands 12.4% 12.5% 12.1% 11.6% 11.2% 10.8%
Poland 13.2% 12.2% 11.8% 11.4% 11.1% 10.8%
Spain 21.8% 22.2% 22.9% 23.4% 23.8% 24.0%
England 10.7% 10.6% 10.5% 10.5% 10.4% 10.3%
Source: IHS World Markets Healthcare Forecasts
Taking the difference in spending between the two scenarios – i.e., the above forecasts and a scenario
where reimbursement spending is maintained at the 2014 level relative to projected overall public
healthcare expenditure – gives an idea of the scale of the potential spending shortfall facing France, the
Netherlands, Poland and England in terms of what would be required to enable access to emerging
treatments.
Figure 13 displays the resulting shortfalls by country from 2015 to 2020.
FIGURE 13 FORECAST SHORTFALL IN PUBLIC PHARMACEUTICAL EXPENDITURE RELATIVE TO 2014,
2015-20, MILLIONS OF LCU
Source: IHS Life Sciences analysis
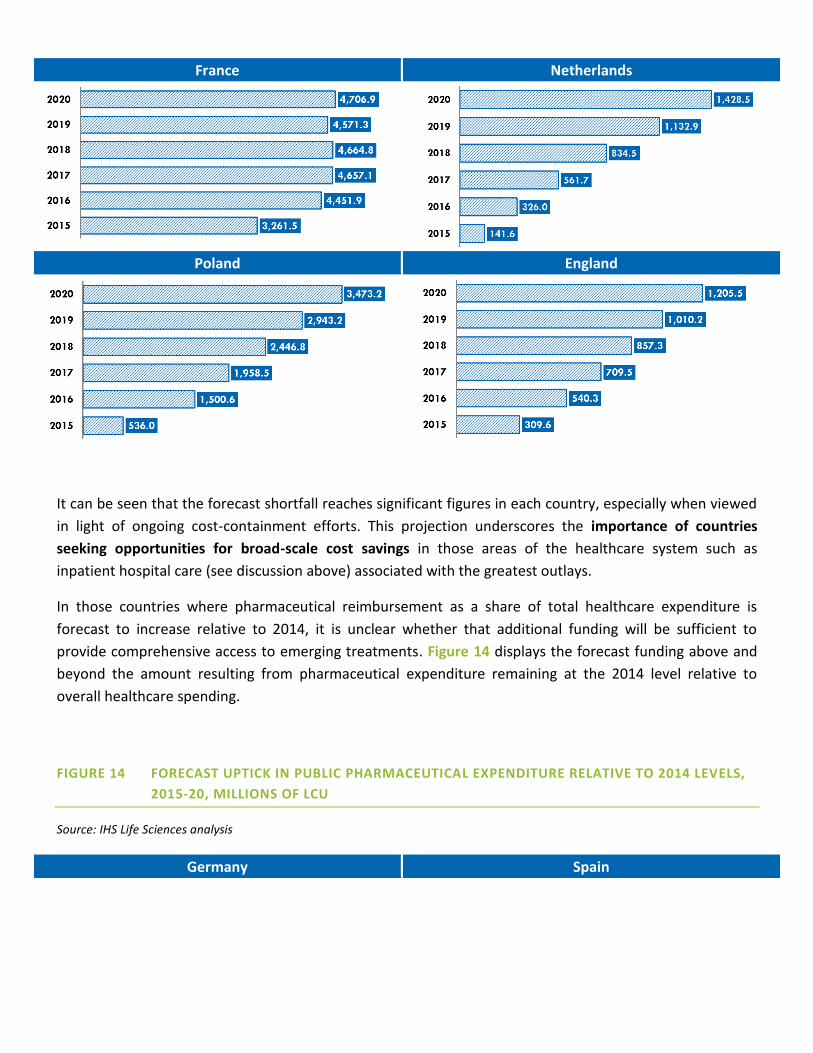
France Netherlands
Poland England
It can be seen that the forecast shortfall reaches significant figures in each country, especially when viewed
in light of ongoing cost-containment efforts. This projection underscores the importance of countries
seeking opportunities for broad-scale cost savings in those areas of the healthcare system such as
inpatient hospital care (see discussion above) associated with the greatest outlays.
In those countries where pharmaceutical reimbursement as a share of total healthcare expenditure is
forecast to increase relative to 2014, it is unclear whether that additional funding will be sufficient to
provide comprehensive access to emerging treatments. Figure 14 displays the forecast funding above and
beyond the amount resulting from pharmaceutical expenditure remaining at the 2014 level relative to
overall healthcare spending.
FIGURE 14 FORECAST UPTICK IN PUBLIC PHARMACEUTICAL EXPENDITURE RELATIVE TO 2014 LEVELS,
2015-20, MILLIONS OF LCU
Source: IHS Life Sciences analysis
Germany Spain

N.B. In both countries, the projections for 2015 resulted in a minor shortfall instead of uptick in public pharmaceutical expenditure, which was recast as zero for
the purposes of graphical display.
In light of the reports described above identifying significant existing access challenges to innovative
medicines in Spain, it is unclear whether this additional forecast funding will be sufficient to enable access
to emerging treatments. In order to gain further insights into the scale of the potential funding shortfall
facing all countries, it is informative to look at forecast spending in oncology in particular (given the number
of new treatments in this field), discussed directly below.
KEY TAKE AWAY
Over the retrospective period, the patent cliff helped to hold down costs in the community pharmacy
sector. Going forward, increasing generic penetration rates will continue to represent a cost-savings
strategy in countries such as France, Poland and Spain, where generic uptake remains comparatively low.
The new wave of biosimilars will help to contain costs more broadly across countries.
Emerging new treatments and continued economic recovery will contribute to an uptick in public
reimbursement spending on pharmaceuticals. In some countries this spending is forecast to be less as a
share of overall public health expenditure compared to 2014, raising question marks over the ability to
finance new innovations in therapy. This underscores the importance of achieving cost savings in other
parts of the healthcare system in order to ensure equitable access new treatments.

7.4 FORECAST ONCOLOGY PHARMACEUTICAL SPENDING
Over 2015-20, growth in public oncology pharmaceutical spending is expected to outpace the broader
pharmaceutical market
As discussed above, over the 2015-20 period, a significant number of innovative new therapies in
oncology are anticipated to enter the market. Many are expected to represent breakthroughs in treatment
in areas such as breast cancer and non-small cell lung cancer capable of significantly extending survival.
These agents are being studied in multiple lines of therapy, as well as in combination with pre-existing and
other emerging treatments.
As a result, growth in public expenditure on oncology medicines through 2020 is forecast to outpace public
drug reimbursement spending as a whole. Figure 15 illustrates a variety of future growth scenarios for
each country, based on literature review as well as analysis of recent spending patterns and cost-
containment efforts.
FIGURE 15 FORECAST PUBLIC PHARMACEUTICAL EXPENDITURE ON ONCOLOGY, 2015-20, BILLIONS OF
LCU
Source: IHS Life Sciences analysis
France Germany
Netherlands Poland
Spain England

Individual countries are expected to manage topline pharmaceutical expenditure and facilitate access to
emerging new treatments in a variety of ways
In those countries forecast to see pharmaceutical reimbursement as a share of total public healthcare
expenditure increase relative to the 2014 ratio (Germany, the Netherlands and Spain), it is clear on the
basis of Figure 15 that projected spending in oncology will absorb more than this additional level of funding.
With cost savings in other parts of the healthcare system – notably in inpatient hospital care – this level
of funding seems broadly achievable however in order to ensure equitable access to emerging
innovations in treatment.
In trying to gauge the funding requirements of future oncology treatments, and the impact on capacity to
finance innovations in other therapy areas as well, it is useful to consider the potential each country has for
managing topline pharmaceutical expenditure:
France: Given the country’s still relatively fragile economic recovery, the government is expected to
rely on a variety of measures to control pharmaceutical expenditure, including a major increase in the
penetration of generics, and continued savings through negotiating price cuts and lowering the so-
called L rate ("taux L"), spending above which incurs a payback from pharmaceutical companies. Ability
to enable access to new treatments at the country’s historically generous level will depend on the
success of the stability programme aiming for EUR50 billion in savings by 2017. With hospital care a
centerpiece of this effort, France has a critical opportunity to realise significant efficiencies and direct
major savings toward sustaining access to new treatment innovations.
Germany: Trends in pharmaceutical expenditure going forward will be influenced by the political
developments following broad-based calls for reform of AMNOG. Options on the table include benefit
assessment of pre-AMNOG drugs in exceptional cases (such as when a pre-AMNOG medicine gains
approval in a significantly different indication), as well as introduction of a turnover threshold for new
innovative drugs during the year of free pricing which, if it is exceeded in the course of that year, will
result in the reimbursement price coming into effect before the end of the 12-month period. Another
option is to expand the use of drug class-wide tendering. While the country has long relied on rebate
contracts to hold down costs in the generics segment, tendering across an entire drug class is a new
direction that may be tapped for cost savings.l More broadly, the government will continue to rely on

the price freeze for all reimbursement medicines, and potentially increase the extent of the mandatory
rebate once again. Like France, Germany has the opportunity to channel significant cost savings
stemming from its drive to reduce overcapacity and unnecessary operations in secondary care into
ensuring access to new innovations in treatment.
The Netherlands: In the community pharmacy sector, so-called preference policies, first introduced by
insurers in 2005, link reimbursement for certain groups of off-patent drugs to the price level of the
cheapest available generic, with patients having to pay the difference if they want an alternative
product. Going forward, these policies are expected to be expanded to new drug classes. At the same
time as new spending controls in the hospital setting have incentivized insurers to place ceilings on
drug expenditure and avoid negotiating pass-through payments, from 2015, they bear full financial risk
for most add-on drug costs, including for orphan drugs, which hitherto benefited from government-
organized risk-equalization payments. From 2016, insurers may also assume full risk for add-on cancer
therapies. In addition, secondary care has seen its pharmaceutical spending increase with the transfer
of medicines previously financed in the outpatient sector as described above. In future, a list of
additional therapies may be transferred. Managing hospital drug spend while safeguarding access is
projected to be a critical pressure point for the Dutch healthcare system.
Poland: The new government pledged during its election campaign to introduce free prescription
medicines for patients over 75, representing a significant new addition to public expenditure. Since the
new government has assumed office, the Ministry of Health has proposed that this segment of the
population will only receive cheaper medicines used in the treatment of diseases associated with old
age for free. Over the 2015-20 period, Poland will be required to manage pharmaceutical expenditure
very carefully if the government prioritizes this campaign pledge and seeks to maximize state budget
contributions under the proposed annual limits, while also seeking to catch up to peer countries with
regards to access to innovative new therapies. The government is expected to continue to rely on price
negotiations to bring down the costs of innovative medicines.
Spain: Ongoing reforms of the internal reference pricing system are expected to form a cornerstone of
cost savings. In 2015, the Ministry of Health controversially incorporated two biosimilars into a
reference group for the first time.li The consumption of generic medicines, as in France, is also forecast
to form a key part of cost containment, with the government reporting that generics penetration
reached 48.8% in volume terms between January and August 2015, compared to 34.2% over the same
period in 2011.lii Going forward, the government is likely to continue to rely on these measures to hold
down expenditure, but the trend toward overspending at the autonomous community level is
expected to persist. Previous policy proposals included linking pharmaceutical expenditure to growth in
GDP, but in the absence of a resolution to Spain’s political situation, the likelihood of implementation
of such a broad-based reform remains unclear.
England: The trajectory of pharmaceutical spending will be influenced by trends in secondary care,
given the existing high level of generics penetration and success the country has already seen driving
down prescribing costs in primary care. Under a financial agreement between the pharmaceutical
industry and the government, the former is set to bring forward GBP200 million in payments for 2017

and 2018 in 2016 under the PPRS payback scheme.liii At the same time, the free-pricing regime and
relative lack of cost-containment efforts focused on pharmaceuticals mean that England is expected to
see one of the highest rates of nominal-terms growth in public pharmaceutical expenditure going
forward. Like France and Germany, England has the opportunity to achieve significant cost savings in
secondary care under its new efficiency drive which, with appropriate reform of current appraisal
methods, could support more equitable access to new treatment innovations.
Forecasts for oncology pharmaceutical spending as a share of total drug reimbursement are broadly in
line with what countries are already spending on this therapy area
The question of how large a share of total pharmaceutical spending can be absorbed by oncology is
complex and depends on the interplay of a range of different factors, including expenditure demands in
other therapy areas, trends in generics and biosimilar uptake, and success of new and ongoing cost-
containment measures, as much as it does country-level trends in disease burden, prevention and
outcomes.
In order to benchmark affordability of the forecasts presented in Figure 15, it is useful to place them in
relation to projections for the overall public pharmaceutical market in order to understand relative scale.
Table 10 displays projected 2020 spending on oncology medicines as a share of the overall market based on
the respective low, moderate and high-growth scenarios.
It can be seen that even under the high-growth rate scenario, public reimbursement spending on
oncology medicines as a share of overall expenditure is forecast to increase by only a marginal number of
percentage points in most countries, with the exception of Poland (6.2 points).
TABLE 10 PUBLIC PHARMACEUTICAL SPENDING IN ONCOLOGY AS A SHARE OF TOTAL PUBLIC
PHARMACEUTICAL EXPENDITURE, 2014 VS 2020
2014 share 2020 share
Low Growth
2020 share
Moderate Growth
2020 share
High Growth
France 9.9% 9.8% 9.9% 11.0%
Germany 7.6% 7.6% 9.8% 11.2%
The Netherlands 12.6% 12.3% 12.5% 13.3%
Poland 25.0% 25.0% 26.3% 31.2%
Spain 8.1% 8.1% 8.5% 9.6%
England 9.7% 8.4% 9.7% 10.0%

Source: IHS World Markets Healthcare Forecasts
From this perspective, forecasts for oncology pharmaceutical spending can be seen as broadly in line with
what countries are already spending, assuming continued economic recovery and ongoing cost savings in
other parts of the healthcare system such as hospital efficiencies.
KEY TAKE AWAY
Despite escalating concerns surrounding the future budget impact of oncology therapies, forecast
spending under a number of different scenarios foresees expenditure as a share of total public
reimbursement broadly in line with current spending patterns. Although some countries are projected to
spend less on pharmaceutical reimbursement as a share of overall public healthcare expenditure relative to
2014 levels, and in those countries projected to spend more, the additional amounts are not predicted to
cover oncology spending needs, the overall amounts seem broadly achievable given current policy tools and
efficiency drives. The pressure is likely to be most acute in a country such as Poland, where a pre-existing
gap in access to treatments implies that a broadly similar level of spending on oncology will be
insufficient to support access to newly emerging therapies.
Spain

7.5 PROJECTED BUDGET IMPACT OF EMERGING THERAPY CLASSES
Emerging therapy classes associated with some of the most common cancers are predicted to absorb only
a fraction of forecast oncology spending
It is informative to complement the above forecasts for oncology pharmaceutical expenditure with a
“bottom up” approach modelling the budget impact of emerging therapy classes.
To this end, there are two classes of molecules already launched or soon to launch on the market, and
which have preliminary or final outcomes data as well as information on pricing. These are the programmed
death 1 (PD-1) and programmed death 1 ligand (PD-L1) monoclonal antibodies in second-line metastatic or
stage IIIb non-small cell lung cancer (NSCLC), and the cyclin-dependent kinase 4/6 (CDK4/6) inhibitors in
first-line treatment in combination with endocrine therapy in oestrogen receptor-positive, HER2-negative
advanced breast cancer.
Figure 16 displays the results from a projected budget impact analysis for these products over 2016-20,
relying on estimates for incidence rates, average treatment duration, market share, and relative pricing and
price concessions (a full explanation of the methodology is available in the appendix below). This scenario
assumes a peak market share of 60% by 2018 for each class of agent, reflecting relatively unrestricted
access.
FIGURE 16 PROJECTED BUDGET IMPACT OF PD-L1/PD-1 AND CDK4/6 INHIBITORS, HIGHER MARKET
SHARE SCENARIO, 2016-20, MILLIONS OF LCU
Source: IHS Life Sciences analysis
France Germany
Netherlands Poland

Spain United Kingdom
N.B. Although the PD-1 and PD-L1 monoclonal antibodies are in development for use as first-line therapies both alone and in combination with other molecules,
this analysis leverages existing clinical data from pivotal phase III trials in in second-line metastatic and stage IIIb NSCLC. The budget-impact estimate therefore
focuses specifically on this indication. It is however worth highlighting that reimbursement approval of first-line therapy would lead to an uptick in expenditure
towards the end of this forecast horizon.
Figure 17 displays the results from an alternative scenario where peak market shares are lowered to 30%,
assuming access conditions are imposed on both agent classes in order to contain expenditure.

FIGURE 17 PROJECTED BUDGET IMPACT OF PD-L1/PD-1 AND CDK4/6 INHIBITORS, LOWER MARKET
SHARE SCENARIO, 2016-20, MILLIONS OF LCU
Source: IHS Life Sciences analysis
France Germany
Netherlands Poland
Spain United Kingdom
It can be seen that even under the most cautious scenario – assuming peak market shares of 60% and the
low-growth scenario of oncology spending – by 2020, in no country would the CDK4/6 inhibitors in the
relevant indications account for more than 2.5% of total public reimbursement spending on oncology
therapies.

Individual countries are anticipated to respond to the increasing number of treatment innovations in
oncology and manage spending within forecast limits in a variety of ways
France: Price/volume agreements, a hallmark of the French system, are expected to continue to be
relied upon for high-cost new therapies. To this end, the government can also rely on the pharmaco-
economic assessments which, from October 2013, have become a mandatory part of the pricing
negotiation process for certain medicines. Thus far in its cost-containment efforts, the government has
tried to avoid curtailing access to the most innovative therapies by reducing reimbursement rates for
medicines with lower SMR ratings. Going forward, escalating treatment demands may require the
government to place increasing limitations on access to medicines with high SMR ratings. On that
note, in March 2016, France's Ministry of Health published a government decree specifying rules for
inclusion on the country's Tarification à l'Activité (T2A) exclusion list, that list designating high-cost
hospital medicines reimbursed outside the DRG system. The French pharmaceutical industry
association has warned that this will restrict admission to the list and could increase inequalities in
terms of access to healthcare, in particular for cancer patients. Decisions on delisting of a small number
of drugs from the list were expected to be taken.liv
Germany: Reforms to AMNOG will dictate the trajectory of oncology expenditure in the medium-to-
long term, while in the more immediate future, the country may come to rely increasingly on
price/volume agreements and imposition of greater reimbursement restrictions, on top of potentially
increasing mandatory rebates.
The Netherlands: Oncology drug spend will be a critical issue given its recent growth rates. The country
may seek to implement a formal cost-effectiveness threshold, as has been debated in the past, or begin
to renegotiate prices upon indication expansion as is common in peer countries. Expensive new
therapies in the hospital sector will increasingly be placed under “lock,” such that reimbursement will
no longer be automatic until after the country’s National Healthcare Institute (Zorginstituut Nederland)
has completed an assessment and negotiated a price.lv In April 2016, the government confirmed its
proposal for this “lock,” although the measure remains to be fully implemented and it remains to be
seen when exactly it will be used.
Poland: The risk is that other government priorities arising from campaign pledges will detract from
progress made under the Reimbursement Act for access to oncology medicines, even as that progress
is reported to be mixed. lvi With the Act having seen Poland transfer medicines into its mainstream
reimbursement programmes which were already accessible on a more comprehensive basis in other
countries, the reality is that Poland may fall behind with incorporation of treatment innovations that
launched in the interim and which will continue to do so in increasing numbers in the near term. With
ongoing rounds of price cuts having prompted concerns over increasing numbers of product
withdrawals, and the government otherwise limited in its policy measures, there may be the need to
consider scope for greater private-sector contributions. To this end, medical experts as well as
politicians have begun calling for the establishment of a Fund for the Fight against Cancer (Fundusz
Walki z Rakiem) to help plug gaps in the Polish public health insurance system.lvii The fund is the
brainchild of Krzysztof Łanda (founder of the non-profit organisation Watch Healthcare and current
Deputy Minister of Health), and would be based on a system of additional health insurance, paid on top
of the basic, mandatory amount deducted from salaries. According to the fund's proponents, if 20% of
the Polish population were to pay PLN50 per month, the fund would amass a total of PLN20 billion
within a period of five years.
Spain: A backdrop of significant inequities in access to treatments across the 17 autonomous
communities, as well as different hospital centers, is expected to continue impacting oncology
pharmaceutical spending. Many evaluation committees within the autonomous communities and/or
the hospital themselves are expected to restrict use or delay uptake of new treatments. It is also
expected that oncology drugs will continue to be at the center of risk-sharing agreements at regional
level; however, pioneering Cataluña is so far the only autonomous community with adequate
infrastructure for these types of schemes. It is expected that the new government, once the political
impasse is resolved, will pursue innovative funding arrangements similar to the first upper ceiling
expenditure agreement signed for the breast cancer drug pertuzumab.lviii
England: With the ongoing drug delistings from the CDF to ensure it remains within budget, and plans
to evolve the Fund into a managed-entry scheme with additional cost control mechanisms, rates of
growth in oncology spending in particular are expected to temper in the short term.
KEY TAKE AWAY
A “bottom up” approach modelling the budget impact of emerging therapy classes indicates that major
new agents in some of the most common cancers will absorb only a fraction of forecast public
reimbursement spending on oncology treatments. Countries currently possess a variety of policy tools
which seem conducive to supporting access to new treatments while managing budgets within the forecast
limits.
Spain

V. CONCLUSIONS
The preceding set of analyses and consideration of policy and healthcare financing trends underscore the
challenges facing European countries in their ability to simultaneously contain costs while facilitating access
to emerging treatment innovations. Economic conditions and the secular trend of ageing societies
associated with escalating healthcare demands continue to put significant pressure on governments.
Key takeaway 1: Pharmaceuticals have remained a key target of cost containment, but at the expense of
compromising access and leading to concerns over the impact on health outcomes
Over the recent retrospective period, European governments placed an emphasis on pharmaceutical cost
containment in the context of austerity measures or substantive policy reforms. Although these efforts
contributed to subdued or negative growth in overall public outlays on healthcare, they came at the price of
compromising patient access, whether as a result of medicine delistings, rising OOP burdens, or
manufacturer product withdrawals. This reality has given rise to debates surrounding the impact on health
outcomes and the sustainability of such cost shifting.
Key takeaway 2: Concerns over the funding demands of emerging treatments may have been overstated
to some extent, but nonetheless serious budgetary pressures exist for certain countries
Forecasts for overall pharmaceutical and oncology drug expenditure rely on a range of assumptions. While
the pharmaceutical and broader healthcare markets are complex and subject to many variables, meaning
that top-line forecasts based on the projection of past or estimated growth rates must be interpreted with
caution, the results of the present analyses suggest that current anxieties over the budget impact of
oncology therapies may be exaggerated in some countries.
Under a variety of different growth scenarios, forecast public reimbursement spending on oncology
medicines is set to account for a share of overall public drug spending broadly similar to current
expenditure patterns. A bottom up, budget impact modelling approach suggests that these growth
scenarios are able to accommodate significant new therapy classes in some of the most common cancers.
The reality remains that certain countries will nonetheless face pronounced budgetary pressures. This is
true in the case of a country such as Poland, where pre-existing gaps in access mean that maintaining or
only marginally increasing the budget for oncology medicines poses a risk to access to future innovations.
Competing government priorities stemming from campaign pledges limit resources, and there has
reportedly been a slowdown in the number of innovative new drugs securing reimbursement listing.lix Spain
is another country where, depending on the resolution of political uncertainty, ongoing deficit challenges
may result in constrained resources and thus more pronounced challenges in sustaining access to emerging
treatments.
Key takeaway 3: New funding demands should be broadly achievable through a combination of
appropriately targeted cost-containment drives and existing policy tools
While forecast public expenditure on oncology medicines envisions substantial outlays on reimbursement
spending, the amounts seem broadly achievable in a majority of countries assuming ongoing cost-

containment efforts. A number of countries have already committed to large-scale efficiency drives in
secondary care, positioning them to realise significant cost savings in inpatient hospital care, that sector
which continues to represent the bulk of public healthcare outlays. Efficiencies in areas such as
procurement, improved management of staff rosters and overcapacity, and consolidation, integration and
coordination of healthcare delivery all have the potential to generate major savings which can be
channelled to support equitable access to emerging therapy innovations. In addition, shifting care out of
hospital and into the community and home settings remains a significant opportunity.
In the pharmaceutical sector itself, countries such as France, Poland and Spain continue to see
opportunities for greater uptake of generics across the healthcare system. Even in countries such as
Germany, which have probably maximised generic penetration in primary care, opportunities persist to
increase penetration rates in hospital. More generally speaking, the new wave of biosimilars, although
representing comparatively smaller cost savings relative to generics, will liberate additional funding for
emerging treatment innovations.
Key takeaway 4: There is a need to enter into broad-based discussion surrounding innovations in
healthcare financing
In some countries, significant pre-existing disparities in access or weakening economic conditions may
challenge the ability to finance new treatments in line with the above forecasts. It should also be kept in
mind that while substantive reforms to secondary care are expected to release significant cost savings in
the long run, some efficiencies are only possible with upfront investments.
Solutions may involve greater participation of the private sector, along the lines of the proposal in Poland
discussed above for additional insurance contributions to feed into a dedicated oncology care fund. More
generally speaking, collaborations across EU Member State governments should be encouraged, specifically
looking at how data sharing, centres of expertise, collaborative networks and joint procurement can
procedure greater efficiencies and disseminate best practice.
A broad-based discussion around innovative policy arrangements is warranted to ensure that European
countries do not see a deterioration in health outcomes relative to the advances made possible by
emerging treatments. Going forward, this is an agenda which will require broad stakeholder support and
cooperation between policymakers and industry.

VI. APPENDIX
7.1 ADDITIONAL COUNTRY DETAILS
7.1.1 FRANCE
In France, as part of the country’s deficit-reduction programme, growth in public health insurance spending
was initially designed to be limited to 2% y/y over 2015, 2016, and 2017.lx However, in 2015, France's
Ministry of Finance proposed changes to these targets, trimming the ONDAM for 2016 down to 1.75%.lxi
This reduces spending growth to an historic low which is seen as necessary in order to limit the health
insurance system's deficits. France’s system for national health expenditure targets is intended to achieve
savings without compromising quality of care and without shifting additional cost burden onto patients.
Nonetheless, the country’s stability programme envisions an ambitious target of EUR50 billion in savings by
2017. Marisol Touraine, the French health minister, announced a series of cost-containment measures in
the social security financing act for 2016, including promotion of generics, reductions in medicines prices,
and efficiencies in hospital spending.
Looking at trends that may impact private market expenditure, it is noteworthy that the Treasury
Department published a paper in June 2015 on potential reforms to the country’s longstanding disease
reimbursement system.lxii The programme, covering patients with severe chronic disease (known as
Affection de Longue Dureé: ALD), provides eligible beneficiaries with full reimbursement for a select number
of medicines on a designated list. According to the Treasury Department, the co-payment exemption costs
the national health insurance system EUR12.5 billion annually, or an estimated 14% of total reimbursed
healthcare expenditure.
The list covers 30 recognised diseases and is forecast to experience significant cost increases by 2025. The
underlying factors behind the sharp cost increases are attributed to France's ageing population as well as
increases in the prevalence of chronic illness, detection, and survival rates. Eligible beneficiaries represent
about 15.4% of the population, but this could rise to 19.7% of the French population (13.2 million) by 2025.
The Treasury has put forward a scenario in which, based on current trends, the system will cost the French
state EUR17.1 billion in 2025, compared to EUR12.5 billion in 2011. This increase will feed into and
exacerbate an overall increase in healthcare reimbursement. Proposals to reform the ALD system include
reducing the number of designated diseases, measures to deter overconsumption of prescription drugs by
excluding full reimbursement status in some cases, and applying stricter criteria to access the ALD system,
including adopting new regulations to expedite patients' exit from the system once chronic disease
conditions have been medically resolved.
Meanwhile, in September 2015, a study commissioned by Minister of Health Marisol Touraine
recommended unifying France’s three-tier system of reimbursement rates for medicines.lxiii Currently, these
rates are set based on a medicine's clinical value rating (the lower the rating, the lower the reimbursement

rate), as well as taking into account factors such as disease severity and public health interests. A fourth
level of reimbursement (100%) is provided for essential medicines that treat serious diseases, including
cancer. The report proposed abolishing the 15% rate, and eventually merging the rates of 30% and 65%.
While these changes theoretically could result in rising private contributions and OOP payments accounting
for a growing share of that spending, in reality the political system in France is not perceived to be
favourable to such sweeping changes, and the proposed overhauls would represent a major policy
departure. Furthermore, the complementary insurance sector in France has already absorbed costs which
would otherwise have shifted to patients; it is unclear what additional costs this sector can absorb before
they are passed on to patients in the form of increased cost-sharing, an outcome which would be expected
to have a negative impact on access and equity in the healthcare system.
The seemingly limited scope for France to absorb future escalations in healthcare costs via greater
contributions from the private sector intensifies the need for the government to find public-sector savings
and means to contain costs. In contrast to Germany, the Netherlands and the UK, France is a country where
there is significant scope to increase the penetration of generics, a strategy which serves as a centerpiece of
the government’s plans to achieve its healthcare deficit-reduction targets. For drug spending specifically,
France's 2016 social security budget called for a 1% y/y reduction in expenditure on reimbursed medicines,
and anticipated savings of EUR550 million from reduced drug prices. This is the second year in a row of the
application of the so-called L rate ("taux L"), spending above which incurs a payback from pharmaceutical
companies, which in 2014 yielded a reported EUR76.5 million.lxiv Of the EUR50 billion in total savings
expected by 2017, the government plans to save EUR3.5 billion in drug spending.
In addition to a strong focus on generics, it is predicted the government will seek to manage expenditure on
new high-cost therapies through negotiation of price/volume agreements. To this end, the government can
also rely on the pharmaco-economic assessments which, from October 2013, have become a mandatory
part of the pricing negotiation process for certain medicines expected to have a significant impact on public
finances. Proposals from the Hospital Federation of France for greater precision in setting of hospital drug
spending targets by the government each year may also play a role in managing expenditure.lxv
Although price/volume agreements for individual medicines predicted to have a significant budget impact
make up the bulk of financing arrangements in the French market, more recently, the country has moved
toward implementation of ring-fenced budgets for high-cost medicines, specifically in the hepatitis C space.
Within its recent healthcare budgets, the French government set spending ceilings of EUR450 million in
2014 and EUR700 million in 2015 for next-generation hepatitis C medicines, an unusual measure that
involved the government in matters typically reserved for the pricing committee.lxvi Once these thresholds
are exceeded, the budget law foresees a payment by the manufacturers of a progressive contribution.
While in principle the mechanism works similarly to the well-established price/volume agreements, the
extension to a whole class of agents and indeed the involvement of the government represents a novelty.
7.1.2 GERMANY

In Germany, the statutory health insurance funds experienced a deficit in 2014 after several years of
surplus. Since the beginning of 2015, the “additional” contribution (Zusatzbeitrag) for which employees are
liable (traditionally 0.9% of pre-tax salary), on top of the 14.6% of salary paid by employees and employers
in equal proportion, can be freely set by the funds within defined limits. While the average additional
contribution rate was still estimated to stand at around 0.9% in 2015, it was expected to rise to 1.1% by
2016, according to estimates by Germany's Federal Ministry of Health.lxvii However, it was reported early in
2016 that 25 funds were charging more than this rate.lxviii
Germany is expected to continue to see political divisions over whether to make employers cover half of
the additional contribution. The Social Democratic Party of Germany, the junior partner in the governing
coalition, is strongly in favour of this proposition, with the employees' rights group of the Christian
Democratic Union (CDU) – one of the two parties in the leading coalition grouping, 'the Union parties'
(together with the Christian Social Union, CSU) – having also come out in favour of parity between
employees and employers in terms of this payment. The CSU, however, remains opposed, as do many
within the CDU, on the grounds that to do so would threaten insurance companies' competitiveness. The
divisions over how the statutory insurance system should be financed are expected to become more
pronounced, as the contribution rates for the funds are expected to continue to rise through to 2020. On
the other hand, according to Federal Ministry of Health figures, in the fourth quarter of 2015, the insurance
funds recorded a combined financial surplus. It remains to be seen whether this trend will persist and, if so,
if it will be reflected in a reduction in the additional contribution.
Although there remains a very strong consensus in favour of statutory health insurance in Germany, there is
a political commitment among some German politicians to open up the healthcare market more fully to
private health insurance. The significance of the increasing amount Germans have to pay out for statutory
health insurance is mainly that those who earn above the threshold below which payment into a statutory
fund is obligatory may decide that the difference in cost is not significant enough to opt for the statutory
fund, and may start to opt for the private sector more frequently.
Meanwhile, the amount that German patients covered by statutory health insurance had to pay in
additional payments to make up the difference between reference prices and the actual prices of medicines
reportedly increased by 22% y/y in 2014, amounting to EUR115 million.lxix The increase in the proportion of
medicines reimbursed by the funds that required such additional payments rose from 4.1% of reimbursed
medicines in 2013 to 6.1% during 2014. Of these additional payments, 55% were made for off-patent
originators, 18% were made for generics and 16% for patent-protected medicines. It has been reported that
many manufacturers have opted not to lower their prices to the level of the reference prices.
The level of additional payments and fixed co-payments that insured patients are required to pay for
medicines in Germany remains relatively low in European terms, with Germans paying comparatively higher
amounts in monthly premiums instead. However, in this context, it is also worth noting that, according to
data from the Federal Ministry of Health, there was an increase of EUR125 million in the first three quarters
of 2015 in the amount paid out by patients in co-payments, estimated to reach just under EUR200 million
by the end of the year.lxx The amount paid has risen at a more dynamic rate than overall pharmaceutical

expenditure, and the Ministry has suggested that an increase in the number of insured and a reduction in
the number of chronically ill people with co-payment exemptions may be drivers of this change.
In Germany, trends in pharmaceutical expenditure going forward will be strongly influenced by the
outcome of political developments following broad-based calls for reform of AMNOG. In the 2015
Innovation Report issued by the insurance fund Techniker Krankenkasse and prepared by the Research
Center on Inequality and Social Policy at the University of Bremen, it is estimated that AMNOG delivered
savings of around EUR320 million in 2014, versus the EUR2 billion in annual savings it was initially proposed
it would bring.lxxi As part of the fourth and final full session of the "Pharma Dialogue" – the discussions
initiated by Germany's coalition government at the beginning of its term of office, involving several
government ministries, the pharmaceutical industry, and the scientific and medical communities – the
government considered growing calls from insurance funds to retroactively apply negotiated prices to the
12-month free-pricing period under AMNOG, as well as undertake a “late” benefit assessment that could
see drug prices and reimbursement conditions reviewed more dynamically. An April 2016 report on the
final session of meetings indicates the federal Ministry of Health’s resulting proposals now focus on
introduction of a turnover threshold for the "free pricing" period, benefit assessment of pre-AMNOG drugs
in exceptional circumstances, and the negotiated reimbursement price becoming confidential. lxxii The
elements of the Pharma Dialogue proposals relating to AMNOG will be included in a separate act, with the
first draft of this likely to be revealed in the summer of 2016.
In January 2016, Germany's National Association of Statutory Health Insurance Funds called for reform of
the provisions of AMNOG pertaining specifically to orphan drugs.lxxiii Under the current system, orphan
drugs only undergo full benefit assessment when their annual cost is anticipated to exceed EUR50 million.
Otherwise, orphan drugs automatically receive a status of “additional benefit” on the basis of their
marketing authorisation. However, the Association has argued that the law should be changed so that in
certain justified cases it should be possible to undertake a full benefit assessment of orphan drugs whose
budget impacts fall below the current threshold.
While they have the potential to lead to significant cost containment, any modifications to AMNOG will
need to proceed via the appropriate legislative and regulatory channels, meaning that any impact on
pharmaceutical spending will only occur in the medium term. However, the German Federal Ministry of
Health’s decision in January 2016 to maintain the price freeze on reimbursed medicines that are not
included in reference-pricing groups, as well as to continue the existing mandatory discount of 7% on the
ex-factory price of these treatments and that of 6% on the price of drugs within the groups, will have a
more immediate impact.lxxiv Under the applicable legislation, the government assesses the appropriateness
of the price freeze and mandatory discounts each year. Going forward, the government is likely to continue
to rely on these measures to hold down spending.
Another more immediate option in Germany may be to expand the use of drug class-wide tendering. While
Germany has long relied on rebate contracts to hold down costs in the generics segment of the market, for
the first time, in September 2015, the Federal Association of the Allgemeine Ortskrankenkassen, the central
organisation bringing together one of Germany's largest groups of insurance funds, announced the
completion of the first tender for contracts for the supply of medicines applying across an entire class of

drugs. Applying in this case to tumour necrosis factor-alpha inhibitors, this model is likely to be applied to
other therapy areas if shown to be successful, providing the statutory insurance system with another tool
for cost savings.lxxv
7.1.3 THE NETHERLANDS
In the Netherlands, the Rutte government has agreed an austerity package over 2014-17 as described
above. This follows the 25.5% increase in real-terms public expenditure seen over 2005-06, when the
country’s health insurance system underwent fundamental reform. The Dutch economy slowed
dramatically at the beginning of the decade, with rising wage costs undermining the country’s competitive
position. In addition, surging house prices fueled by tax breaks on mortgage interest led Dutch households
to become the most indebted in the Eurozone following the outbreak of the crisis. These realities have put
cost containment at the top of the healthcare agenda, with the Rutte government having outlined plans to
reduce the healthcare budget by 1.5% in 2014 and 1% in 2015 in a bid to reach a structurally balanced
budget by 2017. However, government finances are improving given recent fiscal consolidation efforts.
In terms of sources of private financing, OOP payments are projected to account for a rising share of the
private marketplace. In this case, the gains made by OOP payments are predicted to come largely at the
expense of the private insurance sector. This trajectory reflects trends in cost-sharing under the Dutch
statutory health insurance system which, as discussed above, saw the annual deductible more than double
over the period from 2008 to 2014 to reach EUR375 in 2015. In 2016, this deductible increased by EUR10,
and premiums were expected to increase by EUR7 to an average of EUR103 per month owing to higher
healthcare costs. Going forward, insurers are expected to continue to pass rising costs on to patients.
Pharmaceutical costs are an important target under the government’s drive to reach a structurally balanced
budget by 2017, with savings of up to EUR1 billion in drug costs anticipated by that year. To this end, the
health minister has entered into a new coalition agreement which limits public hospital spending growth to
1% y/y over 2015-17, following a similar accord that placed a limit of 2.5% y/y over 2012-15. This
framework has put increasing pressure on hospital providers, 85% of which anticipate challenges in delivery
of expensive drugs to patients in 2016 and beyond.lxxvi Contractual arrangements between hospitals and
private insurers in the Netherlands, which must take account of the annual growth limits, may package drug
costs into the overall contract, or feature separate “add-on” payments for high-cost therapies.
At the same time as the new spending controls have incentivized insurers to place ceilings on drug
expenditure and avoid negotiating pass-through payments, from 2015, they bear full financial risk for most
add-on therapies, including orphan drugs, which hitherto benefited from government-organized risk-
equalization payments on the basis of expenditure on these items being difficult to predict. From 2016,
insurers may also assume full risk for add-on cancer therapies. In addition, secondary care has seen its
pharmaceutical spending increase with the transfer of medicines previously financed in the outpatient
sector as described above. In future, a list of additional therapies may be transferred, including

immunoglobulins, hematopoietic growth factors, interferons, and drugs used in HIV, organ transplantation,
multiple sclerosis and pulmonary arterial hypertension.
In a report published by the Amsterdam-based Academic Medical Centre in mid-2015, it was claimed that
nearly 50% of metastatic colorectal cancer patients in the Netherlands do not receive the appropriate
pharmaceutical treatment because hospitals are unable to afford the cost.lxxvii With the pressure on hospital
budgets only expected to increase for the reasons outlined above, pharmaceutical spending in secondary
care will be a key challenge for the Dutch healthcare system going forward. The change in the position of
the Dutch Medicines Evaluation Board in April 2015 that controlled switching between biologics and
biosimilars medicines is permissible should strengthen the uptake of the latter and lead to some reduction
in spending on the current generation of high-cost biologics.lxxviii
In the pharmacy sector, as described above, the Netherlands saw significant reductions in the rate of
spending due to a confluence of policy and market-based factors. Of the policy levers, the so-called
preference policies, first introduced in 2005, link reimbursement for certain groups of off-patent drugs to
the price level of the cheapest available generic, with patients having to pay the difference if they want an
alternative product. Going forward, these policies are expected to be expanded to new drug classes, and
continue to play a major role in holding down spending in the pharmacy sector. The Netherlands, with a
generic volume share of 70% of the market, faces limits in the extent to which it can rely on generic uptake
as a driver of further cost containment, but these preference policies hold the potential to manage
reimbursement rates.
On balance, the Netherlands would appear to face significant challenges over ensuring continued access to
treatment in secondary care versus some of the other countries under analysis. The spending targets set in
place for the hospital sector, combined with the transfer of a significant number of new medicines to that
domain and the rapid growth in spending on oncology in particular, appear to have already begun to
negatively impact access, with providers predicting this will get worse in the near-term future. At the same
time, in light of the lower-than-anticipated healthcare spending seen in the Netherlands in recent years as
discussed above, it has been posited that increases in cost-sharing dissuading patients from seeking care
may have contributed to this phenomenon.lxxix As such, it is unclear whether future sustainability challenges
will be able to be absorbed by additional cost-sharing on the part of patients. As a whole, these trends
would suggest that policy reforms are needed in the Netherlands to safeguard against deterioration in
health outcomes.
7.1.4 POLAND
In Poland, future trends in topline healthcare expenditure will be impacted by the escalating level of public-
sector debt as a percentage of GDP. While the dynamism of the economy in the early 2000s enabled the
government to support the country through the recession impacting the rest of Europe, concerns about the
scale of debt have since weighed on spending. At the same time, with the recent election of the Law and

Justice (Prawo i Sprawiedliwość) party, the country’s new leadership has pledged to increase healthcare
spending and embark on fundamental changes to the healthcare system.
Poland's new healthcare minister, Konstanty Radziwiłł, has presented plans which would transition the
current system of financing public healthcare through compulsory contributions to one funded by the state
budget through taxation, starting in 2018.lxxx The new government also intends to significantly increase
funding for healthcare from the state budget, increasing the share of GDP spent on public healthcare to 6%.
With public spending on healthcare in Poland as a percentage of GDP one of the lowest rates among EU
member states, there is a clear incentive for the government to increase this level of spending in real terms.
However, set against a number of other expensive campaign pledges, including bringing the retirement age
back to its previous level and providing a statutory monthly sum for families with two or more children, this
ambition will only be realised with significant cost savings achieved in other areas.
In terms of sources of private financing, Poland is forecast to see noteworthy changes in the composition of
the marketplace going forward. Private insurance in the form of prepaid health plans is set to rise from
representing 9% of total private healthcare spending in 2014 to accounting for 29.3% in 2020, representing
a real-term CAGR of 30.1%. In tandem, OOP payments are forecast to fall from representing 75.4% of the
private market in 2014 to 69.7% in 2020, indicating that the rising contribution from the private insurance
sector is not associated with a significant offset of the comparatively high OOP spending patterns in Poland.
Rather, the category of total “other” private spending (including spending, for example, by charities and
other institutions not otherwise captured) is set to see a dramatic decline at a CAGR of 38.1% through 2020.
These trends reflect a maturation of the market as more employers are projected to offer medical
subscription packages in the country’s bourgeoning voluntary insurance sector.
In Poland, the National Health Fund projected that pharmaceutical expenditure in the country’s drug
programmes and in the community pharmacy sector would increase marginally over 2014-15, at 3.2% and
2.6%, respectively, before falling by 4.4% and 1.7% respectively over 2015-16. While reimbursement of
prescription medicines via pharmacies increased in the range of 3-5% over 2010-14 in nominal terms,
spending on the drug programmes increased by a dramatic 20.8% over 2012-13 and 12.4% over 2013-14,
reflecting the phasing out of the “non-standard” chemotherapy scheme under the Reimbursement Act and
transition of the drugs into other channels as well as, to a lesser extent, growth in spending on medicines
through the standard chemotherapy list. Thus, the move toward negative growth represents a step change
for both segments of the market.
That Poland is forecast to see more modest growth in pharmaceutical expenditure going forward is a
reflection of the escalation in public debt attributable to the scale of government investment which helped
the country avoid recession. However, the new government pledged during its election campaign to
introduce free prescription medicines for patients over 75, representing a significant new addition to public
expenditure. Since the new government has assumed office, the Ministry of Health has proposed that this
segment of the population will only receive cheaper medicines used in the treatment of diseases associated
with old age for free. An initial draft amendment proposed financial limits for this spending set at PLN495
million in 2016 and predicted to reach PLN1.2 billion in 2025.lxxxi However, the government is since reported
to have allocated PLN125 million from the state budget for financial year 2016.lxxxii

Over the 2015-20 period, Poland will be required to manage pharmaceutical expenditure very carefully if
the government prioritizes this campaign pledge and seeks to maximize state budget contributions under
the proposed annual limits. A larger question surrounds the future role of the National Health Fund, with
some stakeholders reported as saying that it may represent another source for such spending. However,
the new government has also pledged to abolish the Fund, which replaced the country’s regional sickness
funds in 2003 in an attempt to solve the healthcare sector’s debts through centralised control. Were the
Fund to be disbanded and a shift back toward regional control implemented, pharmaceutical spending in
Poland would be dependent on the course of this major structural change.
In any case, it seems likely that the new priority of free medicines for the elderly segment of the population,
combined with other expensive campaign pledges, will constrain expansion of access to new, high-cost
treatments, an objective of the 2012 Reimbursement Act. The addition of new oncology drugs and
indications for such treatments was part of a major shift in the reimbursement system under that Act.
According to Krzysztof Łanda, current Deputy Minister of Health and founder of the Watch Healthcare
Foundation, a non-profit organisation that aims to provide information on limitations of accessing basic
healthcare benefits in Poland, the country has gone from being at just about the bottom of the list among
countries in the EU in terms of access to new innovative drugs to being about third or fourth from last. lxxxiii
While many of these drugs have been moved into drug programmes, concerns remain about those patients
who require drugs which are still in “limbo” after the phasing out of the non-standard chemotherapy
system. In January 2015, Poland's Supreme Audit Office (Najwyższa Izba Kontroli: NIK) published a wide-
ranging and detailed report into the functioning of the system of drug programmes, in which it was strongly
critical of the lack of clarity surrounding the system of non-standard chemotherapy.lxxxiv The NIK criticised
the functioning of the system in the lead up to its phase out, as well as confusion surrounding the future
treatment of patients requiring drugs that have until now been funded within this system. After the phasing
out of the non-standard chemotherapy system, patients starting treatment with drugs previously included
within the system after the beginning of 2015 will come under a new system of individual access to
medicines. However, judging from the significant concerns of the NIK, the lack of clarity and confusion
around access to these drugs is set to continue.
The risk is that the other government priorities for healthcare and in other areas as manifested in the
campaign pledges will detract from the progress made under the Reimbursement Act, even as that progress
is reported to be mixed. With the Act having seen Poland transfer medicines into its mainstream
reimbursement programmes which were already accessible on a more comprehensive basis in other
countries, the reality is that Poland may fall behind with incorporation of treatment innovations that
launched in the interim and which will continue to do so in increasing numbers in the near term. There is
therefore a significant risk that health outcomes are negatively impacted in comparison to other EU
countries going forward.
7.1.5 SPAIN

In Spain, resolution of political uncertainty stemming from the December 2015 national election will dictate
the future direction of healthcare, as the new Minister of Health is yet to be named following the end of
Alfonso Alonso’s mandate. The election has created Spain’s most fragmented parliament in recent history
and instigated a true political revolution by ending the two-party state (the Popular party and the Socialists)
since democracy was reinstated in 1978. Due to the inconclusive elections, a new government is yet to be
formed after Spain’s Popular party prime minister, Mariano Rajoy, turned down an offer from King Felipe VI
to do so in mid-January 2016. The Socialists came second in the December election, the reason why their
leader Pedro Sanchez was the latest to be called by the monarch in early February 2016 to form a coalition
government. The absence of a party leader winning support within two months of the first vote means that
new elections must be called.
The Socialists had pledged during the electoral campaign to ask the European Commission to relax deficit
targets set for Spain, which has been in the corrective arm of the Stability and Growth Pact since April 2009
and has been requested to correct its excessive deficit by 2016. The next Spanish government must ensure
that its budget deficit is reduced below the EU ceiling of 3% of GDP in 2016 in line with set objectives.
However, the Commission forecasted a deficit of 3.6% for 2016. The 2015 deficit projection of 4.8% also
appears to have missed the target set by the Commission of 4.2%. The main uncertainty over whether the
2015 target would be attained centered on the performance of the autonomous communities which have
overspent in recent years.lxxxv Although dependent on the outcome of political uncertainty, according to the
European Commission, the next government is expected to make healthcare budget adjustments in order
to meet public deficit objectives similarly to previous years.
Besides the general election outcome, future Spanish healthcare spending will also be shaped by the
recently elected autonomous community governments. As a result of the decentralization process, the
autonomous communities have been in charge of their own healthcare budgets since 2002. As of early
January 2016, the regional government budgets presented for 2016 foresee expenditure rises for
healthcare, with the exception of Cataluña, which had yet to present its budget. However, not all budgets
had been approved yet. The healthcare budgets of the 16 autonomous communities added up to more than
EUR50,000 million, with Andalucía leading the ranks of the highest spenders with a sum of EUR8,807
million.
Similarly to the Netherlands, in Spain, OOP payments are forecasted to account for an increasing share of
private healthcare spending. In line with the Dutch scenario, the gains in OOP payments are expected to
derive mainly from the private health insurance sector. This falls in line with recent historical trends with
private healthcare spending markedly higher during the economic crisis as a result of public spending
cutbacks. In the context of financial difficulties, the government effectively opted for a policy of transferring
healthcare costs directly onto users, which is likely to continue in the short term while the Spanish economy
is under scrutiny by the European Commission and on the slow road to recovery.
Despite the economic crisis, the private health insurance market has managed to maintain positive growth
rates and has become a need rather than a luxury amongst those who can afford the premiums. Provisional
data show that in 2014 there was a 3.3% increase in subscribers compared to the 9.3 million in 2013, and
about 18% of Spaniards hold private health insurance. It has been noted that in autonomous communities

that have dropped their public healthcare budget per capita, private health insurance has increased market
share.lxxxvi
In Spain, it remains to be seen whether the next government will be able to fulfil the European Commission
targets related to pharmaceutical expenditure, given that the Rajoy government failed to do so. The
Commission had also demanded the creation of a transparent system of information on hospital
expenditure that is yet to be implemented, although the Ministry of Finance assures it has received data
from the autonomous communities. The Rajoy government had notably committed to slash EUR1 billion
(half in 2015 and the other in 2016) from the hospital medicines bill based on a mechanism linking
pharmaceutical expenditure with growth in GDP. The Ministry of Finance modified legislation (Organic Law
6/2015 of 12 June) to create a mechanism to monitor the sustainability of pharmaceutical and healthcare
expenditure of the autonomous communities. As such, for those autonomous communities that have
signed up to the mechanism, there is a healthcare expenditure limit whereby the inter-annual variation of
pharmaceutical expenditure should not be superior to the reference GDP growth rate of Spain. If this limit is
surpassed, the adhering autonomous communities will not be allowed to approve the complementary
package of services, amongst other measures.
Additionally, the agreement signed between the Spanish industry association, Farmaindustria, and the
Ministries of Health and Finance in November 2015, seeking to link the public pharmaceutical expenditure
growth limit to the country’s GDP, has yet to be implemented. It was due to start on 1 December 2015 and
was valid for 12 months, with the possibility of an extension annually for a maximum of three years. This
protocol establishes a mechanism to determine a compatible limit if societal therapeutic needs are greater
than the development of the Spanish economy. The Socialists have already announced their intention of
scrapping this agreement if they are elected.lxxxvii The implementation of similar deals with the Spanish
generics and medical devices associations are also yet to be determined.
None of the autonomous communities have yet signed up to the Ministry of Finance’s aforementioned
mechanism in spite of renewed pharmaceutical expenditure growth, which occurred due to the newly
funded hepatitis C drugs. Furthermore, a report by the Ministry of Finance about the regional budgets for
2016 highlights that seven autonomous communities are likely to have healthcare financing issues, in
particular to fund pharmaceutical expenditure. These included Aragon, Baleares, Castilla y Leon, Galicia,
Murcia, La Rioja and Valencia.lxxxviii This is likely to mean that autonomous communities will struggle to
further reduce public hospital pharmaceutical debt in particular. The debt owed to the pharmaceutical
industry reduced by 13% in December 2015 to about EUR2,200 million with regards to the previous month.
It appears to indicate that 2015 ended with 13% less debt than 2014, which corresponds to the best value
since 2006 when debt amounted to EUR2,142 million.lxxxix
Cost-containment measures coupled with the promotion of the rational use of medicines helped Spain to
maintain a stable average expenditure per prescription of EUR10.81 in 2015 (equating to a y/y 0.31% rise).xc
One measure highlighted by the Ministry of Health was the reference-pricing system annual update
published in October 2015, controversially incorporating two biosimilars into a homogenous group for the
first time.xci The effects of this update will only truly be felt once the next government is in operation. The
consumption of generic medicines also reached 48.8% in volume terms over January-August 2015, which

the Ministry said was approaching the European average, compared to 34.2% in 2011. Going forward, the
government is likely to continue to rely on these measures to hold down expenditure, but the trend toward
overspending at the autonomous community level is expected to persist.
7.1.6 THE UK
In the UK, the political agenda to improve the country’s standing relative to average European healthcare
outcomes places limits on the degree of cost containment going forward. Nonetheless, the English NHS
faces serious budgetary challenges. By the end of September 2014, more than half of all types of NHS
providers were in deficit, with a total net shortfall of GBP630 million.xcii This challenge is greatest in acute
hospitals, of which 81% reported a deficit during the same period. For the first half of the financial year
2015/16, NHS trusts in England reported a deficit of GBP1.6 billion, GBP358 million above expectations at
the beginning of the year.xciii It is anticipated that the NHS will face a funding gap of GBP30 billion from 2020
if funding rises in line with inflation and there are no efficiency savings realised.xciv
UK Chancellor of the Exchequer George Osborne, as part of the annual government spending review,
announced in November 2015 that the NHS in England is to receive an additional GBP10 billion in real terms
over the next five years.xcv Much of this funding is to be used by the NHS to move towards a seven-day
system allowing access to primary care at weekends, one of the Government's flagship health policies.
Cancer care has been earmarked for additional spending increases, with some GBP300 million to be
invested in cancer diagnostic services alongside a government pledge that by 2020, all patients will be given
a diagnosis or all-clear for suspected cancers within 28 days of referral.xcvi
However, the Government expects the NHS to make efficiency savings of some GBP22 billion by 2020/21
given the scale of the predicted budget shortfall.xcvii These savings are expected to be realised through
measures such as better staff roster management, procurement efficiencies, reduced unnecessary hospital
admissions, and improved stock management of medicines.xcviii This means that in the UK, new investments
will have to come at the expense of cost containment in other areas of healthcare or in other governmental
budgets in order to ensure that the necessary cost savings or limitations on public debt escalation are
achieved.
The situation in the UK is in some ways reminiscent of past developments in the configuration of cancer
care in Poland. In March 2014, the latter country’s then health minister Bartosz Arłukowicz presented plans
for improving access to oncology treatment, and reducing queues in the system, which included the
scrapping of limits on care provision and implementing a maximum waiting time.xcix This reform was
expected to increase public spending on oncology by at least 50%.c However, the reform was touted as
budget neutral, as any increased spending on oncology was intended to translate into decreased spending
in other areas of healthcare provision.
Of the countries under analysis, the private market for healthcare is expected to remain stable in terms of
composition from different sources of funding in the UK. The broad-based political consensus around

universal access to care as embodied in the NHS, combined with past developments in individual and
employer-sponsored private insurance as discussed above, mean that the market is expected to remain
relatively small.
In the UK, the trajectory of pharmaceutical spending will be heavily influenced by trends in secondary care,
given the high level of generic penetration and success the country has seen driving down prescribing costs
in primary care. With secondary-care medicine costs being driven by spending on oncology, the designation
of chemotherapy and systemic oncology treatments as a specialized service in England, as a result of the
major reforms brought in by the 2012 Health and Social Care Act, has implications for how this trajectory
unfolds. With this designation, from April 2013, decisions regarding the commissioning of these therapies
have been made at national level by NHS England, a centralised, arm’s length body reporting to the
Secretary of State for Health which is also responsible for commissioning primary care. The NHS budget for
specialised services amounted to GBP14.6 billion for 2015/16. Since the restructuring of the NHS under the
2012 Act, specialised services have generally accounted for 10-14% of the overall NHS allocation. Reports
from 2014 indicated that, by April of that year, the specialised services budget was predicted to be
overspent by at least GBP336 million.ci A large share of this overspend can be attributed to the larger-than-
expected outlays for the CDF.
As a first step toward reining in CDF spending, in 2014 the government announced that NHS England would
begin evaluating cost as well as clinical effectiveness in order for drugs to be included in the Fund,
subsequently leading to a series of delistings. In November 2015, NHS England and the National Institute for
Health and Care Excellence (NICE) put forward consultation proposals envisioning a new role for the CDF as
a managed entry fund.cii This would allow promising cancer drugs, for which there is insufficient evidence to
be recommended for routine commissioning, to obtain a conditional approval to be funded through the
CDF for a certain period of time, enabling sufficient data to be collected in order to support a more
informed NICE decision. Prospective contingency provisions would be put in place to ensure the CDF
remains within budget.
With these policy developments indicating that England will bring the CDF budget under control in the short
term, pharmaceutical market growth through 2020 is projected to be more subdued in comparison to the
2010-14 period. However, aside from the proposals for the CDF, the UK lacks an overarching cost-
containment drive focused on pharmaceuticals outside of the now routine discounts it receives on new
medicines under its patient access schemes. The country’s discussions over a new system of value-based
pricing, which eventually gave way to considerations of value-based assessment by NICE, were put on hold
indefinitely after a series of consultations failed to lead to consensus.
What is more, a report issued by Cancer Research UK in August 2015 highlighted the shortfall in molecular
diagnostic testing associated with targeted therapies for solid tumours in England.ciii Based on cancer
incidence data and extrapolation of testing rates from a survey of labs, the charity estimates that in 2014,
15,929 patients missed out on molecular diagnostic testing, because of either a lack of funding or a lack of
awareness. Based on mutation rates, this translates into an estimated 3,552 patients who may have
otherwise been eligible for targeted therapies. In light of the country’s pledge to increase cancer diagnosis
rates as discussed above, there is likely to be an increase in the number of patients receiving high-cost

therapies in future. It is also worth mentioning that in July 2015, the Independent Cancer Taskforce
published a cancer strategy for England for 2015-20, which includes recommendations for improving access
to molecular diagnostics.civ
It is noteworthy that since the implementation of the 2012 reforms, NHS England has developed a
framework for so-called co-commissioning of primary care and collaborative commissioning of specialised
services, which will ultimately see the new local Clinical Commissioning Groups (CCGs) take on some
elements of commissioning as currently performed by NHS England itself. The stated rationale for this
transition is to enable NHS England and the CCGs to commission specialised care pathways that are better
suited to the needs of each local health economy, following patient feedback that the current configuration
has led to disjointed service delivery. Criticism of the proposals has focused on the potential for resulting
inequities in access to treatment (the so-called “postcode lottery”) due to inconsistent funding decisions, a
phenomenon which the centralisation of specialised services was supposed to protect against. Some
commentators see the decision to devolve greater responsibility to local-level commissioners as a question
of shifting the burden and forcing CCGs to absorb new risks on top of already strained budgets, a situation
reminiscent of the transfer of new classes of medicines to hospital budgets in the Netherlands.
NHS England’s specialised services commissioning intentions for 2016/17 in oncology include a focus on the
piloting of “population-based” commissioning, whereby entire cancer pathways will be commissioned in
one local health economy.cv The pilot will test devolving the full budget to CCGs, and potentially introduce a
population-based reimbursement model. Proposed supply-side innovations centre on introduction of one
lead provider of care to manage the budget for all local secondary and tertiary cancer services. If the model
is proven to be successful, this could lead to another means to hold down oncology drug costs in the longer-
term future. However, as alluded to above, a return to the “postcode lottery” might result, with access to
medicines dependent on decisions taken in the local health economy. Despite the government pledge to
improve spending on and outcomes in oncology, there is a risk that, given the frequent reorganisations of
commissioning responsibility, NHS patients face resulting challenges to access.
7.2 MACROECONOMIC DATA
Average Income (000s of 2005 US PPP USD)
2010 2011 2012 2013 2014 2015 2016* 2017* 2018* 2019* 2020*
France 51.6 51.3 50.4 50.0 50.1 50.8 51.1 51.6 52.0 52.4 52.7
Germany 47.0 48.6 48.6 48.6 49.0 49.9 50.5 51.0 51.4 51.9 52.4

Netherlands 44.9 45.2 44.4 43.8 43.8 43.2 43.5 43.8 44.5 45.0 45.5
Poland 35.4 36.3 36.3 36.2 36.6 37.4 38.5 39.6 41.0 42.3 43.7
Spain 48.2 47.1 44.2 43.3 43.7 44.8 45.4 45.7 46.0 46.6 47.2
United Kingdom 53.1 50.1 50.3 51.2 51.4 53.1 54.9 55.9 56.9 57.8 58.8
Note: * = forecast
Source: IHS Global Consumer Markets
Average Income (000s of USD)
2010 2011 2012 2013 2014 2015 2016* 2017* 2018* 2019* 2020*
France 62.6 66.4 61.2 63.4 63.4 53.2 54.8 60.3 67.1 71.4 74.1
Germany 53.6 59.4 55.7 58.2 59.2 50.1 52.3 57.4 63.6 67.2 69.5
Netherlands 53.8 58.0 53.4 55.7 56.4 46.3 47.7 52.5 58.8 62.7 65.2
Poland 22.8 25.0 23.5 24.3 24.5 20.9 23.0 27.6 33.6 37.4 39.8
Spain 52.1 54.9 48.7 49.8 50.1 42.2 43.7 47.9 53.2 56.7 59.0
51.6 50.8
52.7
47.0 49.9
52.4
44.9
43.2
45.5
35.4
37.4
43.7
48.2
44.8 47.2
53.1
53.1
58.8
2010 2011 2012 2013 2014 2015 2016 2017 2018 2019 2020
Average Income (000s of 2005 US PPP USD)

United Kingdom 64.0 64.8 65.6 67.2 72.2 69.8 74.2 79.9 85.8 89.2 93.1
Note: * = forecast
Source: IHS Global Consumer Markets
Life Expectancy at Birth (Years)
2010 2011 2012 2013 2014 2015 2016* 2017* 2018* 2019* 2020*
France 80.82 81.03 81.23 81.43 81.64 81.84 82.04 82.24 82.44 82.64 82.84
Germany 79.76 79.93 80.11 80.29 80.47 80.65 80.82 81.00 81.18 81.36 81.54
Netherlands 80.18 80.41 80.63 80.86 81.08 81.31 81.46 81.60 81.75 81.90 82.05
Poland 75.46 75.79 76.13 76.46 76.80 77.14 77.31 77.47 77.64 77.81 77.98
Spain 81.20 81.41 81.62 81.84 82.05 82.27 82.46 82.65 82.83 83.02 83.22
United Kingdom 79.65 79.80 79.96 80.12 80.29 80.45 80.61 80.77 80.93 81.09 81.25
Note: * = forecast
Source: IHS Global Consumer Markets
62.6
France, 53.2
74.1
Germany 53.6
50.1
69.5
Netherlands, 53.8
46.3
65.2
22.8
20.9
39.8
52.1
42.2
59.0
64.0
69.8
93.1
2010 2011 2012 2013 2014 2015 2016 2017 2018 2019 2020
Average Income in 000 USD

Unemployment Rate (%)
2010 2011 2012 2013 2014 2015 2016* 2017* 2018* 2019* 2020*
France 9.23 9.20 9.78 10.25 10.30 10.46 10.27 9.78 9.51 9.38 9.39
Germany 7.68 7.04 6.82 6.85 6.69 6.40 6.17 6.48 6.45 6.29 6.17
Netherlands 5.46 5.34 7.11 8.98 9.03 8.63 7.53 7.04 6.60 6.44 6.28
Poland 9.63 9.60 10.10 10.33 9.00 7.50 6.90 6.60 6.32 6.17 5.75
Spain 19.86 21.39 24.79 26.09 24.43 22.06 20.05 19.09 18.48 17.96 17.51
United Kingdom 7.90 8.10 7.98 7.60 6.20 5.34 4.82 4.71 4.64 5.02 5.31
Note: * = forecast
Source: IHS Global Consumer Markets
France, 80.8
81.8
82.8
Germany 79.8
80.6
81.5
80.2
81.3
82.1
75.5
77.1 78.0
81.2
82.3
83.2
79.6
80.4
81.2
2010 2011 2012 2013 2014 2015 2016 2017 2018 2019 2020
Life Expectancy at Birth (Years)

Real GDP in Billion USD (2010 USD)
2010 2011 2012 2013 2014 2015 2016* 2017* 2018* 2019* 2020*
France 2644.8 2700.2 2706.0 2726.2 2730.9 2762.5 2797.1 2835.9 2873.7 2911.2 2953.2
Germany 3416.8 3543.8 3565.6 3580.1 3636.8 3689.4 3757.7 3833.5 3899.4 3958.4 4024.5
Netherlands 836.1 850.0 841.0 837.5 846.0 862.8 874.5 891.8 907.5 923.8 940.5
Poland 479.2 503.3 511.1 517.7 535.0 554.3 575.1 593.9 613.1 631.3 650.0
Spain 1433.2 1418.9 1381.7 1358.6 1377.1 1421.4 1460.2 1494.8 1528.7 1561.2 1592.9
United Kingdom
2403.5 2450.9 2479.8 2533.4 2605.7 2662.4 2718.3 2787.0 2853.7 2917.2 2983.8
Note: * = forecast
Source: IHS Global Economic Data
9.2
France, 10.5
9.4
Germany 7.7 6.4
6.2
5.5
8.6
6.3
9.6
7.5
5.7
19.9
22.1
17.5
7.9
5.3 5.3
2010 2011 2012 2013 2014 2015 2016 2017 2018 2019 2020
Unemployment Rate (%)

Total Debt in USD
2010 2011 2012 2013 2014 2015 2016* 2017* 2018* 2019* 2020*
France 2,194.92 2,484.37 2,428.77 2,629.72 2,689.17 2,328.50 2,311.53 2,509.22 2,697.75 2,795.58 2,893.42
Germany 2,767.65 2,946.67 2,821.14 2,903.37 2,901.50 2,380.33 2,265.44 2,465.88 2,650.03 2,770.77 2,836.23
Netherlands 493.33 547.90 551.17 593.00 605.16 490.30 479.25 504.81 538.83 580.97 618.35
Poland 255.57 287.30 269.87 293.17 274.91 247.01 246.31 286.78 337.82 384.15 418.49
Spain 815.85 994.44 1,063.19 1,263.85 1,347.34 1,177.52 1,183.01 1,299.63 1,422.35 1,516.69 1,582.50
United Kingdom
1,672.92 1,893.98 2,041.50 2,171.67 2,452.03 2,357.84 2,282.23 2,626.81 2,757.14 2,802.82 2,858.30
Note: * = forecast
Source: IHS Global Economic Data
2,644.8
2,762.5
2,953.2
3,416.8
3,689.4 4,024.5
836.1
862.8 940.5
479.2 554.3
650.0
1,433.2
1,421.4 1,592.9
2,403.5 2,662.4
2,983.8
2010 2011 2012 2013 2014 2015 2016 2017 2018 2019 2020
Real GDP in Billion USD (2010 USD)

Government Total Expenditures in USD
2010 2011 2012 2013 2014 2015 2016* 2017* 2018* 2019* 2020*
France 1493.87 1601.14 1523.91 1602.7 1627.11 1376.55 1351.08 1488.47 1628.93 1747.54 1866.67
Germany 1614.65 1680.43 1573.35 1667.05 1712.41 1476.57 1480.21 1638.79 1791.82 1910.19 1996.25
Netherlands 395.39 416.46 386.74 399.05 402.04 343.22 345.62 386.2 431.66 460.82 489.47
Poland 218.62 230.43 212.94 222.16 229.69 210.65 211.06 237.6 279.63 319.13 349.62
Spain 654.17 679.14 639.97 618.8 614.27 521.07 502.91 551.36 602.24 646.53 683.01
United Kingdom
1031.15 1084.77 1092.77 1081.12 1132.08 1052.71 1000.04 1138.74 1204.17 1242.31 1288.9
Note: * = forecast
Source: IHS Global Economic Data
2,194.9 2,328.5
2,893.4
2,767.6
2,380.3
2,836.2
493.3
490.3 618.3
255.6
247.0
418.5
815.9
1,177.5
1,582.5 1,672.9
2,357.8
2,858.3
2010 2011 2012 2013 2014 2015 2016 2017 2018 2019 2020
Total Debt in USD

Fiscal Balance: % of GDP
2010 2011 2012 2013 2014 2015 2016* 2017* 2018* 2019* 2020*
France -6.80 -5.10 -4.81 -4.08 -3.97 -3.50 -3.20 -3.00 -2.82 -2.76 -2.75
Germany -4.22 -0.96 -0.09 -0.11 0.31 0.64 0.14 0.08 0.01 -0.06 -0.11
Netherlands -5.00 -4.30 -4.02 -2.36 -2.20 -2.01 -1.60 -1.16 -1.01 -0.68 -0.51
Poland -7.53 -4.85 -3.69 -4.02 -3.30 -2.96 -3.23 -2.85 -2.56 -2.31 -2.08
Spain -9.36 -9.37 -10.25 -7.00 -5.91 -4.79 -3.81 -3.61 -3.21 -2.96 -2.84
United Kingdom -9.12 -7.05 -7.57 -5.81 -5.40 -4.03 -3.18 -2.11 -1.25 -0.65 -0.35
Note: * = forecast
Source: IHS Global Economic Data
1,493.9
1,376.6
1,866.7
1,614.7 1,476.6
1,996.3
395.4 343.2
489.5
218.6
210.7
349.6
654.2 521.1 683.0
1,031.2
1,052.7
1,288.9
2010 2011 2012 2013 2014 2015 2016 2017 2018 2019 2020
Government Total Expenditures in USD

Real PPP Conversion Factor (2005 USD)
2010 2011 2012 2013 2014 2015 2016* 2017* 2018* 2019* 2020*
France 0.94 0.94 0.94 0.94 0.94 0.94 0.94 0.94 0.94 0.94 0.94
Germany 0.99 0.99 0.99 0.99 0.99 0.99 0.99 0.99 0.99 0.99 0.99
Netherlands 0.95 0.95 0.95 0.95 0.95 0.95 0.95 0.95 0.95 0.95 0.95
Poland 1.90 1.90 1.90 1.90 1.90 1.90 1.90 1.90 1.90 1.90 1.90
Spain 1.11 1.11 1.11 1.11 1.11 1.11 1.11 1.11 1.11 1.11 1.11
United Kingdom 0.82 0.82 0.82 0.82 0.82 0.82 0.82 0.82 0.82 0.82 0.82
Note: * = forecast
Source: IHS Global Consumer Markets
Demographic pyramid: percentage of the population by age brackets in years
France
-6.80
-3.50 -2.75
-4.22
0.64
-0.11
-5.00
-2.01 -0.51
-7.53
-2.96 -2.08
-9.36
-4.79
-2.84
-9.12
-4.03
-0.35
-12.0
-10.0
-8.0
-6.0
-4.0
-2.0
0.0
2.0
2010 2011 2012 2013 2014 2015 2016 2017 2018 2019 2020
Fiscal Balance: % of GDP

Source: IHS Global Consumer Markets
Germany
Source: IHS Global Consumer Markets
The Netherlands
12.4% 12.4% 12.4% 12.4% 12.3% 12.3% 12.2% 12.1% 12.1% 12.0% 11.9%
12.1% 12.0% 12.0% 12.0% 12.0% 12.1% 12.2% 12.2% 12.2% 12.2% 12.2%
12.6% 12.5% 12.4% 12.2% 11.9% 11.7% 11.6% 11.6% 11.5% 11.5% 11.5%
12.8% 12.6% 12.5% 12.4% 12.3% 12.2% 12.2% 12.2% 12.2% 12.2% 12.1%
13.8% 13.7% 13.7% 13.6% 13.5% 13.4% 13.3% 13.1% 12.9% 12.7% 12.5%
13.1% 13.0% 13.0% 13.0% 13.0% 13.0% 13.0% 13.0% 12.9% 12.9% 12.9%
10.4% 10.8% 11.2% 11.6% 11.8% 12.0% 12.1% 12.0% 11.9% 11.8% 11.8%
12.9% 12.9% 12.9% 12.9% 13.0% 13.2% 13.5% 13.9% 14.3% 14.7% 15.1%
2010 2011 2012 2013 2014 2015 2016 2017 2018 2019 2020
70+
60 to69
50 to59
40 to49
30 to39
20 to29
10 to19
0 to 9
8.6% 8.5% 8.5% 8.4% 8.4% 8.4% 8.4% 8.5% 8.5% 8.6% 8.6%
10.1% 10.0% 9.9% 9.8% 9.6% 9.5% 9.3% 9.2% 9.1% 8.9% 8.8%
12.2% 12.3% 12.2% 12.1% 11.9% 11.8% 11.6% 11.4% 11.2% 11.0% 10.8%
11.7% 11.6% 11.6% 11.8% 12.1% 12.3% 12.5% 12.7% 12.8% 12.9% 13.0%
17.1% 16.7% 16.3% 15.7% 15.0% 14.4% 13.8% 13.2% 12.7% 12.3% 12.0%
14.3% 14.7% 15.1% 15.4% 15.8% 16.1% 16.4% 16.6% 16.8% 16.9% 16.8%
11.1% 11.0% 11.0% 11.1% 11.2% 11.5% 11.8% 12.1% 12.5% 13.0% 13.4%
14.9% 15.2% 15.5% 15.8% 16.0% 16.1% 16.3% 16.3% 16.4% 16.5% 16.6%
2010 2011 2012 2013 2014 2015 2016 2017 2018 2019 2020
70+
60 to69
50 to59
40 to49
30 to39
20 to29
10 to19
0 to 9

Source: IHS Global Consumer Markets
Poland
Source: IHS Global Consumer Markets
Spain
11.4% 11.2% 11.1% 10.9% 10.8% 10.7% 10.6% 10.5% 10.5% 10.4% 10.4%
12.0% 11.9% 11.9% 11.9% 11.8% 11.7% 11.7% 11.6% 11.5% 11.3% 11.2%
11.9% 12.0% 12.0% 12.1% 12.1% 12.1% 12.1% 12.1% 12.1% 12.1% 12.0%
12.9% 12.5% 12.3% 12.1% 11.9% 11.8% 11.8% 11.8% 11.9% 12.0% 12.0%
15.8% 15.7% 15.5% 15.2% 14.9% 14.5% 14.1% 13.7% 13.2% 12.8% 12.4%
13.8% 13.9% 14.1% 14.2% 14.4% 14.6% 14.8% 14.9% 15.0% 15.0% 15.0%
11.5% 11.8% 12.0% 12.2% 12.4% 12.5% 12.5% 12.5% 12.5% 12.5% 12.6%
10.7% 10.9% 11.1% 11.4% 11.6% 12.0% 12.4% 12.9% 13.4% 13.9% 14.4%
2010 2011 2012 2013 2014 2015 2016 2017 2018 2019 2020
70+
60 to69
50 to59
40 to49
30 to39
20 to29
10 to19
0 to 9
9.8% 10.0% 10.1% 10.2% 10.3% 10.4% 10.3% 10.3% 10.2% 10.1% 9.9%
11.6% 11.2% 10.7% 10.3% 10.0% 9.7% 9.6% 9.5% 9.6% 9.7% 9.8%
16.2% 15.9% 15.5% 15.0% 14.5% 14.0% 13.5% 13.0% 12.5% 12.0% 11.6%
15.0% 15.4% 15.8% 16.1% 16.4% 16.6% 16.7% 16.7% 16.6% 16.4% 16.1%
12.4% 12.3% 12.2% 12.3% 12.5% 12.8% 13.1% 13.5% 13.9% 14.3% 14.8%
15.5% 15.4% 15.1% 14.8% 14.4% 13.9% 13.4% 12.9% 12.5% 12.1% 11.9%
9.4% 10.0% 10.6% 11.3% 11.9% 12.5% 13.0% 13.4% 13.7% 13.8% 13.9%
9.9% 10.0% 10.0% 10.0% 10.0% 10.2% 10.4% 10.8% 11.1% 11.6% 12.0%
2010 2011 2012 2013 2014 2015 2016 2017 2018 2019 2020
70+
60 to69
50 to59
40 to49
30 to39
20 to29
10 to19
0 to 9

Source: IHS Global Consumer Markets
The UK
Source: IHS Global Consumer Markets
7.3 DATA SOURCES
10.2% 10.2% 10.2% 10.1% 10.0% 9.9% 9.7% 9.5% 9.3% 9.2% 9.0%
9.2% 9.2% 9.2% 9.3% 9.4% 9.5% 9.6% 9.8% 10.0% 10.1% 10.3%
12.2% 11.6% 11.1% 10.7% 10.4% 10.2% 10.0% 9.8% 9.7% 9.6% 9.5%
17.5% 17.2% 16.8% 16.2% 15.7% 15.0% 14.4% 13.8% 13.2% 12.6% 12.0%
16.0% 16.1% 16.3% 16.4% 16.5% 16.6% 16.8% 16.9% 17.0% 17.0% 16.9%
12.6% 12.9% 13.3% 13.7% 14.1% 14.4% 14.7% 14.9% 15.1% 15.3% 15.5%
9.8% 10.0% 10.1% 10.3% 10.5% 10.7% 10.9% 11.1% 11.4% 11.6% 12.0%
12.6% 12.8% 13.0% 13.2% 13.4% 13.7% 13.9% 14.2% 14.4% 14.7% 14.9%
2010 2011 2012 2013 2014 2015 2016 2017 2018 2019 2020
70+
60 to69
50 to59
40 to49
30 to39
20 to29
10 to19
0 to 9
11.8% 12.0% 12.1% 12.2% 12.3% 12.4% 12.4% 12.4% 12.4% 12.3% 12.3%
12.4% 12.1% 11.9% 11.6% 11.4% 11.2% 11.2% 11.1% 11.2% 11.2% 11.3%
13.6% 13.6% 13.6% 13.6% 13.5% 13.4% 13.3% 13.1% 12.9% 12.7% 12.5%
13.0% 12.9% 12.8% 12.8% 12.9% 12.9% 13.0% 13.1% 13.3% 13.4% 13.4%
15.0% 14.9% 14.7% 14.4% 14.2% 13.9% 13.5% 13.2% 12.9% 12.6% 12.5%
11.9% 12.0% 12.3% 12.6% 12.9% 13.2% 13.4% 13.7% 13.8% 13.9% 13.9%
10.8% 10.9% 11.0% 11.0% 11.0% 10.9% 10.8% 10.7% 10.5% 10.5% 10.5%
11.5% 11.6% 11.7% 11.8% 11.9% 12.1% 12.4% 12.7% 13.0% 13.3% 13.6%
2010 2011 2012 2013 2014 2015 2016 2017 2018 2019 2020
70+
60 to69
50 to59
40 to49
30 to39
20 to29
10 to19
0 to 9
7.3.1 TOTAL AND PRIVATE HEALTHCARE EXPENDITURES
The IHS World Markets Healthcare Forecasts service provides projected and retrospective data on
healthcare expenditure and pharmaceutical sales across 36 countries. Data are based on the World Health
Organization (WHO) statistics, and forecasts continuously updated based on historical data sets. All
indicators were obtained from this service using data expressed in nominal terms unless otherwise noted.
The following glossary explains the terminology used in those figures derived from IHS World Markets
Healthcare Forecasts data:
Public healthcare expenditure: expenditure on healthcare incurred by public funds. Public funds are state, regional and local government bodies and social security schemes
Private healthcare expenditure: the sum total of the individual components of private expenditure as detailed below
Private insurance: expenditure on health incurred by private insurance funds (both private social insurance and all other private insurance funds)
Out-of-pocket expenditure: household out-of-pocket payments include cost sharing, self-medication and other expenditures paid directly by private households. These include co-payments, co-insurance, over-the-counter drug spending, etc.
Other private expenditure: includes non-public expenditures not paid by households or insurance. These include expenditures from non-profit institutions, foreign aid, etc.
Data from this service were used for retrospective and forecast total healthcare expenditure and private
healthcare expenditure.

7.3.2 CATEGORIES OF CARE SPENDING
Country-specific data sources were relied upon in order to obtain estimates for the proportion of total
public healthcare spending accounted for by discrete categories of care:
France The 2015 report Les dépenses de santé en 2014: Résultats des Comptes de la santé from
le Direction de la recherche, des études, de l’évaluation et des statistiques (DREES) cvi
Germany Data tables based on the Health Expenditure Accounts as maintained by the Online-
Datenbank der Gesundheitsberichterstattung (GBE) cvii
Netherlands Data on health and social care expenditure organised by functions and financing
maintained by the Statistics Netherlands cviii
Poland The archive of Zdrowie i ochrona zdrowia reports maintained by the Główny Urząd
Statystyczny cix
Spain The report Estadística de Gasto Sanitario Público published by the Subdirección General
de Cartera Básica de Servicios del SNS y Fondo de Cohesión cx
England The report Into the red? The state of the NHS’ finances by the Nuffield Trust cxi

7.3.3 PUBLIC PHARMACEUTICAL REIMBURSEMENT SPENDING
To obtain estimates of public reimbursement spending on pharmaceuticals overall and for oncology
specifically in the community pharmacy sector, country-specific data sources and methods were relied
upon:
France
The Medic'AM annual dataset provided by the Assurance Maladie public-sector insurance
body in France was utilised.cxii Total annual expenditure reported by this dataset was
computed as well as expenditure by ATC class, including codes L01 and LO2 for oncology. Due
to a change in the methodology for compiling the Medic'AM over the course of the
retrospective time period under analysis, the most recent data for the years 2012 and 2013
were taken. As 2012 was common to both datasets, new values for 2011 and 2010 were
calculated assuming the same percentage change in the market between 2011 and 2012 and
2010 and 2011 as reported in the old datasets but working backwards from the revised 2012
data. To project evolution of the retail market over 2015-20, the y/y percentage changes as
predicted by the IHS World Markets Healthcare Forecasts service were applied starting with
the 2014 data.
Germany
Data tables based on the Wissenschaftliches Institut der AOK (WIdO) as maintained by the GBE
were utilised to derive total annual expenditure by the SHI in the retail sector by ATC class,
including codes L01 and L02 for oncology.cxiii To project evolution of the retail market over
2015-20, the y/y percentage changes as predicted by the IHS World Markets Healthcare
Forecasts service were applied starting with the 2014 data.
Netherlands
Data tables based on the Genees- en hulpmiddelen Informatie Project (GIP) databank
maintained by the Zorginstituut Nederland were utilised to derive total annual expenditure in
the retail sector by ATC class, including codes L01 and L02 for oncology.cxiv To project evolution
of the retail market over 2015-20, the y/y percentage changes as predicted by the IHS World
Markets Healthcare Forecasts service were applied starting with the 2014 data.
Poland
A 2010 report from the Narodowego Funduszu Zdrowia (NFZ), Wydatki Narodowego Funduszu
Zdrowia z tytułu refundacji cen leków w 2010 roku - wersja rozszerzona, was used to derive a
breakdown of the retail market by ATC class.cxv Note that the share attributed to oncology is
an overestimate in Figure 3 as it encompasses all of the L codes. To obtain a more precise
estimate for oncology spending in the retail sector for the purposes of calculating total
oncology pharmaceutical spend as a basis for the forecasts, IMS Health data for the classes
Wspomaganie przy leczeniu onkologicznym and Onkologia as reported in an article from 2012
were utilised.cxvi It was assumed that spending on oncology drugs in the retail sector remained
at a constant ratio to overall community pharmacy spend in the absence of data on other
years. The figures for overall community pharmacy spend were derived from IHS Same Day
Analysis reports, on the basis of NFZ data. To forecast evolution of the retail market over
2015-20, projected spending by the NFZ was used for 2015 and 2016, and the y/y increase
between 2014-15 (2.56%) then used to project spending from 2017 onwards.

Spain
The annual memoranda published by the pharmaceutical industry association Farmaindustria
were utilised for estimates of the retail market, based on IMS data.cxvii These reports contain a
breakdown of the market by ATC class, including for class L as a whole. In order to derive a
more specific estimate for oncology, a study published in October 2013 by the Spanish
Medical Oncology Association reporting 2011 retail expenditure on oncology drugs, excluding
onco-haematological products, was relied upon.cxviii It was assumed that this spending as a
share of class L spending (as reported by Farmaindustria for the year 2011) held across the
other years in the retrospective period. To project evolution of the overall retail market over
2015-20, the y/y percentage changes as predicted by the IHS World Markets Healthcare
Forecasts service were applied starting with the 2014 data.
England
Prescription Cost Analysis data 2010-14 for England as maintained by the Health & Social Care
Information Centre (HSCIC) were utilised to obtain estimates for overall retail market
spending.cxix Spending totals by British National Formulary Sub Paragraphs were used in place
of ATC codes. For oncology, the following Sub Paragraphs were relied upon: Drugs for
Cytotoxic-Induced side-effects; Alkylating Drugs; Antimetabolites; Vinca Alkaloids And
Etoposide; Other Antineoplastic Drugs; Antiproliferative Immunosuppressants; Rituximab &
Alemtuzumab; Oestrogens; Progestogens; Breast Cancer; Prostate Cancer & Gonadorelin
Analogues. To project evolution of the overall retail market over 2015-20, the y/y percentage
changes as predicted by the IHS World Markets Healthcare Forecasts service were applied
starting with the 2014 data.

In order to arrive at estimates for public reimbursement spending on hospital drugs in general and oncology
medicines in hospital specifically, a variety of country-specific data sources were relied upon, as outlined
below. The estimates for public reimbursement spending on hospital oncology medicines and retail
oncology medicines were combined for the year 2014 to derive an estimate for total public-sector oncology
medicine spending for projection over 2015-20. The ratio of public-sector oncology medicine spending to
total public-sector drug reimbursement spending for 2014 was computed and used as the basis for the
“constant ratio” scenario for future oncology drug spending.
France
In France, l’Agence nationale de securite du medicament et des produits de sante (ANSM)
provides data on public pharmaceutical spending in the hospital sector in annual reports
stretching from 2010 to 2013.cxx The y/y 1.64% increase between 2012-13 was used to project
hospital spending forward over 2014-20 on the basis of assumed continued cost-containment
trends in this segment of the market. The same reports provide estimates of oncology drug
spending in the hospital sector. Again to derive the figure for 2014, the y/y increase between
2012-13 (1.04%) was applied. Because data on oncology drug spend in hospital was missing
for 2011 and instead aggregated with immunosuppressants, the ratio of immunosuppressant
spending to total hospital spending in other years (approx. 11%) was assumed to hold for this
year, and thus a figure for oncology specifically derived from the remaining portion.
Germany
In Germany, the Bundesverband der Pharmazeutischen Industrie (BPI), the pharmaceutical
industry association, provides figures for overall sales on drugs in the hospital sector based on
IMS Dataview.cxxi These figures, as reported in the Association’s “Pharma-Data 2015” report,
were relied upon for total public spending on hospital medicines over 2010-14. Separately, the
Bundesverband der Arzneimittel-Hersteller (BAH), an alternative industry association, provided
an estimate for SHI spending on oncology medicines as a whole for the year 2014 in its report
Der Arzneimittelmarkt in Deutschland - Zahlen und Fakten 2014.cxxii The figure calculated for
the overall value of the oncology retail market in 2014 as described above was subtracted to
derive an estimate for hospital spending on oncology medicines in this year.
Netherlands
In the Netherlands, the Nederlandse Zorgautoriteit (NZa), the Dutch Healthcare Authority,
provides estimates for spending on hospital drugs over 2010-13 in its 2015 research report,
Onderzoek naar de toegankelijkheid en betaalbaarheid van geneesmiddelen in de medisch
specialistische zorg.cxxiii It is important to note that the NZa separately reported the amounts
spent on medicines previously reimbursed in the pharmacy sector but since transferred into
hospital budgets; these figures were added retroactively in order to ensure a like-for-like
comparison across the retrospective timeframe. In its 2015 report Effectieve nieuwe middelen
tegen kanker, maar het financieringssysteem kraakt: Belemmeringen en oplossingen bij de
inzet van dure geneesmiddelen tegen kanker, the KWF Kankerbestrijding Werkgroep dure
geneesmiddelen, the Dutch Cancer Society, gives estimates for oncology spending in the
hospital sector for 2010-13.cxxiv To derive a figure for 2014, the CAGR over 2010-13 (8.1%) was
applied.
Poland In Poland, data published by the NFZ were relied upon as reported in the IHS Same Day
Analysis service for spending on drug programmes, standard chemotherapy and non-standard

chemotherapy as a proxy for overall hospital drug spending. NFZ budget estimates for
spending on drug programmes in 2015 and 2016 were relied upon, and the y/y change
between 2014-15 (3.2%) used to project this segment of the market forward over 2017-20.
The y/y change in standard chemotherapy spending over 2013-14 (11.6%) was deemed to be
atypically high, so a CAGR of 3% was used to project forward spending in this segment of the
market over 2015-20. To derive an estimate for hospital oncology drug spending specifically,
data on spending on oncology drug programmes in 2012 were taken from a report published
by experts from Lazarski University, Analiza dostępności do leczenia onkologicznego oraz
finansowania świadczeń z zakresu chemioterapii ze szczególnym uwzględnieniem nowych
terapii onkologicznych.cxxv It was assumed that hospital oncology drug spending would account
for the same share of overall hospital drug spending (26%) in 2014 to derive a figure for
overall oncology drug spend for projection forward over 2015-20.
Spain
In Spain, Farmaindustria, the pharmaceutical industry association, provides estimates for the
public hospital pharmaceutical market based on IMS data.cxxvi Data were available for 2010-14
as well as projections for the years 2015 and 2016. The forecast y/y change over 2015-16
(4.2%) was used to project hospital spending forward over 2017-20. The same 2011 figure
from the 2013 study referenced above from the Spanish Medical Oncology Association was
used to derive an estimate for total oncology spend in 2014, on the assumption that the
market would have recovered its losses from the prior period of austerity.cxxvii
England
For England, data from the HSCIC series of reports on Hospital Prescribing and Prescribing
Costs in Hospitals and the Community over 2010-14 were utilised for estimates of spending on
hospital medicines as a whole.cxxviii Data on overall NHS spending on oncology medicines was
derived from two presentations giving figures for 2012 and 2014.cxxix The implied CAGR
between 2012-14 was used to derive figures for the remaining years over the retrospective
time period. Hospital oncology drug spend specifically was derived by subtracting the retail
value of oncology drug spend (as obtained as described above) from these overall estimates.
After conducting literature review, the lower-range CAGR of oncology spending of 6% through 2018, as
forecast in the IMS Institute for Healthcare Informatics Global Oncology Trend Report 2015, was used as a
moderate or high growth rate scenario.cxxx In order to derive alternative forecast scenarios for total public
reimbursement spending on oncology, the following approaches were utilised:
France: The 4% y/y change in total oncology spending over 2013-14 as derived as described above
was used to project this spending forward over 2015-20 for the purposes of a medium growth rate
scenario; pervious years were not incorporated into a longer-term CAGR on the assumption that
more subdued growth during the austerity period would be uncharacteristic going forward
Germany: The 8.4% CAGR over 2012-14 of total oncology spending was used to project this
spending forward over 2015-20 for the purposes of a high growth rate scenario
The Netherlands: The 7.4% CAGR over 2012-14 of total oncology spending was used to project this
spending forward over 2015-20 for the purposes of a high growth rate scenario

Poland: For the reasons described above for the 3% y/y growth rate for standard chemotherapy
spending, the same rate was applied for total oncology spending to derive a medium growth rate
scenario
Spain: The 4% y/y change in total oncology spending applied in France was used as the basis for a
medium growth rate scenario on the basis of lack of comprehensive, public-domain data on recent
spending patterns in Spain
England: The 2.3% CAGR over 2012-15 of total oncology spending as implied by the data described
above was used as a medium growth rate scenario

7.4 BUDGET IMPACT METHODOLOGY
To determine the list of oncology therapies expected to have a significant budget impact over the 2016-
2020 period, the pipelines of major pharmaceutical companies known to be active in the oncology field
were reviewed. A large list of assets were identified, including immuno-oncology therapies, novel kinase
inhibitors, cell-cycle checkpoint inhibitors and other classes of agents, in addition to currently marketed
therapies undergoing evaluation for earlier lines of therapy. cxxxi Of this list, two classes of molecules were
identified to be sufficiently advanced in the pipeline as to have preliminary or final outcomes data as well as
information on pricing. These are the programmed death 1 (PD-1) and programmed death 1 ligand (PD-L1)
monoclonal antibodies in NSCLC, as well as the cyclin-dependent kinase 4/6 (CDK4/6) inhibitors in breast
cancer. These indications were determined to provide useful insights on the scale of expenditure on
treatment innovations in oncology in future given the relatively large patient populations impacted.
Nivolumab as second-line treatment in squamous and non-squamous advanced NSCLC was selected as
representative for the first class of agents based on availability of pricing data in a number of the European
countries and its presence on the market from 2016. Palbociclib as first-line treatment in combination with
endocrine therapy in post-menopausal, estrogen receptor-positive, HER2-negative metastatic breast
cancer, or second-line treatment following initial endocrine therapy, was chosen as representative of the
second class of agents, similarly due to availability of pricing data and expected presence on the market
from 2016. These agents were assumed to be broadly representative of their classes in terms of outcomes
and pricing so that the projections do not attempt to take account for market share between individual
agents, as this variable is dependent on many factors outside the scope of the present analysis.
In order to determine the size of the target patient population in each country, general lung cancer and
female-specific breast cancer incidence rates were taken from GLOBOCAN 2012, a project overseen by the
International Agency for Research on Cancer which provides estimates of the incidence, mortality and
prevalence rates of major types of cancer in a large number of countries.cxxxii In order to project annual
incidence rates through 2020, demographic data on projected population growth by age group for each
country from IHS World Markets Healthcare Forecasts were utilised, and combined with the 2012 age-
group-specific cancer incidence rates from the Surveillance Epidemiology and End Results (SEER)
programme in the US, in order to derive overall growth in incidence as the incidence-share-weighted sum of
age-group growth rates.cxxxiii This approach effectively assumes that the share of incident cases in the US by
age group is identical across markets and that this share will remain constant through 2020. This approach
was deemed preferable to tying incidence growth rates simply to overall population growth without
accounting for age.
The percentage of the incident population eligible for NSCLC therapy was determined using My Cancer
Genome (a website providing biomarker prevalence estimates in distinct cancer settings based on the
literature), as well as documents from National Institute for Health and Care Excellence (NICE) appraisals in
the UK and the Transparency Commission in France to obtain data on disease histology, staging at time of
diagnosis and percentage of patients receiving first- and second-line therapy.cxxxiv In the breast cancer

setting, documents from past NICE appraisals were reviewed to identify relevant biomarker prevalence
estimates, probability of therapy selection, and probability of progression to second-line therapy.cxxxv
The following schematics illustrate the procedure used to isolate the number of patients predicted to be
eligible for treatment each year:
To estimate treatment cost, the IHS PharmOnline International (POLI) pricing database was used to obtain
manufacturer list prices. We assumed a 20% discount off of this list price for both classes of agents in each
of the countries.
For nivolumab, prices were found for Germany and the UK. At a dosing schedule of 3mg/kg every 2 weeks
in NCLC and the assumption of a 70-kg average European body weight, monthly treatment costs were
estimated for these two countries. To extrapolate these prices to the remaining markets, POLI data for
NSCLC treatment gefitinib were utilised in order to determine representative price ratios between
countries, aside from in the case of the Netherlands where POLI data was lacking and the cost in Germany
was chosen instead.
To account for changes in exchange rates, the launch price of gefitinib in Poland was converted into euro at
that year’s average exchange rate, using IHS macroeconomic data. The ratio between this price in euro and
Germany’s launch price in euro was then taken to derive an estimate for the Polish price of PD-1/PD-L1
monoclonal antibodies in NSCLC in euro, then subsequently converted back into local currency units based
on the IHS forecast for the 2016 average exchange rate. For the Eurozone countries, the ratios between the
German price and their respective launch prices were also considered.
This approach was deemed preferable to making the assumption of equivalent pricing across all markets,
due to the reality that pricing dynamics may vary by the priority certain countries allocate to cancer
treatments. In the case of palbociclib, pricing was only available for the US market. As in the case of NSCLC,

the same approach was used in terms of launch prices and local currency unit conversions as outlined for
Poland above across all of the European countries with reference to the US dollar. Due to variations in
breast cancer treatment guidelines across countries and question marks over a suitable comparator, it was
decided to use the ratios derived for gefitinib to determine relative pricing levels of palbociclib.
To estimate treatment duration, median progression free survival (PFS) figures for nivolumab in squamous
and non-squamous NSCLC were taken from results from the pivotal clinical trials, 3.5 months and 2.3
months, respectively.cxxxvi. For palbociclib in the first-line setting, a median PFS of 20.2 months based on the
results from the PALOMA-1 trial was utilised, on the assumption that upon disease progression, patients
would switch to a standard second-line treatment.cxxxvii In the second-line setting, a median PFS of 9.2
months based on the results from the PALOMA-3 trial was relied upon.cxxxviii The additional 0.2 months of
treatment in the first-line setting were carried over into the following year’s forecast, such that the cost of
this treatment was multiplied by the eligible population in the preceding year and added to the newly
incident number of cases to determine the overall predicted annual cost.
Finally, to estimate rates of market uptake, assumptions were modelled off of the submission made by the
manufacturer of nivolumab to NICE in the UK.cxxxix The submission assumes that in 2016, year one of the
timeframe, 4% of eligible patients would go onto nivolumab, rising to 36% in year two, and then remaining
at 40% through 2020. A review of the grey literature revealed that nivolumab captured over 70% of market
share in the US market within less than one year from launch.cxl Because the model reported in the NICE
submission might thus represent an underestimation, for both nivolumab and palbociclib, a market share of
4% was assumed in 2016 (with entry onto the Polish market in 2017 to allow for typical launch sequencing
patterns), rising to 35% in 2017, and then remaining at 60% for the remainder of the period through to
2020. This scenario was complemented by an alternative assuming equivalent penetration in year one, then
rising to 15% in year two and enduring at 40% in all years thereafter.

i IHS Same Day Analysis, France: France Adopts Austerity Bill for 2011, 26 November 2010
ii IHS Same Day Analysis, France: Reimbursement, Price Cuts Planned As Part of PLFSS 2011 in France, 29 September 2010
iii IHS Same Day Analysis, Germany: German Cabinet Approves Rise in Healthcare Premiums, 23 September 2010
iv IHS Same Day Analysis, Netherlands: Dutch statistics agency reports slowdown in increase of drugs dispensed in 2013, 29 July
2014
v Lago Moneo et al. “Línea Perspectivas: El gasto farmacéutico en España 2014 Evolución internacional y situación desde el punto
de vista nacional,” June 2014, http://mba.americaeconomia.com/sites/mba.americaeconomia.com/files/eae_business_school._el_gasto_farmaceutico_2014.pdf (last accessed on 26 April 2016)
vi IHS Same Day Analysis, Spain: Spanish Medical Association states it is against increasing co-payments, 25 July 2014
vii IHS Same Day Analysis, Spain: Spain's PSM proposes elimination of co-payments, 15 December 2014
viii SFK, “Facts and figures 2014 on pharmaceutical care in the Netherlands,”
https://www.sfk.nl/english/Dataenfeiten2014_A4_magazine_web.pdf (last accessed on 8 February 2016)
ix IHS Same Day Analysis, France: French Government Introduces New 10-20% Reimbursement Rate, over 100 Drugs of Low
Therapeutic Value Targeted, 7 January 2010
x IHS Same Day Analysis, Germany: Germany's 2013 drug prescription report reveals untapped savings potential from generics and
higher-priced originators, 13 September 2013
xi IHS Same Day Analysis, Germany: SHI fund and physician association agree on higher prescription growth limits for 2014-15, 27
October 2014
xii IHS Same Day Analysis, Netherlands: Dutch drug expenditure declines 16% during past five years, 16 December 2013
xiii IHS Same Day Analysis, Netherlands: Generic drug market share rises to 70% by volume during 2013 in Netherlands, 25 March
2014
xiv IHS Same Day Analysis, Poland: Polish MoH calls for sharp price cuts in negotiations on new drug reimbursement agreements, 3
October 2013
xv IHS Same Day Analysis, Spain: Government and CCAA Agree on Guidelines for "Health Pact" in Spain, Pharmaceutical Sector
Fears Consequences, 23 March 2010
xvi IHS Same Day Analysis, Spain: Spain's P&R Austerity Measures to Be Officially Enforced on 1 August, 16 July 2012
xvii IHS Same Day Analysis, Spain: Spain eliminates hospital co-payment, 16 January 2015; IHS Same Day Analysis, Spain: Spain's
Catalonia ends EUR1-per-prescription charge, 17 January 2013
xviii IHS Same Day Analysis, France: French Government Introduces New 10-20% Reimbursement Rate, over 100 Drugs of Low
Therapeutic Value Targeted, 7 January 2010
xix IHS Same Day Analysis, France: France's Private Insurers Plan Own Reimbursement System Based on SMR Rating, 18 August
2010
xx IHS Same Day Analysis, Germany: German patients pay 22% more y/y in 2014 for difference between reference and actual drug
prices, 3 June 2015
xxi IHS Same Day Analysis, Germany: New German government finalises healthcare plans featuring significant pharma-related
measures, 6 December 2013
xxii IHS Same Day Analysis, Netherlands: Dutch drug expenditure declines 16% during past five years, 16 December 2013
xxiii IHS Same Day Analysis, Poland: Many drugs face withdrawal from Polish market due to failed price negotiations as parallel
export problems persist, 30 September 2015

xxiv IHS Same Day Analysis, Poland: Polish MoH publishes new list of medicines facing supply threats due to parallel export , 8
January 2016
xxv IHS Same Day Analysis, Spain: Almost one-quarter of drugs withdrawn from Spain's co-payment list experience price increases
or are withdrawn, 3 September 2013
xxvi IHS Same Day Analysis, Spain: Innovative drugs in Spain experience drop in market share, 2 January 2014
xxvii Cancer Research UK, Molecular Diagnostic Provision in England, August 2015,
http://www.cancerresearchuk.org/sites/default/files/policy_august2015_mdx_final_1.pdf
xxviii ANSM, “Analyse des ventes de medicaments en France en 2013,” June 2014
xxix Bundesverband der Pharmazeutischen Industrie, Pharma-Data 2015,
http://www.bpi.de/fileadmin/media/bpi/Downloads/Internet/Publikationen/Pharma-Daten/Pharmadaten_2015_EN.pdf (last accessed 23 December 2015); ANSM, “Analyse des ventes de medicaments en France en 2013,” June 2014, http://ansm.sante.fr/var/ansm_site/storage/original/application/3df7b99f8f4c9ee634a6a9b094624341.pdf (last accessed on 4 March 2016). N.B. The Pharma-Data 2015 report lists two entries for the category L01X Other antineoplastic agents in the table on page 93 containing the data from which this graph was derived. It was assumed the second entry was mislabelled in error, and only the first value of EUR841.3 mil was taken in combination with the L01B Antimetabolites category to derive an estimate for oncology as a whole.
xxx Lord Carter of Coles, "Operational productivity and performance in English NHS acute hospitals: Unwarranted variations,"
February 2016, https://www.gov.uk/government/uploads/system/uploads/attachment_data/file/499229/Operational_productivity_A.pdf (last accessed on 18 April 2016)
xxxi Institut National du Cancer, Les cancers en France - Edition 2014, http://www.e-cancer.fr/Expertises-et-publications/Catalogue-
des-publications/Les-cancers-en-France-Edition-2014 (last accessed on 23 December 2015)
xxxii Luengo-Fernandez R et al. Economic burden of cancer across the European Union: a population-based cost analysis, The
Lancet Oncology, Vol. 14, November 2013
xxxiii Cost of illness tool, Volksgezondheidenzorg, https://kostenvanziektentool.volksgezondheidenzorg.info/tool/english/ (last
accessed 23 December 2015)
xxxiv Polskie Towarzystwo Onkologiczne, Obecny Stan Zwalczania Nowotworow w Polsce, 16 May 2014
xxxv Sociedad Española de Oncología Médica, Aproximación al cálculo del coste del abordaje del cáncer en España, October 2013
xxxvi Newland A, "Key Issues in Haematology Commissioning," September 2014,
http://www.google.com/url?sa=t&rct=j&q=&esrc=s&frm=1&source=web&cd=23&ved=0ahUKEwjivPed_v7JAhUHfxoKHbxbB0A4FBAWCCgwAg&url=http%3A%2F%2Fwww.ncin.org.uk%2Fview%3Frid%3D2792&usg=AFQjCNG47T-5LG9b8Z8jWARfdUIDWOGUdA&sig2=Tye7JKhPBXVJMHVe8lM5iw&bvm=bv.110151844,d.d2s (last accessed 23 December 2015)
xxxvii IHS Same Day Analysis, France: France's government curtails pharmaceutical expenditure by additional USD857 mil. in 2015,
17 Apr 2015
xxxviii IHS Same Day Analysis, Germany: Germany's statutory health insurance funds and state hospitals dispute over costs of health
reforms, 21 July 2015
xxxix van Ginneken, E. "Perennial health care reform - the long Dutch quest for cost control and quality improvement," Perspective, 3
September 2015, New England Journal of Medicine, http://www.nejm.org/doi/pdf/10.1056/NEJMp1410422 (last accessed on 2 March 2016)
xl The Economist Intelligence Unit, "Government faces struggle to cut healthcare spending," 17 February 2015
xli NHS Five Year Forward View, October 2014, https://www.england.nhs.uk/wp-content/uploads/2014/10/5yfv-web.pdf (last
accessed on 18 April 2016)
xlii IHS Same Day Analysis, United Kingdom: UK Chancellor gives NHS above inflation cash injection but slashes budget for public
health, 27 November 2015

xliii IHS Same Day Analysis, France: Treasury Department advocates changes to reimbursement for chronic diseases in France, 12
June 2015
xliv IHS Same Day Analysis , Germany: Political division deepens in Germany over growing burden of statutory health insurance
contributions on patients, 7 January 2016
xlv IHS World Markets Pricing and Reimbursement (WMPR) service, Country Profiles: Spain
xlvi Instituto para el Desarrollo e Integracion de la Sanidad, "Sandidad Privada, aportando valor: Analisis de situacion 2015,"
http://www.redaccionmedica.com/contenido/images/Informe_Analisis_Situac_IDIS%C2%A116-03-15%20final.pdf (last accessed on 11 February 2016)
xlvii Thomson S & Mossialos E. “Private health insurance in the European Union: Final report prepared for the European
Commission, Directorate General for Employment, Social Affairs and Equal Opportunities,” 2009
xlviii IHS Same Day Analysis, Germany: German research institute attributes increased 2014 public drug spending to regulatory
changes, surge in new innovative drugs , 10 June 2015
xlix Pharmaceutical Research and Manufacturers of America, “Medicines in Development: Cancer, 2014 Report”
l IHS Same Day Analysis, Germany: Germany's AOK funds announce TNF-alpha inhibitors discount contracts, first across entire
drug class, 22 September 2015
li Redaccion Medica, "El BOE publica los precios de referencia," 17 October 2015,
http://www.redaccionmedica.com/secciones/industria/precios-de-referencia-precios-de-referencia-88568 (last accessed on 11 February 2016)
lii Spanish Ministry of Health, Notas de Prensa, "El gasto farmacéutico se mantiene estable en el año 2015 y se consolida el ahorro
para el Sistema Nacional de Salud," 29 January 2016, http://www.msssi.gob.es/gabinete/notasPrensa.do?id=3888 (last accessed on 12 February 2016)
liii IHS Same Day Analysis, United Kingdom: Pharma industry brings forward GBP200-mil. payment to UK government, 23
December 2015
liv IHS Same Day Analysis, France: French MoH specifies rules for inclusion of high-cost medicines in T2A exclusion list, 28 March
2016
lv Axon, "The Netherlands: All eyes on pharmaceutical expenditures in the hospital sector," September 2015
lvi IHS Same Day Analysis, Poland: Supreme Audit Office gives mixed assessment of Poland's system for funding high-cost
medicines, 8 January 2015
lvii IHS Same Day Analysis, Poland: Proposed Polish cancer foundation could provide substantial funding for innovative oncology
drugs, 27 August 2015
lviii SEOM press release, “"SEOM detecta heterogeneidades en el accesso a farmacos y en el manejo asistencial de los pacientes
con cancer en las CCAA," 23 October 2015, http://www.seom.org/seomcms/images/stories/recursos/NP_28_10_15.pdf (last accessed on 8 February 2016)
lix IHS Same Day Analysis, Poland: Hodgkin lymphoma treatment Adcetris is single new innovative drug in Poland's draft May
reimbursement list update, 25 April 2016
lx IHS Same Day Analysis, France: France limits health insurance expenditure increase at 2% in 2015–17, 24 Apr 2014
lxi IHS Same Day Analysis, France: France's government curtails pharmaceutical expenditure by additional USD857 mil. in 2015, 17
Apr 2015
lxii IHS Same Day Analysis, France: Treasury Department advocates changes to reimbursement for chronic diseases in France, 12
June 2015
lxiii IHS Same Day Analysis, France: French government report proposes establishment of single reimbursement rate, 9 September
2015
lxiv IHS Same Day Analysis, France: France's draft 2016 social security budget foresees more than USD617 mil. in savings from
reduced drug prices, 6 October 2015
lxv IHS Same Day Analysis, France: French hospital association calls for greater transparency and consistency in funding of hospital
drugs, 9 December 2015
lxvi IHS Same Day Analysis, France: France's draft 2016 social security budget foresees more than USD617 mil. in savings from
reduced drug prices, 16 October 2015
lxvii IHS Same Day Analysis, Germany: Germany's political left concerned about increasing burden of health insurance premiums on
employees, 22 December 2015
lxviii IHS Same Day Analysis , Germany: Political division deepens in Germany over growing burden of statutory health insurance
contributions on patients, 7 January 2016
lxix IHS Same Day Analysis, Germany: German patients pay 22% more y/y in 2014 for difference between reference and actual drug
prices, 3 June 2015
lxx IHS Same Day Analysis, Germany: Germans face increasing co-payments for medicines, combined with rising health insurance
contributions, 8 January 2016
lxxi IHS Same Day Analysis, Germany: TK's Innovation Report criticises limited savings achieved by Germany's AMNOG, 11
September 2015
lxxii IHS Same Day Analysis, Germany: German government reveals planned changes to P&R regulations, including positives and
negatives for pharma, 13 April 2016
lxxiii IHS Same Day Analysis, Germany: Germany's association of statutory HI funds calls for overhaul of assessments of orphan
drugs, 22 January 2016
lxxiv IHS Same Day Analysis, German MoH maintains price freeze and mandatory discounts as GKV reimbursement rises 5% y/y in
2015 , 3 February 2016
lxxv IHS Same Day Analysis, Germany: Germany's AOK funds announce TNF-alpha inhibitors discount contracts, first across entire
drug class, 22 September 2015
lxxvi NZa, "Onderzoek naar de toegankelijkheid en betaalbaarheid van geneesmiddelen in de medisch specialistische zorg," June
2015
lxxvii IHS Same Day Analysis, Netherlands: AMC study finds Dutch hospitals unable to fund Avastin treatment in 50% of cases, 19
June 2015
lxxviii IHS Same Day Analysis, Netherlands: Netherlands' MEB allows exchange between biologic and biosimilar drugs, 8 April 2015
lxxix SFK, “Facts and figures 2014 on pharmaceutical care in the Netherlands,”
https://www.sfk.nl/english/Dataenfeiten2014_A4_magazine_web.pdf (last accessed on 8 February 2016)
lxxx IHS Same Day Analysis, Poland: Poland's health minister sets course for transfer to tax-based healthcare system by 2018, 27
January 2016
lxxxi IHS Same Day Analysis, Poland: Polish government publishes draft amendment on free medicines for over-75s, upper spending
limit of USD127 mil. set for 2016, 23 December 2015
lxxxii IHS Same Day Analysis, Poland: Polish opposition accuses government of reneging on free drugs for over-75s, only USD31
mil. available for 2016, 7 January 2016
lxxxiii IHS Same Day Analysis, Poland: Polish MoH improves access to new oncology drugs, imposes restrictions on market access,
3 March 2014
lxxxiv IHS Same Day Analysis, Poland: Supreme Audit Office gives mixed assessment of Poland's system for funding high-cost
medicines, 8 January 2015
lxxxv Euronews, "Spain has to cut deficit in 2016, Moscovici says," 4 February 2016, http://www.euronews.com/business-
newswires/3142358-spain-has-to-cut-deficit-in-2016-moscovici-says/ (last accessed on 11 February 2016)

lxxxvi Instituto para el Desarrollo e Integracion de la Sanidad, "Sandidad Privada, aportando valor: Analisis de situacion 2015,"
http://www.redaccionmedica.com/contenido/images/Informe_Analisis_Situac_IDIS%C2%A116-03-15%20final.pdf (last accessed on 11 February 2016)
lxxxvii revistamedica, 3 January 2016, no. 270, http://www.rmedica.es/edicion/270/lo-que-el-2016-depara-a-la-sanidad (last accessed
on 11 February 2016)
lxxxviii Redaccion Medica, "Las CCAA presupuestan más de 50.000 millones en sanidad para 2016,"
http://www.redaccionmedica.com/noticia/fin-de-la-crisis-todas-las-ccaa-aumentan-sus-presupuestos-91362 (last acessed on 11 February 2016)
lxxxix Farmaindustria, Notas de prensa, "El cierre de 2015 sitúa la deuda del mercado hospitalario público de medicamentos en su
cifra más baja desde 2006," 1 February 2016, http://www.farmaindustria.es/web/prensa/notas-de-prensa/2016/02/01/el-cierre-de-2015-situa-la-deuda-del-mercado-hospitalario-publico-de-medicamentos-en-su-cifra-mas-baja-desde-2006/ (last accessed on 11 February 2016)
xc Spanish Ministry of Health, Notas de Prensa, "El gasto farmacéutico se mantiene estable en el año 2015 y se consolida el ahorro
para el Sistema Nacional de Salud," 29 January 2016, http://www.msssi.gob.es/gabinete/notasPrensa.do?id=3888 (last accessed on 12 February 2016)
xci Redaccion Medica, "El BOE publica los precios de referencia," 17 October 2015,
http://www.redaccionmedica.com/secciones/industria/precios-de-referencia-precios-de-referencia-88568 (last accessed on 11 February 2016)
xcii The Health Foundation, “Current NHS spending in England,” January 2015
xciii IHS Same Day Analysis, United Kingdom: NHS providers' deficit reaches USD2.4 bil., 24 November 2015
xciv NHS Five Year Forward View, October 2014, https://www.england.nhs.uk/wp-content/uploads/2014/10/5yfv-web.pdf (last
accessed on 18 April 2016)
xcv IHS Same Day Analysis, United Kingdom: UK Chancellor gives NHS above inflation cash injection but slashes budget for public
health, 27 November 2015
xcvi IHS Same Day Analysis, United Kingdom: UK to set 28-day cancer referral target by 2020, 15 September 2015
xcvii HM Treasury, Policy paper: Spending review and autumn statement 2015, November 2015,
https://www.gov.uk/government/publications/spending-review-and-autumn-statement-2015-documents/spending-review-and-autumn-statement-2015 (last accessed on 18 April 2016)
xcviii IHS Same Day Analysis, United Kingdom: UK Chancellor gives NHS above inflation cash injection but slashes budget for public
health, 27 November 2015
xcix IHS Same Day Analysis, Poland: Polish MoH's new oncology plan foresees scrapping limits on care provision, plan to reduces
queues presented, 31 March 2014
c IHS Same Day Analysis, Poland: Oncology reform in Poland to take funding away from other areas, 9 April 2014
ci Staines et al. “NHS reforms in England: the implications for chemotherapy commissioning,” Ecancermedicalscience. 2014; 8: 451
cii IHS Same Day Analysis, United Kingdom: NHS England starts consultation on CDF model proposal, 20 November 2015
ciii Cancer Research UK, Molecular Diagnostic Provision in England, August 2015,
http://www.cancerresearchuk.org/sites/default/files/policy_august2015_mdx_final_1.pdf
civ The Independent Cancer Taskforce, "Achieving world-class cancer outcomes: A strategy for England 2015-2020," July 2015,
http://www.cancerresearchuk.org/sites/default/files/achieving_world-class_cancer_outcomes_-_a_strategy_for_england_2015-2020.pdf (last accessed on 18 April 2016)
cv NHS England, Commissioning Intentions 2015/16 for Prescribed Specialised Services, September 2014
cvi DREES, “Les dépenses de santé en 2014: Résultats des Comptes de la santé,” 2015,
http://www.acuite.fr/sites/acuite.fr/files/articles_pj/comptes_nationaux_sante_2014.pdf (last accessed on 4 March 2016)

cvii Die Online-Datenbank der Gesundheitsberichterstattung, http://www.gbe-bund.de (last accessed on 4 March 2016)
cviii Statistics Netherlands, http://statline.cbs.nl/StatWeb/publication/?VW=T&DM=SLEN&PA=83073ENG&LA=EN (last accessed on
4 March 2016)
cix Główny Urząd Statystyczny, http://stat.gov.pl/obszary-tematyczne/zdrowie/zdrowie/zdrowie-i-ochrona-zdrowia-w-2014-r-
,1,5.html#archive (last accessed on 4 March 2016)
cx Subdirección General de Cartera Básica de Servicios del SNS y Fondo de Cohesión , “Estadística de Gasto Sanitario Público
2013,” April 2015, http://www.msssi.gob.es/estadEstudios/estadisticas/docs/EGSP2008/egspPrincipalesResultados.pdf (last accessed on 4 March 2016)
cxi Nuffield Trust, ”Into the red? The state of the NHS’ finances,” July 2014,
http://www.nuffieldtrust.org.uk/sites/files/nuffield/publication/into-the-red-report.pdf (last accessed on 4 March 2014)
cxii l’Assurance Maladie, Medic'AM data 2008-2012 and 2012-2014, http://www.ameli.fr/l-assurance-maladie/statistiques-et-
publications/donnees-statistiques/medicament/medic-am/medic-am-2008-2013.php (last accessed on 23 December 2015)
cxiii Die Online-Datenbank der Gesundheitsberichterstattung, http://www.gbe-bund.de (last accessed on 4 March 2016)
cxiv GIPdatabank, https://www.gipdatabank.nl/default.asp (last accessed on 4 March 2016)
cxv NFZ, “Wydatki Narodowego Funduszu Zdrowia z tytułu refundacji cen leków w 2010 roku - wersja rozszerzona,” 2011,
http://www.nfz.gov.pl/download/gfx/nfz/pl/defaultstronaopisowa/349/14/1/refundacja_2010.pdf (last accessed on 4 March 2016)
cxvi Zwoliński, A. "Ile zapłacimy? Lista leków refundowanych," więcej na Money.pl, 2012, http://www.znaneleki.pl/abc-
farmaceuty/13-artykuly-powiazane/769-ile-zapacimy-lista-lekow-refundowanych.html (last accessed on 4 March 2016)
cxvii Farmaindustria, http://www.farmaindustria.es/web/documentos/memorias/, (last accessed on 4 March 2016)
cxviii SEOM, "Aproximación al cálculo del coste del abordaje del cáncer en España," October 2013
cxix HSCIC, Prescription Cost Analysis, http://www.hscic.gov.uk/searchcatalogue?q=title%3A%22prescription+cost+analysis%22
(last accessed on 4 March 2016)
cxx ANSM, “Analyse des ventes de medicaments en France en 2013,” June 2014, http://ansm.sante.fr/var/ansm_site/storage/original/application/3df7b99f8f4c9ee634a6a9b094624341.pdf (last accessed on 4 March 2016)
cxxi Bundesverband der Pharmazeutischen Industrie, Pharma-Data 2015,
http://www.bpi.de/fileadmin/media/bpi/Downloads/Internet/Publikationen/Pharma-Daten/Pharmadaten_2015_EN.pdf (last accessed 23 December 2015)
cxxii BAH, “Der Arzneimittelmarkt in Deutschland - Zahlen und Fakten 2014,” https://www.bah-
bonn.de/index.php?eID=dumpFile&t=f&f=5526&token=8d393e946b928c6a85c98a1af98e6f2fc0fb5176 (last accessed on 4 March 2016)
cxxiii NZa, “Onderzoek naar de toegankelijkheid en betaalbaarheid van geneesmiddelen in de medisch specialistische zorg,” 2015,
https://www.nza.nl/1048076/1048181/Onderzoeksrapport__Toegankelijkheid_en_betaalbaarheid_van_geneesmiddelen_in_de_medisch_specialistis.pdf (last accessed on 4 March 2016)
cxxiv KWF, “Effectieve nieuwe middelen tegen kanker, maar het financieringssysteem kraakt: Belemmeringen en oplossingen bij de
inzet van dure geneesmiddelen tegen kanker,” 2015, https://www.kanker.nl/uploads/file_element/content/12928/Rapport_KWF-werkgroep_finale.pdf (last accessed on 4 March 2016)
cxxv Wiciak-Obrębska, M et al., “Analiza dostępności do leczenia onkologicznego oraz finansowania świadczeń z zakresu
chemioterapii ze szczególnym uwzględnieniem nowych terapii onkologicznych,” 2013, http://instytuty.lazarski.pl/fileadmin/user_upload/iooz/Publikacje/Raport_-_calosc__wersja_ostateczna__26.02.2013.pdf (last accessed on 4 March 2016)
cxxvi Farmaindustria, "Indicadores básicos del sector: la industria farmacéutica española y su mercado en cifras," 2015,
http://www.farmaindustria.es/web/wp-content/uploads/sites/2/2015/11/4-Pedro-Luis-Sánchez-Seminario-Pdtas.-2015.pdf (last accessed on 10 February 2016)

cxxvii SEOM, "Aproximación al cálculo del coste del abordaje del cáncer en España," October 2013
cxxviii HSCIC, "Hospital Prescribing" and "Prescribing Costs in Hospital and the Community,"
http://www.hscic.gov.uk/searchcatalogue?topics=1%2fPrescribing%2fHospital+prescribing&infotype=0%2fOfficial+statistics&sort=Relevance&size=10&page=1#top (last accessed on 4 March 2016)
cxxix Clark P, "The commissioning of cancer drugs in England now and in the next 5 years," November 2015,
http://www.ukbcm.org.uk/presentations2015/P-Clark.pdf (last accessed on 4 March 2016); Newland A, "Key issues in haematology commissioning," June 2013, http://www.ncin.org.uk/view?rid=2348 (last accessed on 4 March 2016)
cxxx IMS Institute for Healthcare Informatics, Developments in Cancer Treatments, Market Dynamics, Patient Access and Value:
Global Oncology Trend Report 2015
cxxxi Pharmaceutical Research and Manufacturers of America, “Medicines in Development: Cancer, 2014 Report.”
cxxxii IARC, GLOBOCAN 2012, http://globocan.iarc.fr/Default.aspx (last accessed 23 December 2015)
cxxxiii National Cancer Institute, SEER Program, http://seer.cancer.gov/faststats/selections.php?series=age (last accessed 23
December 2015)
cxxxiv Estimates of percentage diagnosed in stage IIIb or IV, and percentage receiving first-line and second-line therapy:
NICE, "Single Technology Appraisal - Nivolumab for previously treated locally advanced or metastatic squamous non-small-cell lung cancer: Committee Papers," http://www.nice.org.uk/guidance/GID-TAG506/documents/committee-papers (last accessed on 4 March 2016); Biomarker prevalence rates: My Cancer Genome, Molecular Profiling of Lung Cancer, https://www.mycancergenome.org/content/disease/lung-cancer/ (last accessed on 4 March 2016); Percentage NSCLC and squamous/non-squamous: the HAS, Transparency Committee opinion: Xalkori, 3 April 2013, http://www.has-
sante.fr/portail/upload/docs/application/pdf/2013-10/xalkori_ct_12648.pdf (last accessed 23 December 2015)
cxxxv Percentage of breast cancers HR+, HER2- and in postmenopausal women: Liverpool Reviews and Implementation Group,
"Everolimus in combination with an aromatase inhibitor for the treatment of advanced or metastatic HER2 negative, oestrogen receptor positive breast cancer after prior endocrine therapy," February 2013, p. 13, https://www.nice.org.uk/guidance/TA295/documents/breast-cancer-her2-negative-oestrogen-receptor-positive-locally-advanced-or-metastatic-everolimus-with-an-aromatase-inhibitor-evidence-review-group-report2 (last accessed on 4 March 2016); Percentage eligible for 1
st-line endocrine therapy and who progress to 2
nd-line therapy: Liverpool Reviews and Implementation Group,
"Fulvestrant for the treatment of locally advanced or metastatic breast cancer," June 2011, p.18, http://www.nice.org.uk/guidance/TA239/documents/breast-cancer-metastatic-fulvestrant-evidence-review-group-report2 (last accessed on 4 March 2016)
cxxxvi Brahmer J et al. Nivolumab versus Docetaxel in Advanced Squamous-Cell Non–Small-Cell Lung Cancer, N Engl J Med 2015;
373: 123-135; Borghaei H et al. Nivolumab versus Docetaxel in Advanced Nonsquamous Non–Small-Cell Lung Cancer, N Engl J Med 2015; 373: 1627-1639
cxxxvii Finn RS et al. The cyclin-dependent kinase 4/6 inhibitor palbociclib in combination with letrozole versus letrozole alone as first-
line treatment of oestrogen receptor-positive, HER2-negative, advanced breast cancer (PALOMA-1/TRIO-18): a randomised phase 2 study, Lancet Oncol, 2015 Jan; 16(1):25-35
cxxxviii ASCO Meeting Library, Abstracts, 2015 ASCO Annual Meeting, PALOMA3: A double-blind, phase III trial of fulvestrant with or
without palbociclib in pre- and post-menopausal women with hormone receptor-positive, HER2-negative metastatic breast cancer that progressed on prior endocrine therapy, http://meetinglibrary.asco.org/content/154447-156 (last accessed on 4 March 2016)
cxxxix NICE, Appraisal consultation committee papers, 16 December 2015, Lung cancer (non-small-cell, squamous, metastatic) -
nivolumab (after chemotherapy) [ID811] Single Technology Appraisal
cxl Barclays Equity Research, “US major pharmaceuticals: Opdivo/Keytruda heading into Q3,” 23 October 2015,
http://www.alphaimpactrx.com/assets/Uploads/Barclays-US-Major-Pharmaceuticals-OpdivoKeytruda-heading-into-Q3.pdf (last accessed on 10 February 2016)