comparative genomics of mitochondrial dna in members of ... · comparative genomics of...
TRANSCRIPT

Comparative Genomics of Mitochondrial DNA in Members of the DrosophilamelanogasterSubgroup
J. William O. Ballard
The Field Museum, 1400 S. Lake Shore Drive, Chicago, IL 60605-2496, USA
Received: 30 July 1999 / Accepted: 16 March 2000
Abstract. In this study, a comparative genomics ap-proach is employed to investigate the forces that shapeevolutionary change in the mitochondrial DNA (mtDNA)of members of theDrosophila melanogastersubgroup.This approach facilitates differentiation of the patterns ofvariation resulting from processes acting at a higher levelfrom those acting on a single gene. The mitochondrialgenomes of three isofemale lines ofD. simulans(siI, -II,and -III), two of D. melanogaster(Oregon R and a linefrom Zimbabwe), andD. mauritiana(maI and -II), andone ofD. sechelliawere sequenced and compared withthat derived fromD. yakuba.Data presented here indi-cate that at least three broad mechanisms shape the evo-lutionary dynamics of mtDNA in these taxa. The first setof mechanisms is intrinsic to the molecule. Dominantprocesses may be interpreted as selection for an in-creased rate of replication of the mtDNA molecule, bi-ases in DNA repair, and differences in the pattern ofnucleotide substitution among strands. In the genes en-coded on the major strand (62% of the coding DNA)changes to or from C predominate, whereas on the minorchanges to or from G predominate. The second set ofmechanisms affects distinct lineages. There are evolu-tionary rate differences among lineages, possibly owingto population demographic changes or changes in muta-tional biases. This is supported by the heterogeneityfound in synonymous, nonsynonymous, and silent sub-stitutions. The third set of mechanisms differentially af-fects distinct genes. A maximum-likelihood sliding-window analysis detected four disjunct regions that havea significantly different nucleotide substitution processfrom that derived from the complete sequence. Thesedata show the potential for comparative genomics to
tease apart subtle forces that shape the evolution ofDNA.
Key words: Comparative genomics — GenusDro-sophila— Rates of evolution — Mitochondrial DNA
Introduction
This study was motivated by the observation that theevolutionary rates of synonymous changes at two local-ized regions of mitochondrial DNA (mtDNA) are sig-nificantly different in distinct mitochondrial lineages ofDrosophila simulans(Ballard 1998). This paper attemptsto understand this unexpected heterogeneity in muta-tional features and rates among the mitochondrial ge-nomes. It also aims to determine how frequently thisheterogeneity in the pattern of substitutions is observedin distinct lineages of mtDNA from closely related spe-cies within theD. melanogastersubgroup.
To assign changes to the appropriate lineage a repre-sentative from each major mitochondrial haplotypewithin the D. melanogastersubgroup was included.Within D. simulansthere are three major mitochondrialtypessiI, -II, and -III (Solignac et al. 1986; Satta andTakahata 1990; Montchamp-Moreau et al. 1991). A rep-resentative of each haplotype was included. A single rep-resentative ofD. sechelliaand both major mitochondriallineages ofD. mauritiana(maI and -II) andD. melano-gasterwere included (Solignac and Monnerot 1986; So-lignac et al. 1986; Rand et al. 1994). This study does notinclude multiple representatives of each lineage. How-ever, variation within each lineage is very low (Solignac
J Mol Evol (2000) 51:48–63DOI: 10.1007/s002390010066
© Springer-Verlag New York Inc. 2000

et al. 1986; Solignac and Monnerot 1986; Baba-Aı¨ssa etal. 1988; Ballard and Kreitman 1994; Rand et al. 1994;Ballard 2000).
To ascribe changes to the correct region of mtDNA,the complete mitochondrial genome was sequenced. Se-quencing complete genomes permits the detection of pat-terns that operate at a higher level than the individualgene, but that nevertheless affect the gene (Blattner et al.1997; Alm et al. 1999). The vast majority of studiesfocus on a single gene, and, because these studies cannotinvestigate processes above the level of the gene, theyare vulnerable to misinterpreting patterns as belonging toindividual gene processes. Targeting specific loci candetermine whether they are under selection (Kreitman1983; McDonald and Kreitman 1991; Ballard and Kreit-man 1995), while contrasting multiple loci can determinewhether they are under similar selective pressures (Hud-son et al. 1987). This is the first study that attempts toapportion patterns of evolutionary change to the appro-priate level.
The evolution of the mtDNA molecule inDrosophilais both dynamic and complex. Ballard (1998) observedthat rates of synonymous changes in two regions ofmtDNA are significantly different in distinct mitochon-drial lineages ofD. simulans.One 2,531-bp region in-cludes the majority of cytochrome oxidase I (COI),NADH dehydrogenase subunit 2 (ND2), and threetRNAs (Satta and Takahata 1990). The second region,1,137 bp in length, includes the complete cytochromebgene (Ballard and Kreitman 1994). Within the 2,531-bpregion there are 19 changes on thesiI lineage, 45 on thesiII lineage, and 22 on thesiIII lineage. A relative ratetest (Tajima 1993) usingD. melanogasteras the out-group shows a highly significant increase in the evolu-tionary rate of thesiII lineage compared to bothsiI andsiIII. In contrast, in the 1,137-bp region there are 26substitutions on thesiI lineage and 0 and 5 on thesiII andsiIII lineages, respectively.
There are at least three broad mechanisms that mayinduce the observed heterogeneity in the pattern of syn-onymous changes at the two localized regions ofmtDNA. First, there may be rapid shifts in mutationaltendencies that are gene-specific (or possibly mitochon-drial region–specific). Second, there may be selection,either weak or strong, for synonymous changes that alsoshifts rapidly due to changes in the environment or in thedemography of the population. Third, heterogeneity be-tween regions may arise from any of the above mecha-nisms plus recombination. The observed localizedchanges in evolutionary rate cannot be explained by se-lection at linked sites with genetic hitchhiking (MaynardSmith and Haigh 1974; Kaplan et al. 1989) or by back-ground selection (Charlesworth et al. 1993). Nor canthey be explained by interactions with a maternally in-herited factor (Ballard and Kreitman 1994; Ballard et al.1996; Ballard 1998, 2000).
Biases toward A/T-ending codons has been observedin the mtDNA of Drosophila (Clary and Wolstenholm1985). This suggests that there may be a bias in themutation rate toward A and T. This may be caused byfactors that impinge on rates of DNA damage (Martin1995) and the availability of each nucleotide in the cel-lular medium of the mitochondrion (Xia 1996). Muta-tional biases have also been shown to occur on eachstrand of DNA (Garesse 1988; Rand and Kann 1998).Garesse (1988) noted that T→ C substitutions predomi-nate on the major strand ofD. melanogaster(62% of thecoding DNA), while A→ G substitutions predominate inthe genes encoded on the minor strand. Rand and Kann(1998) further noted that inD. melanogasterand D.pseudoobscurathere was a clear bias for T→ C fixationsin the cytochromeb gene (major strand) and A→ Gfixations in the ND5 gene (minor strand). In this study,genes transcribed from the minor strand are comple-mented.
The pattern of substitutions in mtDNA lineages maybe affected by changes in the environment or demogra-phy of the population. In mtDNA, it has been suggestedthat slightly deleterious nonsynonymous or synonymoussubstitutions accumulate within species (Nachman et al.1994; Nachman 1998; Ballard and Kreitman 1994; Randet al. 1994; Rand and Kann 1998). Ohta (1972, 1973)predicted that very slightly deleterious mutants are gov-erned by random drift in small populations because theybehave as if selectively neutral, but in large populations,these same mutants are effectively selected against.Small populations may also accumulate deleteriousmitochondrial mutations at an increased rate becausethere is a greater probability of each individual failingto pass on the best mitochondrial haplotype (Bergstromand Prichard 1998). The exact population sizes of eachmajor mitochondrial haplotype within theD. melanogas-ter subgroup are not known. However, some predictionscan be made about relative abundances. For example,D. sechellia and D. mauritiana are island endemicswith small population sizes (Tsacas and David 1974;Lachaise et al. 1988; Hey 1994). Concordant with theknown geographic distributions of theD. simulanshap-lotypes the levels of nucleotide diversity are in the ordersiII > siI > siIII (Ballard 2000). ThesiII haplotype has aworldwide distribution but has not been collected in thesame Pacific Islands assiI. The siI haplotype has onlybeen collected on Indian/Pacific Islands and may havebeen subjected to a series of population size reductions.ThesiIII haplotype has been collected from Madagascarand Reunion, where it is sympatric with thesiII haplo-type.
This study also tests for recombination among thedistinct lineages. A number of recent studies have sug-gested that mtDNA may recombine in humans and somefungi (Saville et al. 1998; Eyre-Walker et al. 1999; Hagel-berg et al. 1999; Awadalla et al. 1999). Several methods
49
for detecting recombination have been proposed (Milk-man and Crawford 1983; Hudson and Kaplan 1985; Ste-phens 1985; Dykhuizen and Green 1991; Maynard Smith1992). In this study, the homoplasy test (Maynard Smithand Smith 1998) and the sliding-window maximum like-lihood method (Grassly and Holmes 1997) are employed.The homoplasy test is a modification of the “cladistic”method of Hudson and Kaplan (1985) and aims to de-termine whether any observed homoplasies have oc-curred by mutation or there has been recombination. Thistest is appropriate when the sequences differ by about1–5% of nucleotides. The sliding-window maximumlikelihood method aims to detect regions that differ sig-nificantly from the model that is derived from the com-plete data set. The latter method has the advantage that itcan detect regions with different evolutionary histories(recombination) as well as regions with significantly dif-ferent rates (selection). In this study, there is no evidencefor recombination between the mitochondrial genomesincluded. The absence of recombination simplifies theanalysis because there is one genealogy. This enhancesthe utility of theDrosophilamitochondrial genome as amodel system for investigating genome-wide effects.
Materials and Methods
Lines Employed.The complete mitochondrial genomes from eight iso-female lines were sequenced and the data compared with that derivedfrom D. yakuba(Clary and Wolstenholme 1985).D. yakubais a ca-nonical outgroup of themelanogastersubgroup. The A+T rich regionis difficult to align (Lewis et al. 1994; Inohira et al. 1997) and is notincluded in this analysis.
Two isofemale lines ofD. melanogasterare included—Oregon Rand Zimbabwe 53. The Oregon R line was collected in Roseburg, OR,around 1925 by D.E. Lancefield. Lewis et al. (1994) published the A+Trich region of this line. TheD. melanogasterZimbabwe 53 line, re-ferred to here asD. melanogasterZimbabwe, was collected in 1990 atthe Sengwa Wildlife Preserve in Africa. Isofemale lines taken fromNorth America and Zimbabwe have clearly differentiated mtDNA(Rand et al. 1994) and many nuclear variants are not shared betweenthe two localities (Begun and Aquadro 1993). TheD. melanogastersequence of Lewis et al. (1995) is not included because it is a chimeraof different isofemale lines.
Three isofemale lines ofD. simulansare included, one from eachdistinct mitochondrial haplotype. Distinct strains ofWolbachia areknown to infect each mitochondrial haplotype. In some casesWolba-chia causes bidirectional incompatibility between lines infected withdistinct strains (Montchamp-Moreau et al. 1991; Rousset et al. 1992).This incompatibility has the potential to reduce gene flow betweenmitochondrial lineages and is one explanation for the persistence of thethree distinct haplotypes (James and Ballard 2000). ThesiI haplotypeis known to occur only on Tahiti, New Caledonia, Hawaii, and theSeychelles (Baba-Aı¨ssa et al. 1988). The author collectedD. simulanssiI TT01 in Papeete on Tahiti Nui in 1998. ThesiII haplotype has aworldwide distribution but has not been collected on any Pacific Is-lands (Baba-Aı¨ssa et al. 1988).D. simulans siII DSR was collected in1984 from Riverside, CA (DSR), by A. Hoffman (LaTrobe University,Melbourne). ThesiIII haplotype has been collected from Madagascarand Reunion Island, where it is sympatric with thesiII haplotype (So-lignac and Monnerot 1986).D. simulans siIII MD199 was collected bythe author in Joffreville, Madagascar, in 1998. These three lines arereferred to here asD. simulans siI, -II, and -III, respectively.
Two isofemale lines ofD. mauritianaare included, one from eachdistinct haplotype (maI and -II) (Solignac and Monnerot 1986). O.Kitagawa collectedD. mauritiana maI BG1 in Mauritius in 1981 andD. mauritiana maII G52 in Mauritius in 1985. These two lines arereferred to here asD. mauritiana maI and -II, respectively.
One isofemale line ofD. sechelliais included. The line was the firstcollected line of the species. It was described by Isacas and Ba¨chli(1981).
DNA Preparation, Polymerase Chain Reaction (PCR), and CycleSequencing.DNA from all lines was extracted using the PureGenet Kit(Gentra) following the DNA isolation from fixed tissue protocol. In allcases, the DNA was extracted from individuals 7–14 days of age. InD.melanogaster,deletions in the mtDNA do not increase with age (em-bryos to 60-day-old adults; Schwarze et al. 1998). Fourteen overlap-ping fragments were PCR amplified for 32 cycles. Each cycle consistedof 15-s denaturation at 94°C, 5-s annealing between 50–54°C, and 90-sextension at 72°C. Each amplicon was electrophoresed on a 1% aga-rose gel to verify size and the remainder of the reaction or reactionswere cleaned and concentrated with Microcon 100s (Amicon).
Both strands were sequenced using Taq-Dye Deoxy TerminatorCycle sequencing (Applied Biosystems) employing 100–200 ng of theamplicon (500–2,000 bp) and 25 ng of primer. Eighty-four to 96 in-dependent cycle sequencing reactions were employed to sequence bothstrands of each mitochondrial molecule. For each cycle sequencingreaction, 120 ng of template and 25 ng of primer were added to 4.25mlof Taq-Dye Deoxy Terminator premix (Applied Biosystems) prior tocycle sequencing for 25 cycles. The cycling profile was 15-s denatur-ation at 95°C, 5-s annealing at 50°C, and 4-min extension at 65°C.Cycle sequencing reactions were NH4OAc precipitated and dried. Thedried samples were resuspended in 4ml of deionized formamide and 50mM EDTA (5:1) and 2ml electrophoresed on an Applied Biosystems377 DNA sequencer.
Sequences were imported into the Sequenchert software programand the chromatograms investigated. Each sequence was completedbefore the next isofemale line was commenced. There was no evidenceof heteroplasmy or large-scale deletions that have been reported insome lines ofD. mauritiana(Solignac et al. 1983; Kondo et al. 1990).Three inconsistencies between the sequences derived from independentPCR products were resolved by reamplifying and resequencing theregion of interest. These were considered PCR errors.
Genome Investigations.The sequence data were aligned against thepublishedD. yakubasequence (Clary and Wolstenholme 1985) usingSequencher. The tRNAs were defined by tRNAscan-SE v1.11 (Loweand Eddy 1997) and by comparison with theD. yakubasequence.
Pooling genes transcribed from both strands has the potential tomask any strand-based biases. In an attempt to minimize this bias, eachtriplet transcribed from the negative strand loci was reverse comple-mented. This procedure retains the order of amino acids but reversesthe relative positions of the first and third codons. The data file wasthen validated by comparing the amino acid sequences with the originaldata file. The tRNAs and rRNAs transcribed from the minor strandwere then complemented. The result is that all loci can be analyzed ina single sequence with minimal alteration of nucleotide position. Forconsistency, all references to specific positions and base changes referto this modified sequence. The aligned sequences were imported intoDnaSP 3.14 (Rozas and Rozas 1997) where the protein coding regions,tRNAs, rRNAs, and intervening sequences were defined.
Phylogenetic Analyses.In an attempt to represent the number ofinsertion and deletion (indel) events accurately, each presumed eventwas parsimoniously scored by inserting a “1” into the matrix at appro-priate sites. Gaps were then treated as missing data. The genealogicalrelationship of alleles was analyzed by parsimony and maximum like-lihood using PAUP* (Swofford 1998). For all likelihood analyses, theHKY model (Hasegawa et al. 1985) enforcing a molecular clock withtwo substitution types was employed. The proportion of constant sites
50

and the transition/transversion (Ti/Tv) ratio were estimated from thedata.
Bootstrapping (Efron 1982; Felsenstein 1985) was used to testmonophyly. For this study, 1,000 pseudosamples were generated toestimate the bootstrap proportions. The completely resolved tree de-rived from the complete data set was well supported by both parsimonyand likelihood analyses and is referred to as the “true” mitochondrialgenealogy. It is not assumed that this is the species tree.
To investigate whether there was any recombination between thesix sequences in theD. simulanstriad, I employed the homoplasy test(Maynard Smith and Smith 1998) and the sliding-window maximumlikelihood method (Grassly and Holmes 1997). The homoplasy testdetermines if there is a statistically significant excess of homoplasies inthe phylogenetic tree derived from the data set compared to an estimateof the number of homoplasies expected by repeated mutation in theabsence of recombination. An excess of homoplasies is considered asignature of recombination. In this study a 3,493-bp data set was con-structed. This data set contained third codon positions, omitting initia-tion and termination codons and codons where there was amino acidvariation. Homoplasy ratios were calculated with “datain.bas” and then“exph.bas” as reported in Maynard Smith and Smith (1998). This is anumber with expectation 0 for a clonal population, and 1.0 for freerecombination. The effective number of sites was considered to be inthe range 2,095–3,493.
Genome-Wide Biases.There is a marked A+T bias inDrosophilamtDNA. Various hypotheses have been proposed to explain differencesin nucleotide composition. There may be a mutation bias influenced byfactors that impinge on rates of DNA damage (Martin 1995). This biasmay be caused by the susceptibility of dGTP and dCTP to oxidativedamage and the preferential incorporation of dATP opposite abasicsites by polymerase. It may also be caused by hydrolytic deamination,which can convert cytosine to uracil. There may also be selection for ahigh A/T content. A/T-rich genomes may replicate more quickly thanG/C-rich genomes and, if all else is equal, have a selective advantagein a heteroplasmic population. In a natural population ofD. simulans,heteroplasmy has been observed with rates of about 6% (Kondo et al.1990). The free energy of base stacking depends on the particularcombination of adjacent bases, so the overall free energy differs foreach doublet combination of base pairs. Lewin (1997) reported that theoverall free energy of A•U doublet pairs hasDG values between −0.9and −1.0, doublets containing one A•U and one G•C vary between −1.7and −2.3 and doublets containing only G•C vary from −2.0 to −3.4kcal/mol. The underlying mutation and selection biases may be ex-posed in partitions with low functional constraint. In the mitochondrialgenome it may be hypothesized that the intervening spacer regions areone such partition. In this study, the proportion of each nucleotide inthe intervening spacer regions is compared with that in each codonposition, in the tRNAs, and in the rRNAs.
There may also be a codon bias in mtDNA. Xia (1996) argued that,within a codon family, a codon ending with a nucleotide that is mostabundant in the cellular medium should be used most frequently in themRNA. In mitochondria, this is likely to be adenine because the con-centration of cellular ATP is much higher in mitochondria than theother three nucleotides (Bridger and Henderson 1983). Xia’s (1996)transcriptional hypothesis of codon usage predicts relative A-richnessand T-deficiency in the coding strand. To investigate these alternatehypotheses the mean number of A- and T-ending codons at fourfolddegenerate synonymous codons was compared.
Mutational biases may occur on each strand of DNA (Garesse1988; Rand and Kann 1998). To investigate strand-specific mutationbiases, the synonymous substitutions at third positions are mapped ontothe well-supported genealogy using PAUP* (Swofford 1998) and Mac-Clade (Maddison and Maddison 1992).
Substitutions in Each Lineage.If a sufficiently large proportion ofmutations in mtDNA are nearly neutral, then mtDNA lineages may be
affected by changes in the environment or demography of the popula-tion. Ballard (2000) showed that the pattern of substitutions within eachof the distinctD. simulanshaplotypes is not consistent with neutrality,and is similar to that previously reported between distinct species(Nachman 1998; Rand and Kann 1998). To investigate the pattern ofsubstitutions between genes within lineages and between lineages,three contingency analyses were conducted. These tests are modifica-tions of the MK test (McDonald and Kreitman 1991), and they areappropriate when there is no recombination.
The first analysis compared the number of synonymous (does notcause an amino acid change in a protein-coding region), nonsynony-mous (causes an amino acid change), and silent (noncoding in thisstudy) substitutions in each lineage. All substitutions were parsimoni-ously mapped onto the well-resolved phylogeny to investigate the num-ber of changes in each lineage. There was only one nucleotide differ-ence betweensiIII and maI, so these terminal lineages were notconsidered. The null hypothesis is that the proportion of synonymous,nonsynonymous, and silent changes in each lineage should be the sameif this ratio is maintained under a strictly neutral model of molecularevolution. As an alternative, small-population-size lineages may accu-mulate deleterious mitochondrial mutations at an increased rate (Bal-lard and Kreitman 1994; Nachman et al. 1994; Rand et al. 1994; Berg-strom and Prichard 1998). Silent substitutions are expected to be veryclose to neutral. However, some are likely to be deleterious. Specifi-cally, silent substitutions that affect tRNA or rRNA secondary structuremight be deleterious. In humans, for example, the tRNA LeucineUUR
gene is an etiologic hot spot (Moraes et al. 1993). These analyses do notinclude a multiple hit correction and therefore may underestimate thenumber of fixed synonymous substitutions in some lineages.
In the second analysis, the directions of synonymous changes ineach lineage were compared (Ballard and Kreitman 1994; Akashi1995). For mitochondrial genes, codon usage cannot be causally linkedto tRNA abundances because there is typically only one tRNA for eachamino acid. Consequently, it cannot be stated that a codon is “pre-ferred” (Ikemura 1981, 1982). InDrosophilamtDNA, there is an A/Tbias in synonymous positions. This result is consistent with a bias in thesubstitutions to A/T compared to C/G. However, it is unlikely that thisis the only evolutionary force acting on synonymous sites. Ohta (1972,1973) predicted that mutants that are mildly deleterious in large popu-lations might be neutral in small populations. To investigate codonusage, all synonymous changes were parsimoniously mapped onto eachingroup lineage using the “true” genealogy. Sites on the branch toD.yakubawere not included because they were employed to polarizechanges. Synonymous changes were categorized as mutating to W-codons (C/G→ A/T), to S-codons (A/T→ C/G), or to WS-codons (A↔ T and C↔ G). The IUPAC code defines a W aseither an A or Tand an S as either a C or G. Theneutral prediction is that the proportionof the three kinds of synonymous changes should be the same amonglineages. As an alternative, consider a model of weak selection againstS-codons (Ballard and Kreitman 1994). The prediction is that if syn-onymous S-codons are slightly deleterious they will drift to fixationmore rapidly in smaller populations. Conversely, it may be expectedthat W-codon mutations will accumulate more quickly in larger popu-lations. WS-codon mutants, under this scenario, are expected to be veryclose to neutral.
The third analysis contrasts the direction of synonymous changes(W-, S-, and WS-codons) with the number of nonsynonymous andsilent substitutions. This analysis facilitates direct comparison of allsubstitution types. As previously stated, the null hypothesis is that ratedifferences among mtDNA lineages are expected to apply equally to allloci. However, if S-codons are slightly deleterious, nonsynonymoussubstitutions and S-codon changes are expected to drift to fixation insmall effective populations. W-codon changes are likely to accumulatein larger populations, whereas most silent changes and WS-codon mu-tants are predicted to be very close to neutral. Post hoct tests were thenperformed and these results overlaid onto the “true” genealogy on alineage by lineage basis. Theset values are a form of standardizedresidual that indicates what each cell in the table contributes to the
51

Chi-square statistic. Since they are calculated to follow a standardnormal distribution, absolute values greater than 1.96 (for a 0.05 prob-ability level) indicate that the cell in question is significantly differentfrom that expected by chance.
Sliding-Window Analyses.Variability between the nine mitochon-drial genomes was analyzed using the sliding-window approach. Theseanalyses started at position 1 and terminated at position 15,034. The 76unalignable bases and the A+T region were excluded. The A+T regionis 2–5 kb in length and extends from position 15,035 to position 1.Given the large size of this region, it was not considered biologicallyinformative to continue the sliding-window past position 15,034.
Small windows are subject to large stochastic variation, while largewindows may smooth over small regions of inconsistency. As such,sliding-window analyses are a compromise. Employing SWAN (ver. 1)(Proutski and Holmes 1998), data were plotted as moving averagesshifting 40 bp with a window of 1,000 bp. The variability in eachcolumn of the alignment was estimated as an entropy function of thenucleotide variation using the following equation:
Variability = − (i=A,C,G,T
ni
Nln
ni
N
whereni 4 the numbers of each nucleotide (A, C, G, or T) in a columnof the alignment andN 4 the total number of sequences analyzed.
Variation between the genomes was then investigated with the slid-ing-window maximum likelihood method, implemented in PLATO(ver 2.11). This method aims to detect regions that conflict with asingle phylogenetic topology and nucleotide substitution process de-rived from the entire sequence. Such deviation along sequences, calledspatial phylogenetic variation by Grassly and Holmes (1997), mayreflect recombination or varying selective forces along the sequence.This approach calculates the likelihoods for each site independently. Itthen generates a measure of the average likelihood of a given windowwith respect to the rest of the sequence. Maximum values of thismethod are associated with regions showing low likelihoods given themaximum likelihood model derived from the complete sequence. Thismeasure is calculated for window sizes from 10 nucleotides up to halfthe sequence length and in all possible positions. Regions fewer than 10bases are excluded from the analysis because they are deemed unin-formative and subject to spurious patterns. Grassly and Holmes (1997)showed that the null distribution of this measure for each region sizewas approximately normal, permitting Z values to be calculated. Apotential problem with this analysis is inflated type 1 error. To correctfor multiple comparisons, Grassly and Holmes (1997) employed theBonferroni correction, dividinga by the number of regions tested.
The tree topology, branch lengths, and Ti/Tv ratio were estimatedfrom the data (as described above) and enforced in a HKY (Hasegawaet al. 1985) sliding-window analysis (Grassly and Holmes 1997). Pre-liminary PLATO analyses were conducted from positions 1–6,000,4,500–10,500, and 9,000–15,034. Subsequent tests considered posi-tions 1–7,500 and 7,500–15,034 because the preliminary analyses didnot suggest that the region around position 7,500 was anomalous. Thelarge memory requirements of this method precluded a single test of thecomplete genome.
The sliding-window maximum likelihood analyses identified fourregions conflicting with a single phylogenetic topology and nucleotidesubstitution process along the entire sequence. The Kishino and Ha-segawa (1989) test was then employed to investigate whether each ofthese regions had a significantly different topology from the “true”genealogy. However, the results from these tests should be interpretedwith caution as, strictly, this test is only valid when two trees beingcompared are selected on an a priori basis. A region of DNA with asignificantly different topology would support the hypothesis that themitochondrial genome had recombined. Again, no support was foundfor recombination. One alternative is that there have been one or morechanges in evolutionary rate in each anomalous region.
Two additional sets of analyses were performed to investigate thepossibility of evolutionary rate variation within the mtDNA genome.The first set of analyses compared the number of parsimony inferredchanges in each lineage in each of the four anomalous regions to thatdetermined from the complete data set. Post hoc tests were then em-ployed to test for evolutionary rate variation in specific lineages. In thesecond set of tests, two additional sliding-window analyses were con-ducted. These analyses were performed as previously described, but therRNAs were excluded because there was no evidence for anomalousrates of evolution in either locus. Exclusion of the rRNAs permittedeach test to be completed in a single analysis. The first sliding-windowanalysis considered synonymous substitutions (where synonymous andnonsynonymous changes both occurred at a single site, the nonsynony-mous substitutions were replaced with a “?”). The second considerednonsynonymous substitutions (in this case, synonymous substitutionswere replaced with a “?”). These analyses do not distinguish inter- andintraspecific/haplotypic variability in terminal branches. Therefore,when necessary, the region of interest was sequenced from additionalisofemale lines to gain an estimate of intraspecific/haplotypic variabil-ity. These mtDNA genomes were completed and are included in Bal-lard (2000).
Results
Genomic Investigations
The alignment is straightforward for the majority ofthe sequences (GenBank #AF200828-32, AF200834,AF200841, and AF200852). However, it is not possibleto determine unequivocally the indel events that includepositions 5,535–5,584 and 6,022–6,047. As a conse-quence, 76 bp are deleted from all analyses. The regionbetween 5,535–5,584 forms the majority of an interven-ing sequence between COIII, and the glycine tRNA. Theregion between positions 6,022–6,047 is located in anintervening sequence between ND3 and the alaninetRNA.
Protein Coding:In maII the putative initiation codonfor COI is TTAA. This is the first report of TTAA beingused as an initiation codon. ATAA is the COI initiationcodon inD. melanogaster, D. sechellia,and siI, whileGTAA is the initiation codon at this locus inmaI, siII,and −III. Clary and Wolstenholme (1983) and de Bruijn(1983) reported that the COI initiation codon inD.yakubaand D. melanogasterwas ATAA. Satta et al.(1987) reported the initiation codon forD. simulansfromNairobi, Kenya, was GTAA.
The total number of triplet codons inD. simulans, D.sechellia,andD. mauritianais 3,723 (Table 1). It is oneless inD. melanogaster(Table 1). The single amino aciddeletion in bothD. melanogasterlines is observed in theND5 locus, four amino acids 38 of the termination codon.In all other sequences, it is a phenylalanine (TTT). Claryand Wolstenholme (1985) reported that the number oftriplet codons is 12 more than observed inD. simulans,D. sechellia,andD. mauritiana.In all taxa sequenced inthis study, there is either a TAA or TAG terminationcodon 12 codons 38 of where Clary and Wolstenholme(1985) proposed that the ND1 locus terminates inD.yakuba.Clary and Wolstenholme (1985) reported a leu-
52

cine (TTG) at this site. I confirmed this sequence in thesame line ofD. yakuba,so it is unlikely to be a sequenc-ing artifact. Either the ND1 locus is 12 bases longer inD.yakuba or ND1, like COII, ND2, ND4, and ND5, isincompletely terminated and must acquire a completetermination codon by polyadenylation. In this study, it isassumed that ND1 is incompletely terminated. For ref-erence, Table 1 includes a modified codon table forD.yakuba.
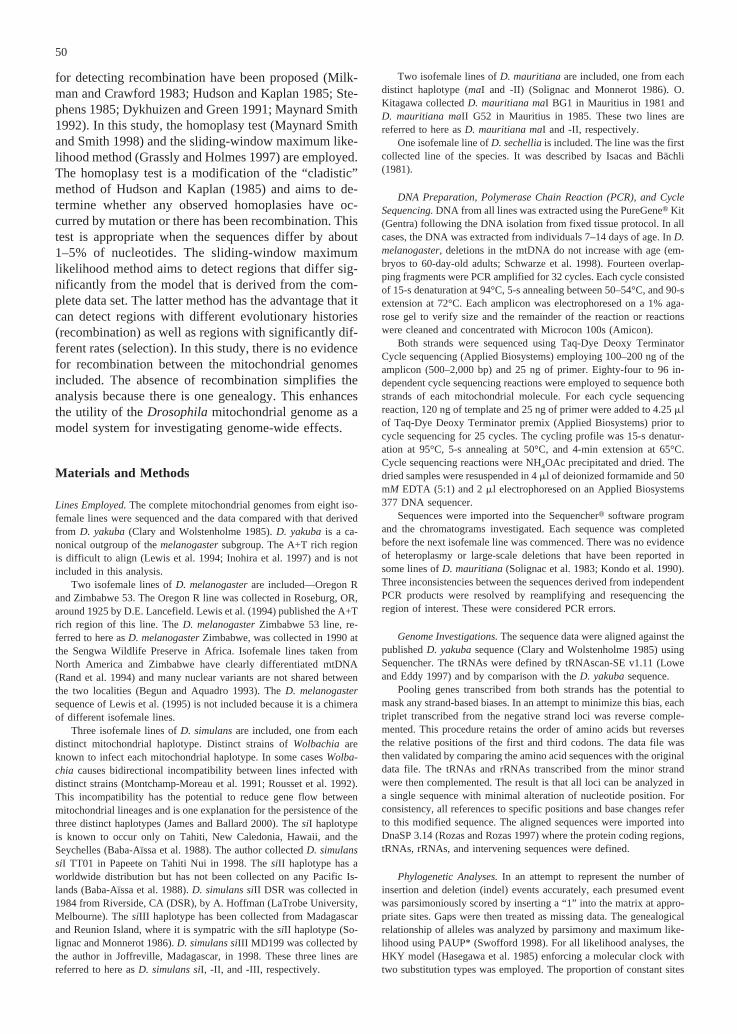
To investigate the substitution rates in each proteincoding locus Ks and Ka (Nei and Gojobori 1986) werecalculated and plotted as the average of all pairs. Ks isdefined as the number of synonymous substitutions persynonymous site for any pair of sequences. Ka is definedas the number of nonsynonymous substitutions per non-synonymous site for any pair of sequences. Figure 1shows that Ks to Ka ratio is highest for COI, COII,COIII, ND3, cytochromeb, ND4L, and ND1. The Ks to
Table 1. The number of occurrences of each codon in the mitochondrial genomes ofD. yakuba, D. melanogasterOregon R,D. melanogasterZimbabwe (top row from left to right),D. sechelia, D. mauritiana maII, D. mauritiana maI (middle row from left to right),D. simulans siI, D.simulans siII, and D. simulans siIII (bottom row from left to right). The total number of triplet codons inD. yakuba, D. sechellia, D. mauritiana,andD. simulansis 3,723 and inD. melanogaster3,722
Phe UUU 311 317 319 Ser UCU 121 129 129 Tyr UAU 141 145 142 Cys UGU 40 39 39310 317 311 131 133 130 145 149 157 38 37 39311 312 311 130 129 130 150 146 157 38 37 39
UUC 171817
151418
151818
UCC 476
666
655
UAC 282118
201822
211212
UGC 222
233
211
Leu UUA 541541549
542539543
540538538
UCA 1029297
969097
969696
TER UAA 667
667
666
Trp UGA 969497
979495
979494
UUG 252016
242322
242121
UCG 330
542
422
UAG 010
110
111
UGG 674
446
477
CUU 363031
303129
333232
Pro CCU 797274
787475
797676
His CAU 656967
706663
726666
Arg CGU 81313
141312
131313
CUC 200
211
100
CCC 386
677
655
CAC 121010
91114
71111
CGC 000
000
000
CUA 192823
02320
202525
CCA 454949
414746
424646
Gln CAA 706768
656667
646868
CGA 454444
444244
444242
CUG 210
010
000
CCG 322
433
344
CAG 043
554
633
CGG 622
143
244
Ile AUU 344341347
353340348
354340340
Thr ACU 9710298
959998
95103103
Asn AAU 192187190
192196192
193189189
Ser AGU 332827
303127
303030
AUC 152418
152120
152222
ACC 356
556
533
AAC 131615
101012
101414
AGC 121
012
011
Met AUA 194200207
217203209
216205205
ACA 858180
777878
777878
Lys AAA 757976
817778
817777
AGA 737576
747577
747676
AUG 182117
141913
141919
ACG 221
220
200
AAG 869
687
588
AGG 000
000
000
Val GUU 907878
828177
828383
Ala GCU 125136140
129138130
129135135
Asp GAU 545856
585854
595656
Gly GGU 675960
627060
616565
GUC 386
113
111
GCC 984
86
13
899
GAC 1089
87
12
799
GGC 201
111
200
GUA 929192
929697
929999
GCA 372325
272826
272626
Glu GAA 817675
767375
767474
GGA 129140135
138129135
137131131
GUG 87
10
89
11
877
GCG 253
422
422
GAG 123
253
244
GGG 222024
181924
192424
53
Ka ratio is lowest for ND2, ND5, and ND6 and interme-diate for ATPase 8, ATPase 6, and ND4.
tRNAs: There are 1,459 bp in the 22 tRNAs. Thephenylalanine tRNA is the most variable, with 11 vari-able positions (Fig. 2). Parsimony analysis inferred thatthere are seven variable sites in the lineage toD. yakuba,one of which is a compensatory mutation in the aminoacid arm. In contrast, there is no variation in the gluta-mine tRNA. All other tRNAs have between one and ninevariable positions.
Large Subunit rRNA (lrRNA) and Small Subunit rRNA(srRNA):There are 1,331 bp in the lrRNA and 795 bp inthe srRNA. The single nucleotide difference between themtDNA genomes ofsiIII and maI occurs in the lrRNA.There is a T insertion at position 13,252 inmaI, siI, and-II relative to the other taxa includingsiIII. Solignac andMonnerot (1986) previously showed that there were norestriction site differences between isofemale lines ofsiIII and maI. Similarly, Satta and Takahata (1990) foundno differences between lines ofsiIII and maI in a 2,531-bp region that included the COI locus. Ballard (2000)suggested that this might be the result of introgression.D. mauritiana(males) andD. simulans(females) can becrossed in the laboratory, resulting in sterile male andfertile female F1 hybrids (Robertson 1983). If the fertileF1 female is then backcrossed to males ofD. mauritianathe mitochondrial genome will remain thesiIII type, butthe nuclear DNA will be a mosaic of two genomes.
Phylogenetic Analyses
Figure 3 can be considered the “true” genealogy. Maxi-mum parsimony analysis of the 14,958-bp data set with
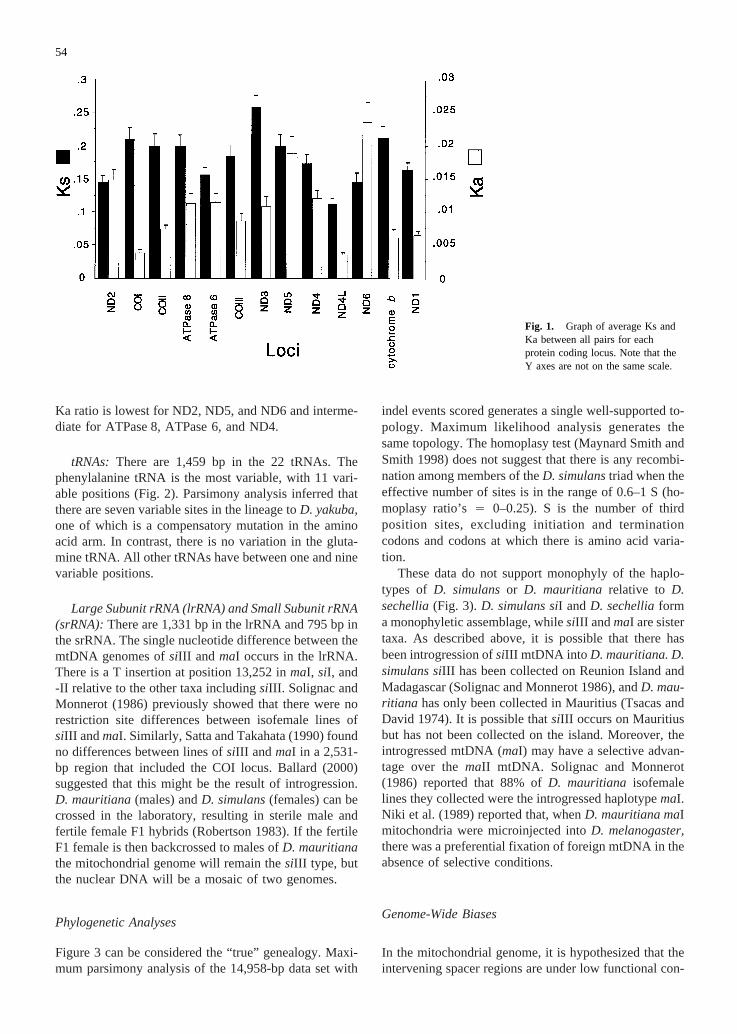
indel events scored generates a single well-supported to-pology. Maximum likelihood analysis generates thesame topology. The homoplasy test (Maynard Smith andSmith 1998) does not suggest that there is any recombi-nation among members of theD. simulanstriad when theeffective number of sites is in the range of 0.6–1 S (ho-moplasy ratio’s4 0–0.25). S is the number of thirdposition sites, excluding initiation and terminationcodons and codons at which there is amino acid varia-tion.
These data do not support monophyly of the haplo-types of D. simulansor D. mauritiana relative to D.sechellia(Fig. 3). D. simulans siI and D. sechelliaforma monophyletic assemblage, whilesiIII and maI are sistertaxa. As described above, it is possible that there hasbeen introgression ofsiIII mtDNA into D. mauritiana. D.simulans siIII has been collected on Reunion Island andMadagascar (Solignac and Monnerot 1986), andD. mau-ritiana has only been collected in Mauritius (Tsacas andDavid 1974). It is possible thatsiIII occurs on Mauritiusbut has not been collected on the island. Moreover, theintrogressed mtDNA (maI) may have a selective advan-tage over themaII mtDNA. Solignac and Monnerot(1986) reported that 88% ofD. mauritiana isofemalelines they collected were the introgressed haplotypemaI.Niki et al. (1989) reported that, whenD. mauritiana maImitochondria were microinjected intoD. melanogaster,there was a preferential fixation of foreign mtDNA in theabsence of selective conditions.
Genome-Wide Biases
In the mitochondrial genome, it is hypothesized that theintervening spacer regions are under low functional con-
Fig. 1. Graph of average Ks andKa between all pairs for eachprotein coding locus. Note that theY axes are not on the same scale.
54

straint and may reveal the underlying mutation biases. Toinvestigate the bias between different partitions, the propor-tion of each nucleotide in the intervening spacer regionswas compared with those in each codon position, in thetRNAs, and in the rRNAs (Table 2). Overall, the meanproportion of A/T nucleotides in the spacer regions (0.90) issignificantly less extreme than third codon positions (0.94)as determined by a paired sign test (p < 0.01). One expla-nation for this result is that the intervening spacers aresubject to selection. An alternate explanation is that thereis selection for increased A/T-ending codons.
Xia (1996) proposed that maximizing transcriptionalefficiency would cause an increase in A-ending codons.A prediction of this hypothesis is relative A-richness andT-deficiency in the coding strand. To test this predictionthe mean number of A- and T-ending codons at the eightfourfold degenerate synonymous codons was compared.D. mauritiana maI was excluded because it is likely theresult of an introgression event. The data do not show asignificant transcriptional bias inDrosophila mtDNA(Xia 1996). There is a mean of 623.5 T-ending and594.75 A-ending fourfold degenerate codons. Of theeight fourfold degenerate codons, four are A-biased. Thisdifference is not significant by a pairedt test (meandifference is −11.14, t7 4 −0.85, p 4 0.40). There isalso no discernable trend if the anticodon is consideredor if the analysis is repeated for each strand of DNA.
To investigate strand-specific mutational biases on themajor and minor strands, the unambiguous third codonposition synonymous substitutions where mapped ontothe well-supported genealogy using MacClade. A con-
tingency table analysis was then performed on the num-ber of changes, to and from each nucleotide, on eachstrand (Fig. 4). Overall there is a significant difference inthe direction of substitutions (x7
2 4 156.45,p < 0.001 ifC → A, and G→ T substitutions are excluded because ofthe low number of changes). A post hoct test was thenperformed on the contingency table. On the major strandthere are relatively more changes from A or T→ C, andfrom C → T than observed on the minor strand (t42.72, 7.07, and 5.78 respectively,p < 0.05). On the minorstrand there are relatively more changes from A or T→G, and from G→ A than the major strand (t4 8.62,5.04, and 2.17 respectively,p < 0.05). These data supportGaresse (1988) and Rand and Kann (1998).
Substitutions in Each Lineage
If mutations in mtDNA are nearly neutral, then the pat-tern of substitutions may be affected by changes in theenvironment or demography of the population. Contin-gency table analyses were employed to investigate thehomogeneity of the substitution processes in each lin-eage. The first analysis compared the number of synony-mous, nonsynonymous, and silent substitutions in eachlineage (Table 3). In the second analysis, the direction ofsynonymous changes in each lineage was compared (x2
18
4 92.27,p < 0.001). The third analysis compared thenumbers of W-codons, S-codons, WS-codons, and non-synonymous and silent mutations in each lineage (x36
2 4130.68,p < 0.01). Post hoct values from the latter con-
Fig. 2. The phenylalanine tRNA ofD. simulans siI. Changes in the nine sequences included in this study are mapped onto the secondary structure.
55
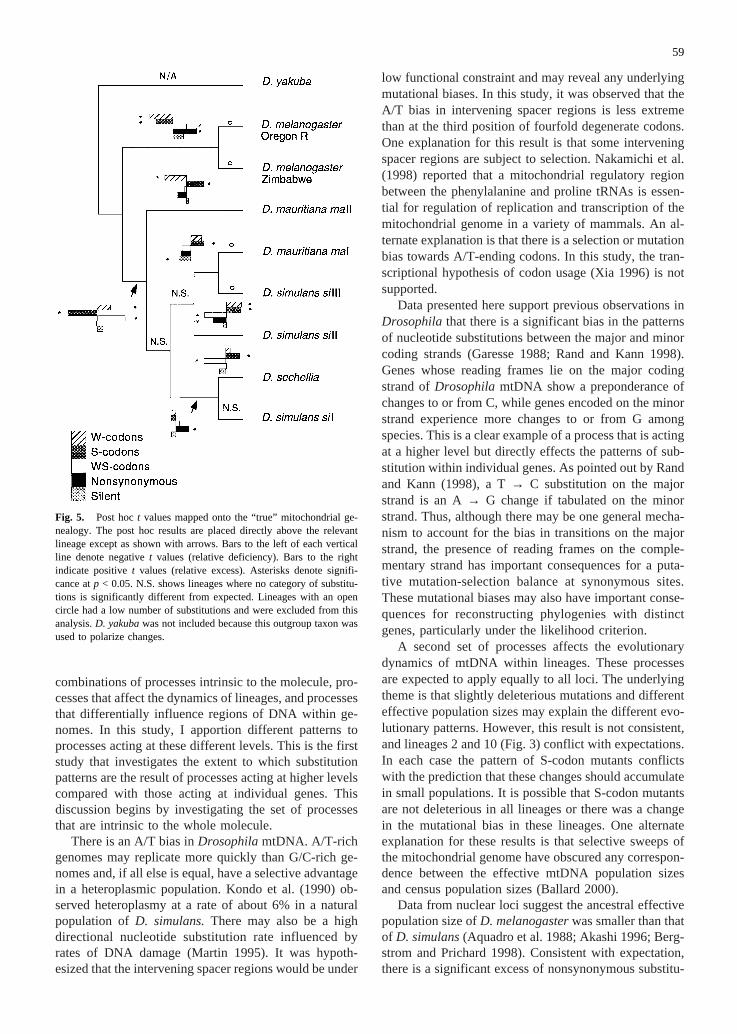
tingency table were then plotted onto the “true” geneal-ogy (Fig. 5).
The pattern of substitutions has an underlying theme,but it is not upheld in a consistent manner. Generallyspeaking, there are relative excesses of nonsynonymouschanges and S-codon mutants in populations that arelikely to be small and a relative excess of W-codon mu-tants in populations that are likely to be large. Lineages2 (to the common ancestor ofD. melanogaster) and 10(to siII) are not concordant with predictions. In both ofthese cases, S-codon mutants and nonsynonymouschanges have significantly opposite trends (Fig. 5). It isnot clear why this pattern is observed, however, thenearly neutral model of evolution does not account for allthe variation in these mitochondrial data in all lineages.One possible explanation is that S-codon mutants oramino acid changes are not deleterious in all lineages. Analternate explanation is that there was a change in themutational bias in these lineages.
The siI haplotype has been collected from the Sey-chelles, Tahiti, New Caledonia, and Hawaii (Solignacand Monnerot 1986; Lachaise et al. 1988). As such, thispopulation probably has been subject to a series ofbottlenecks. Despite this expectation, there is no evi-dence for rate acceleration in the terminal branch tosiI.There is, however, an excess of nonsynonymous changesin lineage 11 (t4 1.98,p < 0.05) relative to the alter-natives.
D. mauritiana and D. sechelliaare island endemicswith small population sizes (Tsacas and David 1974;Lachaise et al. 1988; Hey 1994). In both lineage 5 tomaII and lineage 12 toD. sechellia(Fig. 5), there is asignificant excess of S-codon mutants (t4 2.73 and2.08, respectively,p < 0.05). In lineage 5 tomaII, thereis a deficiency of W-codon mutants (t4 3.88,p < 0.05)relative to WS-codon mutants and nonsynonymous andsilent changes (Fig. 5). In lineage 12 toD. sechellia,there is a deficiency of WS-codon mutants (t4 2.95,p< 0.05) relative to the alternatives (Fig. 5).
D. simulans siIII has been collected on Madagascarand Reunion Island. James and Ballard (2000) collected189 isofemale lines ofD. simulansfrom Madagascar andobserved that 58 weresiIII and 131 weresiII. Consistentwith the observation thatsiIII has a small historicalpopulation size, there is an excess of S-codon mutants inlineage 7 (t4 1.98, p < 0.05) and deficiency of silentchanges (t4 2.08,p < 0.05) relative to the alternatives(Fig. 5).
It is difficult to interpret the pattern of substitutionsassociated with the radiation of the simulants triad. How-ever, it is likely thatD. simulansexpanded out of islandsin the Indian Ocean (Lachaise et al. 1988). It now occursworldwide. In lineage 6 to the simulans triad (D. mau-ritiana, D. simulans,and D. sechellia), there is a defi-ciency of S-codon mutants (t4 4.62, p < 0.05) andexcess of WS-codon mutants (t4 4.47,p < 0.05) rela-tive to the alternatives (Fig. 5).
Sliding-Window Analyses
A sliding-window approach was taken to detect regionsthat conflict with a single nucleotide substitution process
Table 2. Proportion of each nucleotide in seven partitions in themitochondrial genomes of nine species ofDrosophila.In each case thestandard error is less than 0.01
Partition
Proportion of each nucleotide
A C G T
First codon 0.31 0.1 0.2 0.39Second codon 0.45 0.03 0.02 0.49Third codon 0.45 0.03 0.03 0.49tRNAs 0.38 0.1 0.13 0.39lrRNA 0.41 0.06 0.11 0.41srRNA 0.41 0.08 0.13 0.39Intervening 0.48 0.06 0.05 0.42
Fig. 3. Phylogenetic relationships of theD. melanogastersubgroupdetermined by 14,958 bp of mtDNA. Of these 13,309 are constant, 861variable parsimony uninformative, and 788 parsimony informative.Parsimony analysis shows that there is a single most parsimonious treeof length 2,107 steps (Consistency Index4 0.85). The numbers incircles denote the bootstrap percentage from 1,000 pseudoreplicates.The numbers above lines refer to the branch length determined byparsimony. The boxed numbers distinguish each lineage. Maximumlikelihood analysis (see text for details) generates the same topology(-Ln 4 29468.66, Ti/Tv4 3.96, proportion of invariable sites esti-mated by likelihood4 0.84).
56

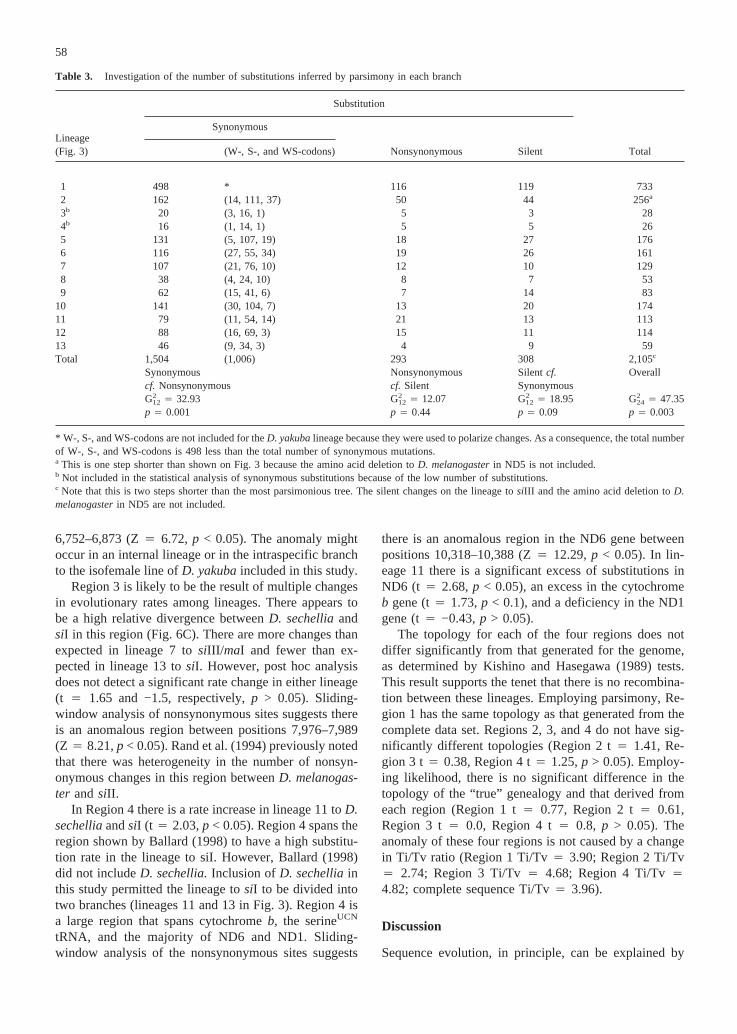
derived from the entire sequence. The highest variabilityamong sequences in the sliding-window plot is observedaround positions 1,480 and 6,640 (Fig. 6A). The COIlocus occurs between positions 1,476–3,015, and theND5 locus occurs between positions 6,499–8,216. Thelowest variability is observed around position 9,200 andpositions 12,770–15,034. Position 9,200 is within theND4 locus (8,301–9,639). The region from 12,770–15,034 includes the leucineCUN and valine tRNAs, andboth rRNAs.
As expected, the variability between all nine se-quences is highly correlated with the variability withineach of four clades. However, there are four distinctareas of incongruence (Figs. 6B and 6C). The divergencebetweensiII and -III is relatively high between positions1,000–2,500 (r 4 0.24) and 10,000–12,500 (r 4 0.34)(Fig. 6B). The divergence betweenD. sechelliaandsiI isrelatively low between positions 6,000–7,000 (r 4 0.57)and relatively high between 7,500–9,500 (r 4 0.39)(Fig. 6C).
Maximum likelihood sliding-window analyses alsosuggest that four regions are inconsistent with the sub-stitution process derived from the complete sequence.Region 1 (positions 1,536–2,439) occurs in the COI lo-cus (Z4 6.901,p < 0.05). Region 2 (6,451–6,847) spans
the phenylalanine tRNA (Fig. 2) and the 58 region of theND5 locus (Z4 5.07,p < 0.05). Region 3 (7,547–9,256)encompasses the histidine tRNA and part of the ND5 andND4 loci (Z 4 9.15, p < 0.05). Region 4 (10,270–12,495) spans cytochromeb, the serineUCN tRNA, andthe majority of ND6 and ND1 (Z4 7.954,p < 0.05).
In Region 1, there is an excess of synonymous sub-stitutions in the interspecific lineage tosiII. It occurswithin the 2,531-bp region sequenced by Satta and Ta-kahata (1990) and shown by Ballard (1998) to have ahigh rate of substitution in thesiII lineage. Contingencytable analysis shows that there is a significant excess ofsubstitutions tosiII between positions 1,536–2,439 (t42.03, p < 0.05). A sliding-window analysis of synony-mous sites detects an anomalous region in the COI locusbetween positions 1,536–2,442 (Z4 10.55,p < 0.05).The COI locus ofsiII lines from Kenya, from the Sey-chelles, and a second line collected from western USAare identical with the line employed in this study (Gen-Bank #AF200839, AF200844, AF200840, respectively).
Contingency table analysis shows that there is a longbranch toD. yakubain Region 2 (t4 1.76,p < 0.05).There are large numbers of changes in the phenylalaninetRNA (Z 4 5.4, p < 0.05) (Fig. 2) and an anomalousregion of nonsynonymous changes between positions
Fig. 4. Third codon position synonymous nucleotide substitutions inthe major and minor strands mapped onto the well-resolved genealogy.Each number indicates the total number of changes between states. Thecircles represent the total proportion of each substitution type. A con-tingency table analysis was performed on the total number of changesto and from each nucleotide on each strand (see text for details). A posthoc t test was then conducted (C→ A, and G→ T substitutions are
excluded because of the low number of changes). Significant post hoct values (t > |1.96|) are represented on the figure with an arrow:
indicates a relative excess of this substitution type,indicates arelative deficiency of this substitution type, and − indicates no signifi-cant difference between the number of changes on the major and minorcoding strands.
57
6,752–6,873 (Z4 6.72,p < 0.05). The anomaly mightoccur in an internal lineage or in the intraspecific branchto the isofemale line ofD. yakubaincluded in this study.
Region 3 is likely to be the result of multiple changesin evolutionary rates among lineages. There appears tobe a high relative divergence betweenD. sechelliaandsiI in this region (Fig. 6C). There are more changes thanexpected in lineage 7 tosiIII/ maI and fewer than ex-pected in lineage 13 tosiI. However, post hoc analysisdoes not detect a significant rate change in either lineage(t 4 1.65 and −1.5, respectively,p > 0.05). Sliding-window analysis of nonsynonymous sites suggests thereis an anomalous region between positions 7,976–7,989(Z 4 8.21,p < 0.05). Rand et al. (1994) previously notedthat there was heterogeneity in the number of nonsyn-onymous changes in this region betweenD. melanogas-ter andsiII.
In Region 4 there is a rate increase in lineage 11 toD.sechelliaandsiI (t 4 2.03,p < 0.05). Region 4 spans theregion shown by Ballard (1998) to have a high substitu-tion rate in the lineage to siI. However, Ballard (1998)did not includeD. sechellia.Inclusion ofD. sechelliainthis study permitted the lineage tosiI to be divided intotwo branches (lineages 11 and 13 in Fig. 3). Region 4 isa large region that spans cytochromeb, the serineUCN
tRNA, and the majority of ND6 and ND1. Sliding-window analysis of the nonsynonymous sites suggests
there is an anomalous region in the ND6 gene betweenpositions 10,318–10,388 (Z4 12.29,p < 0.05). In lin-eage 11 there is a significant excess of substitutions inND6 (t 4 2.68,p < 0.05), an excess in the cytochromeb gene (t4 1.73,p < 0.1), and a deficiency in the ND1gene (t4 −0.43,p > 0.05).
The topology for each of the four regions does notdiffer significantly from that generated for the genome,as determined by Kishino and Hasegawa (1989) tests.This result supports the tenet that there is no recombina-tion between these lineages. Employing parsimony, Re-gion 1 has the same topology as that generated from thecomplete data set. Regions 2, 3, and 4 do not have sig-nificantly different topologies (Region 2 t4 1.41, Re-gion 3 t4 0.38, Region 4 t4 1.25,p > 0.05). Employ-ing likelihood, there is no significant difference in thetopology of the “true” genealogy and that derived fromeach region (Region 1 t4 0.77, Region 2 t4 0.61,Region 3 t4 0.0, Region 4 t4 0.8, p > 0.05). Theanomaly of these four regions is not caused by a changein Ti/Tv ratio (Region 1 Ti/Tv4 3.90; Region 2 Ti/Tv4 2.74; Region 3 Ti/Tv4 4.68; Region 4 Ti/Tv44.82; complete sequence Ti/Tv4 3.96).
Discussion
Sequence evolution, in principle, can be explained by
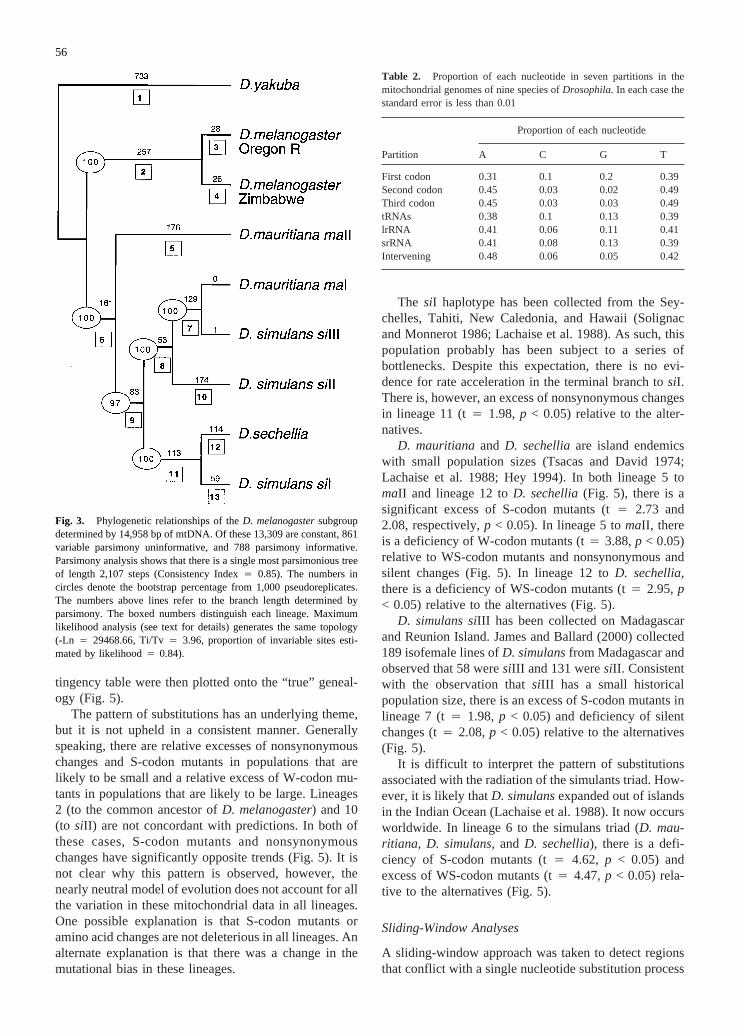
Table 3. Investigation of the number of substitutions inferred by parsimony in each branch
Substitution
Lineage(Fig. 3)
Synonymous
Nonsynonymous Silent Total(W-, S-, and WS-codons)
1 498 * 116 119 7332 162 (14, 111, 37) 50 44 256a
3b 20 (3, 16, 1) 5 3 284b 16 (1, 14, 1) 5 5 265 131 (5, 107, 19) 18 27 1766 116 (27, 55, 34) 19 26 1617 107 (21, 76, 10) 12 10 1298 38 (4, 24, 10) 8 7 539 62 (15, 41, 6) 7 14 83
10 141 (30, 104, 7) 13 20 17411 79 (11, 54, 14) 21 13 11312 88 (16, 69, 3) 15 11 11413 46 (9, 34, 3) 4 9 59Total 1,504 (1,006) 293 308 2,105c
Synonymous Nonsynonymous Silentcf. Overallcf. Nonsynonymous cf. Silent SynonymousG2
12 4 32.93 G212 4 12.07 G2
12 4 18.95 G224 4 47.35
p 4 0.001 p 4 0.44 p 4 0.09 p 4 0.003
* W-, S-, and WS-codons are not included for theD. yakubalineage because they were used to polarize changes. As a consequence, the total numberof W-, S-, and WS-codons is 498 less than the total number of synonymous mutations.a This is one step shorter than shown on Fig. 3 because the amino acid deletion toD. melanogasterin ND5 is not included.b Not included in the statistical analysis of synonymous substitutions because of the low number of substitutions.c Note that this is two steps shorter than the most parsimonious tree. The silent changes on the lineage tosiIII and the amino acid deletion toD.melanogasterin ND5 are not included.
58
combinations of processes intrinsic to the molecule, pro-cesses that affect the dynamics of lineages, and processesthat differentially influence regions of DNA within ge-nomes. In this study, I apportion different patterns toprocesses acting at these different levels. This is the firststudy that investigates the extent to which substitutionpatterns are the result of processes acting at higher levelscompared with those acting at individual genes. Thisdiscussion begins by investigating the set of processesthat are intrinsic to the whole molecule.
There is an A/T bias inDrosophilamtDNA. A/T-richgenomes may replicate more quickly than G/C-rich ge-nomes and, if all else is equal, have a selective advantagein a heteroplasmic population. Kondo et al. (1990) ob-served heteroplasmy at a rate of about 6% in a naturalpopulation ofD. simulans.There may also be a highdirectional nucleotide substitution rate influenced byrates of DNA damage (Martin 1995). It was hypoth-esized that the intervening spacer regions would be under
low functional constraint and may reveal any underlyingmutational biases. In this study, it was observed that theA/T bias in intervening spacer regions is less extremethan at the third position of fourfold degenerate codons.One explanation for this result is that some interveningspacer regions are subject to selection. Nakamichi et al.(1998) reported that a mitochondrial regulatory regionbetween the phenylalanine and proline tRNAs is essen-tial for regulation of replication and transcription of themitochondrial genome in a variety of mammals. An al-ternate explanation is that there is a selection or mutationbias towards A/T-ending codons. In this study, the tran-scriptional hypothesis of codon usage (Xia 1996) is notsupported.
Data presented here support previous observations inDrosophilathat there is a significant bias in the patternsof nucleotide substitutions between the major and minorcoding strands (Garesse 1988; Rand and Kann 1998).Genes whose reading frames lie on the major codingstrand ofDrosophilamtDNA show a preponderance ofchanges to or from C, while genes encoded on the minorstrand experience more changes to or from G amongspecies. This is a clear example of a process that is actingat a higher level but directly effects the patterns of sub-stitution within individual genes. As pointed out by Randand Kann (1998), a T→ C substitution on the majorstrand is an A→ G change if tabulated on the minorstrand. Thus, although there may be one general mecha-nism to account for the bias in transitions on the majorstrand, the presence of reading frames on the comple-mentary strand has important consequences for a puta-tive mutation-selection balance at synonymous sites.These mutational biases may also have important conse-quences for reconstructing phylogenies with distinctgenes, particularly under the likelihood criterion.
A second set of processes affects the evolutionarydynamics of mtDNA within lineages. These processesare expected to apply equally to all loci. The underlyingtheme is that slightly deleterious mutations and differenteffective population sizes may explain the different evo-lutionary patterns. However, this result is not consistent,and lineages 2 and 10 (Fig. 3) conflict with expectations.In each case the pattern of S-codon mutants conflictswith the prediction that these changes should accumulatein small populations. It is possible that S-codon mutantsare not deleterious in all lineages or there was a changein the mutational bias in these lineages. One alternateexplanation for these results is that selective sweeps ofthe mitochondrial genome have obscured any correspon-dence between the effective mtDNA population sizesand census population sizes (Ballard 2000).
Data from nuclear loci suggest the ancestral effectivepopulation size ofD. melanogasterwas smaller than thatof D. simulans(Aquadro et al. 1988; Akashi 1996; Berg-strom and Prichard 1998). Consistent with expectation,there is a significant excess of nonsynonymous substitu-
Fig. 5. Post hoct values mapped onto the “true” mitochondrial ge-nealogy. The post hoc results are placed directly above the relevantlineage except as shown with arrows. Bars to the left of each verticalline denote negativet values (relative deficiency). Bars to the rightindicate positivet values (relative excess). Asterisks denote signifi-cance atp < 0.05. N.S. shows lineages where no category of substitu-tions is significantly different from expected. Lineages with an opencircle had a low number of substitutions and were excluded from thisanalysis.D. yakubawas not included because this outgroup taxon wasused to polarize changes.
59

tions in the lineage toD. melanogaster.Ballard (2000)similarly reports a significant excess of nonsynonymoussubstitutions in this lineage. Kaneko et al. (1993) previ-ously noted a high level of amino acid polymorphism atthe ATPase 6 locus inD. melanogaster.A small ances-tral population ofD. melanogasteris, however, incon-sistent with the observed deficiency of S-codon mutantsin this lineage if S-codons are slightly deleterious.
The evolutionary dynamics of mtDNA insiII are dif-ficult to interpret. This haplotype has a broad distributionand likely had a large historical population size. In thisstudy, there is a relative deficiency of nonsynonymoussubstitutions and relative excess of S-codon mutants inthe lineage leading tosiII. However, it is clear that recentselective sweeps have influenced the evolutionary dy-namics of mtDNA. At the cytochromeb locus, Ballardand Kreitman (1994) observed that thesiII haplotype issegregating at only two synonymous sites. HKA segre-gating sites tests (Hudson et al. 1987) against either al-cohol dehydrogenase (Adh) or period were significant,indicating a departure from neutrality. However,Adhandperiod were not significantly different from each other.
This allowed Ballard and Kreitman (1994) to concludethat the synonymous polymorphism level is lower thanexpected for the cytochromeb locus, given its rate ofevolution. Rand et al. (1994) observed fewer than halfthe number of variable sites expected under neutrality atND5, when compared to sequences from theperiod lo-cus. Similarly, Ballard (2000) noted a significant reduc-tion in the diversity of seven mtDNA genomes whencompared to intron 1 ofAdhr as determined by the HKAtest (Hudson et al. 1987). This suggests that there hasbeen one or more recent selective sweeps of the mito-chondrial genome insiII. This may result from the se-lective fixation of a mutation (Maynard Smith and Haigh1974; Kaplan et al. 1989), nuclear-cytoplasmic interac-tions (Clark and Lyckegaard 1988; Hutter and Rand1995), or through a maternally inherited factor, such asWolbachia(Turelli et al. 1992; Ballard et al. 1996; Bal-lard 2000; James and Ballard 2000).
The third set of processes influence the evolutionarydynamics of mtDNA regions within the mitochondrialgenome. This could be the result of mutational mecha-nisms or coincident selection affecting sites within the
Fig. 6. Sliding-window analyses.The bar at the top illustrates theposition of each protein codinglocus and rRNA. The tRNAs arerepresented as black boxes. Thewindow is 1,000 bp in length andslides 40 bp at a time. The formulafor calculating the variability ispresented in the text.Sliding-window analyses comparingthe variability amongA All ninesequences (LHS).B All ninesequences (LHS) andD. simulanssiII and -III (RHS). C All ninesequences (LHS), andD. sechelliaandD. simulans siI (RHS). Notethat the Y axes are not equal inmagnitude. To assess the variabilitybetween two sliding-window plots,the Pearson product moment (r)correlation is employed. Thehorizontal black bars show the fourregions of statistical incongruencedetected by the sliding windowmaximum likelihood method.
60
region. Ballard (1998) proposed two possible explana-tions for the uncoupling of evolutionary rates within themtDNA genome. One mechanism is lineage-specific se-lection affecting a subset of genes. The other, homolo-gous recombination, is not supported in this study. Bal-lard (1998) suggested rate variation in distinct lineagesmight occur if each gene in each mtDNA haplotype (lin-eage) evolves by different selective rules. This may re-sult from specific selective pressures exerted by changesin the environment or local demographic differences. Forexample, effective population size differences betweenlineages might have differential effects on rates of sub-stitution in mitochondrial loci, the nuclear loci withwhich they interact, or their proteins. An alternate ex-planation is that there is significant variation in the in-tensity of purifying selection against different nonsyn-onymous substitutions in distinct regions of mtDNA (Xia1998).
A primary motivation of this study was to explore theobserved differences in rates of synonymous changes attwo localized regions of mtDNA insiI and siII (Ballard1998). It aimed to determine how frequently this hetero-geneity in the substitution process is observed in distinctlineages of mtDNA from closely related species withintheD. melanogastersubgroup. In this study, four regionsof heterogeneity are evident. A single shift in one lineagemight have caused the significantly different nucleotidesubstitution rates in each of Regions 1, 2, and 4. In con-trast, Region 3 appears to have multiple causes. In Re-gion 1, there is an increase in the synonymous substitu-tion rate in the interspecific branch of the COI locus tosiII. It defines the region that was shown by Ballard(1998) to have a high rate of substitution in thesiIIlineage. Region 2 is correlated with an increase in thenumber of changes in the lineage toD. yakuba.It spansthe phenylalanine tRNA. Region 4 is correlated with cy-tochromeb, the locus shown by Ballard (1998) to exhibitan elevated rate of substitutions tosiI. Inclusion of D.sechelliapermitted the lineage tosiI to be divided intotwo branches (lineages 11 and 13 in Fig. 3). This facili-tated the delineation of the evolutionary rate increaseonto the ancestral lineage 11.
The findings from this study indicate the evolutionarydynamics ofDrosophila mtDNA can be explained bycombinations of processes intrinsic to the molecule, pro-cesses that affect the dynamics of lineages and processesthat differentially influence regions of DNA within ge-nomes. A dominant force may be interpreted as selectionfor increased rate of replication, DNA repair, and astrand bias in the patterns of substitution among species.Processes that affect the evolutionary dynamics ofmtDNA within lineages may reflect effective populationsize differences between lineages and weak selection act-ing on both nonsynonymous and synonymous substitu-tions. Lineage-specific selection remains a strong expla-nation for the spatial phylogenetic variation detected in
regions of DNA. There is no evidence for homologousrecombination. These data illustrate the complexity ofthe evolutionary process in mtDNA and showcase thepower of comparative genomics in teasing apart theforces that shape evolutionary change.
Acknowledgments. I thank Kirrie Ballard and Andrew Berry for helpcollecting flies; ICIPE for assistance in obtaining collection permits;Jerry Coyne, Tim Karr, Rumi Kondo, Michael Solignac, and MichaelTurelli for providing isofemale lines; and Nick Grassly and Todd Lowefor assistance with the analyses. Matt Dean, Dick Hudson, Avis James,Martin Kreitman, Thomas Nagylaki, and David Rand gave constructivecomments. All sequencing was done in the Pritzker Laboratory ofMolecular Systematics and Evolution, Field Museum, by JWOB.Funds were provided by National Science Foundation (NSF) Grant No.DEB-9702824 and the Field Museum Marshall Field Fund.
References
Akashi H (1995) Inferring weak selection from patterns of polymor-phism and divergence at “silent” sites inDrosophilaDNA. Genet-ics 139:1067–1076
Akashi H (1996) Molecular evolution betweenDrosophila melanogas-ter andD. simulans:reduced codon bias, faster rates of amino acidsubstitution, and larger proteins inD. melanogaster.Genetics 144:1297–1307
Alm RA, Ling LS, Moir DT, King BL, Brown ED, Doig PC, Smith DR,Noonan B, Guild BC, deJonge BL, Carmel G, Tummino PJ, CarusoA, Uria-Nickelsen M, Mills DM, Ives C, Gibson R, Merberg D,Mills SD, Jiang Q, Taylor DE, Vovis GF, Trust TJ (1999) Geno-mic-sequence comparison of two unrelated isolates of the humangastric pathogenHelicobacter pylori.Nature 397:176–180
Aquadro CF, Lado KM, Noon WA (1988) Therosy region of Dro-sophila melanogasterandDrosophila simulans.I. Contrasting lev-els of naturally occurring DNA restriction map variation and di-vergence. Genetics 119:1165–1190
Awadalla P, A Eyre-Walker, J Maynard Smith (1999) Linkage disequi-librium and recombination in hominid mitochondrial DNA. Science286:2524–2525
Baba-Aıssa F, Solignac M, Dennebouy N, David JR (1988) Mitochon-drial DNA variability in Drosophila simulans:quasi absence ofpolymorphism within each of the three cytoplasmic races. Heredity61:419–426
Ballard JWO (2000) Comparative genomics of mitochondrial DNA inDrosophila simulans.J Mol Evol 51:64–75
Ballard JWO (1998) Evolutionary rate variation within the mitochon-drial DNA of Drosophila simulans.Current Topics of MolecularEvolution, Proceedings of the 1997 US/Germany/Japan TriNationalWorkshop on Molecular Evolution, Munich, Germany, pp 25–36
Ballard JWO (2000) When one is not enough: introgression inDro-sophila.Mol Biol Evol 17:1126–1130
Ballard JWO, Kreitman M (1995) Is mitochondrial DNA a strictlyneutral marker? TREE 10:485–488
Ballard JWO, Kreitman M (1994) Unraveling selection in the mito-chondrial genome ofDrosophila.Genetics 138:757–772
Ballard JWO, Hatzidakis J, Karr TL, Kreitman M (1996) Reducedvariation in Drosophila simulansmitochondrial DNA. Genetics144:1519–1528
Begun D, Aquadro CF (1993) African and North American populationsof Drosophila melanogasterare very different at the DNA level.Nature 365:548–550
Bergstrom CT, Prichard J (1998) Germline bottlenecks and the evolu-
61
tionary maintenance of mitochondrial genomes. Genetics 149:2135–2146
Blattner FR, Plunkett G III, Bloch CA, Perna NT, Burland V, Riley M,Collado-Vides J, Glasner JD, Rode CK, Mayhew GF, Gregor J,Davis NW, Kirkpatrick HA, Goeden MA, Rose DJ, Mau B, Shao Y(1997) The complete genome sequence ofEscherichia coliK-12.Science 277:1453–1474
Bridger WA, Henderson JF (1983) Cell ATP. Wiley, New York.Charlesworth B, Morgan MT, Charlesworth D (1993) The effects of
deleterious mutations on neutral molecular variation. Genetics 134:1289–1303
Clark AG, Lyckegaard EMS (1988) Natural selection with nuclear andcytoplasmic transmission. III. Joint analysis of segregation andmtDNA in Drosophila melanogaster.Genetics 118:471–481
Clary DO, Wolstenholme DR (1983) Genes for cytochrome c oxidaseI, URF2, and three tRNA’s inDrosophila mitochondrial DNA.Nucleic Acids Res 11:6859–6872
Clary DO, Wolstenholme DR (1985) The mitochondrial molecule ofDrosophila yakuba:nucleotide sequence, gene organization andgenetic code. J Mol Evol 22:252–271
de Bruijn MHL (1983)Drosophila melanogastermitochondrial DNA,a novel organization and genetic code. Nature 304:234–241
Dykhuizen DS, Green L (1991) Recombination inEscherichia coliandthe definition of biological species. J Bacteriol 173:7257–7268
Efron B (1982) The jackknife, the bootstrap, and other resamplingplans. Conf Board Math Sci Soc Ind Appl Math 38:1–92
Eyre-Walker A, Smith NH, Maynard Smith J (1999) How clonal arehuman mitochondria? Proc R Soc 266:477–483
Felsenstein J (1985) Confidence limits on phylogenies: an approachusing bootstrap. Evolution 39:783–791
Garesse R (1988)Drosophila melanogastermitochondrial DNA: geneorganization and evolutionary considerations. Genetics 118:649–663
Grassly NC, Holmes EC (1997) A likelihood method for the detectionof selection and recombination using nucleotide sequences. MolBiol Evol 14:239–247
Hagelberg, E. Goldman N, Lio P, Whelan S, Schiefenhovel W, CleggJB, Bowden DK (1999) Evidence for mitochondrial DNA recom-bination in a human population of island Melanesia. Proc R Soc BBiol Sci 266:485–492
Hasegawa M, Kishino H, Yano T (1985) Dating of the human-apesplitting by a molecular clock of mitochondrial DNA. J Mol Evol21:160–174
Hey J (1994) Bridging phylogenetics and population genetics with genetree models. In: Schierwater B, Streit B, Wagner G, DeSalle R (eds)Molecular approaches to ecology and evolution. Birkhauser, Basel,pp 435–449
Hudson RR, Kaplan N (1985) Statistical properties in the number ofrecombination events in the history of a sample of DNA sequences.Genetics 111:147–164
Hudson RR, Kreitman M, Aguade´ M (1987) A test of neutral molecularevolution based on nucleotide data. Genetics 116:153–159
Hutter CM, Rand DM (1995) Competition between mitochondrial hap-lotypes in distinct nuclear genetic environments:Drosophila pseu-doobscuravs. D. persimilis.Genetics 140:537–548
Ikemura T (1981) Correlation between the abundance ofEscherichiacoli transfer RNA’s and the occurrence of the respective codons inits protein genes: a proposal for a synonymous codon choice that isoptimal for theE. coli translational system. J Mol Biol 151:389–409
Ikemura T (1982) Correlation between the abundance of yeast transferRNA’s and the occurrence of the respective codons in its proteingenes: differences in synonymous codon choice patterns of yeastandEscherichia coliwith reference to the abundance of isoaccept-ing transfer RNAs. J Mol Biol 2:13–34
Inohira K, Hara T, Matsuura ET (1997) Nucleotide sequence diver-gence in the A+T rich region of mitochondrial DNA inDrosophilamauritiana.Mol Biol Evol 14:814–822
James AC, Ballard JWO (2000) The expression of cytoplasmic incom-patibility and its impact on population frequencies and the distri-bution of Wolbachiastrains inDrosophila simulans.Evolution (inpress)
Kaneko M, Satta Y, Matsuura ET, Chigusa SI (1993) Evolution of themitochondrial ATPase 6 gene inDrosophila: evidence for an un-usually high level of polymorphism inD. melanogaster.Genet Res61:195–204
Kaplan NL, Hudson RR, Langley CH (1989) The “hitchhiking effect”revisited. Genetics 123:887–899
Kishino H, Hasegawa M (1989) Evaluation of the maximum likelihoodof the evolutionary tree topologies from DNA sequence data, andthe branching order inHominoidea.J Mol Evol 29:170–179
Kondo R, Satta Y, Matsuura ET, Ishiwa H, Takahato N, Chigusa SI(1990) Incomplete maternal transmission of mitochondrial DNA inDrosophila.Genetics 126:657–663
Kreitman M (1983) Nucleotide polymorphism at thealcohol dehydro-genaselocus ofDrosophila melanogaster.Nature 304:412–417
Lachaise D, Cariou M-L, David JR, Lemeunier F, Tsacas L, AshburnerM (1988) Historical biogeography of theDrosophila melanogastersubgroup. Evol Biol 22:159–225
Lewin B (1997) Genes VI. Oxford University Press, OxfordLewis DL, Farr CL, Kaguni LS (1995)Drosophila melanogastermi-
tochondrial DNA: completion of the nucleotide sequences and evo-lutionary comparisons. Insect Mol Biol 4:263–278
Lewis DL, Farr CL, Farquhar AL, Kaguni LS (1994) Sequence orga-nization, and evolution of the A+T region ofDrosophilamitochon-drial DNA. Mol Biol Evol 11:523–538
Lowe TM, Eddy SR (1997) tRNAscan-SE: a program for improveddetection of transfer RNA genes in genomic sequence. NucleicAcids Res 25:955–964
Maddison WP, Maddison DR (1992) MacClade: analysis of phylogenyand character evolution, version 3.0. Sinauer Associates, Sunder-land, MA
Martin AP (1995) Metabolic rate and directional nucleotide substitu-tion in animal mitochondrial DNA. Mol Biol Evol 12:1124–1131
Maynard Smith J (1992) Analysing the mosaic structure of genes. JMol Evol 34:126–129
Maynard Smith J, Haigh J (1974) The hitchhiking effect of a favorablegene. Genet Res 23:23–25
Maynard Smith J, Smith NH (1998) Detecting recombination fromgene trees. Mol Biol Evol 15:590–599
McDonald JH, Kreitman M (1991) Adaptive protein evolution at theAdh locus inDrosophila.Nature 351:652–654
Milkman RIP, Crawford IP (1983) Clustered third-base substitutionsamong wild strains ofEscherichia coli.Science 221:378–380
Montchamp-Moreau C, Ferveur J-F, Jacques M (1991) Geographicdistribution of three cytoplasmic incompatibility types inDro-sophila simulans.Genetics 129:399–407
Moraes CT, Ciacci F, Bonilla E, Jansen C, Hirano M, Rao N, LovelaceRE, Rowland LP, Schon EA, DiMauro S (1993) Two novel patho-genetic mitochondrial mutations affecting organelle number andprotein synthesis. Is the tRNALEU (UUR) an etiologic hot spot? J ClinInvest 92:2906–2915
Nachman MW (1998) Deleterious mutations in animal mitochondrialDNA. Genetica 103:61–69
Nachman MW, Boyer SN, Aquadro CF (1994) Nonneutral evolution atthe mitochondrial NADH dehydrogenase subunit 3 gene in mice.Proc Natl Acad Sci USA 91:6364–6368
Nakamichi N, Rhoads DD, Hayashi JI, Kagawa Y, Matsumura T(1998) Detection, localization, and sequence analysis of mitochon-drial regulatory region RNAs in several mammalian species. J Bio-chem (Tokyo) 123:392–398
Nei M, Gojobori T (1986) Simple methods for estimating the numberof synonymous and nonsynonymous substitutions. Mol Biol Evol3:418–426
Niki Y, Chigusa SI, Matsuura T (1989) Complete replacement of mi-tochondrial DNA inDrosophila.Nature 341:551–552
62
Ohta T (1972) Population size and the rate of evolution. J Mol Evol1:305–314
Ohta T (1973) Slightly deleterious mutant substitutions in evolution.Nature 246:96–98
Proutski V, Holmes EC (1998) SWAN: sliding window analysis ofnucleotide sequence variability. Bioinformatics 14:467–468
Rand DM, Kann LM (1998) Mutation and selection at silent and re-placement sites in the evolution of animal mitochondrial DNA.Genetica 102–103:393–407
Rand D, Dorfsman M, Kann LM (1994) Neutral and non-neutral evo-lution of Drosophilamitochondrial DNA. Genetics 138:741–756
Robertson HM (1983) Mating behavior and the evolution ofDro-sophila mauritiana.Evolution 37:1283–1293
Rousset F, Vautin D, Solignac M (1992) Molecular identification ofWolbachia, the agents of cytoplasmic incompatibility inDro-sophila simulans,and variability in relation with host mitochondrialtypes. Proc Roy Soc (Lond) B 247:163–168
Rozas J, Rozas R (1997) DnaSP version 2.0: a novel software packagefor extensive molecular population genetics analysis. Comput Ap-plic Biosci 13:307–311
Satta Y, Takahata N (1990) Evolution ofDrosophila mitochondrialDNA and the history of themelanogastersubgroup. Proc Natl AcadSci 87:9558–9562
Satta, Y, Ishiwa H, Chigusa SI (1987) Analysis of nucleotide substi-tutions of mitochondrial DNAs inDrosophila melanogasterand itssibling species. Mol Biol Evol 4:638–650
Saville, BJ, Kohli Y, Anderson J (1998) MtDNA recombination in anatural population. Proc Natl Acad Sci 95:1331–1335
Schwarze SR, Weindruch R, Aiken JM (1998) Decreased mitochon-drial RNA levels without accumulation of mitochondrial deletionsin agingDrosophila melanogaster.Mutat Res 382:99–107
Solignac M, Monnerot M (1986) Race formation and introgressionwithin Drosophila simulans D mauritianaandD sechelliainferredfrom mitochondrial DNA analysis. Evolution 40:531–539
Solignac M, Monnerot M, Monnerot J-C (1983) Mitochondrial hetero-plasmy in Drosophila mauritiana.Proc Nat Acad Sci 80:6942–6946
Solignac M, Monnerot M, Mounolou J-C (1986) Mitochondrial DNAevolution in themelanogasterspecies subgroup ofDrosophila. JMol Evol 23:31–40
Stephens J (1985) Statistical methods of DNA sequence analysis: de-tection of intragenetic recombination or gene conversion. Mol BiolEvol 2:539–556
Swofford DL (1998) PAUP*. Phylogenetic analysis using parsimony (*and other methods), version 4b3. Sinauer Associates, Sunderland,MA
Tajima F (1993) Simple methods for testing the molecular evolutionaryclock hypothesis. Genetics 135:599–607
Tsacas L, Ba¨chli B (1981)Drosophila sechellia,n. sp., huitie´me espe´cedu sous-groupemelanogasterdes iles Se´chelles (Diptera, Drosophi-lidae) Revue Jr Ent 3:146–150
Tsacas L, David J (1974)Drosophila mauritianan sp du groupeme-lanogasterde l’ıle Maurice (Dipt Drosophilidae). Bull Soc EntomolFrancaise 79:42–46
Turelli M, Hoffmann AA, McKechnie SW (1992) Dynamics of cyto-plasmic incompatibility and mtDNA variation in naturalDro-sophila simulanspopulations. Genetics 132:713–723
Xia X (1996) Maximizing transcription efficiency causes codon usagebias. Genetics 144:1309–1320
Xia X (1998) The rate heterogeneity of nonsynonymous substitutionsin mammalian mitochondrial genes. Mol Biol Evol 15:336–344
63