comparative analysis of the effects of alogliptin and
TRANSCRIPT

2017, 64 (2), 179-189
INCRETIN preparations, including dipeptidyl pepti-dase 4 (DPP-4) inhibitors, are drugs that can improve glycemic control by promoting insulin secretion in a glucose-dependent manner and improving the function of pancreatic β cells. These preparations are currently considered important for the treatment of diabetes mel-litus [1-4]. In Asian patients, especially Japanese, insulin secretion levels during the early stages of dia-betes tend to be lower than those in Caucasians [5]. Furthermore, the change in glycosylated hemoglo-bin (HbA1c) level after treatment with DPP-4 inhibi-tors in Asians (−0.26%; 95% confidence interval [CI]:
Comparative analysis of the effects of alogliptin and vildagliptin on glucose metabolism in type 2 diabetes mellitus
Kenichi Tanaka1), Yosuke Okada1), Hiroko Mori1), Megumi Miyazaki1), Fumi Kuno1), Satomi Sonoda1), Kei Sugai1), Maiko Hajime1), Akira Kurozumi1), Manabu Narisawa1), Keiichi Torimoto1), Tadashi Arao1), Shinichiro Mine2) and Yoshiya Tanaka1)
1) First Department of Internal Medicine, School of Medicine, University of Occupational and Environmental Health, Japan, Kitakyushu 807-8555, Japan
2) Sasaki Hospital, Kitakyushu 807-1114, Japan
Abstract. The aim of this 24-week, prospective randomized open-label study was to compare the effects of alogliptin and vildagliptin on glucose control, renal function, and lipid metabolism. In Study 1, DPP-4 inhibitor-naive type 2 diabetes (T2DM) were randomly assigned to alogliptin 25 mg/day or vildagliptin 50 mg twice daily. In Study 2, T2DM on treatment with 50 mg/day sitagliptin were switched to either 25 mg/day alogliptin or 50 mg twice daily vildagliptin. The primary endpoint was change in glycosylated hemoglobin (HbA1c) level at 24 weeks, while the secondary endpoints were changes in urinary albumin excretion and low-density lipoprotein cholesterol (LDL-C) levels at 24 weeks. In Study 1, HbA1c levels changed at 24-week by −0.5±0.7% in the alogliptin group (p=0.002, relative to baseline) and −0.7±0.9% in the vildagliptin group (p=0.001, relative to baseline), and the extent of these changes were comparable between the two groups (p=0.219). The decrease in log urinary albumin excretion was more significant in the vildagliptin group (p=0.008). In Study 2, HbA1c levels at 24-week changed by 0.2±0.7% in the switch-to-alogliptin group (p=0.007) and 0.0±0.6% in the switch-to-vildagliptin group (p=0.188), indicating a significant difference between the groups (p=0.003). In both studies, the changes in LDL-C levels were comparable between the two groups. The two drugs had comparable glucose-lowering effects in DPP-4 inhibitor-naive patients but the effect was more pronounced for vildagliptin in patients switched from sitagliptin. The results may point to subtle yet important differences between the two DPP-4 inhibitors. This trial was registered with UMIN (no. #000019022).
Key words: Type 2 diabetes, Alogliptin, Vildagliptin
−0.36% to −0.17%) is primarily affected by impaired insulin secretion and is significantly greater than that in non-Asians [6].
Apart from their glucose-lowering effects, DPP-4 inhibitors also have pleiotropic extrapancreatic effects on the kidneys, heart, blood vessels, and lipid metab-olism [7]. The currently available types of DPP-4 inhibitors have different binding modes, blood half-life, inhibitory activity against DPP-4, tissue dis-tribution, excretion pathway, and other properties [8]. Although the variability in these properties may also translate into differences in hypoglycemic and pleio-tropic effects, only a few studies compared the differ-ences in the effects of various types of DPP-4 inhibi-tors. In this prospective study, we compared alogliptin and vildagliptin, two DPP-4 inhibitors, in terms of their glucose-lowering and pleiotropic effects on renal func-tion and lipid metabolism.
Submitted Jul. 11, 2016; Accepted Oct. 12, 2016 as EJ16-0341Released online in J-STAGE as advance publication Nov. 12, 2016Correspondence to: Yoshiya Tanaka, M.D., Ph.D., First Department of Internal Medicine, School of Medicine, University of Occupational and Environmental Health, Japan, 1-1 Iseigaoka, Yahatanishi-ku, Kitakyushu 807-8555, Japan. E-mail: [email protected]
©The Japan Endocrine Society
Original
180 Tanaka et al.
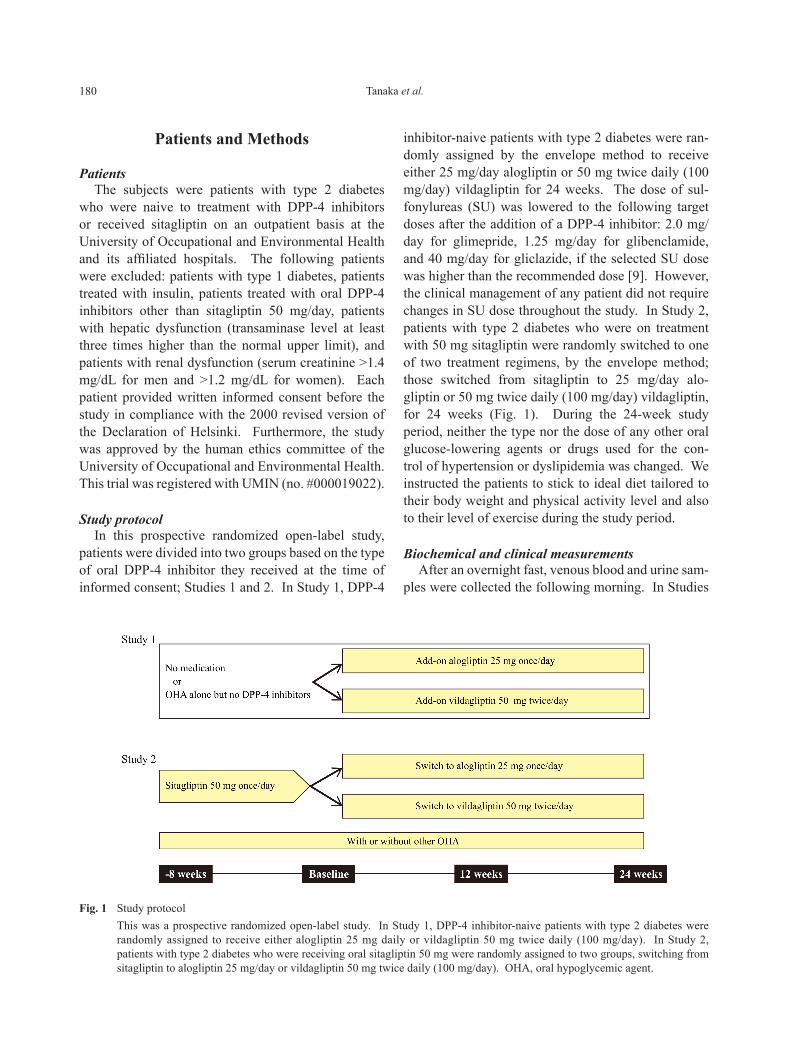
inhibitor-naive patients with type 2 diabetes were ran-domly assigned by the envelope method to receive either 25 mg/day alogliptin or 50 mg twice daily (100 mg/day) vildagliptin for 24 weeks. The dose of sul-fonylureas (SU) was lowered to the following target doses after the addition of a DPP-4 inhibitor: 2.0 mg/day for glimepride, 1.25 mg/day for glibenclamide, and 40 mg/day for gliclazide, if the selected SU dose was higher than the recommended dose [9]. However, the clinical management of any patient did not require changes in SU dose throughout the study. In Study 2, patients with type 2 diabetes who were on treatment with 50 mg sitagliptin were randomly switched to one of two treatment regimens, by the envelope method; those switched from sitagliptin to 25 mg/day alo-gliptin or 50 mg twice daily (100 mg/day) vildagliptin, for 24 weeks (Fig. 1). During the 24-week study period, neither the type nor the dose of any other oral glucose-lowering agents or drugs used for the con-trol of hypertension or dyslipidemia was changed. We instructed the patients to stick to ideal diet tailored to their body weight and physical activity level and also to their level of exercise during the study period.
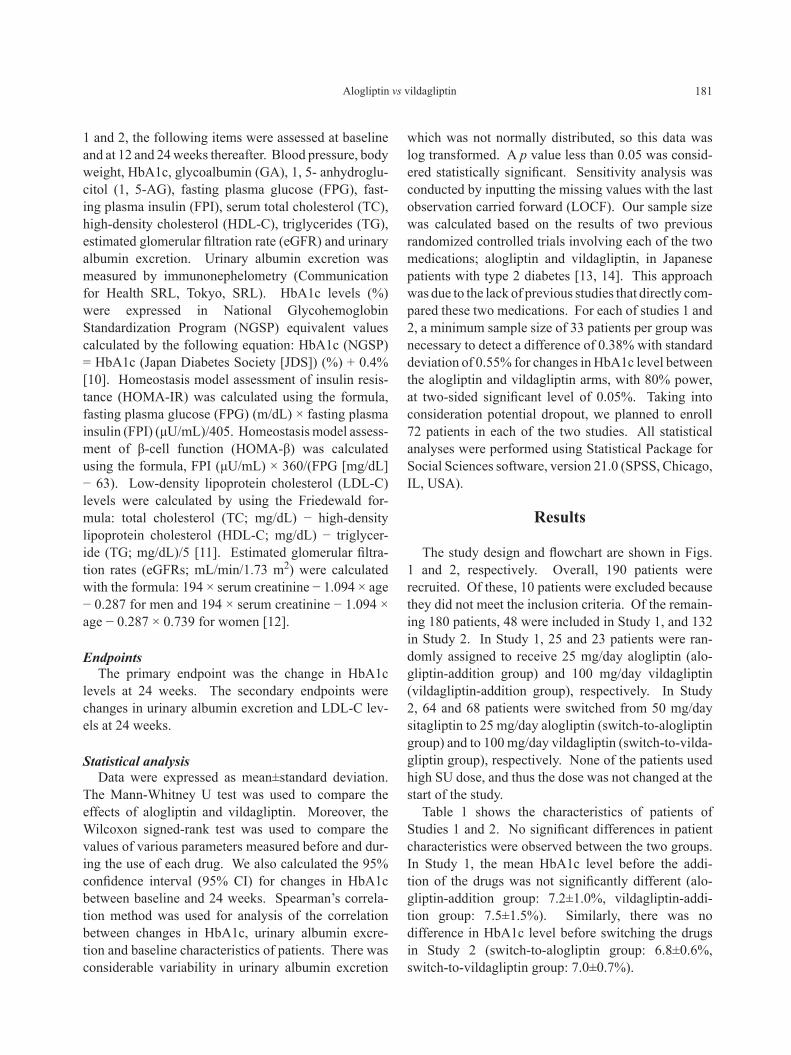
Biochemical and clinical measurementsAfter an overnight fast, venous blood and urine sam-
ples were collected the following morning. In Studies
Patients and Methods
PatientsThe subjects were patients with type 2 diabetes
who were naive to treatment with DPP-4 inhibitors or received sitagliptin on an outpatient basis at the University of Occupational and Environmental Health and its affiliated hospitals. The following patients were excluded: patients with type 1 diabetes, patients treated with insulin, patients treated with oral DPP-4 inhibitors other than sitagliptin 50 mg/day, patients with hepatic dysfunction (transaminase level at least three times higher than the normal upper limit), and patients with renal dysfunction (serum creatinine >1.4 mg/dL for men and >1.2 mg/dL for women). Each patient provided written informed consent before the study in compliance with the 2000 revised version of the Declaration of Helsinki. Furthermore, the study was approved by the human ethics committee of the University of Occupational and Environmental Health. This trial was registered with UMIN (no. #000019022).
Study protocolIn this prospective randomized open-label study,
patients were divided into two groups based on the type of oral DPP-4 inhibitor they received at the time of informed consent; Studies 1 and 2. In Study 1, DPP-4
Fig. 1 Study protocol This was a prospective randomized open-label study. In Study 1, DPP-4 inhibitor-naive patients with type 2 diabetes were
randomly assigned to receive either alogliptin 25 mg daily or vildagliptin 50 mg twice daily (100 mg/day). In Study 2, patients with type 2 diabetes who were receiving oral sitagliptin 50 mg were randomly assigned to two groups, switching from sitagliptin to alogliptin 25 mg/day or vildagliptin 50 mg twice daily (100 mg/day). OHA, oral hypoglycemic agent.
181Alogliptin vs vildagliptin
which was not normally distributed, so this data was log transformed. A p value less than 0.05 was consid-ered statistically significant. Sensitivity analysis was conducted by inputting the missing values with the last observation carried forward (LOCF). Our sample size was calculated based on the results of two previous randomized controlled trials involving each of the two medications; alogliptin and vildagliptin, in Japanese patients with type 2 diabetes [13, 14]. This approach was due to the lack of previous studies that directly com-pared these two medications. For each of studies 1 and 2, a minimum sample size of 33 patients per group was necessary to detect a difference of 0.38% with standard deviation of 0.55% for changes in HbA1c level between the alogliptin and vildagliptin arms, with 80% power, at two-sided significant level of 0.05%. Taking into consideration potential dropout, we planned to enroll 72 patients in each of the two studies. All statistical analyses were performed using Statistical Package for Social Sciences software, version 21.0 (SPSS, Chicago, IL, USA).
Results
The study design and flowchart are shown in Figs. 1 and 2, respectively. Overall, 190 patients were recruited. Of these, 10 patients were excluded because they did not meet the inclusion criteria. Of the remain-ing 180 patients, 48 were included in Study 1, and 132 in Study 2. In Study 1, 25 and 23 patients were ran-domly assigned to receive 25 mg/day alogliptin (alo-gliptin-addition group) and 100 mg/day vildagliptin (vildagliptin-addition group), respectively. In Study 2, 64 and 68 patients were switched from 50 mg/day sitagliptin to 25 mg/day alogliptin (switch-to-alogliptin group) and to 100 mg/day vildagliptin (switch-to-vilda-gliptin group), respectively. None of the patients used high SU dose, and thus the dose was not changed at the start of the study.
Table 1 shows the characteristics of patients of Studies 1 and 2. No significant differences in patient characteristics were observed between the two groups. In Study 1, the mean HbA1c level before the addi-tion of the drugs was not significantly different (alo-gliptin-addition group: 7.2±1.0%, vildagliptin-addi-tion group: 7.5±1.5%). Similarly, there was no difference in HbA1c level before switching the drugs in Study 2 (switch-to-alogliptin group: 6.8±0.6%, switch-to-vildagliptin group: 7.0±0.7%).
1 and 2, the following items were assessed at baseline and at 12 and 24 weeks thereafter. Blood pressure, body weight, HbA1c, glycoalbumin (GA), 1, 5- anhydroglu-citol (1, 5-AG), fasting plasma glucose (FPG), fast-ing plasma insulin (FPI), serum total cholesterol (TC), high-density cholesterol (HDL-C), triglycerides (TG), estimated glomerular filtration rate (eGFR) and urinary albumin excretion. Urinary albumin excretion was measured by immunonephelometry (Communication for Health SRL, Tokyo, SRL). HbA1c levels (%) were expressed in National Glycohemoglobin Standardization Program (NGSP) equivalent values calculated by the following equation: HbA1c (NGSP) = HbA1c (Japan Diabetes Society [JDS]) (%) + 0.4% [10]. Homeostasis model assessment of insulin resis-tance (HOMA-IR) was calculated using the formula, fasting plasma glucose (FPG) (m/dL) × fasting plasma insulin (FPI) (μU/mL)/405. Homeostasis model assess-ment of β-cell function (HOMA-β) was calculated using the formula, FPI (μU/mL) × 360/(FPG [mg/dL] − 63). Low-density lipoprotein cholesterol (LDL-C) levels were calculated by using the Friedewald for-mula: total cholesterol (TC; mg/dL) − high-density lipoprotein cholesterol (HDL-C; mg/dL) − triglycer-ide (TG; mg/dL)/5 [11]. Estimated glomerular filtra-tion rates (eGFRs; mL/min/1.73 m2) were calculated with the formula: 194 × serum creatinine − 1.094 × age − 0.287 for men and 194 × serum creatinine − 1.094 × age − 0.287 × 0.739 for women [12].
EndpointsThe primary endpoint was the change in HbA1c
levels at 24 weeks. The secondary endpoints were changes in urinary albumin excretion and LDL-C lev-els at 24 weeks.
Statistical analysisData were expressed as mean±standard deviation.
The Mann-Whitney U test was used to compare the effects of alogliptin and vildagliptin. Moreover, the Wilcoxon signed-rank test was used to compare the values of various parameters measured before and dur-ing the use of each drug. We also calculated the 95% confidence interval (95% CI) for changes in HbA1c between baseline and 24 weeks. Spearman’s correla-tion method was used for analysis of the correlation between changes in HbA1c, urinary albumin excre-tion and baseline characteristics of patients. There was considerable variability in urinary albumin excretion

182 Tanaka et al.
Fig. 2 Flow chart of enrolled participants
Table 1 Baseline characteristics of patientsStudy 1 (Add-on group) p Study 2 (Switching group) pAlogliptin Vildagliptin Alogliptin Vildagliptin
Age (years) 63.6 ± 9.8 65.8 ± 13.5 0.260 66.7 ± 10.2 66.2 ± 9.9 0.547Sex (men/women) 11/14 15/8 0.161 34/30 38/30 0.861Duration of diabetes (year) 9.8 ± 6.0 8.0 ± 6.8 0.219 10.8 ± 8.8 11.7 ± 9.6 0.705Body weight (kg) 64.1 ± 9.2 64.8 ±15.4 0.856 65.4 ± 17.3 62.2 ± 14.9 0.391Body mass index (kg/m2) 24.9 ± 3.4 24.8 ± 3.8 0.851 25.8 ± 6.4 24.2 ± 4.5 0.338Systolic blood pressure (mmHg) 128.8 ± 9.1 122.4 ± 11.6 0.056 130.7 ± 15.9 128.1 ± 16.1 0.225Diastolic blood pressure (mmHg) 71.1 ± 8.8 71.2 ± 9.2 0.852 72.4 ± 9.3 71.3 ± 11.2 0.549FPG (mg/dL) 140.1 ± 35.6 140.8 ± 44.5 0.733 132.5 ± 20.0 136.5 ± 25.0 0.494HbA1c (%) 7.2 ± 1.0 7.5 ± 1.5 0.549 6.8 ± 0.6 7.0 ± 0.7 0.111GA (%) 19.2 ± 3.5 19.2 ± 4.0 0.836 17.7 ± 2.3 18.6 ± 3.0 0.9911, 5- AG (μg/mL) 8.7 ± 6.1 11.1 ± 11.9 0.890 13.9 ± 8.0 13.0 ± 8.5 0.519FPI (μg/mL) 8.8 ± 7.8 6.1 ± 3.5 0.919 6.8 ± 4.5 6.5 ± 6.4 0.199HOMA-IR 3.3 ± 3.0 2.4 ± 2.0 0.716 2.3 ± 1.7 2.2 ± 2.1 0.316HOMA-β (%) 42.5 ± 35.1 32.2 ± 16.7 0.991 35.3 ± 20.4 33.5 ± 25.8 0.136TC (mg/dL) 166.8 ± 29.9 160.6 ± 24.9 0.188 171.1 ± 30.6 174.3 ± 28.5 0.571LDL-C (mg/dL) 89.3 ± 22.2 85.8 ± 19.9 0.270 90.8 ± 26.7 96.8 ± 24.0 0.153HDL-C (mg/dL) 54.9 ± 15.4 51.3 ± 14.9 0.296 56.1 ± 12.7 57.6 ± 18.4 0.985TG (mg/dL) 105.0 ± 54.6 147.6 ± 87.2 0.069 116.3 ± 60.2 105.9 ± 57.9 0.233eGFR (mL/min/1.73 m2) 80.9 ± 33.7 73.8 ± 22.4 0.445 74.1 ± 19.4 72.6 ± 19.1 0.610Urine albumin excretion (mg/gCre) 28.7 ± 46.7 56.8 ± 97.4 0.865 51.3 ± 86.2 52.8 ± 136.5 0.192Log urine albumin excretion (mg/gCre) 1.2 ± 0.4 1.3 ± 0.6 0.865 1.3 ± 0.5 1.2 ± 0.6 0.394ACE-inhibitor or ARB 14 (56.0) 9 (39.1) 0.243 35 (54.7) 33 (48.5) 0.421Statins 12 (48.0) 12 (52.2) 0.882 35 (54.7) 43 (63.2) 0.371Diabetes therapy
No medication 7 (28.0) 8 (34.8) 0.613 – – –Only sitagliptin (50 mg/day) – – – 13 (20.3) 15 (22.1) 0.843Sulfonylurea 4 (16.0) 3 (13.0) 1.000 18 (28.6) 19 (27.9) 0.936Metformin 10 (40.0) 10 (43.5) 0.807 34 (53.0) 39 (57.4) 0.697Pioglitazone 7 (28.0) 5 (21.7) 0.617 16 (25.0) 14 (20.6) 0.513α-glucosidase inhibitor 2 (8.0) 4 (17.4) 0.407 6 (9.4) 14 (20.6) 0.079
Data are mean ± standard deviation, or n (%). Differences between groups were tested by Mann-Whitney test; categorical values were tested by χ2 test. p-value for the intergroup comparison (baseline between alogliptin and vildagliptin). FPG, fasting plasma glucose; HbA1c, glycated hemoglobin; GA, glycoalbumin; 1, 5-AG, 1, 5-anhydro-D-glucitol; FPI, fasting plasma insulin; HOMA-IR, homeostasis model assessment of insulin resistance; HOMA-β, homeostasis model assessment of β cell function; TC, total cholesterol; LDL-C, low-density cholesterol; HDL-C, high-density cholesterol; TG, triglyceride (TG); eGFR, estimated glomerular filtration rate; ACE, angiotensin converting enzyme; ARB, angiotensin-receptor blockers.
183Alogliptin vs vildagliptin
EfficacyChanges in HbA1c level
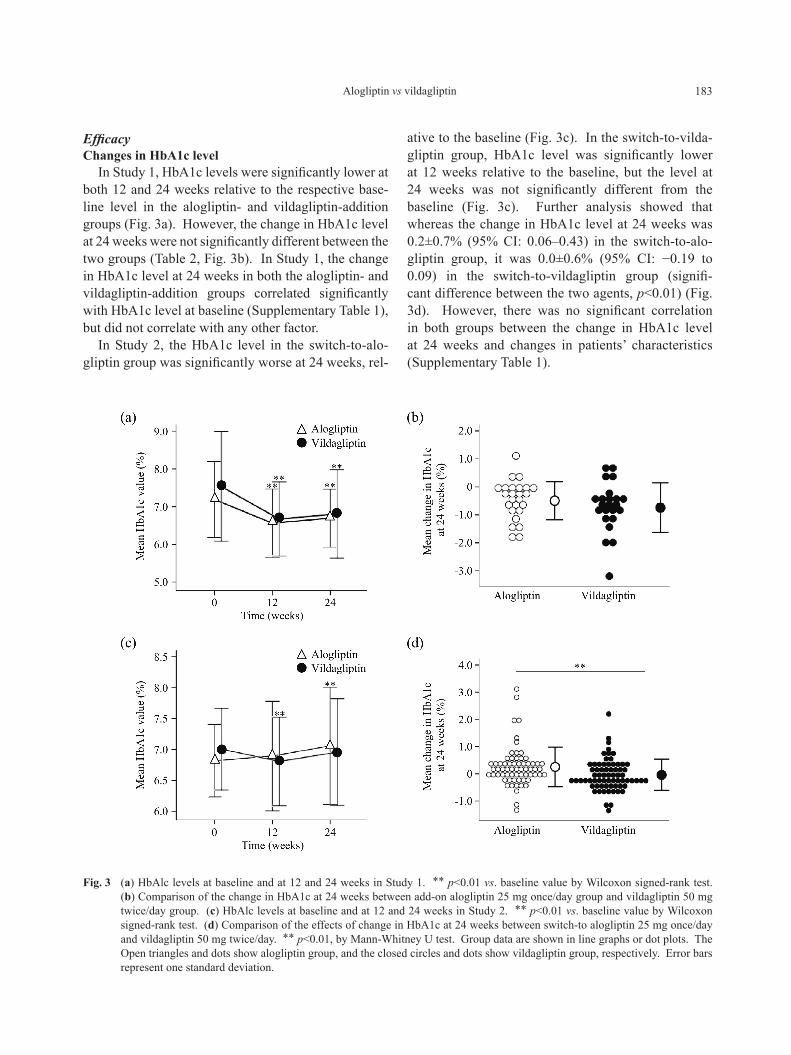
In Study 1, HbA1c levels were significantly lower at both 12 and 24 weeks relative to the respective base-line level in the alogliptin- and vildagliptin-addition groups (Fig. 3a). However, the change in HbA1c level at 24 weeks were not significantly different between the two groups (Table 2, Fig. 3b). In Study 1, the change in HbA1c level at 24 weeks in both the alogliptin- and vildagliptin-addition groups correlated significantly with HbA1c level at baseline (Supplementary Table 1), but did not correlate with any other factor.
In Study 2, the HbA1c level in the switch-to-alo-gliptin group was significantly worse at 24 weeks, rel-
ative to the baseline (Fig. 3c). In the switch-to-vilda-gliptin group, HbA1c level was significantly lower at 12 weeks relative to the baseline, but the level at 24 weeks was not significantly different from the baseline (Fig. 3c). Further analysis showed that whereas the change in HbA1c level at 24 weeks was 0.2±0.7% (95% CI: 0.06–0.43) in the switch-to-alo-gliptin group, it was 0.0±0.6% (95% CI: −0.19 to 0.09) in the switch-to-vildagliptin group (signifi-cant difference between the two agents, p<0.01) (Fig. 3d). However, there was no significant correlation in both groups between the change in HbA1c level at 24 weeks and changes in patients’ characteristics (Supplementary Table 1).
Fig. 3 (a) HbAlc levels at baseline and at 12 and 24 weeks in Study 1. ** p<0.01 vs. baseline value by Wilcoxon signed-rank test. (b) Comparison of the change in HbA1c at 24 weeks between add-on alogliptin 25 mg once/day group and vildagliptin 50 mg twice/day group. (c) HbAlc levels at baseline and at 12 and 24 weeks in Study 2. ** p<0.01 vs. baseline value by Wilcoxon signed-rank test. (d) Comparison of the effects of change in HbA1c at 24 weeks between switch-to alogliptin 25 mg once/day and vildagliptin 50 mg twice/day. ** p<0.01, by Mann-Whitney U test. Group data are shown in line graphs or dot plots. The Open triangles and dots show alogliptin group, and the closed circles and dots show vildagliptin group, respectively. Error bars represent one standard deviation.
184 Tanaka et al.
Changes in other markersIn Study 1, 8.0% of patients of the alogliptin-addi-
tion group had microalbuminuria, compared with 12.5% of patients of the vildagliptin-addition group, while 0% and 4.2% of patients had macroalbumin-uria, respectively. There was no statistically signifi-cant difference between the two groups. Fig. 4 sum-marizes the changes in log urinary albumin excretion at 24 weeks. No change was observed in this param-eter in the alogliptin-addition group, whereas a sig-nificant decrease (p=0.048) was noted in the vilda-gliptin-addition group. Furthermore, the change in this parameter at 24 weeks was significantly larger (p=0.008) in the vildagliptin-addition group than in the alogliptin-addition group. Furthermore, the change in log urinary albumin excretion at 24 weeks observed in the vildagliptin-addition group correlated signif-icantly with urinary albumin excretion at baseline (Supplementary Table 2). In Study 2, log urinary albumin excretion increased significantly (p=0.015) in the vildagliptin-addition group. However, there was no significant difference in the change in this parameter between the two groups (Table 3). In the switch-to-vildagliptin group, the change in log urinary albumin excretion at 24 weeks correlated significantly with the change in systolic blood pressure and HbA1c level at baseline (Supplementary Table 2).
Moreover, the changes in blood pressure, insulin resistance index, HOMA-IR, HOMA-β and LDL-C were comparable between the two groups in both studies.
Safety and tolerabilityThe incidence of adverse reactions during the
24-week treatment period was not different between the alogliptin-addition group and vildagliptin-addition group in Study 1, and also between the switch-to-alo-gliptin group and the switch-to-vildagliptin group in Study 2. In Study 1, adverse reactions were observed in one patient (4.0%) of the alogliptin-addition group and in none of the patients (0%) of the vildagliptin-addition group. In Study 2, adverse reactions were observed in one patient (1.6%) of the switch-to-alogliptin group and two patients (2.9%) of the switch-to-vildagliptin group. All patients developed hypoglycemia, which resulted in withdrawal of three of four patients from the study, including two patients with dose reduction or discontinuation of sulfonylurea (SU) and one patient with dose reduction of metformin. None of the patients developed serious hypoglycemia. No other adverse reactions, such as gastrointestinal symptoms, hepatic dysfunction, or renal dysfunction, were observed.
In Study 1, a significant increase in body weight was noted at 24 weeks in both groups, but there was no significant difference in the change in body weight between the two groups (Table 2). In Study 2, although body weight increased significantly in the switch-to-vildagliptin group, there was no significant difference in the change in body weight between the two groups (Table 3). Furthermore, there were no sig-nificant changes in the other biochemical parameters.
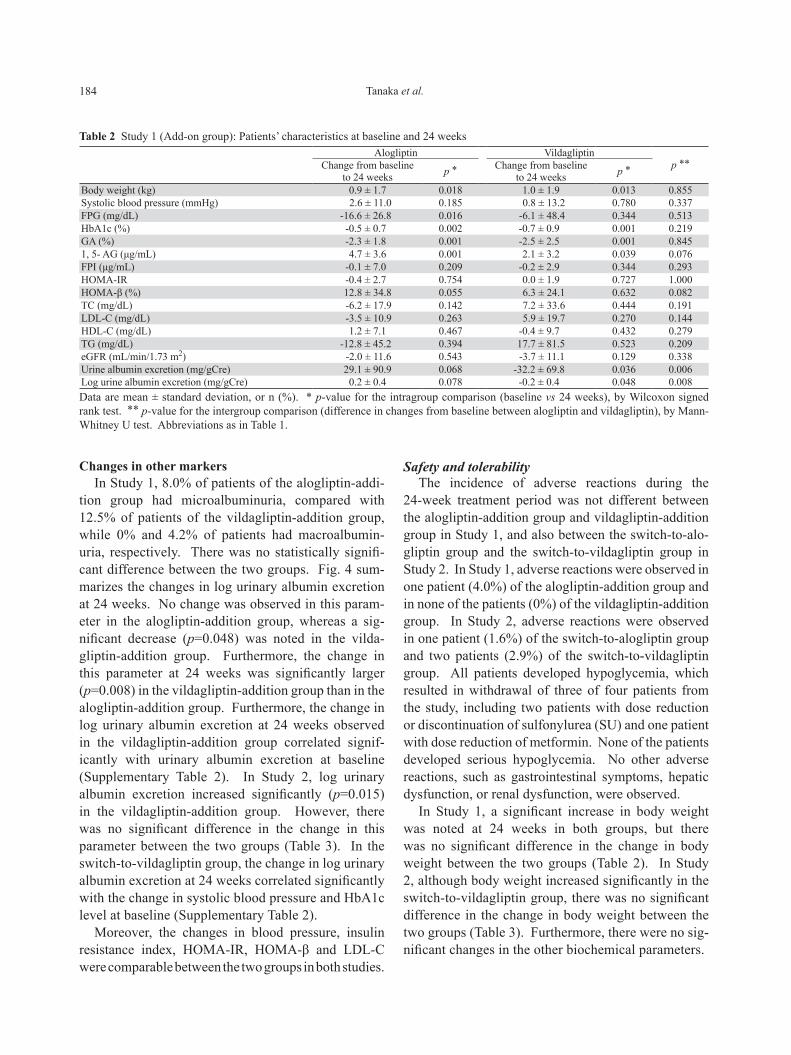
Table 2 Study 1 (Add-on group): Patients’ characteristics at baseline and 24 weeksAlogliptin Vildagliptin
p **Change from baseline to 24 weeks p * Change from baseline
to 24 weeks p *
Body weight (kg) 0.9 ± 1.7 0.018 1.0 ± 1.9 0.013 0.855Systolic blood pressure (mmHg) 2.6 ± 11.0 0.185 0.8 ± 13.2 0.780 0.337FPG (mg/dL) -16.6 ± 26.8 0.016 -6.1 ± 48.4 0.344 0.513HbA1c (%) -0.5 ± 0.7 0.002 -0.7 ± 0.9 0.001 0.219GA (%) -2.3 ± 1.8 0.001 -2.5 ± 2.5 0.001 0.8451, 5- AG (μg/mL) 4.7 ± 3.6 0.001 2.1 ± 3.2 0.039 0.076FPI (μg/mL) -0.1 ± 7.0 0.209 -0.2 ± 2.9 0.344 0.293HOMA-IR -0.4 ± 2.7 0.754 0.0 ± 1.9 0.727 1.000HOMA-β (%) 12.8 ± 34.8 0.055 6.3 ± 24.1 0.632 0.082TC (mg/dL) -6.2 ± 17.9 0.142 7.2 ± 33.6 0.444 0.191LDL-C (mg/dL) -3.5 ± 10.9 0.263 5.9 ± 19.7 0.270 0.144HDL-C (mg/dL) 1.2 ± 7.1 0.467 -0.4 ± 9.7 0.432 0.279TG (mg/dL) -12.8 ± 45.2 0.394 17.7 ± 81.5 0.523 0.209eGFR (mL/min/1.73 m2) -2.0 ± 11.6 0.543 -3.7 ± 11.1 0.129 0.338Urine albumin excretion (mg/gCre) 29.1 ± 90.9 0.068 -32.2 ± 69.8 0.036 0.006Log urine albumin excretion (mg/gCre) 0.2 ± 0.4 0.078 -0.2 ± 0.4 0.048 0.008Data are mean ± standard deviation, or n (%). * p-value for the intragroup comparison (baseline vs 24 weeks), by Wilcoxon signed rank test. ** p-value for the intergroup comparison (difference in changes from baseline between alogliptin and vildagliptin), by Mann-Whitney U test. Abbreviations as in Table 1.

185Alogliptin vs vildagliptin
Discussion
The present study was conducted to compare the efficacies of two DPP-4 inhibitors; alogliptin and vildagliptin. We considered that the use/lack of use of DPP-4 inhibitors at the start of the study could affect the subsequent changes in HbA1c levels; thus, we designed Study 1 to assign DPP-4 inhibitor-naive patients to additionally receive alogliptin or vilda-gliptin and Study 2 to assign patients to switch from sitagliptin 50 mg to alogliptin or vildagliptin.
Study 1 showed that the addition of alogliptin to the treatment resulted in a significant decrease in HbA1c
level at 24 weeks of 0.5% whereas the addition of vildagliptin decrease it by 0.7%. Statistical compar-isons of these changes indicated that the two DPP-4 inhibitors have comparable effect on glycemic control when added to the treatment. Furthermore, Study 2 also showed that switching from sitagliptin to either alogliptin or vildagliptin had the same effect on HbA1c levels at 24 weeks. Comparison of the hypoglycemic effects of vildagliptin 50 mg twice daily and sitagliptin 50 mg once daily showed a lower mean 24-hour blood glucose level determined by continuous glucose moni-toring by vildagliptin [15]. However, our results were not based on continuous glucose monitoring, and the
Fig. 4 Comparison of the effects of the two DPP-4 inhibitors on changes in urinary albumin excretion at 24 weeks (a) Results of Study 1. (b) Results of Study 2. ** p<0.01, by Mann-Whitney U test. Group data are shown in dot plots.
The Open dots show alogliptin group, and the closed dots show vildagliptin group, respectively. Error bars represent one standard deviation.
Table 3 Study 2 (Switching group): Patients’ characteristics at baseline and 24 weeksAlogliptin Vildagliptin
p **Change from baseline to 24 weeks p * Change from baseline
to 24 weeks p *
Body weight (kg) 0.4 ± 2.1 0.316 0.3 ± 1.5 0.029 0.369Systolic blood pressure (mmHg) 0.5 ± 14.7 0.584 -2.2 ± 16.6 0.531 0.303FPG (mg/dL) 7.5 ± 25.4 0.018 3.0 ± 22.0 0.322 0.375HbA1c (%) 0.2 ± 0.7 0.007 0.0 ± 0.6 0.188 0.003GA (%) 0.0 ± 2.1 0.187 -0.1 ± 2.6 0.232 0.8011, 5- AG (μg/mL) -1.7 ± 5.3 0.016 -1.4 ± 3.3 0.004 0.767FPI (μg/mL) 0.6 ± 3.8 0.160 0.0 ± 2.4 0.613 0.171HOMA-IR 0.4 ± 2.0 0.110 0.1 ± 0.9 0.721 0.155HOMA-β (%) -3.7 ± 18.1 0.253 -0.7 ± 14.4 0.627 0.559TC (mg/dL) 4.5 ± 24.6 0.284 2.8 ± 19.9 0.246 0.807LDL-C (mg/dL) 4.5 ± 22.0 0.070 2.0 ± 16.4 0.237 0.422HDL-C (mg/dL) 2.2 ± 6.9 0.056 2.5 ± 7.7 0.015 0.514TG (mg/dL) 3.5 ± 57.9 0.930 -4.0 ± 39.5 0.738 0.652eGFR (mL/min/1.73 m2) 0.4 ± 6.6 0.603 0.9 ± 7.9 0.340 0.479Urine albumin excretion (mg/gCre) 6.0 ± 55.4 0.070 62.1 ± 279.4 0.012 0.673Log urine albumin excretion (mg/gCre) 0.0 ± 0.3 0.317 0.1 ± 0.3 0.015 0.302Data are mean ± standard deviation, or n (%). * p-value for the intragroup comparison (baseline vs 24 weeks), by Wilcoxon signed rank test. ** p-value for the intergroup comparison (difference in changes from baseline between alogliptin and vildagliptin), by Mann-Whitney U test. Abbreviations as in Table 1.

186 Tanaka et al.
effect on HbA1c level was largely comparable between sitagliptin, alogliptin, and vildagliptin. Although the reason for this remains unknown, we speculate that the hypoglycemic actions of vildagliptin and sita-gliptin are comparable, at least based on long-term markers. It should be noted that switching from sita-gliptin to vildagliptin resulted in a better improve-ment in HbA1c level compared with switching to alo-gliptin. The rate of inhibition of DPP-4 activity after 24 hr therapy was reported to be 80% or higher for both vildagliptin and alogliptin [16, 17]. With respect to the difference between alogliptin and vildagliptin, vildagliptin has a shorter half-life (1.8 hours) than alogliptin (17.1 hours). However, vildagliptin binds covalently to DPP-4, eliciting prolonged enzyme inhi-bition, whereas alogliptin forms a noncovalent bond. These observations led us to speculate that this differ-ence in binding mode might have contributed to the greater reduction in HbA1c level in patients treated with vildagliptin than in those treated with alogliptin in study 2.
In study 2, 1, 5-AG decreased significantly in both groups. Since both HbA1c and fasting plasma glu-cose (FPG) levels were higher at 24 weeks than at baseline in the switch-to-alogliptin group, we assume that 1, 5-AG level was decreased due to poor blood glucose control. On the other hand, HbA1c and FPG levels remained unchanged in the switch-to-vilda-gliptin group. However, since body weight increased significantly, we assume that the patients might have not adhered to diet therapy and developed postpran-dial hyperglycemia, which led to the decreased 1, 5-AG levels.
Similar to previous reports, the present study also showed that HbA1c level at 24 weeks was lower in patients with a higher HbA1c level at baseline. According to a meta-analysis on DPP-4 inhibitors, the reported change in HbA1c level from the baseline was −0.88% (baseline HbA1c level: 8.06%) for vildagliptin 50 mg twice daily, −0.76% (baseline HbA1c level: 8.14%) for alogliptin 25 mg once daily, and −0.79% (baseline HbA1c level: 8.05%) for sitagliptin 100 mg once daily [18]. Compared with the changes obtained in the meta-analysis, those obtained in our study were lower. The reason for this was assumed to be the low baseline HbA1c levels in our study that resulted in lower change in HbA1c level, because the change in HbA1c level correlated negatively with baseline HbA1c levels.
With regard to the changes in urinary albumin excre-tion, only the addition of vildagliptin, but not alogliptin, resulted in a significant improvement at 24 weeks in Study 1, and vildagliptin was more effective in patients with a higher baseline urinary albumin excretion. These results suggests that vildagliptin might be use-ful for the treatment of DPP-4 inhibitor-naive patients with a preexisting high urinary albumin excretion. In streptozotocin-induced diabetic rats, vildagliptin was reported to increase glucagon-like peptide (GLP-1) levels, inhibit overexpression of transforming growth factor-β, and decrease 8-oxo-2′-deoxyguanosine lev-els, resulting in a significant reduction in albuminuria and proteinuria without changes in blood glucose lev-els [19]. The results of our study also indicated that vildagliptin may have reduced albuminuria and pro-teinuria by preventing oxidative stress and apoptosis in the kidneys through the activation of GLP-1 receptors.
On the other hand, although the effects of both drugs on urinary albumin excretion after switch-ing from sitagliptin were comparable, unlike in Study 1, urinary albumin excretion worsened in the switch-to-vildagliptin group. With regard to the effect of vildagliptin on urinary albumin excretion, the result of Study 2 was different from that of Study 1. Diabetic nephropathy might have progressed in Study 2 since patients of the switch-to-vildagliptin group with poor urinary albumin excretion had ele-vated blood pressure at 24 weeks. Other possible rea-sons for the difference in the results of Study 1 and Study 2 include a small sample size; short follow-up period; and the data used for Study 2 were those of switching from sitagliptin to vildagliptin, in which we have reported that sitagliptin was effective in reduc-ing microalbuminuria [20]. Based on the above com-parison, we think that our results indicate that urinary albumin excretion improved only in DPP-4 inhibi-tor-naive patients treated with vildagliptin at 100 mg daily. Another meta-analysis study showed that DPP-4 inhibitors substantially reduced TC and TG levels [21]. According to the results of Study 1, lipid metab-olism was not improved by either drug, and no signifi-cant difference was observed between the two drugs. This might be attributed to the significant body weight gain in both the vildagliptin- and alogliptin-addition groups in Study 1, suggesting that patients of both groups had failed to comply with diet therapy. In Study 2, although significant increases in HDL-C lev-els were observed in the switch-to-vildagliptin group,

187Alogliptin vs vildagliptin
no significant difference was observed between the two drugs, and were thus considered comparable.
Our study has several limitations. The first limita-tion is the small sample size in Study 1. The numbers of patients that could be enrolled in studies 1 and 2 were different. This was mainly due to the clinical fact that only a small number of patients with type 2 diabe-tes are not treated with dipeptidyl peptidase 4 (DPP-4) inhibitors while most patients are treated with sita-gliptin 50 mg. The second is the short follow-up period of 24 weeks. Third, although treatment with DPP-4 inhibitors is reportedly less likely to result in body weight gain, body weight significantly increased dur-ing the study period, except in the switch-to-alogliptin group in Study 2. This body weight gain was prob-ably due to the fact that the time of assessment at 24 weeks happened to occur in winter, when body weight is more likely to increase, because many patients had been enrolled in this study during the summer. We consider it undeniable that this might have affected the results of this study in no small measure.
In the DPP-4 inhibitor-naive patients, although the effects of the addition of alogliptin 25 mg once daily and vildagliptin 50 mg twice daily on reducing HbA1c level were comparable, vildagliptin seemed to better improve urinary albumin excretion and exert greater protective effect on the kidneys. In the patients who were switched from sitagliptin 50 mg once daily, although the effects of sitagliptin, alo-gliptin, and vildagliptin on HbA1c level were compa-rable, vildagliptin 50 mg twice daily was more effec-tive in reducing HbA1c level than alogliptin 25 mg once daily.
Acknowledgments
All authors received no specific financial support for this article.
Disclosure
All other authors declare no conflict of interest.
Supplementaly Table 1 Correlation coefficients between the change in HbA1c at 24 weeks and baseline characteristics of patients or the change in markers at 24 weeks in alogliptin and vildagliptin
Alogliptin Vildagliptin Study 1 Study 2 Study 1 Study 2
r p-value r p-value r p-value r p-valueAge 0.237 0.255 -0.191 0.135 0.098 0.655 0.090 0.467Duration of diabetes 0.150 0.494 0.071 0.586 -0.023 0.919 -0.034 0.787Body weight at baseline 0.150 0.494 0.237 0.060 0.137 0.533 0.103 0.404Change in body weight 0.190 0.397 0.098 0.459 -0.170 0.499 0.297 0.016Systolic blood pressure at baseline 0.133 0.536 0.086 0.501 0.022 0.921 0.130 0.292Change in systolic blood pressure 0.221 0.298 0.058 0.648 -0.265 0.533 -0.050 0.687FPG at baseline -0.437 0.033 0.139 0.275 -0.128 0.561 0.024 0.846Change in FPG 0.628 0.002 0.377 0.004 0.613 0.005 0.452 <0.001HbA1c at baseline -0.584 0.002 -0.119 0.348 -0.592 0.003 0.097 -0.203GA at baseline -0.450 0.024 0.209 0.101 -0.353 0.099 0.062 0.616Change in GA 0.613 0.009 0.462 0.001 0.679 0.004 0.799 <0.0011, 5- AG at baseline 0.510 0.009 -0.070 0.585 0.395 0.062 0.117 0.341Change in 1, 5- AG 0.047 0.859 -0.564 <0.001 -0.314 0.236 -0.575 <0.001FPI at baseline -0.185 0.409 0.087 0.502 -0.325 0.131 -0.014 0.908Change in FPI -0.310 0.909 0.128 0.425 -0.325 0.131 -0.311 0.020HOMA-IR at baseline -0.273 0.219 0.105 0.420 0.126 0.597 -0.008 0.951Change in HOMA-IR 0.333 0.291 0.294 0.062 0.419 0.106 -0.071 0.604HOMA-β at baseline -0.154 0.633 -0.007 0.959 -0.136 0.536 -0.011 0.930Change in HOMA-β 0.226 0.325 0.046 0.774 -0.125 0.621 -0.521 <0.001eGFR at baseline -0.034 0.877 0.181 0.151 -0.193 0.378 -0.012 0.924Change in eGFR -0.017 0.939 -0.033 0.797 0.250 0.250 0.019 0.879Log urine albumin excretion at baseline 0.211 0.323 0.036 0.778 -0.304 0.181 0.040 0.762Change in log urine albumin excretion 0.422 0.045 0.040 0.762 -0.028 0.907 0.070 0.581Data are results of Spearman’s rank correlation for variables at 24 weeks. Abbreviations as in Table 1.

188 Tanaka et al.
1. Nauck MA (2011) Incretin-based therapies for type 2 diabetes mellitus: properties, functions, and clinical implications. Am J Med 124 (1 Suppl): S3-18.
2. Nauck M, Stöckmann F, Ebert R, Creutzfeldt W (1986) Reduced incretin effect in type 2 (non-insulin-depen-dent) diabetes. Diabetologia 29: 46-52.
3. Creutzfeldt W (2001) The entero-insular axis in type 2 diabetes--incretins as therapeutic agents. Exp Clin Endocrinol Diabetes 109 Suppl 2: S288-303.
4. Drucker DJ, Sherman SI, Gorelick FS, Bergenstal RM, Sherwin RS, et al. (2010) Incretin-based therapies for the treatment of type 2 diabetes: evaluation of the risks and benefits. Diabetes Care 33: 428-433.
5. Fukushima M, Suzuki H, Seino Y (2004) Insulin secre-tion capacity in the development from normal glucose tolerance to type 2 diabetes. Diabetes Res Clin Pract 66 Suppl 1: S37-43.
6. Kim YG, Hahn S, Oh TJ, Kwak SH, Park KS, et al. (2013) Differences in the glucose-lowering efficacy of dipeptidyl peptidase-4 inhibitors between Asians and non-Asians: a systematic review and meta-analysis. Diabetologia 56: 696-708.
7. Holst JJ, Deacon CF, Vilsbøll T, Krarup T, Madsbad S (2008) Glucagon-like peptide-1, glucose homeostasis and diabetes. Trends Mol Med 14: 161-168.
8. Baetta R, Corsini A (2011) Pharmacology of dipepti-dyl peptidase-4 inhibitors: similarities and differences. Drugs 71: 1441-1467.
9. Committee on Proper Use of Incretins (GLP-1 Receptor Agonists and DPP-4 Inhibitors) (Last accessed, 30 Sep 2016) [http://www.jds.or.jp/modules/important/index.php?page= article&storyid=7] (In Japanese).
10. Committee of the Japan Diabetes Society on the Diagnostic Criteria of Diabetes Mellitus, Seino Y, Nanjo K, Tajima N, Kadowaki T, et al. (2010) Report of the Committee on the Classification and Diagnostic Criteria of Diabetes Mellitus. J Diabetes Investig 1: 212-228.
11. Friedewald WT, Levy RI, Fredrickson DS (1972) Estimation of the concentration of low-density lipopro-tein cholesterol in plasma, without use of the prepara-tive ultracentrifuge. Clin Chem 18: 499-502.
12. Matsuo S, Imai E, Horio M, Yasuda Y, Tomita K, et al. (2009) Revised equations for estimated GFR from serum creatinine in Japan. Am J Kidney Dis 53: 982-992.
References
Supplementaly Table 2 Correlation coefficients between the change in log urinary albumin excretion at 24 weeks and baseline characteristics of patients or the change in markers at 24 weeks in alogliptin and vildagliptin
Alogliptin VildagliptinStudy 1 Study 2 Study 1 Study 2
r p-value r p-value r p-value r p-valueAge 0.323 0.133 -0.032 0.807 -0.173 0.465 -0.141 0.264Duration of diabetes -0.074 0.749 0.034 0.801 -0.411 0.072 0.161 0.207Body weight at baseline -0.255 0.253 -0.104 0.428 -0.002 0.992 0.051 0.689Change in body weight 0.163 0.494 0.308 0.022 -0.240 0.336 0.209 0.104Systolic blood pressure at baseline 0.118 0.600 -0.034 0.798 -0.236 0.317 -0.099 0.433Change in systolic blood pressure -0.022 0.924 0.135 0.303 -0.068 0.776 0.349 0.004FPG at baseline -0.082 0.711 -0.059 0.657 -0.006 0.980 0.215 0.085Change in FPG 0.413 0.063 0.162 0.248 0.270 0.295 0.086 0.509HbA1c at baseline -0.336 0.117 0.032 0.811 -0.087 0.717 0.300 0.015Change in HbA1c 0.422 0.045 0.040 0.762 -0.028 0.907 0.070 0.581GA at baseline -0.116 0.597 -0.073 0.581 -0.254 0.279 0.157 0.212Change in GA -0.062 0.820 0.193 0.216 -0.116 0.680 0.116 0.4041, 5- AG at baseline 0.151 0.491 0.014 0.919 0.005 0.985 -0.160 0.202Change in 1, 5- AG 0.156 0.564 -0.088 0.576 -0.436 0.104 -0.086 0.535FPI at baseline 0.291 0.201 -0.048 0.720 0.085 0.722 0.053 0.672Change in FPI 0.044 0.871 0.040 0.805 0.067 0.786 -0.035 0.795HOMA-IR at baseline 0.214 0.351 -0.069 0.606 0.009 0.970 0.108 0.390Change in HOMA-IR -0.042 0.897 0.095 0.560 0.132 0.639 0.010 0.943HOMA-β at baseline 0.366 0.103 -0.083 0.535 0.308 0.186 -0.053 0.680Change in HOMA-β -0.126 0.681 -0.042 0.799 -0.417 0.096 -0.179 0.186eGFR at baseline -0.094 0.670 0.126 0.449 0.086 0.719 0.032 0.803Change in eGFR 0.556 0.007 0.852 0.312 0.086 0.719 -0.078 0.535Log urine albumin excretion at baseline 0.126 0.567 -0.113 0.390 -0.680 <0.001 -0.078 0.535Data are results of Spearman’s rank correlation for variables at 24 weeks. Abbreviations as in Table 1.

189Alogliptin vs vildagliptin
13. Seino Y, Fujita T, Hiroi S, Hirayama M, Kaku K (2011) Efficacy and safety of alogliptin in Japanese patients with type 2 diabetes mellitus: a randomized, double-blind, dose-ranging comparison with placebo, followed by a long-term extension study. Curr Med Res Opin 27: 1781-1792.
14. Kikuchi M, Abe N, Kato M, Terao S, Mimori N, et al. (2009) Vildagliptin dose-dependently improves glyce-mic control in Japanese patients with type 2 diabetes mellitus. Diabetes Res Clin Pract 83: 233-240.
15. Sakamoto M, Nishimura R, Irako T, Tsujino D, Ando K, et al. (2012) Comparison of vildagliptin twice daily vs. sitagliptin once daily using continuous glucose monitor-ing (CGM): crossover pilot study (J-VICTORIA study). Cardiovasc Diabetol 11: 92.
16. He YL, Yamaguchi M, Ito H, Terao S, Sekiguchi K (2010) Pharmacokinetics and pharmacodynamics of vildagliptin in Japanese patients with type 2 diabetes. Int J Clin Pharmacol Ther 48: 582-595.
17. Scott LJ (2010) Alogliptin: a review of its use in the management of type 2 diabetes mellitus. Drugs 70: 2051-2072.
18. Esposito K, Chiodini P, Maiorino MI, Capuano A, Cozzolino D, et al. (2015) A nomogram to estimate the HbA1c response to different DPP-4 inhibitors in type 2 diabetes: a systematic review and meta-analysis of 98 trials with 24163 patients. BMJ Open 5: e005892.
19. Liu WJ, Xie SH, Liu YN, Kim W, Jin HY, et al. (2012) Dipeptidyl peptidase IV inhibitor attenuates kid-ney injury in streptozotocin-induced diabetic rats. J Pharmacol Exp Ther 340: 248-255.
20. Mori H, Okada Y, Arao T, Tanaka Y (2014) Sitagliptin improves albuminuria in patients with type 2 diabetes mellitus. J Diabetes Investig 5: 313-319.
21. Monami M, Lamanna C, Desideri CM, Mannucci E (2012) DPP-4 inhibitors and lipids: systematic review and meta-analysis. Adv Ther 29: 14-25.