comparative analysis of state health plans - nc … of trustees meeting documents/bot...comparative...
TRANSCRIPT

Comparative Analysis of State Health Plans
Board of Trustees Meeting
November 21, 2014

Presentation Overview • Executive Summary • Selected States for Comparison
• Original List • Value Based State Comparison
• Comparative Analysis Methodology • Comparative Analysis
• Comparator States • States Incorporating Value Based and other Innovative Strategies • Emerging Conclusions
2

Executive Summary Purpose As part of the Strategic Planning process, the Strategic Planning Workgroup and Board of Trustees requested an environmental scan of state health plans in other states to compare the North Carolina State Health Plan
• This has been updated to provide guidance to the 2016 Benefit planning process
Approach The Plan investigated the following factors:
• Plan richness (analysis by Segal) • Premium cost sharing (analysis by Segal) • Healthy lifestyle benefits • Number of coverage choices
Key Findings (related to other state health plans) • Comparatively, the Plan provides employees/retirees generous and affordable health
benefits. However, coverage for dependents does not compare favorably • Healthy lifestyle benefits continue to expand in states with many providing detail on how
these plans will grow each year • States are requiring more participation to receive credits
• States are incorporating Value Based Insurance Design (VBID) -like components into their designs. SHP is near the top of the curve
• Low premium increases across the country
3

Methods to Address the Triple Aim & the Cost of Health Benefits
4
Benefit Offerings & Programs (PPOs, CDHPs, HRA/HSA, HMOs, Wellness Initiatives, Case and Disease Management,
Contribution Strategy)
Provider Network (Limited Networks, Tiered Networks,
Quality/Cost Designations)
Provider Payment Methods (Enhanced FFS, Bundled Payments,
ACOs, PCMH, P4P)
Program Administration & Contracting (Outsourcing vs. Self Administered, Self-
Funded/Insured vs. Fully Insured, Single vs. Multiple TPA/Carriers, Statewide vs. Regionalized
Approach)
Today’s discussion
highlights how different states and employers
utilize these levers to provide health coverage
to their membership
Several comparator states also utilize these
tools to provide choice,
access, and lower
premiums

Value Proposition to Members and Points of Comparison
5
Benefit Offerings & Programs (PPOs, CDHPs, HRA/HSA, HMOs, Wellness Initiatives, Case and Disease Management,
Contribution Strategy)
Plan Richness Deductibles, copay levels, coinsurance amounts
How rich is the coverage?
Premium Sharing Employer subsidy and member contribution
Is the coverage affordable?
Healthy Lifestyle Benefits Smoking cessation, HRAs, BMI, etc.
Can my behavior impact my costs?
Choice Number of plan options with varying degrees of
richness and/or premium rates
Do I have options in electing coverage?
The Value Proposition

Selected Comparator States Comparator States (lowest and highest premium offerings)
Based on proximity to NC • Georgia • Kentucky • Tennessee • South Carolina • Virginia
Based on size of state population and other factors • Arizona • Maryland • Michigan • Ohio • Wisconsin
States with Value Based Initiatives
• Connecticut • Kentucky • Minnesota • Oregon • Tennessee • West Virginia
6

Comparing Health Benefits – Plan Richness How much does the average person pay out-of-pocket when they utilize their benefit? • Comparing the actuarial value, or plan value, of each state’s offerings
provides a method to understand the average portion of claims costs a benefit design would pay for: • deductible, • coinsurance, • out-of-pocket maximums, • copays, and • out-of-network benefits (some states offer closed network plans)
• As many individuals make their benefit design election based on premium cost, we looked at the highest and lowest premium offerings available in the comparison states and benchmarked them against the 80/20 plan
• For NC the CDHP and 70/30 plans were included in the analysis • No set methodology for incorporating value-based designs
7

-
0.2000
0.4000
0.6000
0.8000
1.0000
1.2000
1.4000
GA SC GA NC VA NC KY WI GA TN KY SC MI NC KY VA TN MI OH MD MD AZ AZ WI WI
Relative Value of Plan Designs
Relative Plan Richness
8
• The relative value of NC’s options is increasing as some States scale back or offer less rich options/plan designs. The relative value of the CDHP has improved most significantly compared to the previous analysis.
• Although the CDHP offers a relatively rich benefit, approximately 97% of Plan members are enrolled in the 70/30 or 80/20.
Are the 70/30 and 80/20 plans too similar? Should members be offered more significant choice?
Segal Company – Nov 2014
CDHP 80/20
70/30

Financing Health Benefits • Each state government finances health coverage for their
membership differently • Most states provide direct subsidies for dependent coverage
• Fixed subsidy by tier or dependent • Percentage of premium
• Some states have collective bargaining that impacts decision making
• NC’s contribution strategy differs from most other states • Significant subsidies for employee and retiree only coverage • Employees and retirees pay full premium cost for dependents, but the
State’s contribution does provide an indirect subsidy • Changes to the State’s contribution approach could impact expected Plan
costs and the long-term sustainability of the Plan • Positively or negatively
9

Comparing Health Benefits – Premium Sharing How can employer subsidies and member premiums be incorporated? • In addition to determining the value of the plan design, which represents
the out-of-pocket exposure, the analysis included the individual’s premium share to reflect average person’s total cost exposure • The percentage of premium paid by each state for each plan combined
with relative plan value determines the Overall Relative Benefit Value of the benefit offering
Caveat: • Plan values are proxies for the anticipated average portion of claims cost
covered by the benefit; the actual experience of low and high utilizers will vary
10
-
0.2000
0.4000
0.6000
0.8000
1.0000
1.2000
1.4000
GA GA GA TN SC SC MI TN MD KY VA NC MD NC MI VA OH WI AZ KY WI WI KY NC AZ
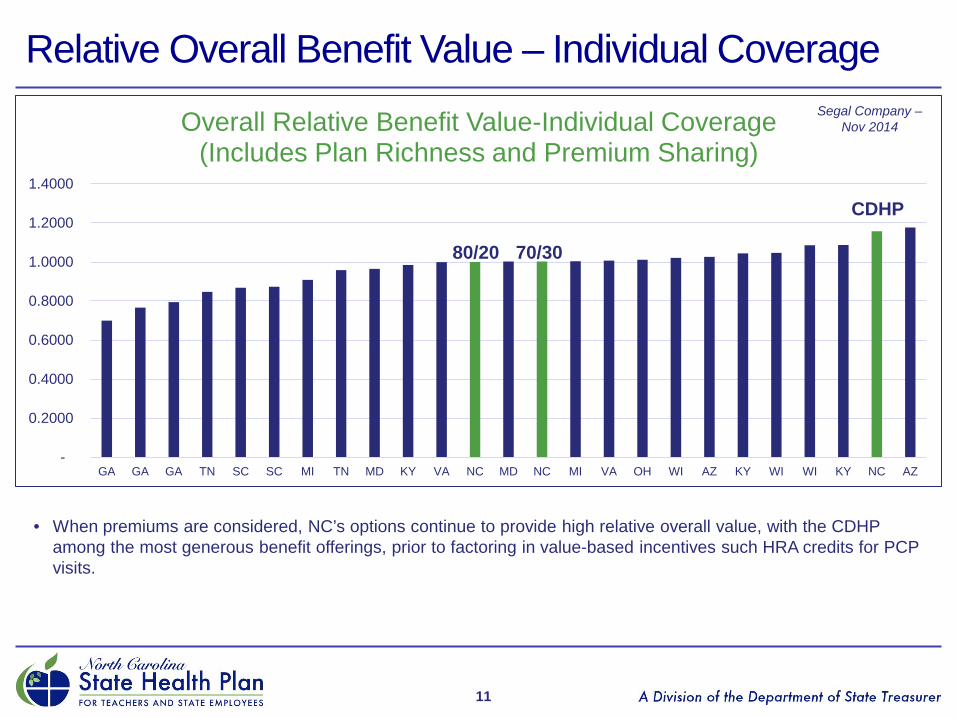
Overall Relative Benefit Value-Individual Coverage (Includes Plan Richness and Premium Sharing)
Relative Overall Benefit Value – Individual Coverage
11
• When premiums are considered, NC’s options continue to provide high relative overall value, with the CDHP among the most generous benefit offerings, prior to factoring in value-based incentives such HRA credits for PCP visits.
Segal Company – Nov 2014
CDHP
80/20 70/30

-
0.5000
1.0000
1.5000
2.0000
2.5000
3.0000
NC NC NC GA KY GA GA SC SC TN KY KY MI TN MD VA AZ OH MI MD VA WI AZ WI WI
Overall Relative Benefit Value - Family Coverage (Includes Plan Richness and Premium Sharing)
Relative Overall Benefit Value – Family Coverage
12
• Historically, NC has not provided direct subsidies for dependent coverage while the median family subsidy of benchmarked states was 83% of total family premium (up from 81%)
• NC contributes between 39% and 47% of the cost of family premiums (through the State’s employer contribution)
Segal Company – Nov 2014
CDHP
80/20
70/30

Trends in Comparative Analysis Coverage Level States ranked less
favorable States ranked more
favorable Individual • Lower employer
subsidy • Higher out-of-pocket
costs • Higher coinsurance
percentage for employees
• Lower deductibles • Use of closed networks • Out-of-pocket maximum
versus coinsurance maximums
• More favorable mail order differential in Rx (2x copay versus 3x copay)
Family • Higher premiums • Less generous
coverage
• Dependent subsidies • Lower deductibles • Use of closed networks • Out-of-pocket maximum
versus coinsurance maximums
• More favorable mail order differential in Rx (2x copay versus 3x copay)
13

Healthy Lifestyle Benefits Comparison
• State health plans continue to incorporate healthy life benefits into their plan design to address the growing cost of health care and to increase member engagement
• 80% of comparator states had at least one healthy living benefit in place; those that do not, do offer multiple TPAs/carriers • Two states (KY and TN) require healthy action steps to enroll in the
most generous benefit offerings • 70% of states utilize Health Assessments (HA) or Well Being
Assessments (WBA) as part of their healthy lifestyle benefit; this is up from last year
• Healthy lifestyle benefits range from $17 to $80 per month • Georgia provides up to $480 in Health Reimbursement Account (HRA)
contributions for completing all healthy action steps
14

Healthy Lifestyle Benefit Grid (Updated Oct 2014)
NC GA SC KY TN VA AZ MD MI OH WI
Smoking Credit
$20 monthly $80 $40
monthly $40
monthly Yes No No No No No No
HA/WBA $10 monthly
Incentive ($) No Yes Yes $17
monthly Yes Yes No $50 No
PCP $10 monthly No No No No No No Yes No No No
Biometric screening No Incentive
($) No Yes Yes $17 monthly Yes No No $75 No
Activities/Coaching No Incentive
($) No Yes Yes No Yes No No $200 No
Enrollment No No No Yes Yes No No No No No No
15

Providing Meaningful Member Choice States take unique approaches to designing their health offerings. Approaches include: • Multiple vendors
• Statewide or regional • 73% of comparator states utilize more than one TPA/carrier in their active
population with many providing different rates based on the TPA/carrier provider network • This is an increase from last year’s analysis
• Number of offerings
• The average state had three offerings for actives, with Georgia having the most with seven and Ohio having the least with one
• Three states reduced their number of plan offerings and two increased their number of plan offerings
• Differentiation in offerings • Members have unique coverage and price sensitivities
16
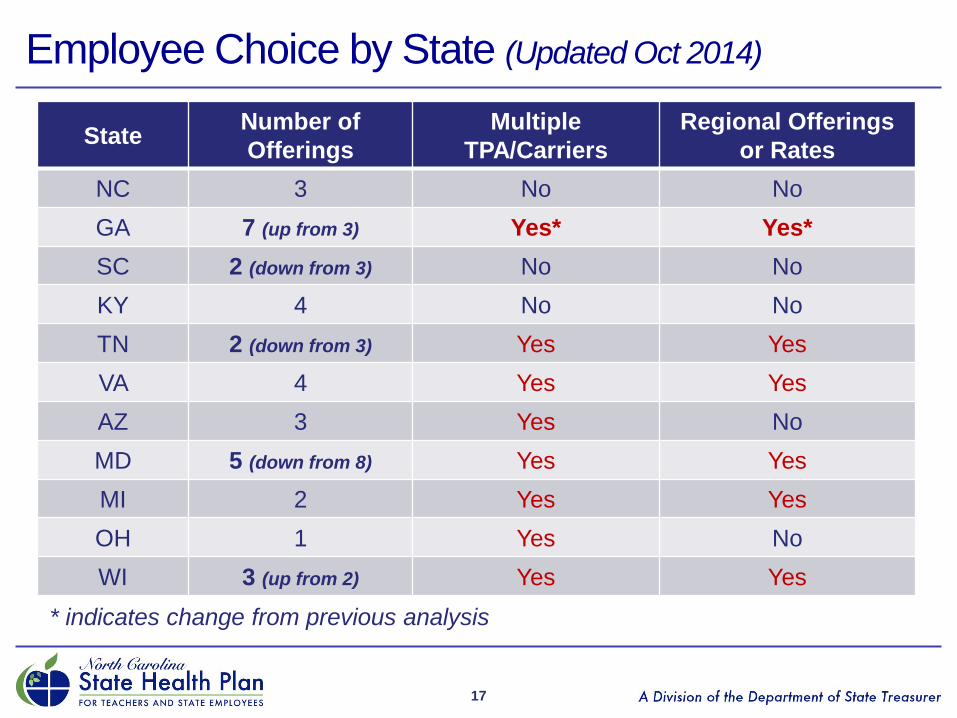
Employee Choice by State (Updated Oct 2014)
17
State Number of Offerings
Multiple TPA/Carriers
Regional Offerings or Rates
NC 3 No No GA 7 (up from 3) Yes* Yes* SC 2 (down from 3) No No KY 4 No No TN 2 (down from 3) Yes Yes VA 4 Yes Yes AZ 3 Yes No MD 5 (down from 8) Yes Yes MI 2 Yes Yes OH 1 Yes No WI 3 (up from 2) Yes Yes
* indicates change from previous analysis

Value-Based Initiatives in State Health Plans • As a follow-up to the Value-Based Insurance Design (VBID)
presentation, staff examined three states that are incorporating different components of VBID into their benefit offerings • There are several ways a plan can incent value • There does not appear to be a consistent model or approach for
implementing value based design
• Value-driven design components include: • Tiered networks and benefits by network • Tying enrollment to participation in programs • Reducing or removing copays • Emphasizing Patient Centered Medical Home (PCMH) • End of life care
18

Value-Based Incentives: Connecticut • Connecticut’s Health Enhancement Program (HEP) allows members the
opportunity to: • Waive deductibles for the year • Reduce monthly premiums • Receive lower/no cost care for select drugs and office visits • $100 payment for complying with all HEP requirements
• Participation Requirements:
• Multi-year stair step approach • All age appropriate screenings and wellness exams • One dental cleaning • If a member has a chronic condition they must participate in education
and counseling programs
19

Value-Based Incentives: Oregon • Oregon’s Health Engagement Model (HEM) and 2015 Open Enrollment
model allow members to: • Save on premiums • Earn gym credits • Reduction in deductible • Utilize PCMH model
• Participation requirements:
• Health Assessment • Completion of two healthy activities:
• Weight Watchers • Gym participation • Team training • MoodHelper • Tobacco Cessation
• PCMH model includes PCP visits that are not subject to deductible or copay; further PCP visits have reduced copays
20

Value-Based Incentives: Minnesota • Fund Health Savings Account for:
• Signing up for HDHP • Biometric screening • Health Assessment (and agreeing to accept a coaching call)
• PCP copay reduction for completing HA in other plan
• Provider groups are broken out by price and cost sharing varies by each tier • Deductible range: $75 to $1,000 • PCP copay range: $18 to $55 • MRI/CT coinsurance range: 5% to 25% • Inpatient copay range: $0 to 25% coinsurance
21

Value-Based Incentives: West Virginia • West Virginia’s employee benefit program has sliding cost sharing and
premiums based on employee salary • In addition to smoker wellness premiums, West Virginia includes a
premium reduction for completing a Living Will and/or Advance Directive Planning • There is no specific answer or response on the living will to earn the
premium reduction, however, members must complete the information
22
Innovative Plan Design Solutions: Tennessee and Kentucky
Tennessee • Offers employees two plan offerings through two TPAs/carriers with
regional rates • To enroll in the lower premium, more comprehensive offering members
must complete Well Being Assessment (WBA) and a biometric screening • In coming years members will have additional action steps in place
Kentucky • Offers employees four plan offerings • To enroll in the two most generous offerings members must complete a
Health Assessment, keep contact information current, and complete healthy activities
• Separate smoker credit for all four plans
23

Emerging Conclusions
• If you’ve seen one state health plan, you’ve seen one state health plan
• SHP benefits are more generous now than in CY2012
• SHP is near the front of the curve in terms of integrating value based components which provide members the opportunity for richer benefits
• Plans are developing programs that give members broad choice in the type of plans they can select
• Plans are looking to incent certain behaviors and members can generate more value within benefit offerings by engaging
• Several states utilize multiple TPA/carriers to offer coverage; this trend is growing in the selected states
24

Emerging Conclusions (continued)
• Based on relatively fixed funding, changing any aspect of a health plan will have a direct impact on other levers
• Increasing benefit richness would increase member premiums • Reducing dependent premiums would increase individual
premiums
• Legislative mandate to reduce premiums limits flexibility around improving all benefits
25

Next Steps/Questions
• Where should the Plan offerings be positioned in 2016? • Where do we have opportunities in the market? • Where should changes be considered to demonstrate different
value proposition to members? • Would changing the vendor arrangement provide the opportunity
for greater flexibility?
26
27
Appendix

Out-of-Pocket Comparison In-network Plan Benefits1
NC GA KY SC TN VA
Deductible • Single • Family
$700 to 1,500
$2,100 to 4,500
$1,300 to 3,500 $2,600 to 6,450
$500 to 1,750
$1,000 to 3,500
$445 to 3,600 $890 to 7,200
$450 to 800
$1,150 to 2,050
$0 to 1,750 $0 to 3,500
Co-insurance 70% to 85% 70% to 85% 70% to 85% 80% to 85% 80% to 90% 80% to $100
Maximum2
• Single • Family • Rx
$3,000 to 3,793 $9,000 to 11,379 Separate/Include
$4,000 to 6,450 $8,000 to 12,900
Include
$2,500 to 3,500 $5,000 to 7,000
Separate/Include
$2,540 to 6,000 $5,080 to 12,000
Included
$2,300 to 2,600 $4,600 to 5,200
Separate
$1,500 to 5,000 $3,000 to 10,000 Separate/Include
Office • PCP • SCP
$30 to ded/coin $70 to ded/coin
$35 to ded/coin $45 to ded/coin
$25 to ded/coin $45 to ded/coin
$12 to ded/coin $12 to ded/coin
$25 to 30 $45 to 50
$25 to ded/coin $40 to ded/coin
Inpatient Surgery
$233, ded/coin to ded/coin
$250 to ded/coin Ded/coin Ded/coin Ded/coin $300 to
ded/coins
Rx • Tier 1 • Tier 2 • Tier 3
$12 to ded/coin $40 to ded/coin $64 to ded/coin
$20 to ded/coin $50 to ded/coin $90 to ded/coin
$10 to ded/coin $35 to ded/coin $55 to ded/coin
$9 to ded/coin
$38 to ded/coin $63 to ded/coin
$5 to 10 $35 to 45 $85 to 95
$15 to ded/coin $25 to ded/coin $40 to ded/coin
28
1. Ded/coin = subject to deductible and coinsurance 2. NC uses coinsurance maximums on two plans, most other plans are out-of-pocket maximums

Out-of-Pocket Comparison (continued) In-network Plan Benefits1
NC AZ MD MI OH WI
Deductible • Single • Family
$700 to 1,500
$2,100 to 4,500
$0 to 1,300
$1,000 to 2,500
$0 $0
$400 $800
$200 $400
$200 to 1,700 $400 to 3,400
Co-insurance 70% to 85% 90% to 100% 90% to100% 90% to 100% 80% 90%
Maximum2
• Single • Family • Rx
$3,000 to 3,793 $9,000 to 11,379 Separate/Include
N/A to $2,000 N/A to $4,000
Include
$1,500 to $2,000 $2,000 to $3,000
Separate
N/A to $2,000 N/A to $4,000
Include
$1,500 $3,000 Include
$800 to 3,500
$1,600 to 7,000 Separate/Include
Office • PCP • SCP
$30 to ded/coin $70 to ded/coin
$15 to ded/coin $15 to ded/coin
$15
$15 to $30
$20 $20
$20 $20
Ded/coin Ded/coin
Inpatient Surgery
$233, ded/coin to ded/coin
$150 to ded/coin $0 to ded/coin $0 to ded/coin Ded/coin Ded/coin
Rx • Tier 1 • Tier 2 • Tier 3
$12 to ded/coin $40 to ded/coin $64 to ded/coin
$10 $20 $40
$10 $15 $25
$10 $30 $60
$10 $25 $50
$5 to ded/coin
$15 to ded/coin $35to ded/coin
29
1. Ded/coin = subject to deductible and coinsurance 2. SHP uses coinsurance maximums on two plans, most other plans are out-of-pocket maximums

Comparative Analysis Methodology Step one • Plan staff and Segal discussed relevant states to use in comparative
analysis • Plan staff compiled benefit design components such as deductibles,
copays, coinsurance for both individual/family coverage and in-network/out-of-network benefits • Premium contributions were also collected
Step two • Segal ran the data inputs through their rate manual to develop expected
costs of the benefit on PMPM basis • A rate manual is a tool that actuaries use to assign PMPMs based on
underwriting guidelines and projected utilization • The expected costs are purely meant to compare benefit design values
only and do not reflect expected utilization changes of different plan designs, geographic factors, age, etc.
30

Comparative Analysis Methodology Step three • The resulting PMPM costs were compared to the 80/20 plan to develop relative
values • Benefit designs with a relative value greater than 1.0 are projected, on
average, to pay for more covered services than the 80/20 plan; conversely plan designs with a relative value less than 1.0 are, on average, projected to pay less for covered services than the 80/20 plan
• Example: Based on benefit design, the State of Arizona’s PPO offering’s relative value is 1.2142, or projected to be 21.142% more rich than the 80/20
Step four • Employer share of premium was multiplied by relative value to create
effective/adjusted relative value • The employer share of premium was calculated; employee share divided by
total premium
• Example: Arizona pays 83.246% of employee only premium; therefore the adjusted relative value is 1.0041 (.83246 x 1.2142) • Values may not equal due to rounding
31

Comparative Analysis Methodology Step five • Adjusted Relative Values were re-normalized to compare each plan’s adjusted
relative value to the Plan’s 80/20 adjusted relative value • Example:
• (Arizona PPO’s Adjusted Value = 1.0041) divided by (80/20 Adjusted Value = 0.9714 (1.00 Relative Value x 97% Premium Share)) • Arizona PPO’s Adjusted Relative Value = 1.0337
32