comparative analysis of greenhouse gas emissions of · pdf file01.07.2016 ·...
TRANSCRIPT
COMPARATIVE ANALYSIS OF GREENHOUSE GAS EMISSIONS OF SITE C versus ALTERNATIVES
July 2016
www.watergovernance.ca www.siteCstatement.org
i

www.watergovernance.ca www.siteCstatement.org
1
TABLE OF CONTENTS
1. Summary ................................................................................................................... 2
2. Regulatory and policy context ................................................................................ 4
3. Presentation of estimations of greenhouse gas emissions ................................ 73.1 Estimations of greenhouse gas emissions from Site C .................................................... 73.2 Estimations of greenhouse gas emissions from Alternative Portfolios ............................ 8
4. Optimizing the resources in the Alternative Portfolio ........................................ 144.1 Replacing MSW generation with SCGTs and wind ........................................................ 144.2 Optimizing the operations of simple-cycle gas turbines (SCGTs) .................................. 144.3 Developing capacity-focused DSM to offset or replace SCGTs .................................... 154.4 Summary ........................................................................................................................ 19
5. Magnitude of the GHG emissions in context ...................................................... 215.1 Magnitude of GHG emissions ........................................................................................ 215.2 BC GHG emission reduction targets .............................................................................. 225.3 Other BC GHG emissions .............................................................................................. 22
6. Additional considerations for comparing GHG emissions ................................ 246.1 Future opportunities for further GHG emission reductions ............................................ 246.2 GHG emission reductions resulting from potential Site C exports ................................. 27
This report was authored by Rick Hendriks (Camerado Energy Consulting), an energy consultant with 20 years experience in assessment and analysis of large-scale hydropower projects. The report was overseen by Dr. Karen Bakker (UBC), and independently reviewed by Dr. Arthur Fredeen (UNBC), Dr. Normand Mousseau (Université de Montreal), and Philip Raphals (Helios Centre, Montreal).

www.watergovernance.ca www.siteCstatement.org
2
1. Summary
What and where is Site C? Site C is a hydroelectric dam on the Peace River currently in the early stages of construction. The site is located in northeastern British Columbia in the Peace Valley near Fort St John. Site C would be downstream from two other dams (including the Bennett Dam, one of the largest earth-filled dams in the world).
What is the key finding of the report? The Site C dam does not deliver energy and capacity at significantly lower greenhouse gas emissions than a fully optimized Alternative Portfolio put forward by BC Hydro (which includes wind energy). The difference in lifecycle GHG emissions, if a difference exists at all, is at most 1% of BC’s current emissions.
Why is this finding significant? Site C has more significant adverse environmental effects than any project ever reviewed under the history of the Canadian Environmental Assessment Act, including impacts on dozens of species, aquatics, vegetation, wildlife, Aboriginal use of lands and resources, and cultural heritage. The federal and provincial governments stated that the unprecedented level of significant adverse environmental effects from Site C are justifiable, in part, because the project delivers energy and capacity at substantially lower GHG emissions than the available alternatives. Our analysis indicates this is not the case.
How does this add to the analysis in the Joint Review Panel report? The Joint Review Panel (JRP) jointly commissioned by the federal and provincial governments did not analyze GHG emissions in detail. The JRP draws conclusions about the relative GHG emission advantages of the Site C Project without additional analysis beyond that provided by BC Hydro. Our analysis reviews the information presented by BC Hydro to the Joint Review Panel and also presents the findings of additional research concerning the GHG emissions of the Site C Project. The JRP noted in its report that its limited mandate and resources precluded analysis of some key issues. This report thus fills an important gap.
How was the analysis conducted? Optimizing the selection and operation of the resources composing the mostly likely Alternative Portfolio proposed by BC Hydro, the analysis indicates that the environmental assessment process for the Site C Project overlooked opportunities to reduce the average GHG emissions of the Alternative Portfolio from 611 to 68 kt CO2e/year (a reduction of more than 0.5 Mt CO2e/year) while maintaining costs. This reduces the average annual GHG emissions reduction benefits achieved by developing the Site C Project, compared to the Alternative Portfolio, to at most 0.1 Mt CO2e/year. This is equivalent to just 0.15% of BC’s current emissions.

www.watergovernance.ca www.siteCstatement.org
3
What about the timing of these emissions? The Site C Project entails the release of at least 4 Mt CO2e emissions before 2035, as a result of construction-related emissions and the fact that reservoir emissions are concentrated in the early years following inundation. It will be several decades before the GHG emissions of an optimized Alternative Portfolio exceed those of the Site C Project, if ever. An optimized Alternative Portfolio has available to it all of the future technological advances that would allow for additional reductions in potential GHG emissions. This opportunity is unavailable to the Site C Project, since once it is constructed and operating, its GHG emissions are certain to occur. Fully optimizing the Alternative Portfolio would allow its emissions to remain below the emissions of the Site C Project indefinitely.
How do these emissions compare to other projects? The recently-approved Woodfibre LNG facility, even with its relatively low emissions intensity per tonne of LNG, is nearly 10 times the maximum annual GHG emission benefits of Site C compared to the optimized Alternative Portfolio. Were the Pacific Northwest LNG export facility to be approved, its annual emissions would be more than 120 times the maximum GHG emissions benefits of Site C, and would also represent over 95% of British Columbia’s 2050 emissions reduction target set out in the Clean Energy Act.
What about exporting energy from Site C to Alberta? It has been suggested that additional GHG emissions reductions would result from exporting surplus Site C energy to Alberta. The purpose of the Site C Project, as proposed by BC Hydro, was to meet British Columbia’s domestic electricity requirements; Site C was not evaluated in an export context. This report questions the potential for exporting Site C energy to Alberta, as the cost of Site C energy is high compared to other renewables such as wind and solar. Our analysis indicates that these other renewables could be much better alternatives for replacing coal, helping Canada achieve its climate change goals more quickly and affordably, and with much lower overall environment impact compared to Site C.
Need for comprehensive review: The findings of our research reinforce the statements of the Joint Review Panel, which indicated that it had insufficient time and resources to conduct a full assessment of the Site C Project. Our analysis also supports the recommendation of the Joint Review Panel for a more thorough review by the BC Utilities Commission prior to any decision to proceed with development at Site C.
www.watergovernance.ca www.siteCstatement.org
4
2. Regulatory and policy context
BC Hydro’s planning environment in terms of greenhouse gas (GHG) emissions is set out in the requirements of the Clean Energy Act, including as follows:
• 2(c) to generate at least 93% of the electricity in British Columbia, other than electricity to serve demand from facilities that liquefy natural gas for export by ship,1 from clean or renewable resources and to build the infrastructure necessary to transmit that electricity;
• 2(f) to ensure the authority's rates remain among the most competitive of rates charged by public utilities in North America;
• 2(h) to encourage the switching from one kind of energy source or use to another that decreases greenhouse gas emissions in British Columbia;
• 2(n) to be a net exporter of electricity from clean or renewable resources with the intention of benefiting all British Columbians and reducing greenhouse gas emissions in regions in which British Columbia trades electricity while protecting the interests of persons who receive or may receive service in British Columbia; and
• 6(2) (b) relying on Burrard Thermal for no energy and no capacity, except as authorized by regulation.
The alternative portfolios developed and assessed by BC Hydro in its 2013 Integrated Resource Plan (IRP) for meeting the requirements for firm energy and dependable capacity all comply with the above requirements, including the requirement that 93% of BC’s electricity come from clean resources. As a result, all of the alternative portfolios produce low levels of GHG emissions.
In its 2013 IRP, BC Hydro reported the detailed GHG emissions related only to fuel combustion during operations of the Site C Project, while excluding emissions related to its construction and reservoir inundation.2 As a result, in the IRP, the utility reported GHG emissions of Site C as “no direct emissions”.3 In its Environmental Impact Statement (EIS) for the Site C Project, BC Hydro prepared a more detailed assessment of the GHG emissions for Site C construction and reservoir operations,4,5 reporting lifecycle emissions of 3.7 to 8.5 Mt CO2e (see Table 1). It also provided emission rates
1 As per British Columbia’s Energy Objectives Regulation (B.C. Reg. 234/2012). 2 BC Hydro. 2013. Integrated Resource Plan [‘IRP’]. Appendix 3A-4: 2013 Resource Options Report Update Resources Options Database (RODAT) Summary Sheets, p.470. 3 Ibid., Appendix 3A-3: 2013 Resource Options Report Update Environmental Attributes Review and Update, p.60. 4 BC Hydro. 2013. Site C Clean Energy Project Environmental Impact Statement [‘EIS’]. Volume 2: Assessment Methodology and Environmental Effects Assessment. Section 15 Greenhouse Gases. 5 Ibid., Volume 2 Appendix S: Site C Clean Energy Project: Greenhouse Gases Technical Report. Prepared for BC Hydro by Stantec Consulting Ltd [‘GHG Report’].
www.watergovernance.ca www.siteCstatement.org
5
for the electricity generation resources used in the alternative portfolios, discussed below.
During the Site C Joint Review Panel (JRP) hearings, minimal attention was paid to the issue of GHG emissions. Over the course of the 25 days of hearings, the JRP dedicated one afternoon session to atmospheric and air quality issues, of which the sub-topic of GHG emissions was one of five sub-topics.6 No evidence concerning GHG emissions was presented to the Panel during the hearings, other than by BC Hydro. The JRP undertook no independent analysis of the findings of BC Hydro, and solicited no additional evidence through undertakings by BC Hydro or other interveners. Yet, the JRP reached the following conclusion in its final report to the Ministers:
[Site C] would produce a vastly smaller burden of greenhouse gases than any alternative save nuclear power, which B.C. has prohibited.7 [emphasis added]
Our analysis, presented below, demonstrates that this finding of the JRP, based as it was on limited evidence was, in fact, unfounded. This uncritical view of the GHG emissions of the Site C Project, as compared to the available alternatives identified by BC Hydro in its 2013 IRP, is shared by many, including the Provincial Minister of Energy and Mines, who recently stated the following:
“The hydroelectric project will deliver the lowest-cost, cleanest power available,” the minister said, although he conceded it would have adverse environmental impacts downstream.8
It is this concession by the Minister that reveals the underlying process used by government to justify approving the Site C Project: the significant environmental effects of the Site C Project, which are unprecedented,9 are justifiable because the project is presumed to deliver energy and capacity at lower costs and lower GHG emissions (i.e. the “cleanest”) compared to the available alternatives.
The chair of the Joint Review Panel, Dr. Harry Swain, has recently stated that, in his view, this justification test has not been satisfied:
The environmental and First Nations land rights issues are serious costs that would have to be borne if the [Site C] project goes ahead. You would only want to do that if there were an overwhelming economic case that this was the best and cheapest way, including all external effects, of providing something that the
6 Site C Clean Energy Project Joint Review Panel. 2013. Revised Public Hearing Schedule – released December 6, 2013. Available at: http://www.ceaa-acee.gc.ca/050/documents/p63919/96899E.pdf. 7 Site C Clean Energy Project Joint Review Panel. 2014. Report of the Joint Review Panel Site C Clean Energy Project BC Hydro [‘JRP Report’], p. iv. 8 “Ottawa pushes ahead with Site C dam amid opposition from academics,” Globe & Mail, May 24, 2016. Available at: http://www.theglobeandmail.com/news/british-columbia/royal-society-of-canada-academics-call-on-ottawa-to-halt-site-c-project/article30127279/ 9 Briefing Note #2 Assessing Alternatives to Site C: Environmental Effects Comparison. Available at: www.siteCstatement.org.

www.watergovernance.ca www.siteCstatement.org
6
provincial economy absolutely required. And I'm saying since you can't pass that test then the rest of it is moot.”10
This is, indeed, a key issue. This report provides independent comparative analysis of GHG emissions in order to inform this debate.
10 Alaska Highway News, « Q&A: Dr. Harry Swain, former Site C panel chair becomes outspoken opponent”, July 8, 2016 (http://www.alaskahighwaynews.ca/regional-news/site-c/q-a-dr-harry-swain-former-site-c-panel-chair-becomes-outspoken-opponent-1.2296875).
www.watergovernance.ca www.siteCstatement.org
7
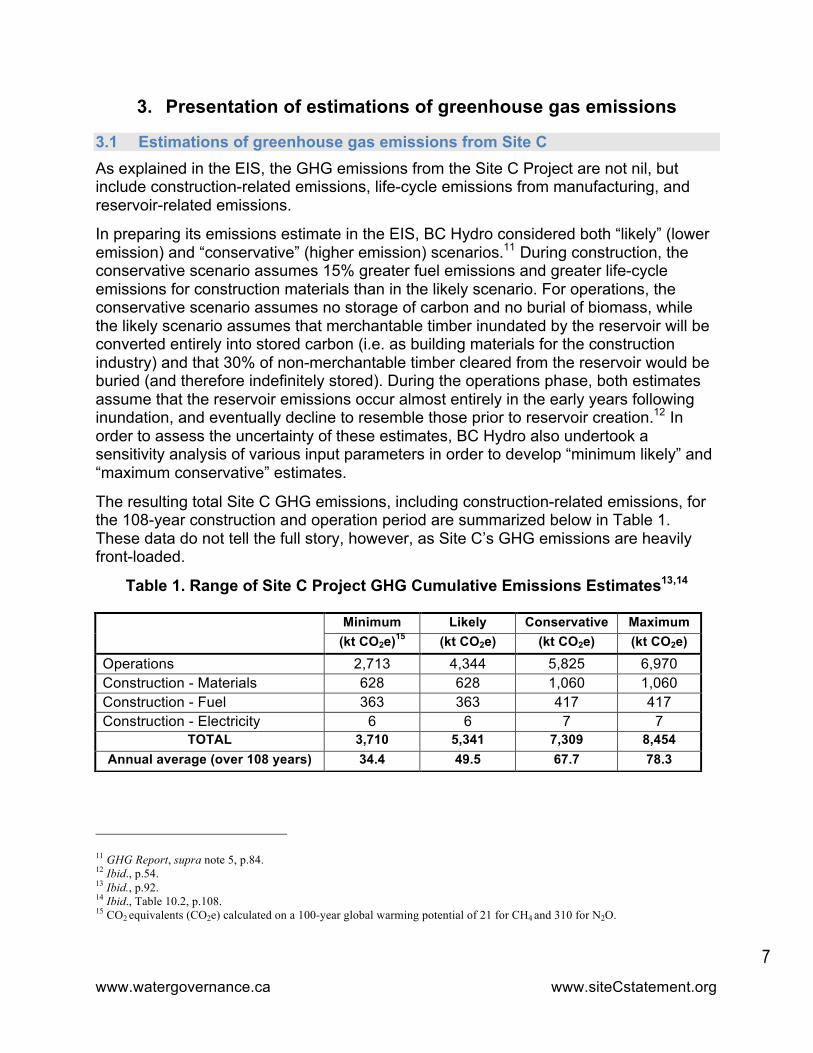
3. Presentation of estimations of greenhouse gas emissions
3.1 Estimations of greenhouse gas emissions from Site C As explained in the EIS, the GHG emissions from the Site C Project are not nil, but include construction-related emissions, life-cycle emissions from manufacturing, and reservoir-related emissions.
In preparing its emissions estimate in the EIS, BC Hydro considered both “likely” (lower emission) and “conservative” (higher emission) scenarios.11 During construction, the conservative scenario assumes 15% greater fuel emissions and greater life-cycle emissions for construction materials than in the likely scenario. For operations, the conservative scenario assumes no storage of carbon and no burial of biomass, while the likely scenario assumes that merchantable timber inundated by the reservoir will be converted entirely into stored carbon (i.e. as building materials for the construction industry) and that 30% of non-merchantable timber cleared from the reservoir would be buried (and therefore indefinitely stored). During the operations phase, both estimates assume that the reservoir emissions occur almost entirely in the early years following inundation, and eventually decline to resemble those prior to reservoir creation.12 In order to assess the uncertainty of these estimates, BC Hydro also undertook a sensitivity analysis of various input parameters in order to develop “minimum likely” and “maximum conservative” estimates.
The resulting total Site C GHG emissions, including construction-related emissions, for the 108-year construction and operation period are summarized below in Table 1. These data do not tell the full story, however, as Site C’s GHG emissions are heavily front-loaded.
Table 1. Range of Site C Project GHG Cumulative Emissions Estimates13,14
11 GHG Report, supra note 5, p.84. 12 Ibid., p.54. 13 Ibid., p.92. 14 Ibid., Table 10.2, p.108. 15 CO2 equivalents (CO2e) calculated on a 100-year global warming potential of 21 for CH4 and 310 for N2O.
Minimum Likely Conservative Maximum (kt CO2e)15 (kt CO2e) (kt CO2e) (kt CO2e)
Operations 2,713 4,344 5,825 6,970 Construction - Materials 628 628 1,060 1,060 Construction - Fuel 363 363 417 417 Construction - Electricity 6 6 7 7
TOTAL 3,710 5,341 7,309 8,454 Annual average (over 108 years) 34.4 49.5 67.7 78.3

www.watergovernance.ca www.siteCstatement.org
8
Figure 1 demonstrates that the Site C Project would produce annual emissions of 500 to 1000 kt/year CO2e during the period 2024-2030 – a critical period for emissions reductions if Canada is to meet its commitments to reduce GHG emissions by 30% below 2005 levels by 2030.16 As demonstrated below in section 4.5, the Alternative Portfolio avoids this emissions spike.
Figure 117
3.2 Estimations of greenhouse gas emissions from Alternative Portfolios In its IRP and in its EIS for the Site C Project, BC Hydro compared three alternative portfolios of resources for meeting the needs for electrical energy and dependable capacity in terms of GHG emissions. These portfolios all make up approximately the same 5,100 GWh of annual energy and 1,100 MW of dependable capacity as the Site C Project, as shown in Table 2.
16 Government of Canada. Undated. Canada’s INDC Submission to the UNFCC. Available at: http://www4.unfccc.int/submissions/indc/Submission%20Pages/submissions.aspx. 17 GHG Report, supra note 5, Table C.4 and Table C.6.

www.watergovernance.ca www.siteCstatement.org
9
Table 2. BC Hydro’s Integrated Resource Plan Portfolios18
The resources included in these portfolios consist of available resources for meeting the needs within regulatory, planning and technical constraints, including the provincial energy objectives in the Clean Energy Act.
• Clean portfolio – wind resources for energy, additional capacity at Revelstoke 6, capacity upgrades at G.M. Shrum, municipal solid waste generation, and pumped storage hydro
• Clean + Thermal #1 – wind resources for energy, Revelstoke 6, municipal solid waste generation, and natural gas generation (6 simple cycle gas turbines (SCGTs))
• Clean + Thermal #2 – wind resources for energy, Revelstoke 6, G.M. Shrum, municipal solid waste generation and natural gas generation (4 SCGTs)
• The Site C Project for an in-service date of F2024The objectives of the Clean Energy Act, discussed in section 4.1, include that BC Hydro’s rates “remain among the most competitive of rates charged by public utilities in North America.”19 As such, the comparative costs of the portfolios are also relevant to the consideration of the justification of environmental effects. The following table illustrates the present value (PV) cost differences determined by BC Hydro in its IRP, for Site C commissioning in F2024.
18 IRP, supra note 2, Chapter 6 Resource Planning Analysis, pp.6-37 to 6-39. 19 Clean Energy Act, SBC 2010, c22, s.2(f).

www.watergovernance.ca www.siteCstatement.org
10
Table 3. Portfolio present value for Site C base case analysis20
Portfolio Type Portfolios without Site C Portfolio PV (M$)
Portfolios with Site C Portfolio PV (M$)
PV Difference (M$) (Portfolio without Site C
minus Portfolio with Site C)
Clean 6,766 6,138 630
Clean + Thermal 6,030 5,883 150
Some observations:
• Developing all clean generation without Site C was found to be about $700 million more expensive than similar portfolios with some thermal generation (i.e. natural gas), as a result of the need to advance costly pumped storage hydro;
• The benefit of Site C compared to the clean + thermal alternative was just $150 million, which represented 1.7% of the estimated cost of Site C of $8.8 billion at the time of sanction.
The Clean + Thermal portfolios therefore provide the most likely alternatives to the Site C Project, while still meeting the requirements of the Clean Energy Act, including with respect to GHG emissions and competitive electricity rates.
The most recent project cost estimate for Site C is a Class 2 cost estimate as defined by AACE International, which means that the expected accuracy range in the estimate is -5% to +5%.21,22 The resources composing the Clean + Thermal portfolios are developed to the feasibility level in the case of capacity upgrades at Revelstoke, the pre-feasibility level for wind, MSW generation and natural gas, and the concept level in the case of capacity upgrades at GM Shrum.23 This is equivalent to a Class 4 cost estimate for the entire portfolio, and therefore has an expected accuracy range of -15% to +20%. In other words, the perceived economic benefit of Site C over the Clean + Thermal Portfolios is less than the margin of error in the Site C cost estimate, and much less than the margin of error in the estimate of the Clean + Thermal Portfolios. This demonstrates the importance of the recommendation by the JRP that the Site C cost estimate be reviewed by the BC Utilities Commission.24
20 IRP, supra note 2, Appendix 6A Portfolio Results, p.6A-36. 21 United States Society on Dams. 2012. Guidelines for Construction Cost Estimating for Dam Engineers and Owners. 22 AACE International. 2016. Cost Estimate Classification System – As Applied in Engineering, Procurement, and Construction for the Process Industries, p.3. 23 IRP, supra note 2, Appendix 3A-4: 2013 Resource Options Report Update Resources Options Database (RODAT) Summary Sheets. 24 JRP Report, supra note 7, p.280.
www.watergovernance.ca www.siteCstatement.org
11
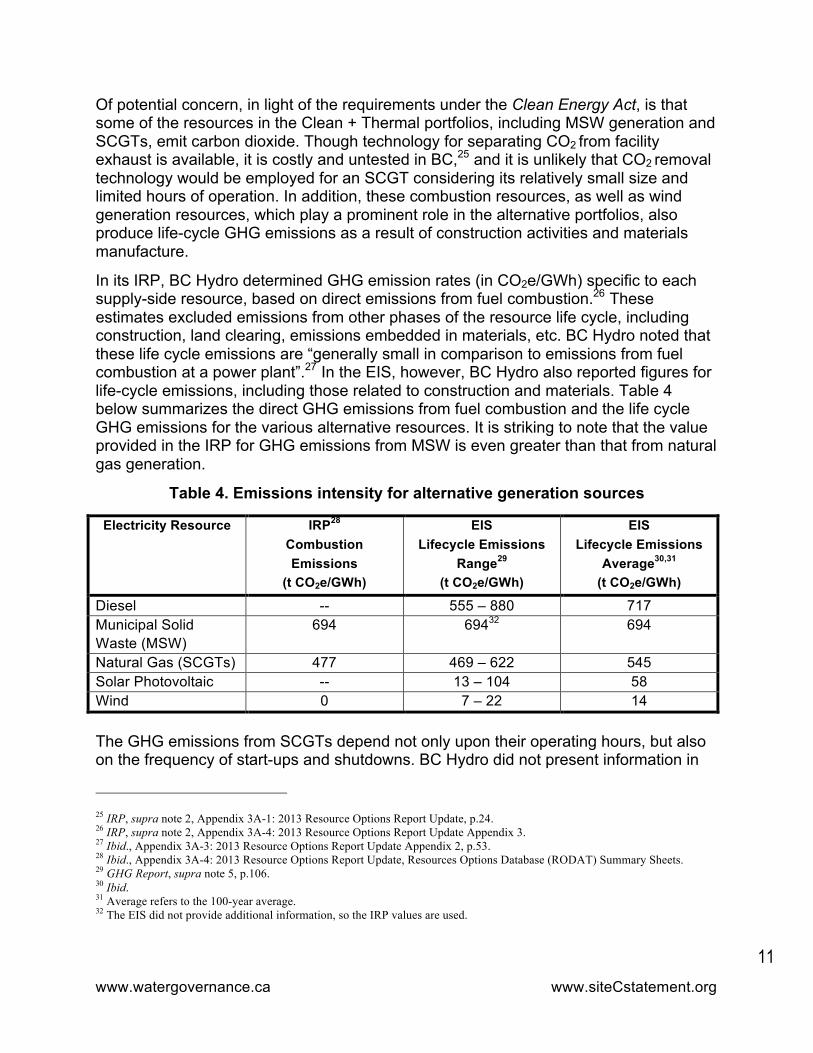
Of potential concern, in light of the requirements under the Clean Energy Act, is that some of the resources in the Clean + Thermal portfolios, including MSW generation and SCGTs, emit carbon dioxide. Though technology for separating CO2 from facility exhaust is available, it is costly and untested in BC,25 and it is unlikely that CO2 removal technology would be employed for an SCGT considering its relatively small size and limited hours of operation. In addition, these combustion resources, as well as wind generation resources, which play a prominent role in the alternative portfolios, also produce life-cycle GHG emissions as a result of construction activities and materials manufacture.
In its IRP, BC Hydro determined GHG emission rates (in CO2e/GWh) specific to each supply-side resource, based on direct emissions from fuel combustion.26 These estimates excluded emissions from other phases of the resource life cycle, including construction, land clearing, emissions embedded in materials, etc. BC Hydro noted that these life cycle emissions are “generally small in comparison to emissions from fuel combustion at a power plant”.27 In the EIS, however, BC Hydro also reported figures for life-cycle emissions, including those related to construction and materials. Table 4 below summarizes the direct GHG emissions from fuel combustion and the life cycle GHG emissions for the various alternative resources. It is striking to note that the value provided in the IRP for GHG emissions from MSW is even greater than that from natural gas generation.
Table 4. Emissions intensity for alternative generation sources
Electricity Resource IRP28 Combustion Emissions
(t CO2e/GWh)
EIS Lifecycle Emissions
Range29 (t CO2e/GWh)
EIS Lifecycle Emissions
Average30,31 (t CO2e/GWh)
Diesel -- 555 – 880 717 Municipal Solid Waste (MSW)
694 69432 694
Natural Gas (SCGTs) 477 469 – 622 545 Solar Photovoltaic -- 13 – 104 58 Wind 0 7 – 22 14 The GHG emissions from SCGTs depend not only upon their operating hours, but also on the frequency of start-ups and shutdowns. BC Hydro did not present information in
25 IRP, supra note 2, Appendix 3A-1: 2013 Resource Options Report Update, p.24. 26 IRP, supra note 2, Appendix 3A-4: 2013 Resource Options Report Update Appendix 3. 27 Ibid., Appendix 3A-3: 2013 Resource Options Report Update Appendix 2, p.53. 28 Ibid., Appendix 3A-4: 2013 Resource Options Report Update, Resources Options Database (RODAT) Summary Sheets. 29 GHG Report, supra note 5, p.106. 30 Ibid. 31 Average refers to the 100-year average. 32 The EIS did not provide additional information, so the IRP values are used.

www.watergovernance.ca www.siteCstatement.org
12
its EIS or its IRP concerning the frequency of start-ups and shutdowns of the SCGTs proposed for the Alternative Portfolio. In a recent submission to the California Energy Commission in relation to the proposed Alamitos Energy Center, the emissions of SCGTs identical to those proposed by BC Hydro33 were determined to be 633 t CO2e /GWh, including start-ups, shutdowns and performance degradation over time.34
This value is higher than the 545 t CO2e /GWh presented by BC Hydro in its EIS and as stated in Table 4 above. This results from the higher frequency of start-ups and shutdowns (500 per year, or 1 per every 4 hours of operations) and different assumptions concerning global warming potential, emission factors, thermal efficiencies, performance degradation and other input variables. For example, presuming that BC Hydro operates the facilities 16-hours per day during the winter cold snaps as proposed, the number of start-ups and shutdowns would be 1 per every 16 hours of operations, far fewer than the 1 per 4 hours of operations used in the analysis of the Alamitos Energy Center.35 This lower frequency of start-up and shutdown cycles lowers the average GHG emissions found in the case of the Alamitos Energy Center from 633 to 593 t CO2e /GWh.
Lacking detailed operational information for the SCGTs proposed in the Alternative Portfolio, and the full slate of assumptions underlying BC Hydro’s determination of the GHG emissions intensity for SCGTs, the analyses in this briefing note utilize the 545 t CO2e/GWh presented by BC Hydro in its EIS. Referral of the Site C Project to the BC Utilities Commission would allow for further exploration of these matters.
Table 5 summarizes the GHG emissions for the “Clean + Thermal #2” portfolio in the 2013 IRP (the “Alternative Portfolio”), based on the emissions intensities in Table 4. As Table 5 illustrates, BC Hydro determined the emissions of the Alternative Portfolio to be 511 kt CO2e/year in its IRP considering only combustion during operations. Considering life-cycle emissions, based on emissions intensities reported in the EIS, this total increases to 611 kt CO2e/year. For context, a typical natural gas combined cycle generating turbine operating to produce 5,100 GWh/year would emit more than four times as much (2,780 kt CO2e/year).
Indeed, the Alternative Portfolio produces much lower emissions than an “all gas” alternative to the Site C Project. Nevertheless emissions still exceed those of the Site C Project by about 500 kt or 0.5 Mt CO2e/year. However, the analyses presented by BC Hydro in the IRP and the EIS did not seek to minimize the GHG emissions in the Alternative Portfolio by optimizing the selection and operation of the available resources. Further optimization is readily available, and the proposed approaches below focus on further lowering the emissions of the Alternative Portfolio without increasing its costs. 33 GE Power LMS100 gas turbines. 34 AES Alamitos Energy , LLC, April 12, 2016. Alamitos Energy Center Supplemental Application for Certification (13-AFC-01) Revised Air Quality, Biological Resources, and Public Health Assessment, Table 5.1B.23. Available at: https://efiling.energy.ca.gov/Lists/DocketLog.aspx?docketnumber=13-AFC-01. 35 Ibid.

www.watergovernance.ca www.siteCstatement.org
13
Table 5. GHG Emissions – Alternative Portfolio
IRP EIS Annual
Generation36 GHG
Combustion Emissions Intensity
GHG Combustion Emissions
GHG Lifecycle
Emissions Intensity
GHG Lifecycle
Emissions
Resources (GWh/year) (t CO2e/GWh) (kt CO2e/year) (t CO2e/GWh) (kt CO2e/year)
GM Shrum37 0 0 0 0 0 Revelstoke 6 26 0 0 0 0 MSW38 312 694 217 694 217 Natural Gas 616 477 294 545 336 Wind39 4148 0 0 14 58 Totals 5102 511 611
36 IRP, supra note 2, Chapter 6 Resource Planning Analysis, Table 6-9, p.6-39. 37 Lifecycle GHG emissions for capacity upgrades at GM Shrum and Revelstoke 6 are unavailable and presumed to be zero for comparison purposes. Eventual turbine replacement at the Site C Project is also presumed to have no GHG emissions. 38 Lifecycle GHG emissions for MSW generation other than in relation to combustion are unavailable and presumed to be zero for comparison purposes. 39 EIS, supra note 4, Volume 2, Section 15: Greenhouse Gases, Table 15.11 Emissions Intensity – Project Compared with other Generation.
www.watergovernance.ca www.siteCstatement.org
14
4. Optimizing the resources in the Alternative Portfolio
4.1 Replacing MSW generation with SCGTs and wind In its analysis, BC Hydro makes use of MSW generation as part of the Alternative Portfolio. MSW generation involves the incineration of municipal solid waste to produce electricity, following pre-processing of waste to remove oversized, non-combustible, hazardous or explosive materials. MSW generation is generally promoted by the province as part of a strategy to manage municipal solid waste in British Columbia.40
Though MSW generation is a “clean” resource in the Clean Energy Act, it actually produces very high GHG emissions (694 t CO2e /GWh), on par with diesel generation (717 t CO2e/GWh). Replacing the MSW generation resource from the Alternative Portfolio with a combination of SCGTs and wind can provide the capacity and energy of MSW generation while producing much lower GHG emissions at comparable cost.41 More specifically, replacing the 37 MW of dependable capacity and 312 GWh/year of firm energy provided by the MSW generation with additional SCGTs and wind in the Alternative Portfolio reduces its GHG emissions by 182 kt CO2e/year. This reduction occurs because the emissions intensity of a combination of wind and natural gas is much lower than the emissions intensity of MSW generation.
4.2 Optimizing the operations of simple-cycle gas turbines (SCGTs) The Clean Energy Act establishes that at least 93% of the electricity in British Columbia must come from clean (i.e. non-greenhouse gas emitting) or renewable resources. Currently, high-GHG resources account for some 6% of BC Hydro’s electricity supply, leaving a “GHG headroom” of around 500 GWh/year available for non-clean resources.42 In its IRP, BC Hydro concluded that the best strategy is to reserve the GHG headroom as a capacity and contingency resource, particularly in the event of rapidly increasing electricity requirements resulting from LNG development.43
In its analysis, BC Hydro assumes that a typical 100 MW SCGT would produce 154 GWh of energy per year, and associated GHG emissions. This implies that SCGTs, which are acquired as capacity resources for peaking purposes, would operate 18% of the time, or 1577 hours per year. This is the equivalent of operating 16 hours a day, 6 days a week, for four months a year. The effect of this assumption is not inconsequential, as the greater the annual hours of operation, the greater the annual emissions. The GHG emissions of SCGTs depend upon both their hours of service and on the frequency of start-ups and shutdowns.
40 BC Energy Mines and Petroleum Resources. Undated. BC Bioenergy Strategy: Growing our Natural Energy Advantage. Available at: http://www2.gov.bc.ca/assets/gov/farming-natural-resources-and-industry/electricity-alternative-energy/bc_bioenergy_strategy.pdf. 41 For a list of resource costs see: IRP, supra note 2, Appendix 6A, p. 6A-27. 42 3500 GWh/year from Fort Nelson, Prince Rupert, McMahon Cogen and the Island Generation Plant. IRP, supra note 2, Chapter 6 Resource Planning Analysis, p.6-10. 43 Ibid., p.6-21.
www.watergovernance.ca www.siteCstatement.org
15
BC Hydro notes that its capacity resources must be available to operate during “a 16-hour block per day for a two week cold snap that can happen at least three times per year anytime during the winter.”44 Typically, cold snaps occur once or twice during the critical winter period between November and February.45 BC Hydro also clarifies that the heavy load hours during a winter peak exclude Sundays and statutory holidays.46
The BC Hydro analysis confuses the hours that the SCGTs need to be available to operate (i.e. the daily peak hours during the critical winter period) with the hours that the SCGTs will be called upon to operate, which will be much fewer.47 If there are three two-week cold snaps (or ~35 heavy load days, excluding Sundays and holidays) during the critical winter period, with the SCGTs operating 16 hours each of those days, they would operate for 560 hours per year, for a capacity factor of 6.4% (about a third of the service hours assumed by BC Hydro). This is consistent with the findings of the U.S. Energy Information Administration, which concluded that the average annual capacity factor, for each of the past 8 years, of all SCGTs in operation in the United States ranged from 4.5% to 6.7%.48 The actual number of hours that BC Hydro would operate any SCGTs during a cold snap would sometimes be less than 16 hours each day, and the average annual number of cold snaps would be fewer than the three assumed in this estimate, based on historical patterns.
In summary, BC Hydro’s assumption of a high capacity factor for SCGTs penalizes the Alternative Portfolio by overstating its annual GHG emissions. Assuming operation of the SCGTs at a 5% capacity factor in a manner consistent with industry practice and with the stated frequency and duration of cold snaps, accounting for the reduced energy production from the SCGTs with additional wind resources, and adding in the life-cycle GHG emissions from these wind resources, would reduce GHG emissions in the Alternative Portfolio by 236 kt CO2e/year.
4.3 Developing capacity-focused DSM to offset or replace SCGTs While most DSM programs do reduce capacity as well as energy requirements, until recently reducing capacity requirements has not been the primary focus in DSM program design. Programs designed specifically to reduce capacity requirements are referred to as “capacity-focused DSM”.
Assumptions made in approving the Site C Project
In the load resource balance presented in its 2013 IRP, BC Hydro identified a need for capacity by F2019, at least five years before a need for energy. In the 2016 load
44 BC Hydro. 2015. BC Hydro 2015 Rate Design Application [‘RDA’], Appendix C-5A, p.96. 45 BC Ministry of Energy and Mines. 2013. U.S. Benefits from the Columbia River Treaty – Past, Present and Future: A Province of British Columbia Perspective, p.14. 46 Ibid., p.46. 47 Raphals, P. Need for, Purpose of and Alternatives to the Site C Hydroelectric Project (CEAR #63919-1952), pp.16-18; Raphals, P. January 18, 2014. Response to BC Hydro Rebuttal Evidence (CEAR #63919-2548), pp.14-18. 48 U.S. EIA. 2016. Electric Power Monthly. Table 6.7.A Capacity Factors for Utility Scale Generators Primarily Using Fossil Fuels. Available at: http://www.eia.gov/electricity/monthly/.

www.watergovernance.ca www.siteCstatement.org
16
resource balance update, the requirement for capacity has shifted to F2020.49 In response to this future need, and recognizing the prioritization of DSM in the Clean Energy Act, BC Hydro identified two types of capacity-focused DSM with substantial potential:50
• Industrial load curtailment: 382 MW of expected capacity savings from large customers who agree to curtail load on short notice to provide BC Hydro with capacity relief during peak periods; and
• Capacity-focused programs: 193 MW in expected capacity savings from programs that leverage equipment (e.g. water heaters, heating, lighting and air conditioning) and load management systems to enable peak load reductions to occur automatically or with intervention through direct load control.
As a result, the potential for capacity-focused DSM savings identified in the IRP total 575 MW – over 50% of the capacity of Site C, and over 140% of the capacity of the SCGTs in the Alternative Portfolio. However, noting the uncertainty in the potential quantity of capacity-focused DSM savings actually achievable, BC Hydro elected to “not yet rely on capacity savings from capacity-focused DSM for resource planning purposes.” Instead, in the face of this short-term uncertainty respecting the contribution of capacity-focused DSM, BC Hydro assumed that for long-term planning purposes these options would make no contribution to the utility’s capacity needs and would deliver 0 MW over the next 20 years.51
The utility recommended further study of capacity-focused DSM as one of the recommendations of the 2013 IRP. As called for in Recommended Action #2, BC Hydro completed a pilot study of automated demand response and direct load control, both effective forms of capacity-focused DSM.52 The study identified a potential of 53 MW of reliable winter capacity reduction in the Kamloops area alone.53 This result exceeded by far the 30 MW target set by BC Hydro for this region, which represents approximately 10% of the Provincial industrial electricity demand – implying a province-wide potential on the order of 500 MW. BC Hydro is continuing with these and other pilot programs.54
49 RDA, supra note 44, Evidentiary Update on Load Resource Balance and Long Run Marginal Cost, p.13. 50 IRP, supra note 2, Chapter 3 Resource Options, p.3-22. In its 2012 Draft IRP, BC Hydro had also proposed a third option, time-of-use (TOU) rates, but it abandoned this approach – at the same time as it launched a province-wide smart-meter program, which for the first time made broad-based TOU rates a realistic option. 51 Raphals, P. 2013. Need for, Purpose of and Alternatives to the Site C Hydroelectric Project (CEAR #63919-1952), pp.19-26; Raphals, P. January 18, 2014. Response to BC Hydro Rebuttal Evidence, (CEAR #63919-2548), pp. 21-24. 52 Enbala Power Networks. Undated. Capacity Focused Demand Side Management at BC Hydro: Industrial and Commercial Potential in the Kamloops Region. 53 The study was based on a 4-hour curtailment period, but BC Hydro also has up to 16-hour requirements to meet shoulder capacity needs. 54 BC Hydro. 2015. Load Management Demonstration Project. Available at: https://www.bchydro.com/powersmart/business/load-management.html; BC Hydro. 2015. Load Curtailment Pilot. Available at: https://www.bchydro.com/powersmart/business/load-curtailment-pilot.html.

www.watergovernance.ca www.siteCstatement.org
17
New information since the approval of the Site C Project
Despite its decision not to include any capacity-focused DSM in its 2013 IRP, BC Hydro stated the following in its recently filed 2015 Rate Design Application (RDA):
In BC Hydro’s view, load curtailment potentially offers a better avenue [than time of use pricing (TOU)] to avoid costly generation capacity resource additions because it is targeted at capacity, is more reliable (particular with aspects of demand control), and in contrast to TOU, load curtailment is dispatchable.
…the 2013 IRP identifies that 400 MW of SCGTs would be required by F2020 if LNG projects proceed. There is an opportunity to reduce the amount of gas-fired generation that might be required through the development of load curtailment.55 [emphasis added]
In other words, BC Hydro now acknowledges the substantial benefits of load curtailment to reduce the 400 MW of SCGTs required in the event that LNG projects proceed, and yet no similar consideration was given in the 2013 IRP to utilizing load curtailment to reduce the 400 MW of SCGTs in the Alternative Portfolio. While the RDA does not yet quantify the magnitude of the capacity reduction resulting from load curtailment, it is clearly anticipated to be more than the 0 MW presumed in the IRP.
If capacity-focused DSM had been given appropriate consideration in the 2013 IRP, it would have contributed to deferring for several years the need for the Site C Project, a very costly capacity resource addition.56 Based on the recent information in the 2016 load resource balance update, over the coming decade each 100 MW of capacity-focused DSM delays the need for new resources by one year in the “Expected LNG” scenario57 and by more than two years in a scenario where LNG does not materialize.58
Experience in neighbouring jurisdictions
In its RDA, BC Hydro also undertook a jurisdictional review of load curtailment programs at winter-peaking Canadian utilities. The review reported that all of these programs were optional, and that most of the programs had maximum curtailment durations of 4 hours.59 No information concerning success of these Canadian programs was provided in the RDA. In addition, no similar review was undertaken for winter-peaking American utilities, many of which have been employing capacity-focused DSM (also known as “demand response”) for many years. According to the US Energy Information
55 RDA, supra note 44, Appendix C-5A, p.107. 56 In the environmental assessment hearings, unrebutted evidence was presented before the JRP to the effect that, as long as the Site C Project’s energy production is surplus to BC’s needs, the unit capacity cost of the project is between $150 and $350/kW-year – far more expensive than other capacity resources, including those listed in IRP, supra note 2, Appendix 6A, p. 6A-27. See Raphals, P. January 18, 2014. Response to BC Hydro Rebuttal Evidence (CEAR #63919-2548), p.9. 57 BC Hydro estimated that future requirements of the LNG industry could range from 800 to 6,600 GWh/year (100 to 800 MW) with an Expected LNG load of 3,000 GWh/year and 360 MW by F2022. 58 RDA, supra note 44, Evidentiary Update on Load Resource Balance and Long Run Marginal Cost, p.13. 59 RDA, supra note 44, Appendix C-5A, p.107.
www.watergovernance.ca www.siteCstatement.org
18
Administration, peak capacity savings (winter and summer) from demand response in the U.S. totalled 12,700 MW in 2014, and these numbers are expected to increase considerably in the coming years.60 In the PJM Interconnection alone, 2,500 MW of winter demand response was called into action during certain critical hours in January 2014.61
Since the approval of the Site C Project in December 2014, the Northwest Power and Conservation Council (NPCC) released its Seventh Northwest Conservation and Electric Power Plan.62 NPCC issues its 20-year plan every five years for the states of the Pacific Northwest. This region consists of both public and investor-owned utilities that collectively comprise an electrical system that is about three times the size of BC Hydro’s integrated system, but is similar in demand profile (winter peaking) and resource mix (substantial hydroelectric resources).
Like BC Hydro, the NPCC assesses demand response primarily for the purpose of reducing peak load and, specifically, for deferring the development of new generation and transmission assets. In relation to winter demand response potential, which is most relevant to BC Hydro, the NPCC identified approximately 3,500 MW of regional winter demand response potential over the 20-year planning period. Nearly 1,500 MW is available at less than $32 per kilowatt of peak capacity per year (kW-year), and an additional 1,200 MW at less than $71 per kW-year.63 This 2,700 MW represents approximately 6% of winter peak load in the Pacific Northwest. Several utilities in the Pacific Northwest are now implementing winter demand response, including PacifiCorp (149 MW), Portland General Electric (28 MW), and the Bonneville Power Administration (60 MW).64
BC Hydro estimated the cost of its capacity-focused DSM programs at $69 per kW-year,65 similar to that determined by the NPCC for the Pacific Northwest. In BC, 6% of winter peak capacity would be equivalent to about 700 MW of demand response potential. This provides further indication that the magnitude of potential demand response savings is much greater than the 0 MW presumed in the IRP.
Integrating capacity-focused DSM in the alternative portfolio
Including the additional capacity from SCGTs used to replace MSW generation noted above in Table 2, the Alternative Portfolio would have 436 MW of SCGTs. Developing about 40% of the 575 MW of potential capacity savings from the capacity-focused DSM measures identified in the IRP would offset half of the SCGT capacity contemplated in 60 U.S. Energy Information Administration. 2016. Today in Energy: Demand response saves electricity during times of high demand. Available at: http://www.eia.gov/todayinenergy/detail.cfm?id=24872. 61 FERC. December 2014. Assessment of Demand Response and Advance Metering (staff report), p.12. Available at: http://www.ferc.gov/legal/staff-reports/2014/demand-response.pdf. 62 Northwest Power and Conservation Council. 2016. Seventh Northwest Conservation and Electric Power Plan. Available at: http://www.nwcouncil.org/energy/powerplan/7/plan/. 63 Ibid., Table 14-2. (values converted to Canadian dollars). 64 Ibid., Table 9-1. 65 IRP, supra note 2, Chapter 3 Resource Options, Table 3-6, p.3-28.

www.watergovernance.ca www.siteCstatement.org
19
the Alternative Portfolio. Developing 80% of the potential capacity savings from these capacity-focused DSM measures (supplemented as required with energy storage, as described below) would offset all of the SCGT capacity in the Alternative Portfolio. With SCGTs operated at a 5% capacity factor, these two levels of capacity-focused DSM would result in net annual GHG emissions from the Alternative Portfolio of 119 kt CO2e/year and 68 kt CO2e/year, respectively (see Table 6).
Though capacity-focused DSM is reliable and dispatchable, relying on it to replace most or all of the contemplated SCGTs raises complex questions best explored through a review before the BC Utilities Commission. First, though BC Hydro’s load curtailment and capacity-focused DSM programs show promise and are anticipated to provide much more than the 0 MW presumed in the IRP, they remain at the pilot phase, with the ultimate effectiveness of the measures to be determined over the next few years. Second, in addition to requiring peak capacity, the BC Hydro system becomes energy constrained in the shoulder hours before and after the peak period on winter days during a cold snap. This means that the capacity resources must at times be available for up to 16-hour periods, which is longer than the 4-hour period typical of load curtailment and capacity-focused DSM programs in other jurisdictions.
These uncertainties may – or may not – limit the extent to which capacity-focused DSM can offset the operation or requirements for SCGTs. If necessary, capacity-focused DSM can also be supplemented with energy storage technologies, which are fast becoming a viable resource in electricity systems across North America. Though costs remain high, they continue to decline rapidly.66 Ontario recently procured 33.5 MW of energy storage and is proceeding with additional procurement to a total of 50 MW.67 Of particular interest in the current context, San Diego Gas & Electric recently contracted for both a 20 MW lithium ion battery energy storage facility and 18.5 MW of DSM capacity savings.68 Considering that the need for SCGTs in the Alternative Portfolio does not arise until F2027, BC Hydro has ten years to benefit from additional declines in the costs of battery and other energy storage, improving the prospects that the Alternative Portfolio could proceed with very limited, if any, use of SCGTs.
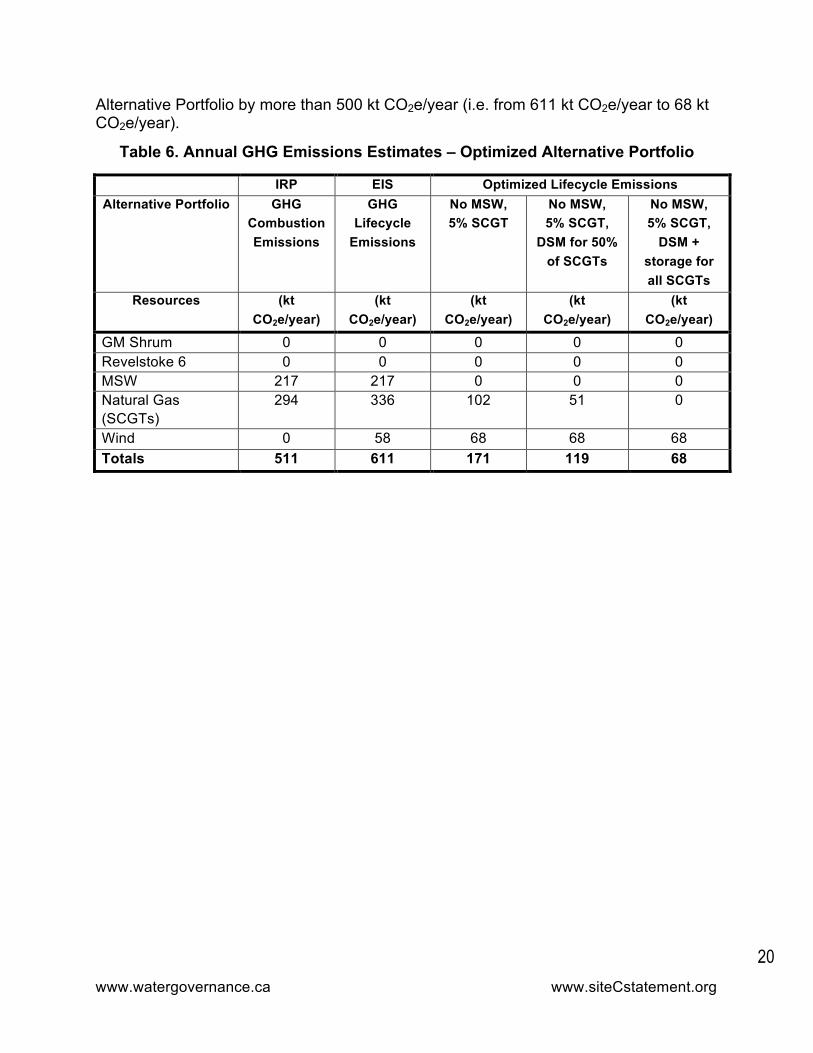
4.4 Summary The above discussion illustrates several approaches available for optimizing the GHG emissions from the Alternative Portfolio. The resulting GHG emissions for each of these approaches are summarized in Table 6, along with the values presented previously in Table 5. This analysis indicates that the environmental assessment process for the Site C Project overlooked opportunities to reduce the lifecycle GHG emissions of the
66 Bloomberg New Energy Finance. April 14, 2015. Bloomberg New Energy Finance Summit. Presentation by Michael Liebreich. Lithium-Ion Battery Experience Curve [‘BNEF’], p.12. Available at: http://about.bnef.com/content/uploads/sites/4/2015/04/Final-keynote_ML.pdf. 67 IESO. 2016. Energy Storage Procurement. Available at: http://www.ieso.ca/Pages/Participate/Energy-Storage-Procurement/default.aspx. 68 SDG&E. 2016. SDG&E Adding New Technologies to Harness Clean Energy, Efficiencies. Available at: http://www.sdge.com/newsroom/press-releases/2016-03-31/sdge-adding-new-technologies-harness-clean-energy-efficiencies.
www.watergovernance.ca www.siteCstatement.org
20
Alternative Portfolio by more than 500 kt CO2e/year (i.e. from 611 kt CO2e/year to 68 kt CO2e/year).
Table 6. Annual GHG Emissions Estimates – Optimized Alternative Portfolio
IRP EIS Optimized Lifecycle Emissions Alternative Portfolio GHG
Combustion Emissions
GHG Lifecycle
Emissions
No MSW, 5% SCGT
No MSW, 5% SCGT,
DSM for 50% of SCGTs
No MSW, 5% SCGT,
DSM + storage for all SCGTs
Resources (kt CO2e/year)
(kt CO2e/year)
(kt CO2e/year)
(kt CO2e/year)
(kt CO2e/year)
GM Shrum 0 0 0 0 0 Revelstoke 6 0 0 0 0 0 MSW 217 217 0 0 0 Natural Gas (SCGTs)
294 336 102 51 0
Wind 0 58 68 68 68 Totals 511 611 171 119 68

www.watergovernance.ca www.siteCstatement.org
21
5. Magnitude of the GHG emissions in context
5.1 Magnitude of GHG emissions Optimizing the Alternative Portfolio, as described in section 4, substantially reduces its GHG emissions. The green bars in Figure 2, below, illustrate the annual average GHG emissions of the Site C Project, based on the estimates summarized in Table 1 above. The tall blue bar represents the GHG emissions of the Alternative Portfolio as developed by BC Hydro; the shorter bars illustrate the optimized approaches to this portfolio, as summarized in Table 6. These optimizations do not include the potential for further future reductions in GHG emissions from the Alternative Portfolio, or potential reductions from export of the Site C Project energy surplus, as discussed below.
As shown in Figure 2, the GHG emissions from the fully optimized Alternative Portfolio are equal to BC Hydro’s “conservative” estimate of emissions from the Site C Project, and less than its “maximum” estimate. The GHG emissions reduction benefit of the Site C Project compared to an optimized Alternative Portfolio is at most 0.1 Mt CO2e/year, equivalent to just 0.15% of British Columbia’s annual GHG emissions,69 or 3 days per year of operations of the proposed Pacific Northwest LNG export facility.70,71
Figure 2
69 Government of British Columbia. 2015. Summary of B.C. Greenhouse Gas Emissions: 1990-2013. Available at: http://www2.gov.bc.ca/gov/content/environment/climate-change/reports-data/provincial-ghg-inventory-report-bc-s-pir. 70 Stantec. 2014. Pacific NW LNG Environmental Impact Statement and Environmental Assessment Certificate Application Section 7: Greenhouse Gas Management, p.7-14. 71 Environment Canada. 2016. Pacific Northwest Liquefied Natural Gas (LNG) Project Review of Related Upstream Greenhouse Gas (GHG) Emissions Estimates. Available at: http://www.ceaa-acee.gc.ca/050/documents/p80032/104795E.pdf.
www.watergovernance.ca www.siteCstatement.org
22
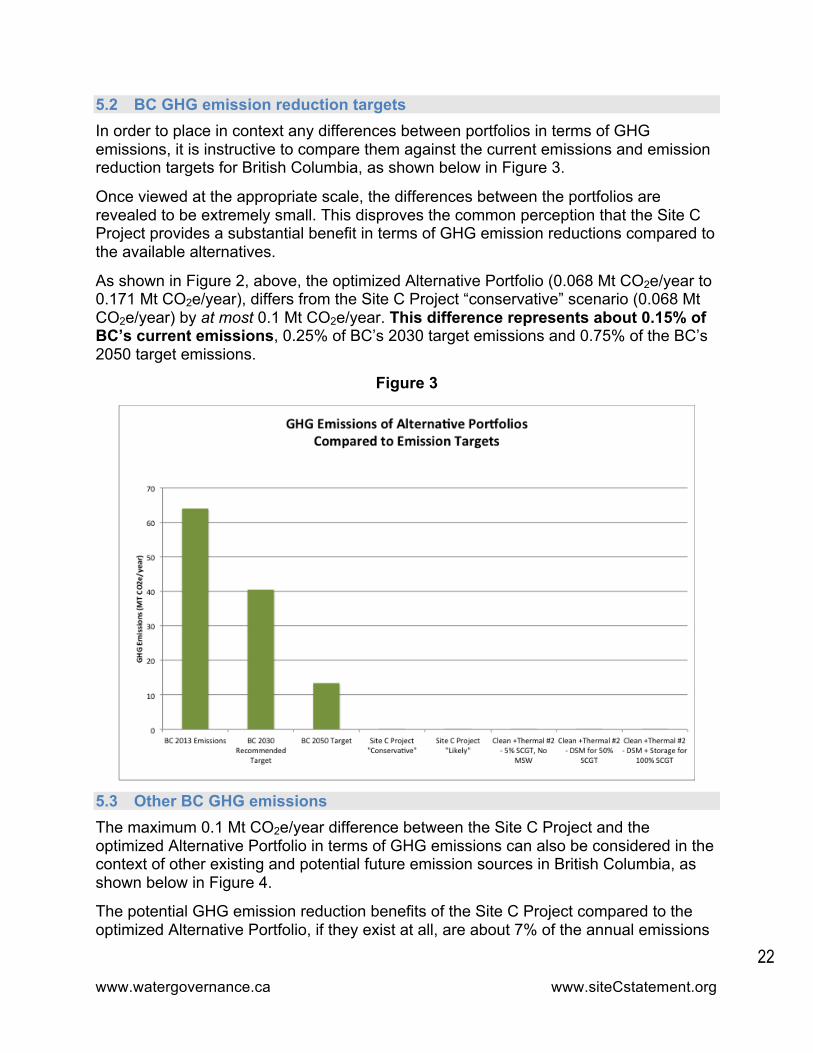
5.2 BC GHG emission reduction targets In order to place in context any differences between portfolios in terms of GHG emissions, it is instructive to compare them against the current emissions and emission reduction targets for British Columbia, as shown below in Figure 3.
Once viewed at the appropriate scale, the differences between the portfolios are revealed to be extremely small. This disproves the common perception that the Site C Project provides a substantial benefit in terms of GHG emission reductions compared to the available alternatives.
As shown in Figure 2, above, the optimized Alternative Portfolio (0.068 Mt CO2e/year to 0.171 Mt CO2e/year), differs from the Site C Project “conservative” scenario (0.068 Mt CO2e/year) by at most 0.1 Mt CO2e/year. This difference represents about 0.15% of BC’s current emissions, 0.25% of BC’s 2030 target emissions and 0.75% of the BC’s 2050 target emissions.
Figure 3
5.3 Other BC GHG emissions The maximum 0.1 Mt CO2e/year difference between the Site C Project and the optimized Alternative Portfolio in terms of GHG emissions can also be considered in the context of other existing and potential future emission sources in British Columbia, as shown below in Figure 4.
The potential GHG emission reduction benefits of the Site C Project compared to the optimized Alternative Portfolio, if they exist at all, are about 7% of the annual emissions

www.watergovernance.ca www.siteCstatement.org
23
of the largest existing single emitter in the Province, the Spectra Energy Fort Nelson Gas Plant, as shown in Figure 4. The recently-approved Woodfibre LNG facility, even with its relatively low emissions intensity per tonne of LNG, is nearly 10 times the maximum annual GHG emission benefits of Site C compared to the optimized alternative portfolio. Were the Pacific Northwest LNG export facility to be approved, its annual emissions would be more than 120 times the potential GHG emissions benefits of Site C, and would also represent over 95% of British Columbia’s 2050 emissions reduction target set out in the Clean Energy Act.
Figure 472,73,74,75
72 Stantec. 2014. Pacific NW LNG Environmental Impact Statement and Environmental Assessment Certificate Application Section 7: Greenhouse Gas Management, p.7-14. 73 Environment and Climate Change Canada. 2016. Pacific Northwest Liquefied Natural Gas (LNG) Project Review of Related Upstream Greenhouse Gas (GHG) Emissions Estimates. Available at: http://www.ceaa-acee.gc.ca/050/documents/p80032/104795E.pdf. 74 Environment Canada. 2014. Greenhouse Gas Emissions Reporting Program Online Data Search – Facility Reported Data. 75 Environment and Climate Change Canada. February 1, 2016. Woodfibre Liquefied Natural Gas (LNG) Project Review of Related Upstream Greenhouse Gas (GHG) Emission Estimates. Available at: http://www.ceaa-acee.gc.ca/050/documents/p80060/104688E.pdf.
www.watergovernance.ca www.siteCstatement.org
24
6. Additional considerations for comparing GHG emissions
6.1 Future opportunities for further GHG emission reductions The GHG emissions analysis presented by BC Hydro in the IRP assumes that the electricity generation resources comprising the Alternative Portfolio will come into service all at once at the same time as the Site C Project. In fact, the resources in the Alternative Portfolio will be brought into service incrementally, only if and when required in response to increases in demand for energy and capacity. This reflects an advantage for the Alternative Portfolio that is not reflected in BC Hydro’s analysis.
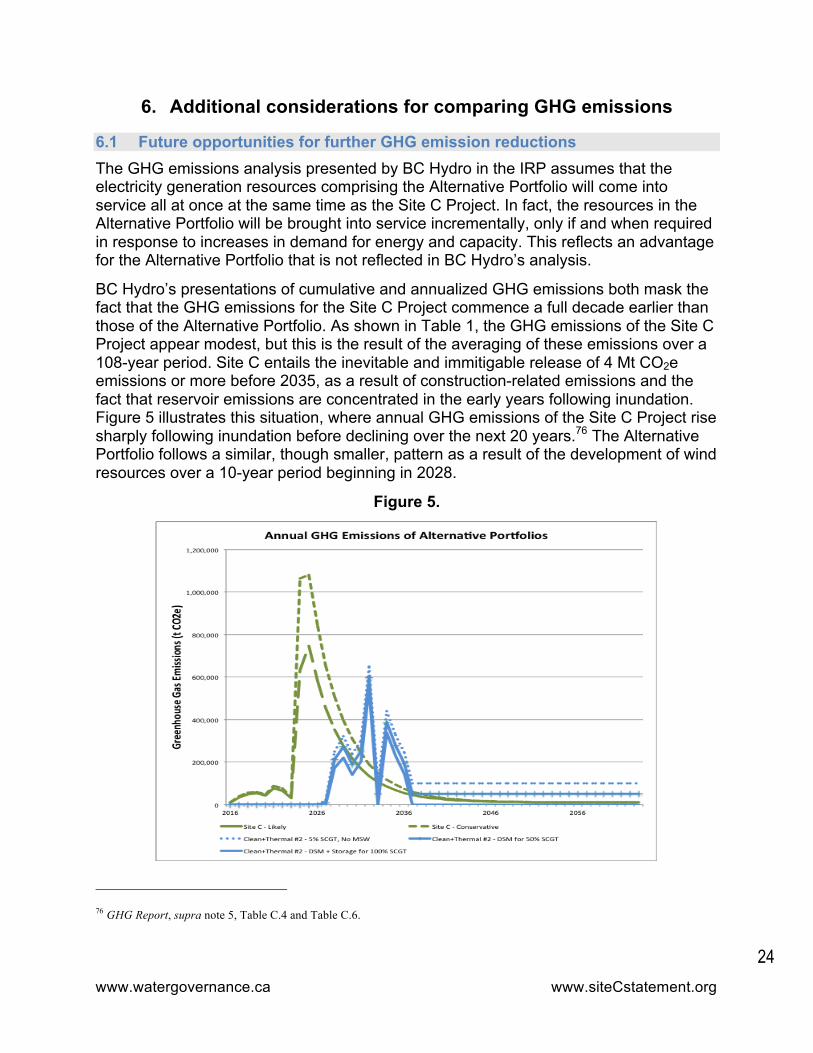
BC Hydro’s presentations of cumulative and annualized GHG emissions both mask the fact that the GHG emissions for the Site C Project commence a full decade earlier than those of the Alternative Portfolio. As shown in Table 1, the GHG emissions of the Site C Project appear modest, but this is the result of the averaging of these emissions over a 108-year period. Site C entails the inevitable and immitigable release of 4 Mt CO2e emissions or more before 2035, as a result of construction-related emissions and the fact that reservoir emissions are concentrated in the early years following inundation. Figure 5 illustrates this situation, where annual GHG emissions of the Site C Project rise sharply following inundation before declining over the next 20 years.76 The Alternative Portfolio follows a similar, though smaller, pattern as a result of the development of wind resources over a 10-year period beginning in 2028.
Figure 5.
76 GHG Report, supra note 5, Table C.4 and Table C.6.
www.watergovernance.ca www.siteCstatement.org
25
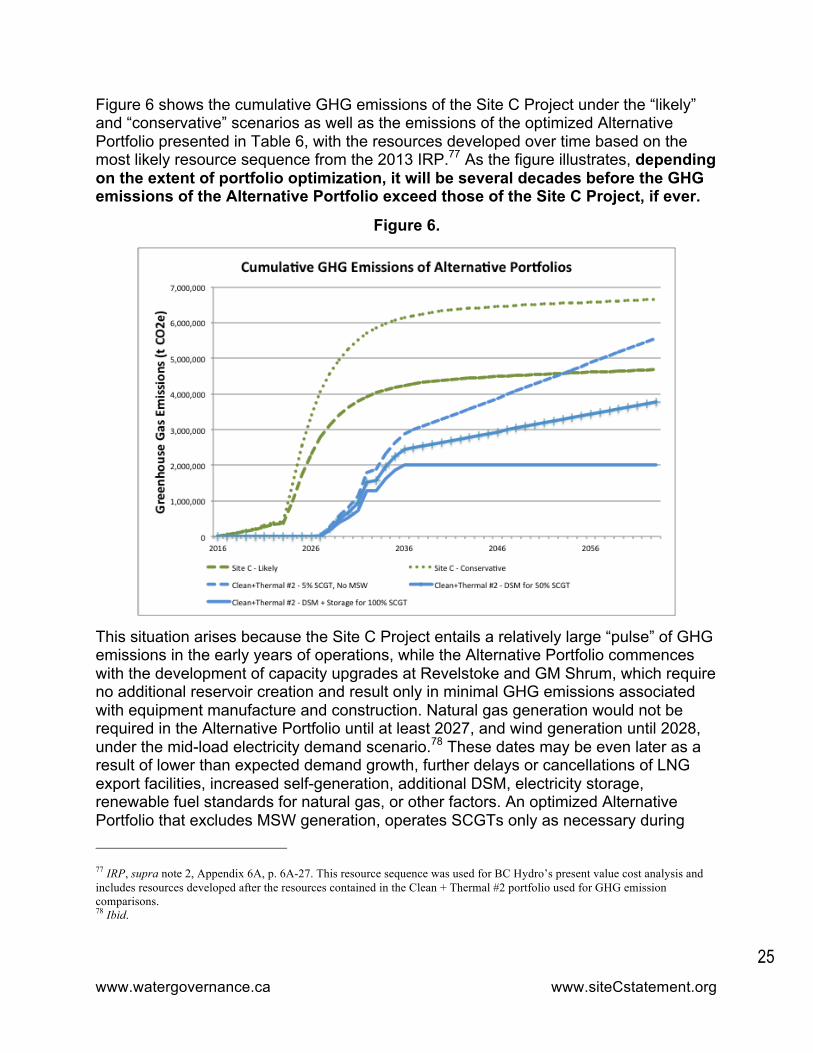
Figure 6 shows the cumulative GHG emissions of the Site C Project under the “likely” and “conservative” scenarios as well as the emissions of the optimized Alternative Portfolio presented in Table 6, with the resources developed over time based on the most likely resource sequence from the 2013 IRP.77 As the figure illustrates, depending on the extent of portfolio optimization, it will be several decades before the GHG emissions of the Alternative Portfolio exceed those of the Site C Project, if ever.
Figure 6.
This situation arises because the Site C Project entails a relatively large “pulse” of GHG emissions in the early years of operations, while the Alternative Portfolio commences with the development of capacity upgrades at Revelstoke and GM Shrum, which require no additional reservoir creation and result only in minimal GHG emissions associated with equipment manufacture and construction. Natural gas generation would not be required in the Alternative Portfolio until at least 2027, and wind generation until 2028, under the mid-load electricity demand scenario.78 These dates may be even later as a result of lower than expected demand growth, further delays or cancellations of LNG export facilities, increased self-generation, additional DSM, electricity storage, renewable fuel standards for natural gas, or other factors. An optimized Alternative Portfolio that excludes MSW generation, operates SCGTs only as necessary during 77 IRP, supra note 2, Appendix 6A, p. 6A-27. This resource sequence was used for BC Hydro’s present value cost analysis and includes resources developed after the resources contained in the Clean + Thermal #2 portfolio used for GHG emission comparisons. 78 Ibid.

www.watergovernance.ca www.siteCstatement.org
26
peak demand periods, and avails of contributions from DSM and storage (the lowermost blue line in Figure 5) will remain indefinitely below the cumulative GHG emissions of the Site C Project.
Even if the Alternative Portfolio is initially developed with SCGTs operating at a given capacity factor, over time this capacity factor can be reduced with additional capacity-focused DSM. The SCGTs can also be replaced at the end of their useful life with lower emission technologies, or the GHG emissions intensity of the natural gas can be lowered through a renewable fuel standard. An optimized Alternative Portfolio (the uppermost blue line in Figure 6) that initially avails of no capacity-focused DSM, no lower emission technologies and no renewable fuel standard has nearly 40 years to “bend the curve” below the GHG emissions of the Site C Project.
Beyond 2035, the GHG emissions in the Alternative Portfolio are depicted as changing linearly over time, due to ongoing fuel consumption. This is unlikely to be the case. One of the factors driving the use of SCGTs is their low capital cost, which means that they can be replaced in the future as better technologies arise, without significant capital loss. Furthermore, though these data do not take into account the replacement of wind turbines, with resulting manufacturing emissions, they also do not include the eventual turbine replacement for the Site C Project. Operations and maintenance activities would also contribute modest GHG emissions to both Site C and the Alternative Portfolio. These emissions are minimal or far in the future compared to the emissions from initial project development and inundation at Site C, and compared to initial development of wind resources and operation of SCGTs, if any, in the optimized Alternative Portfolio.
Ten years is a long time in the electricity business. Forty years is a technological eternity. Between 2005 and 2015, the average price of natural gas fell from US$8.69 to US$2.62 per million Btu, a remarkable decline of 70%, as a result of largely unanticipated technological developments.79 Utility scale solar PV systems declined by that same percentage in just over half that time.80 Over a forty-year period, the price of silicon crystalline photovoltaic cells has declined by over 99%.81 An optimized Alternative Portfolio has available to it all of the technological advances of the coming four decades or longer that would allow for additional reductions in potential GHG emissions in order to remain well below the emissions of the Site C Project.
This opportunity for improvement is unavailable to the Site C Project, since once it is constructed and operating, its GHG emissions are certain to occur.
79 U.S. EIA. Henry Hub Natural Gas Spot Price (Annual). Available at: https://www.eia.gov/dnav/ng/hist/rngwhhdA.htm. 80 U.S. Department of Energy. 2015. Photovoltaic System Pricing Trends: Historical, Recent, and Near-Term Projections. 2015 Edition, p.19. 81 BNEF. supra note 66.

www.watergovernance.ca www.siteCstatement.org
27
6.2 GHG emission reductions resulting from potential Site C exports
Site C not assessed for export purposes
The need for the Site C Project was framed by BC Hydro in the context of domestic residential, commercial and industrial electricity requirements. In its IRP, BC Hydro concluded that there were no economically viable export opportunities:
BC Hydro concludes that, aside from monitoring, there are no actions BC Hydro should be taking because there are no suitable opportunities for the export of electricity from clean or renewable B.C. resources for the foreseeable future.
Consequently, BC Hydro does not perceive, at this time, any value in continuing to investigate and develop potential market opportunities for export sales. …[C]urrent market conditions do not warrant expenditures for export, and no expenditures are planned as part of the Recommended Actions.82
The Site C Project was not proposed as an export facility, either to meet the needs of export markets in the United States, or to meet potential future market opportunities that may be available as a result of Alberta’s decision to shutter its coal generation by 2030.83
Since the enactment of the CEA, the prospects of export sales of clean or renewable energy in excess of that required to meet B.C. self-sufficiency requirements have diminished considerably. Further, the prospects of such sales are not expected to materially improve over the short to medium term. The reasons include a significant recent increase in renewable energy resources in the WECC [Western Electricity Coordinating Council], the persistence of tax incentives available to U.S. producers, and the enactment of RPS standards in potential markets, particularly California, that exclude many clean or renewable B.C. resources.84
In other words, the purpose of the Site C Project, as proposed by BC Hydro, as evaluated in the IRP, and as assessed during the environmental assessment by the JRP was to meet British Columbia’s domestic electricity requirements and not those of some other jurisdiction. The Site C Project was not evaluated in the export context.
Potential GHG emission reductions in Alberta
Despite the lack of prior evaluation by BC Hydro, the Provincial government has acknowledged that it is now considering exporting energy and capacity from the Site C
82 IRP, supra note 2, Chapter 5 Planning Environment, pp. 5-53 to 5-54. 83 Government of Alberta. 2016. Climate Leadership – Ending Coal Pollution. Available at: http://www.alberta.ca/climate-coal-electricity.cfm 84 IRP, supra note 2, Chapter 5 Planning Environment, p.5-51.

www.watergovernance.ca www.siteCstatement.org
28
Project to Alberta.85 This raises the potential that electricity generated at Site C could reduce GHG emissions from the electricity sector in the neighbouring Province. Whether this occurs would depend on the extent to which electricity from the Site C Project displaces competing electricity generation with a higher or lower GHG emissions intensity.
Alberta has recently indicated that: “By 2030, two-thirds of Alberta’s coal generating capacity will be replaced by renewable energy; one-third will be replaced by natural gas.”86 This is an important consideration in evaluating the potential GHG emissions reductions from the Site C Project, namely that coal generation will be replaced in Alberta regardless of whether or not energy or capacity from the Site C project is exported there. Site C would not necessarily displace coal generation in Alberta. Site C competes with the other forms of generation that will be developed since coal generation can no longer be refurbished or replaced with new coal generation.
The extent of potential GHG emission reductions resulting from the Site C Project will depend on several factors, including the duration of any export contracts, whether additional transmission can or will be developed to support exports, and how BC Hydro replaces exports beyond the Site C energy surplus. Long-term exports of firm energy and dependable capacity from Site C to Alberta would trigger a requirement for additional dependable capacity resources in BC (and any associated GHG emissions), given BC Hydro’s IRP identified a need for capacity by F2019, and the more recent 2016 load resource balance updated that requirement to F2020.
Electricity exported to Alberta during the period when Site C that is surplus to BC Hydro’s needs would displace or delay other generation that would otherwise be dispatched or developed. The precise mix of natural gas, wind, hydro, solar, geothermal and biomass that will be developed cannot be known with certainty, but the range of the potential GHG emission reductions during the Site C energy surplus period can be estimated.
Table 7 presents the estimated surplus energy projected for the BC Hydro integrated system in the utility’s most recent load resource balance for the years following the commissioning of the Site C Project.87 It also presents a preliminary estimate of the GHG emission reductions from exporting this surplus to Alberta, based on the assumption that one-third of the replacement energy would otherwise come from natural gas and two-thirds from renewables, as per the Government of Alberta policy objective.
This GHG emission offset of 2.4 Mt CO2e would lower the cumulative GHG emissions from the Site C Project to a level more similar to that of an optimized Alternative
85 “Big gambles on big energy projects.” Globe & Mail, April 28, 2016. Available at: http://www.theglobeandmail.com/opinion/big-gambles-on-big-energy-projects/article29777411/ 86 Government of Alberta. 2016. Climate Leadership: Ending Coal Pollution. Available at: http://www.alberta.ca/climate-coal-electricity.cfm. 87 RDA, supra note 44, Evidentiary Update on Load Resource Balance and Long Run Marginal Cost, p.12.
www.watergovernance.ca www.siteCstatement.org
29
Portfolio containing at least some capacity-focused DSM (see Figure 6). Whether the Site C Project actually displaces this quantity of GHG emissions depends on the emissions intensity of competing generation resources that would otherwise be developed in Alberta in the period 2024-2030.
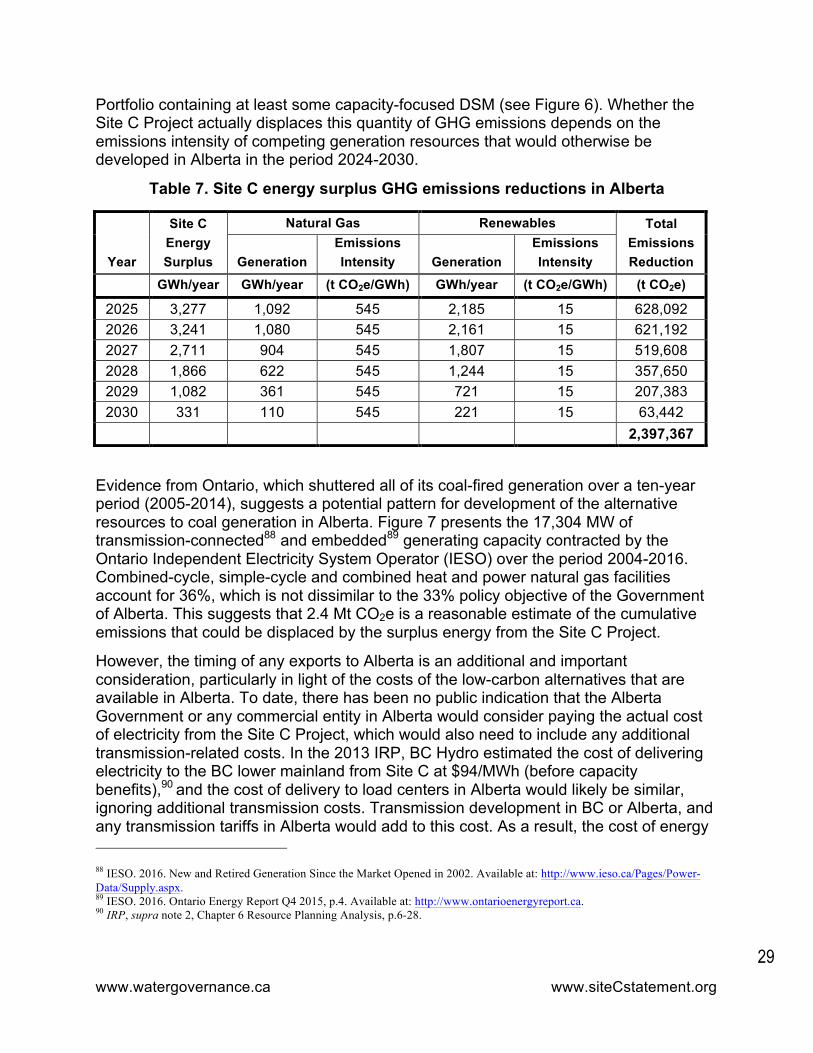
Table 7. Site C energy surplus GHG emissions reductions in Alberta
Year
Site C Energy Surplus
Natural Gas Renewables Total Emissions Reduction Generation
Emissions Intensity Generation
Emissions Intensity
GWh/year GWh/year (t CO2e/GWh) GWh/year (t CO2e/GWh) (t CO2e)
2025 3,277 1,092 545 2,185 15 628,092 2026 3,241 1,080 545 2,161 15 621,192 2027 2,711 904 545 1,807 15 519,608 2028 1,866 622 545 1,244 15 357,650 2029 1,082 361 545 721 15 207,383 2030 331 110 545 221 15 63,442
2,397,367
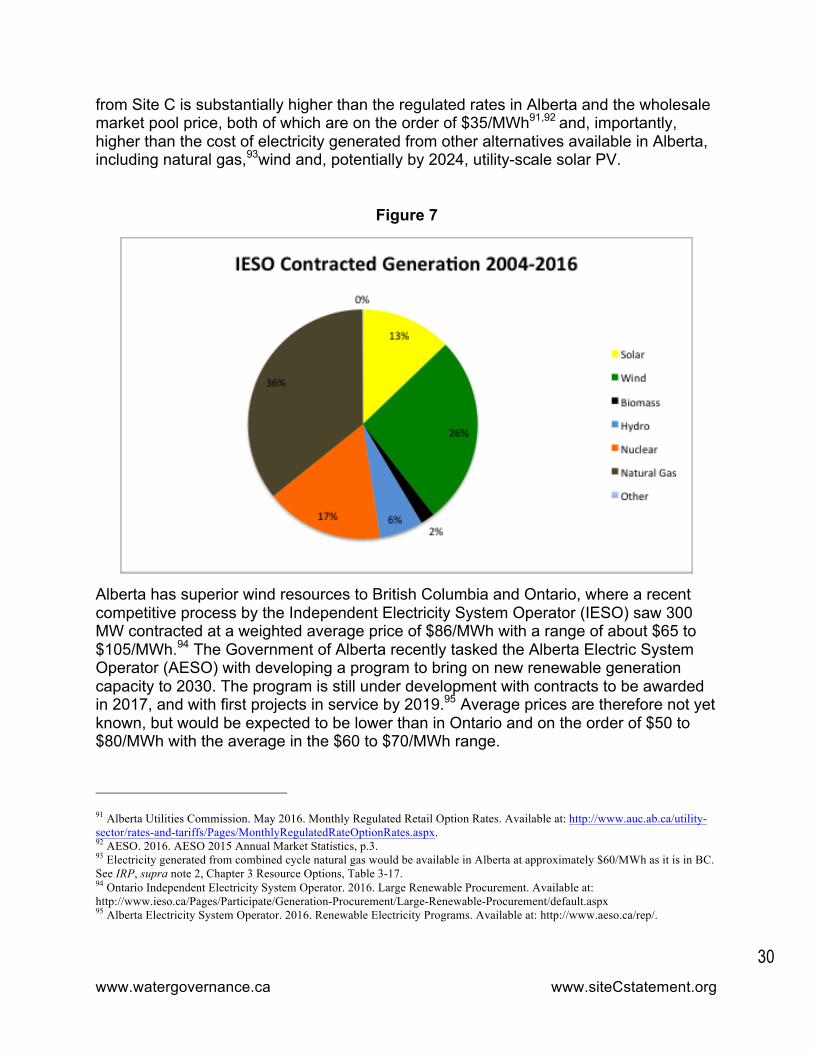
Evidence from Ontario, which shuttered all of its coal-fired generation over a ten-year period (2005-2014), suggests a potential pattern for development of the alternative resources to coal generation in Alberta. Figure 7 presents the 17,304 MW of transmission-connected88 and embedded89 generating capacity contracted by the Ontario Independent Electricity System Operator (IESO) over the period 2004-2016. Combined-cycle, simple-cycle and combined heat and power natural gas facilities account for 36%, which is not dissimilar to the 33% policy objective of the Government of Alberta. This suggests that 2.4 Mt CO2e is a reasonable estimate of the cumulative emissions that could be displaced by the surplus energy from the Site C Project.
However, the timing of any exports to Alberta is an additional and important consideration, particularly in light of the costs of the low-carbon alternatives that are available in Alberta. To date, there has been no public indication that the Alberta Government or any commercial entity in Alberta would consider paying the actual cost of electricity from the Site C Project, which would also need to include any additional transmission-related costs. In the 2013 IRP, BC Hydro estimated the cost of delivering electricity to the BC lower mainland from Site C at $94/MWh (before capacity benefits),90
and the cost of delivery to load centers in Alberta would likely be similar, ignoring additional transmission costs. Transmission development in BC or Alberta, and any transmission tariffs in Alberta would add to this cost. As a result, the cost of energy 88 IESO. 2016. New and Retired Generation Since the Market Opened in 2002. Available at: http://www.ieso.ca/Pages/Power-Data/Supply.aspx. 89 IESO. 2016. Ontario Energy Report Q4 2015, p.4. Available at: http://www.ontarioenergyreport.ca. 90 IRP, supra note 2, Chapter 6 Resource Planning Analysis, p.6-28.
www.watergovernance.ca www.siteCstatement.org
30
from Site C is substantially higher than the regulated rates in Alberta and the wholesale market pool price, both of which are on the order of $35/MWh91,92
and, importantly, higher than the cost of electricity generated from other alternatives available in Alberta, including natural gas,93wind and, potentially by 2024, utility-scale solar PV.
Figure 7
Alberta has superior wind resources to British Columbia and Ontario, where a recent competitive process by the Independent Electricity System Operator (IESO) saw 300 MW contracted at a weighted average price of $86/MWh with a range of about $65 to $105/MWh.94 The Government of Alberta recently tasked the Alberta Electric System Operator (AESO) with developing a program to bring on new renewable generation capacity to 2030. The program is still under development with contracts to be awarded in 2017, and with first projects in service by 2019.95 Average prices are therefore not yet known, but would be expected to be lower than in Ontario and on the order of $50 to $80/MWh with the average in the $60 to $70/MWh range.
91 Alberta Utilities Commission. May 2016. Monthly Regulated Retail Option Rates. Available at: http://www.auc.ab.ca/utility-sector/rates-and-tariffs/Pages/MonthlyRegulatedRateOptionRates.aspx. 92 AESO. 2016. AESO 2015 Annual Market Statistics, p.3. 93 Electricity generated from combined cycle natural gas would be available in Alberta at approximately $60/MWh as it is in BC. See IRP, supra note 2, Chapter 3 Resource Options, Table 3-17. 94 Ontario Independent Electricity System Operator. 2016. Large Renewable Procurement. Available at: http://www.ieso.ca/Pages/Participate/Generation-Procurement/Large-Renewable-Procurement/default.aspx 95 Alberta Electricity System Operator. 2016. Renewable Electricity Programs. Available at: http://www.aeso.ca/rep/.
www.watergovernance.ca www.siteCstatement.org
31
The cost of on-shore wind energy is expected to continue to decline, with the International Renewable Energy Agency (IRENA) recently projecting costs declines of 26% to 2025,96 and Bloomberg New Energy Finance (BNEF) projecting costs declines of 41% to 2040. The extent to which these declines are realized in Alberta depends on a number of factors including improvements in wind turbine efficiency and design, government policy, and technology adoption. A decline of 26% in the cost of wind energy in Alberta would mean a weighted average price on the order of $45 to $55/MWh in 2025 when energy from Site C would become available. This would be about half the full cost of surplus energy from Site C, presuming no transmission costs or tariffs.
Regarding solar energy, utility-scale solar PV is not currently competitive in Alberta. However, as with wind energy, the Province has superior solar resources to British Columbia and to Ontario, where IESO’s competitive process saw 140 MW of utility-scale solar PV contracted at a weighted average price of $157/MWh with a range over $140/MWh to $180/MWh.97 Considering Alberta’s solar insolation advantage over Ontario, and presuming the implementation of appropriate policies and market development, average prices in 2016 would be expected to be on the order of $125 to $150/MWh, in the event that any proponents were to respond to the AESO’s upcoming competitive procurement.
Declines in the cost of utility-scale solar PV are also expected to continue in the coming decades. BNEF projects an average cost decline in utility scale solar PV on the order of 60% out to 2040. In its recent analysis, IRENA projected a 59% decline in utility-scale solar PV costs by 2025.98 Whether these declines are realized in Alberta depends on a number of factors including: continued declines in installed costs, operations and maintenance cost declines, improvements in capacity factors, government policy, and technology adoption. A decline of 40% by 2025, in line with the BNEF projections, would mean a weighted average price on the order of $75 to $90/MWh, while a decline of 60% would see weighted average prices on the order of $50 to $60/MWh just when energy from Site C would become available.
Considering the continued declines in the price of energy from on-shore wind and utility-scale solar PV to well below the cost of delivering energy to Alberta from Site C, it is far from obvious that the Alberta Government or any commercial entity in Alberta would be willing to contract for the delivery of that energy, or to pay for the transmission investments required for that delivery. While Site C potentially has the additional advantage of providing dependable capacity, that advantage must consider the additional costs and environmental effects associated with transmission development, the relatively low costs (but higher GHG emissions) of providing that dependable 96 International Renewable Energy Agency. June 2016. The Power to Change: Solar and Wind Cost Reduction Potential to 2025, p.67. 97 Ontario Independent Electricity System Operator. 2016. Large Renewable Procurement. Available at: http://www.ieso.ca/Pages/Participate/Generation-Procurement/Large-Renewable-Procurement/default.aspx 98 International Renewable Energy Agency. June 2016. The Power to Change: Solar and Wind Cost Reduction Potential to 2025, p.49.

www.watergovernance.ca www.siteCstatement.org
32
capacity in Alberta using combined-cycle natural gas turbines, and the potential that considerable dependable capacity can be provided in Alberta at low costs and low emissions using a combination of SCGTs, capacity-focused DSM (including demand response and direct load control), and other dependable sources of capacity including geothermal and energy storage similar to the optimized Alternative Portfolio developed in this report. There has been no review to date by the BC Utilities Commission or an Alberta regulator of the costs of exporting energy or capacity from the Site C Project to Alberta.