company presentation fy 2017 results - astaldi.com · • activities stopped since 2015 ... will...
TRANSCRIPT

COMPANY PRESENTATION
FY 2017 Results
March 15, 2018

Agenda
Capital and Financial Strengthening Program FY 2017 Results Appendix
2

Capital and Financial Strengthening Program – Key Features 3
REFINANCING PROGRAMME NEXT 12-18 MONTHS
• RCF 500 M€ DUE 2019• HY BOND DUE 2020
aimed at strengtheningthe Group’s capital
structure
300 M€ CAPITAL INCREASE
FURTHERSUPPORT
FROM BANKING SYSTEM
to Group’s industrial and commercial activities,
in line with strategy plan
COMPANY’SPROPOSAL

Agenda
Capital and Financial Strengthening Program FY 2017 Results Appendix
4

FY 2017 Results – Main Highlights 5
New orders inflows consistent vs. strategy plan Booked 3.7 B€ new orders in 2017 referred to low risky countries/sectors – book-to-bill ratio at 1.3x
Conversion of approx. 700 M€ concession backlog into O&M contracts
Further 534 M€ already booked in 2018
Venezuela updated impairment test confirms write-down done
3.1 B€ revenue, +2% y/y Revenue – USD/€ FX impact on volumes, but not margins, as well as completion of relevant works
EBITDA margin at 12% Underlying EBIT margin confirm a solid momentum
Net working capital improvement in Q4
Asset disposal on track – Update on three main assets on sale
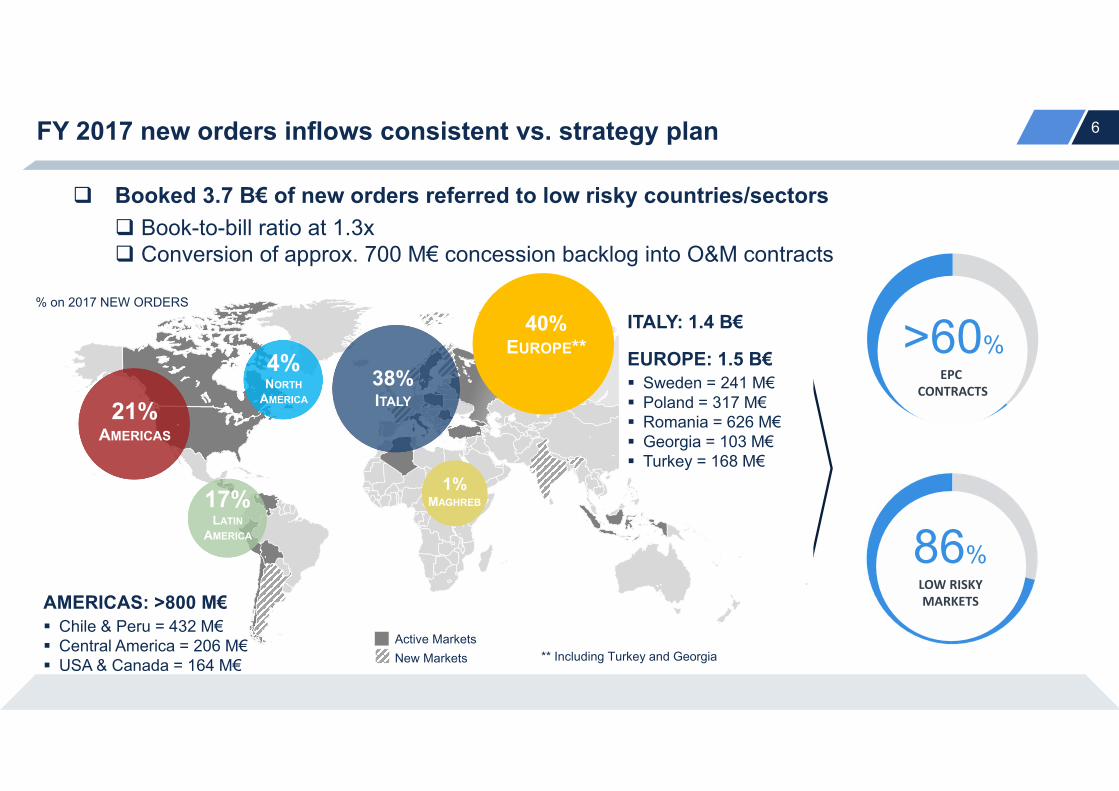
FY 2017 new orders inflows consistent vs. strategy plan 6
>60%EPC
CONTRACTS
86%
Booked 3.7 B€ of new orders referred to low risky countries/sectors Book-to-bill ratio at 1.3x Conversion of approx. 700 M€ concession backlog into O&M contracts
17%LATIN
AMERICA
4%NORTH
AMERICA
40%EUROPE**
1%MAGHREB
** Including Turkey and Georgia
38% ITALY21%
AMERICAS
Active MarketsNew Markets
AMERICAS: >800 M€ Chile & Peru = 432 M€ Central America = 206 M€ USA & Canada = 164 M€
ITALY: 1.4 B€
EUROPE: 1.5 B€ Sweden = 241 M€ Poland = 317 M€ Romania = 626 M€ Georgia = 103 M€ Turkey = 168 M€
LOW RISKYMARKETS
% on 2017 NEW ORDERS

4.6
0.81.32.90.2
Backlog Concessions O&M Idle Backlog * 2018 New Orders Today's Active PureConstruction
Backlog
Today’s Backlog at 18 B€, with 10 B€ of pure construction 7
RoW
Cent./East. EU
LatAm
North Amer.
Italy
17.5 B€Backlog in 2017
17.5 B€ 4.9 B€
0.9 B€0.5 B€ ~10 B€
* Referred to Puerto Cabello-La Encrucijada Railway, Venezuela. ** Not including further 7B€ of options and first in ranking
0.5 B€2018 New Orders
- Romania, Braila Bridge- USA, Wekiwa motorway- Italy, Genoa railway link- Italy, Bicocca-Catenanuova- Italy, Monopoli hospital
2.4 B€~10 B€
18 B€ Today’s Backlog** ~10 B€ Active Pure Construction
Backlog**
High incidence of low risky geographies

Venezuela updated impairment test confirms write-down done
Situation update
• Activities stopped since 2015 • No material fixed costs currently incurred since• One contract formally still in place, but no activity is expected• Prudential partial write-down of asset exposure towards the country
Accounting approach
Write down€230mm Moved to
fixed assets€203mm
Total (WIP+TR) exposure to Venezuela as of Sep-17A: €433mm
Methodology2 Reclassification of exposure
Market benchmarks DCF• Venezuela CDS• Venezuela bond returns• Historical sovereign debt
defaults (1983–2016)
• Various scenarios to reflect timing / amounts collected
~53% impairment
Receivables are recoverable
Certainty Collectability Timing of payment
• Exposure as of December 31 2016 acknowledged by Venezuela Government through IFE
• Intra-government agreement provides for settlement through ICC2 in Paris
• Receivables under intra-government agreement have priority vs. others subject to local laws
• Expectation that Venezuela will resume payments by 2020-2021 following oil price recovery
Note: (1) Small project closure revenues recorded until 2017 (2) International Chamber of Commerce
8

FY 2017 revenue and margins 9
3.1 B€ Revenue +2% y/y
EBITDA Margin: 12%
Revenue growth driven by low risky geographies/sectors Italy, Poland, Canada, and ChileO&M revenue at 86 M€
Y/Y revenue affected by: USD/€ FX on volume but not margins Completion of relevant works in Turkey, Algeria, Peru, and Italy
Solid EBITDA margin at 12%
Production cost % on revenues dropped to 67.7% from 68.4% in 2016, with better cost production performance due to execution in JVs vs. direct execution
* Before Venezuela write-down effect
Italy 24%
Turkey17%
Poland10%
Russia5%
Rest of Europe
4%
USA 3%
Canada15%
Chile15%
Africa 3%RoW 4%
2017 REVENUEBY GEOGRAPHY
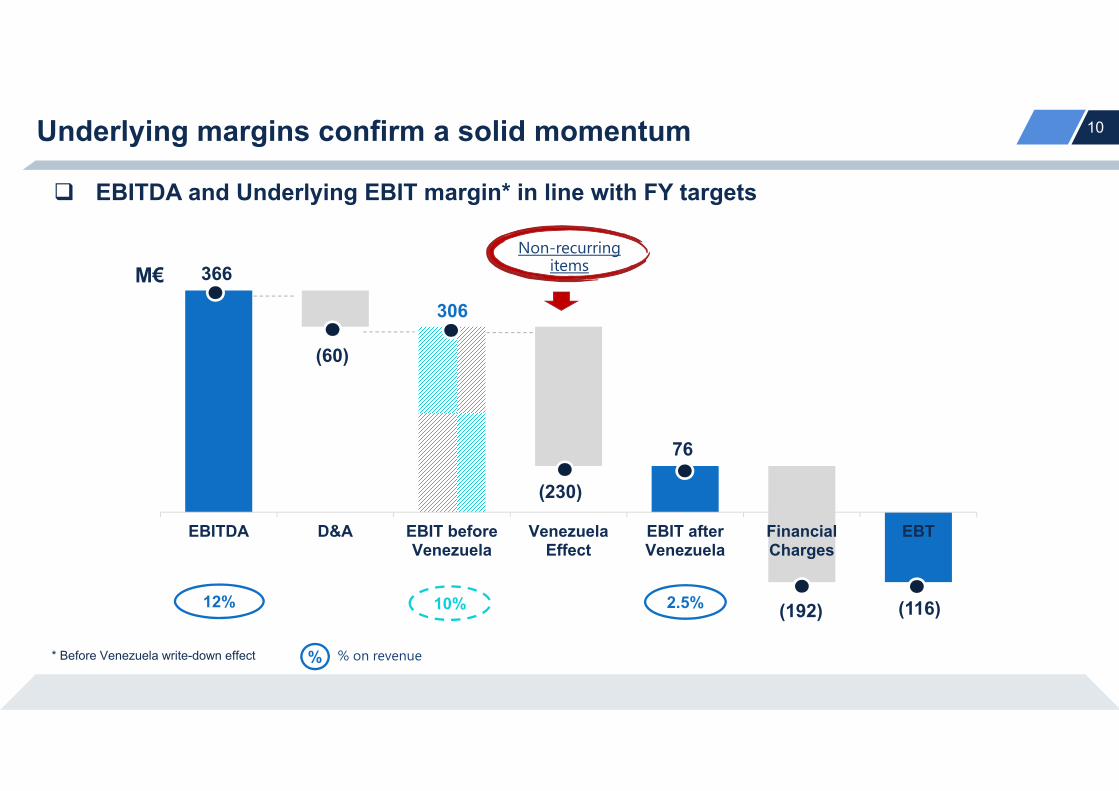
Underlying margins confirm a solid momentum 10
EBITDA and Underlying EBIT margin* in line with FY targets
EBITDA D&A EBIT beforeVenezuela
VenezuelaEffect
EBIT afterVenezuela
FinancialCharges
EBT
366
(60)
(230)
76
(192)
306
10% 2.5%
* Before Venezuela write-down effect
M€
12% (116)
% on revenue
Non-recurring items
%

Net working capital improvement in Q4 11
Ordinary Items Good project cashflow performance mainly in USA, Canada, and Italy New build-up of advances on new contracts in Romania, Sweden, and Georgia
Slow-moving Items Cash-in from slow-moving items in Italy Remaining slow-moving items in Romania, and Algeria

Net Financial Position 12

Asset Disposal on Track – Update on three main assets on sale 13
Third Bosphorus Bridge Disposal process on track Shareholder loan 182 M€ and equity 167 M€ at Dec-17 Non-Binding Offers received Final phase launched in March 2018 Target closing: at the turn of H1 2018
VSFP (Veneta Sanitaria Finanza di Progetto) Disposal process ongoing Agreed with other shareholders the O&M model
Gebze-Orhangazi-Izmir motorway Disposal process started Sale planned for 2019 at the end of the construction phase

14Liquidity and Maturity Schedule as of December 2017
(*) does include the “no recourse debt” (around 7M€ per year).2018 figures does also include EUR 46 M bridge financing to a project finance in Turkey (financial close 1st half 2018).
(*)

15Next Steps
Maneuver approval within April 2018
Third Bridge on Bosphorus sale planned at the turn of H1 2018
VSFP sale at the turn of H1 2018
16
Agenda
Capital and Financial Strengthening Program FY 2017 Results Appendix

FY 2017 Reclassified Consolidated Income Statement 17
31/12/2017 31/12/2016Revenue 2,888,319 94.4% 2,851,826 94.9%Other operating revenue 172,414 5.6% 152,429 5.1%Total Revenue 3,060,733 100.0% 3,004,255 100.0%Production costs (2,072,980) -67.7% (2,054,253) -68.4%Added value 987,752 32.3% 950,003 31.6%Personnel expenses (633,865) -20.7% (616,203) -20.5%Other operating costs (34,708) -1.1% (41,702) -1.4%Share of profits / (losses) of joint ventures and associates 47,196 1.5% 87,760 2.9%EBITDA 366,376 12.0% 379,858 12.6%Amortisation and depreciation (49,404) -1.6% (58,210) -1.9%Provisions (5,097) -0.2% (3,999) -0.1%Impairment losses (235,529) -7.7% (676) 0.0%EBIT 76,345 2.5% 316,973 10.6%Net financial expense (192,180) -6.3% (187,877) -6.3%Pre-tax profit / (loss) (115,835) -3.8% 129,096 4.3%Tax expense 18,108 0.6% (31,654) -1.1%Profit /(Loss) from continuing operations (97,727) -3.2% 97,442 3.2%Profit /(Loss) from discontinued operations 0.0% (24,811) -0.8%Profit / (Loss) for the year (97,727) -3.2% 72,631 2.4%(Profit) / Loss attributable to non-controlling interests (3,448) -0.1% (174) 0.0%Profit attributable to owners of the Parent (101,175) -3.3% 72,457 2.4%
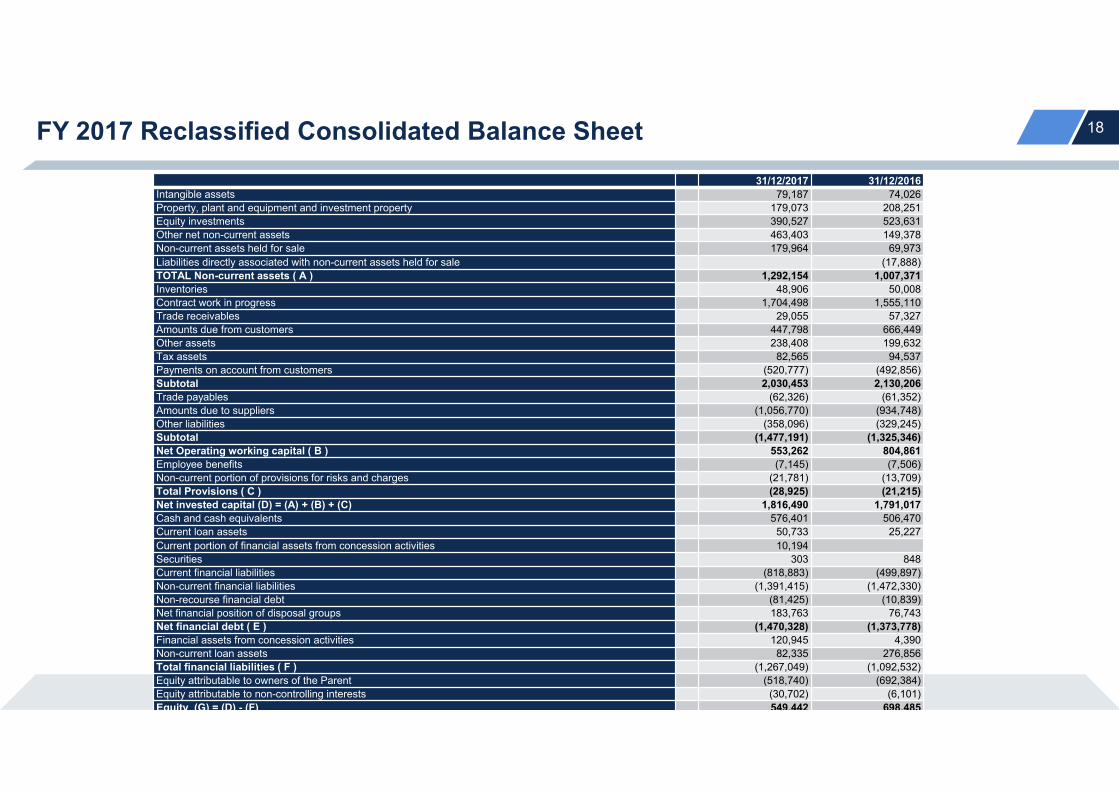
FY 2017 Reclassified Consolidated Balance Sheet 18
31/12/2017 31/12/2016Intangible assets 79,187 74,026Property, plant and equipment and investment property 179,073 208,251Equity investments 390,527 523,631Other net non-current assets 463,403 149,378Non-current assets held for sale 179,964 69,973Liabilities directly associated with non-current assets held for sale (17,888)TOTAL Non-current assets ( A ) 1,292,154 1,007,371Inventories 48,906 50,008Contract work in progress 1,704,498 1,555,110Trade receivables 29,055 57,327Amounts due from customers 447,798 666,449Other assets 238,408 199,632Tax assets 82,565 94,537Payments on account from customers (520,777) (492,856)Subtotal 2,030,453 2,130,206Trade payables (62,326) (61,352)Amounts due to suppliers (1,056,770) (934,748)Other liabilities (358,096) (329,245)Subtotal (1,477,191) (1,325,346)Net Operating working capital ( B ) 553,262 804,861Employee benefits (7,145) (7,506)Non-current portion of provisions for risks and charges (21,781) (13,709)Total Provisions ( C ) (28,925) (21,215)Net invested capital (D) = (A) + (B) + (C) 1,816,490 1,791,017Cash and cash equivalents 576,401 506,470Current loan assets 50,733 25,227Current portion of financial assets from concession activities 10,194Securities 303 848Current financial liabilities (818,883) (499,897)Non-current financial liabilities (1,391,415) (1,472,330)Non-recourse financial debt (81,425) (10,839)Net financial position of disposal groups 183,763 76,743Net financial debt ( E ) (1,470,328) (1,373,778)Financial assets from concession activities 120,945 4,390Non-current loan assets 82,335 276,856Total financial liabilities ( F ) (1,267,049) (1,092,532)Equity attributable to owners of the Parent (518,740) (692,384)Equity attributable to non-controlling interests (30,702) (6,101)Equity (G) = (D) - (F) 549,442 698,485

Country ProjectTotal Production
Astaldi share value(€/000)
Stage of completion (%)
Dec. 2017
Order backlog Astaldi share value (€/000)
EndingYear
Italy Jonica National Road (Lot "DG41") 956,0 3% 929,0 > 2020
Italy Verona‐Padova high‐speed railway 911,0 0% 911,0 > 2020
Italy Milan Subway, Line 4 804,7 37% 504,9 > 2020
Italy Brennero Railway 415,7 6% 390,0 > 2020
Italy Rome Subway, Line C 996,1 63% 367,6 > 2020
USA I405 Los Angeles 416,6 13% 361,4 > 2020
Turkey Etlik Health Integrated Campus in Ankara 443,0 36% 282,6 2019
Cile Arturo Merino Benitez International Airport in Santiago de Chile 400,1 34% 264,8 2020
Cile Hospital Barros Lucos 264,7 0% 264,7 > 2020
Cile Chuquicamata CC13 416,0 37% 264,1 2020
FY 2017 major contracts in execution 19
Top 10 Biggest Projects1