company presentation december 2020 - pt ultrajaya
TRANSCRIPT

Company PresentationDecember 2020

Company Overview

Company Overview
Pioneer in Ultra High Temperature ("UHT") processing in Indonesia,
partnering with Tetra Pak since 1975.
Largest manufacturer of UHT liquid milk in Indonesia
Market share of 39.3% in UHT liquid milk products¹
Largest manufacturer of RTD tea in carton packs in Indonesia
Market share of 77.3% in the ready-to-drink ("RTD") tea in
carton pack segment¹
Also produces, directly or through JVs, or toll manufactures sweetened
condensed milk, health drinks, cheese products, powdered milk and
juices
Partnerships / agreements with leading multinationals including
Unilever, Mondelez International, and Sanghiang Perkasa
Vertically integrated and highly automated production process
Best practices and stringent quality controls over the entire
production chain
Extensive sales and distribution network throughout Indonesia
3Q2020 Revenue: IDR 4,454 bnvs. LY -2.9%
3Q2020 EBITDA: IDR 1,268 bnEBITDA margin: +28.2%
vs. margin LY +24.1%
3Q2020 Net income: IDR 987 bnNet income margin: +22.2%
vs. margin LY +17.9%
1
2
3
4
5
Notes:1. Based on Nielsen data, UHT liquid milk market share by volume in Sept 2020 and RTD tea in carton pack market share by volume in Sept 2020

01
02
03
Dairy• #1 in UHT liquid milk with 39.3% market share• Offer a variety of products with different flavours and target customers
Ultra Milk brand for adults and young children, Low Fat Hi Cal brand for health conscious customers Ultra Ultra Mimi brand for young children Sweetened condensed milk under our own Cap Sapi brand
• In 9 months of 2020 total Dairy achieved sales of IDR 3,265 mio – 73.2% of total net sales
Tea and Health Drink• # 1 in RTD tea in carton packs with 77.3% market share• Offer a variety of products UHT RTD tea drinks in various packaging options
Teh Kotak Jasmine Regular and Less Sugar brands as primary UHT tea drinks sold in carton packs Teh Kotak Rasa brand for flavored UHT tea drinks Offer a variety of UHT health drinks, such as mung bean, tamarind drinks
• In 9 months of 2020 total Tea and Health drinks achieved sales of IDR 864 mio –19.4% of total net sales
Other• Tolling agreement for production of powdered milk and UHT drink for an affiliate of PT Sanghiang Perkasa• Tolling agreement for production of UHT fruit juice under the Buavita brand for PT Unilever Indonesia Tbk• Exports to several countries in Asia, Middle East, Pacific Island, Nigeria, Australia and America• In 9 months of 2020 total Other achieved sales of IDR 328 mio – 7.4% of total net sales
Business Overview

SABANA PRAWIRAWIDJAJA
PT NIKOS INTERTRADE
PT KRAFT ULTRAJAYA INDONESIA
PT NIKOS DISTRIBUTION
INDONESIA
PT ITO-EN ULTRAJAYA WHOLESALE
PT ULTRA SUMATERA
DAIRY FARM
PT ULTRA PETERNAKAN
BANDUNG SELATAN
MONDELEZ INTERNATIONAL INDIVIDUAL
PT TOLL INDONESIA
ITO-EN
ASIA PACIFIC
HOLDING
PT TIRTA TALAGA JAYA
KOPERASI PETERNAKAN
BANDUNG SELATAN
21%
50%70%30%
26%43%
70% 30% 40% 31%50% 25%
85% 75%
Data per 30 September 2020
PT PRAWIRAWIDJAJA PRAKARSAPT ULTRAJAYA MILK INDUSTRY
(TREASURY STOCK)PUBLIC
10%
PT ULTRAJAYA MILK INDUSTRY & TRADING COMPANY Tbk.
25%
75%
INDIVIDUAL PT KARYA PUTRAJAYA PERSADA
INDIVIDUAL
60%
PT MENARA ULTRA INDONESIA
INDIVIDUAL
15%
69%
Associated Company & Subsidiaries

Business Strengths

0102
03
0405
06
07
08
03. PRESENCE IN MULTIPLE CATEGORIES AND TRACK RECORD OF PRODUCT DEVELOPMENT
05. STRINGENT QUALITY CONTROLS ACROSS ENTIRE PRODUCTION CHAIN
01. INDUSTRY FUNDAMENTALS ARE STRONG
06. EXTENSIVE NATIONWIDE DISTRIBUTION NETWORK
04. VERTICALLY INTEGRATED AND HIGHLY AUTOMATED PRODUCTION
08. HIGHLY EXPERIENCED MANAGEMENT TEAM
07. GROWING SUPPLY OF HIGH QUALITY FRESH MILK
02. LEADING MARKET POSITION POISED TO CAPTURE CONTINUED GROWTH
Business Overview

01. Robust Industry FundamentalsDespite the impact of Covid 19, the industry fundamentals remain strong in terms of country and the market we operate in Indonesia has shown fast real GDP growth and has significant potential in GDP per capita growth. In addition, Indonesia has the largest population in SEA and increasing urbanization will drive consumer demand going forward
Continued GDP Growth (World Bank) Significant potential in GDP per capita growth (US) (2019, US$)
Largest population in SEA – 2018 population (million) Expanding urban population - % of total population
Source: World Bank
4.9% 6.2%6,1%
6,0%5,5%
5,0%
4,7%5.0%
5.0%
11 12 13 14 15 16 17 18 19
Singapore,65,233
South Korea,31,762
Malaysia,11,415
China,10,262
Thailand,7,808
Indonesia,4,136
Philippines,3,485
Vietnam,2,715
Indonesia, 271
Philipines, 108 Vietnam,96
Thailand,70
Malaysia,32 Singapore,
6
53% 54% 55% 55% 56%
2015 2016 2017 2018 2019

01. Robust Industry Fundamentals (cont’)Especially the liquid milk market in Indonesia, will continue to demonstrate strong growth, despite the Covid 19
related slowdown in 2020
DAIRY
Market size Liquid Milk (IDR mio) 2019 consumption per capita (L)
56.2
0
15
30
45
75
Malaysia Thailand Philippines Indonesia
36.2 16.6
60
Key characteristics / trends
Urbanization and increasing disposable income strengthening drinking milk demand
Health and wellness trend driving growth
Liquid milk outpacing powdered milk
– Higher quality / perceived health benefits of liquid milk
– Substitution of powdered milk to RTD liquid milk
UHT makes up the largest segment of liquid milk
Young adults are getting more accustomed to drinking milk compared to their parents
8,684
9,713 9,898
3Q2018 3Q2019 3Q2020
Source: Nielsen Source: Tetra Compass 2019
RTD TEA
Market size RTD Tea (IDR mio)
769 841
742
3Q2018 3Q2019 3Q2020
RTD CP TEA
Source: Nielsen
Key characteristics / trends
Various packaging segments targeting different consumer needs, e.g.
– Cup – low end positioning
– Carton – primarily convenience, home and school consumption, impulse consumption
– PET – primarily impulse consumption
Black tea is the largest product segment strong growth in niche segment
14.6
7,580 7,977
6,662
3Q2018 3Q2019 3Q2020
RTD PET TEA

Largest in UHT milk and RTD tea in carton packs segments
Trusted brands among consumers with strong brand equity
High quality and healthy positioning allowing us to capture expected segment growth
Competitive landscape and market share in 30 September 2020
UHT milk volume share2
RTD tea in carton pack volume share3
Ultra Milk40%
Frisian Flag20%
Indomilk17%
Milo5%
Greenfields4%
Real Good3%
Others11%
02. Leading Market Position to capture position expected growthWe are a leading player in fast growing consumer segments in Indonesia with award-winning brands
Volume market growth Liquid Milk in 2018-2020¹
3Q2018 3Q2019 3Q2020
Growth 6.7% Stable
Liquid milk shows very limited growth in 2020
RTD TEA decrease 20% during 3Q2020 vs
last year
Notes: 1,2,3 Source: Nielsen
Teh Kotak73%
Teh Sosro25%
Fruit Tea1%
Yeos0%
Others0%

03. Presence in multiple categories and track record of product development
Brand Awards/ Certifications
Top 10 Strongest Local Brand 2018
RTD Flavoured Milk WOW Brand 2017
Most Recommended Brand UHT category 2015
Most Recommended Brand UHT category 2015
Indonesia Best Brand 2014
"Ultra Milk" – Top Brand 2013
Most Supportive Sponsor 2019
YoutubeLeaderBoard 2020

03. Presence in multiple categories and track record of product development (con’t)Ultrajaya Milestone
We have continued to introduce new product categories and have developed products for different segments to expand our product reach.
2019
Additional 1.600 cows arrived in USDF

04. Vertically integrated and Highly-Automated production facilitiesOur production process is highly-automated with UHT treatment technology and an integrated aseptic packaging system
Vertically integrated production process across all products
Highly-automated production process with minimal human intervention
Utilizes state-of-the-art production equipment and aseptic packing to ensure high quality standards
Efficient Automated Storage and Retrieval System ("ASRS") implemented at warehouse using Automated Guided Vehicles ("AGVs")
Production processing overview1
Raw materials delivery, cooling and storage
Formulation,
purification,
homogenization and
pasteurization
UHT treatmentAseptic storage
and packaging
Packaging and
warehouse storage
HIGHLY-AUTOMATED
Note: 1. UHT milk production process used for illustrative purposes
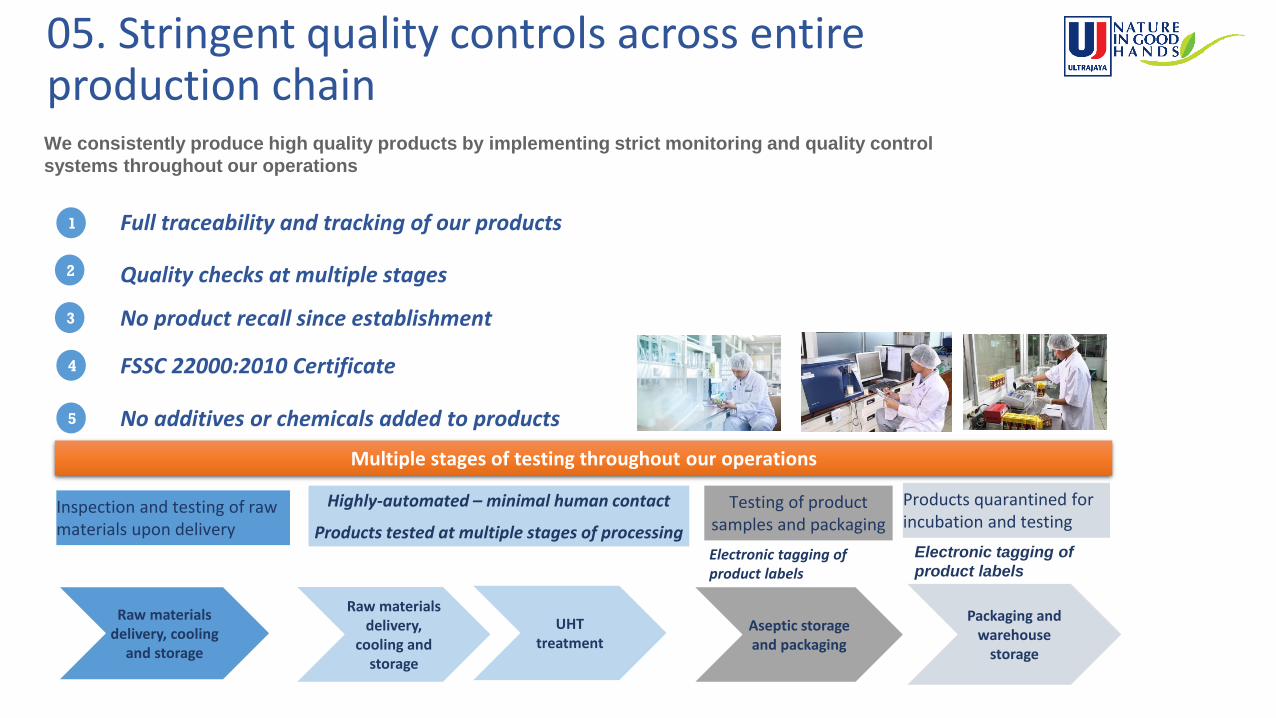
05. Stringent quality controls across entire production chainWe consistently produce high quality products by implementing strict monitoring and quality control
systems throughout our operations
Full traceability and tracking of our products1
Quality checks at multiple stages2
3 No product recall since establishment
4 FSSC 22000:2010 Certificate
5 No additives or chemicals added to products
Multiple stages of testing throughout our operations
Inspection and testing of raw materials upon delivery
Highly-automated – minimal human contact
Products tested at multiple stages of processing
Testing of product samples and packaging
Products quarantined for incubation and testing
Raw materials delivery, cooling
and storage
Raw materials delivery,
cooling and storage
UHT treatment
Aseptic storage and packaging
Packaging and warehouse
storage
Electronic tagging of product labels
Electronic tagging of
product labels

We operate an extensive nationwide distribution network both in Java and to other regions
Our extensive nationwide distribution network
Within Java – sales to modern retail through our own sales force and to traditional retail through our subsidiary –approximately 65,000 points of sale
Outside Java – we utilize approximately 61 distributors to reach retail outlets throughout the country
22 Sales Office in Java
Approximately 65,000 points of sale in Java
Approximately 61 distributors outside Java
14 distributors for overseas
Bandung
06. Extensive nationwide distribution network

We maintain a collaborative relationship with local dairy farmers to ensure consistent supply of high quality raw milk and aim to become less dependent on imported milk products with highly fluctuating prices and exchange rate
Dairy Farmers Cooperatives – majority of raw milk supply
Our Model Dairy Farm – South of Bandung
UPBS – joint venture with KPBS to operate a model dairy farm
In 2020 with approximately 3500 animals (mature & young dairy cows)
Exclusive supply for Ultrajaya
Managed by experienced professionals in dairy farm operations
We provide guidance, education, technical and managerial training as well as financing programs to local farmers
We maintain long-term relationships with several local dairy farmers cooperatives to ensure stable and high quality raw milk supply
We have strong relationship with South Bandung Farmers’ Cooperative ("KPBS"), which is a cooperative of dairy farmers in the Pangalengan area in West Java
We have a dedicated team to work with local farmers for training and knowledge
Secure, stable and long-term supply*
Access to high quality raw milk*
Cooperative arrangement*
Improved dairy farming methods*
Replication of best practice and improvement of product quality at large scale
*
Higher quality raw milk and higher output level
*
07. Growing Supply of high quality raw milk

We maintain a collaborative relationship with local dairy farmers to ensure consistent supply of high quality raw milk
Our farm in Berastagi, North Sumatera
● We have identified the need to further invest in milk availability
● Climate in area is favorable
● Capitalize on expertise gained in model farm
● Large scale farm with high yield international quality cows
● First phase of 2,000 imported pregnant heifers successfully completed
Control on supply and quality*
Joint venture, shared investment*
Unlock potential of Sumatera*
Other initiatives
Educate farmers on technique, hygiene, feed
Smaller scale initiatives in South Bandung area (‘colony’ with cooperatives for up to 350 cows)
CSR with student contribution learning-working.
Increase milk security*
Benefit company and country*
We do not consider ourselves to be dairy farming company, focus remains on manufacturing, branding and selling.
*
07. Growing Supply of high quality raw milk (cont’)

BO
AR
D O
F D
IREC
TOR
SSEN
IOR
MA
NA
GEM
ENT
Sabana PrawirawidjajaFounder & President Director
• One of the founders of the Company. Appointed as theCompany’s President Director since 1971
• Also serves as the President Commissioner of PT KraftUltrajaya Indonesia, PT NDI, and PT Ito En UltrajayaWholesale, Commissioner of PT UPBS, and the PresidentDirector of PT Ultra Sumatra Dairy Farm
Samudera PrawirawidjajaDirector
Jutianto IsnandarDirector
• Has been with Ultrajaya since 1974 as ProductionManager, Assistant to the Plant Manager, Sales &Distribution Manager and now as a Director
• Previously worked at PT Indomilk• Also serves as a President Commissioner of PT
Campina Ice Cream Industry
Rob NieuwendijkChief Financial Officer
• Has been with Ultrajaya since 2011• Previously held senior management positions for leading dairy
companies including FrieslandCampina and Royal Numico NV
Lorem Ipsum
Lorem ipsum dolor sit amet, nibh est. A magnamaecenas, quam magna nec quis, lorem nunc..
• Over 25 years of experience with Ultrajaya since 1989• Also serves as President Director of PT Campina Ice
Cream Industry, Director of PT Kraft Ultrajaya Indonesiaand PT Ito En Ultrajaya Wholesale, and theCommissioner of PT USDF
Siska SuryamanHead of Marketing • Has been with Ultrajaya since 2010• Previously held marketing positions at Mead Johnson Nutrition, Citibank
Indonesia, Bentoel Prima and Kalbe Nutritional
Au DjamhoerGeneral Manager Sales
• Joined the company in 2020• Previously held several senior positions in Sales and marketing in multinational
companies such as Aqua Danone and Coca Cola
Flemming SchmidtGeneral Manager Engineering
• Has been with Ultrajaya since 1987, responsible for investments in newequipment
• Experienced in engineering and equipment
• Has been with Ultrajaya since 2008• Previously held various supply chain management positions with Toll Asia
Logistics and Cold Storage Chain
Henry KhorGeneral Manager Supply Chain
08. Highly experienced Management Team
Strategies

Strategies01 Further expand our distribution platform, taking into account whether Covid 19 will have LT changes
Within Java
FOCUS: Increase penetration of modern and traditional retail
PLANS:
Expand the sales team on the ground
Continuously investing in training and in the quality of sales force
Improve sales efficiency through investing in IT and technology
Outside Java
FOCUS: Support distributors expanding their reach
PLANS:
Focus on distribution in Sumatra and Kalimantan
Help distributors secure financing to sell more of our products
Achieve IT connectivity with all of our distributors
02 Further expand our production and warehousing capacity
Increasing Capacity Optimize capacity in Bandung
To optimize capacity at our existing production facility
On-going investment in new packaging lines from Tetra Pak and Combibloc
New Distribution Centre
To help enhance distribution efficiency and speed to market
Plan to start building new distribution center within the Greater Jakarta area in 2020/2021
New Production Facility
To support longer term growth and expansion
Planning of new modern and automated production facility to commence building in 2021
Expected to be fully operational by 2022

Strategies cont’03 Continued focus on new product development
Joint Venture with Ito En
Combine significant product expertise Ito En with our onthe ground presence and knowledge
Flexible approach to opportunities in new tea categories
Be flexible on where opportunities exist
Focus is on unsweetened category
Outsource until volumes justify investing in own factory
New products in the dairy segment
Monitor customer preferences and identify newpossibilities
Introduced new flavours, to further develop the categoryand offer a wider range of products, also to improvepresence on the shelves
Identify any post Covid 19 opportunities
Develop Tea Segment in carton pack
Continue to monitor the market for new opportunities forpotential product launches
Look to develop and launch new products
Functional and value-added products
Consider launching products at the appropriate time, forexample
Yoghurt drinks
Pasteurized milk
Develop new categories

Strategies cont’04 Expansion of Dairy Farming operations to secure supply source
Dairy fam JV in Sumatra
Long term plan for farm with 6,000 milking cows, with 2 rotary milking parlors
69-31 JV with PT Karya Putrajaya Persada, a local partner
International technology and equipment
“Model Farm” South of Bandung
2000+ milking cows
> 10 years experience
05 Continued investment to improve operational efficiency
Production Quality Control Waste Management Invest in upgrading to new equipment
for production and packaging
Invest in new manufacturing facility and distribution center
Invest in waste management processes such as recycling of waste and reducing waste water
Invest in new technology to improve efficiency and effectiveness of quality control procedures
New farm (s) on Java to be built Invest in feed farming (grass, maize) to ensure good
quality feed at affordable prices
Build own feed mill

Financial Highlights

Corporate Actions• Rp 12 (full amount) cash dividends per share
• Based on Annual Shareholders’ General Meeting Deed No. 10 dated 25 August 2020 from Notary Ari Hambawan. S.H. M.Kn.
Distribution of dividends on net income for the financial year 2019:
• Referring to OJK Circular Number 3 / SEOJK.04 / 2020 dated 9 March2020 concerning "Other Conditions As Market Conditions That FluctuateSignificantly In The Implementation Of Shares Buyback Issued By Issuersor Public Companies"
• Announcement on June 25, 2020, via notification letter to OJK and IDX
• The purchase schedule has been fully implemented starting in 26 June2020 and ends on 03 August 2020
• To buy 10% of the Company's outstanding shares or as much as1,155,352,800 shares at a price of Rp. 1,600, - / share
• To be held as treasury shares for a period of not more than 3 (three)years
• As one of the Company's efforts to increase shareholder value and theperformance of the Company's shares so that it will provide greatflexibility to the Company in managing capital to achieve a more efficientcapital structure.
Shares Buyback

Corporate Actions (Contd.)
• Information Disclosure is published on November 16, 2020
• With a value of Rp. 3,000,000,000,000 and a period of 1, 2 and 3 years
• Reflects 48.20% of the Company's equity value based on the FinancialStatements as of June 30, 2020 with a limited review issued by KAPTanubrata Sutanto Fahmi Bambang & Rekan
• To finance and carry out business development
Issuance of Ultrajaya Medium Term Notes
(MTN) 2020

Financial strategiesHistorically, our business has been demonstrating strong growth momentum and robust profit generation capability. After a good first quarter in 2020, Covid 19 has impacted subsequent months
Sales and growth (IDR bn, %) Gross Profit and Margin (IDR bn, %)
EBITDA ¹ and Margin (IDR bn, %) Profit after tax and Margin (IDR bn, %)
Sales has contracted YTD 2020 due to Covid 19. no price increase in 2020.
Margins have been slightly below 2019, but remain strong.
There is optimism with some caution going forward
As costs have been controlled, profit margin can further improve in Q3. Note:1 EBITDA= Earning (Net Income) except costs/expense interest, Tax, Depreciation and Amortization
5,473 6,241
4,585 4,454
2018 2019 3Q2019 3Q2020
+ 14.0%
-2.9%
1,956 2,349 1,717 1,629
2018 2019 3Q2019 3Q2020
37.6%
37.4% 36.6%35.7%
1,035
1,418
1,106 1,269
2018 2019 3Q2019 3Q2020
18.9%
22.7%
24.1%
28.2%
702
1,036
821
987
2018 2019 3Q2019 3Q2020
12.8%16.6%
17.9%22.2%

Segments Net Sales breakdownOur own branded products for the Indonesia market have performed strongly. Key factors for growth remain.
Dairy (IDR bn, %) Tea and Health drinks (IDR bn, %) Other (IDR bn, %)
Strong growth in white milk and family size packages
Weak demand for flavoured, single serve packs due to less outdoors (schools closed, work from home etc)
No price increase in 2020
Weak demand during Covid 19 time
Recovery expected for 2021
Development UHT Toll manufacturing is good
Exports slightly behind.
3,904 4,453
3,245 3,263
2018 2019 3Q2019 3Q2020
+1.0%+14.1%
1,182 1,378 1,021 864
2018 2019 3Q2019 3Q2020
+16.6%
-15.4%
386 410 319 328
2018 2019 3Q2019 3Q2020
+ 6.3%
+2.6%

COGS BreakdownWe have seen declining gross margins due to lower volumes than expected but with increased costs due to inflation, salaries and other
COGS Breakdown (IDR bn) COGS Breakdown as % of Net Sales
As % of net sales 2018 2019 3Q2019 3Q2020
Direct Materials 52.3% 52.8% 53.4% 51.4%
Direct Labor 0.5% 0.6% 0.6% 0.7%
Depreciation 2. 4% 2.1% 2.1% 2.4%
Electricity and Energy 2.0% 1.9% 1.9% 2.2%
Repair and Maintenance 1.9% 2.1% 2.0% 2.0%
Salary and Wages 1.0% 1.0% 1.0% 1.1%
Others 3.0% 3.2% 3.2% 3.0%
Other COGS (excl direct materials)
10.8% 10.9% 9.1% 11.5%
Total COGS 64.3% 62.4% 62.6% 63.4%
Majority of COGS comprise direct materials – a.o raw milk, tea leaves, sugar, milk powder and packaging
Conversion costs have slightly increased, a.o because of lack growth in production volume and depreciation on new equipment
2018 2019 3Q2019 3Q2020
Direct material Direct labour
Depreciation Electricity & energy
Repair & maintenance Salary & wages
Others
3,5173,892
2,868 2,826

Operating ExpensesOperating expenses are under control
Selling expenses breakdown (IDR bn, % of NS) General and admin expenses breakdown (IDR bn,% of NS)
Advertising & Promotion (A&P) spend, which is the largest selling expense, has decrease substantially. Activities have been cancelled or reduced
Logistics costs vary with volumes and fuel prices Other selling costs largely comprise salary and rent expenses and increased at
lower pace than sales
Salary expenses are the largest component of general and administrative expenses and have remained relatively stable
General and administrative costs on relatively low level, although some increases have happened
2018 2019 3Q2019 3Q2020
Advertising & promotion Freight out Others
855909
619 561
15.6% 14.6%
13.5%12.6%
2018 2019 3Q2019 3Q2020Salary & wages
Others
197 203148 179
3.2%4.0%3.6% 3.3%
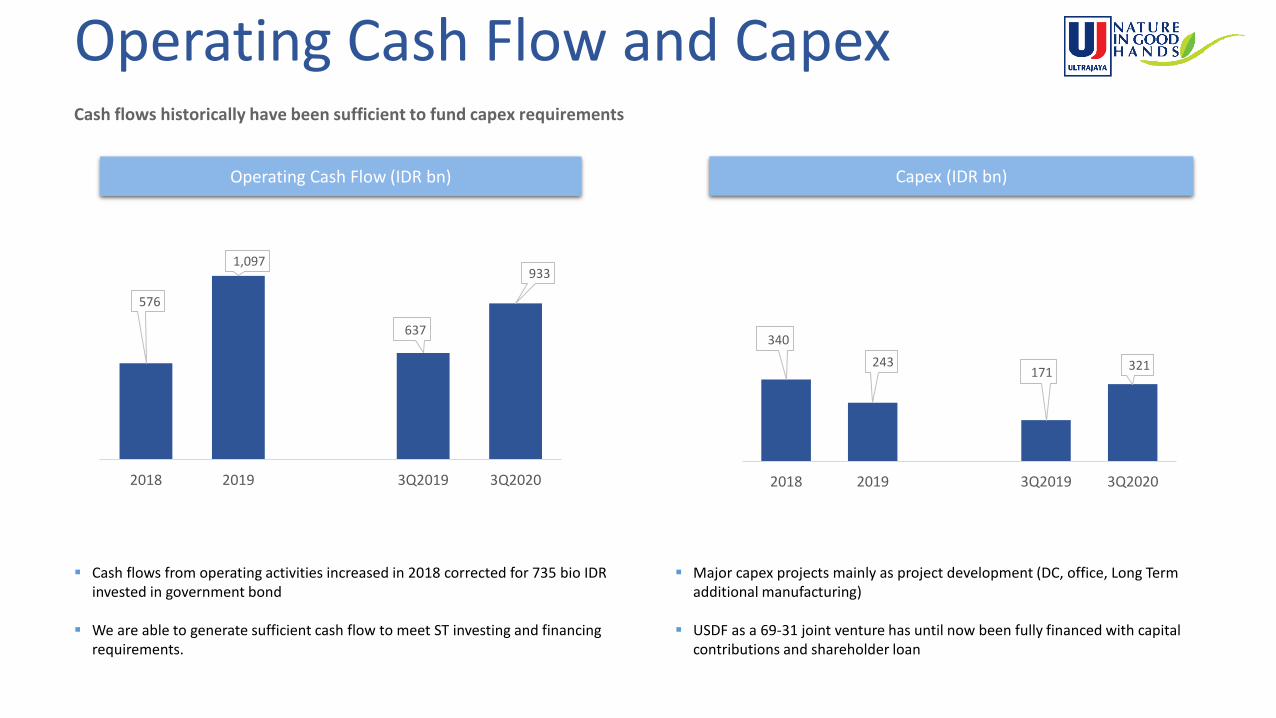
Operating Cash Flow and Capex
Operating Cash Flow (IDR bn)
Cash flows historically have been sufficient to fund capex requirements
Cash flows from operating activities increased in 2018 corrected for 735 bio IDR invested in government bond
We are able to generate sufficient cash flow to meet ST investing and financing requirements.
Capex (IDR bn)
Major capex projects mainly as project development (DC, office, Long Term additional manufacturing)
USDF as a 69-31 joint venture has until now been fully financed with capital contributions and shareholder loan
576
1,097
637
933
2018 2019 3Q2019 3Q2020
340
243 171 321
2018 2019 3Q2019 3Q2020

Summary Highlights

(IDR million) 2018 2019 2019 2020
Profit for the year attributable to:
- Owners of the parent 697,784 1,032,277 814,318 973,711
- Non-controlling interest 3,823 3,588 6,251 13,009
PROFIT FOR THE PERIOD 701,607 1,035,865 820,569 986,720
Total comprehensive income for the year attributable to:
- Owners of the parent 699,214 1,026,775 814,318 968,912
- Non-controlling interest 3,131 3,416 6,251 12,872
TOTAL COMREHENSIVE INCOME 702,345 1,030,191 820,569 981,784
EBITDA 1,035,324 1,418,685 1,105,805 1,268,424
3rd QuarterFull Year
(IDR million) 2018 2019 2019 2020
SALES 5,472,882 6,241,419 4,585,139 4,454,435
COST OF GOODS SOLD (3,516,606) (3,891,701) (2,868,423) (2,825,867)
GROSS PROFIT 1,956,276 2,349,718 1,716,716 1,628,568
Selling expenses (855,358) (908,877) (619,375) (561,294)
General & administrative expenses (196,900) (202,883) (148,193) (178,781)
Other expenses (11,453) 26,436 44,590 234,841
OPERATING INCOME 892,565 1,264,394 993,738 1,123,334
Finance income 60,084 105,655 70,801 91,953
Finance cost (2,107) (1,661) (1,269) (262)
Shares of net (loss) in associates or JV (1,524) 6,971 7,647 30,814
PROFITS BEFORE INCOME TAX 949,018 1,375,359 1,070,917 1,245,839
Total Income Tax (247,411) (339,494) (250,348) (259,119)
PROFIT FOR THE PERIOD 701,607 1,035,865 820,569 986,720
OCI 738 (5,674) - (4,936)
TOTAL COMREHENSIVE INCOME 702,345 1,030,191 820,569 981,784
3rd QuarterFull Year
Income Statement

(IDR million) 2018 2019 2019 2020
Current liabilities
Trade and other payables 302,403 451,990 443,245 389,870
ST loans 26,397 2,705 2,665 2,211
Current portion of LT Loans 27,153 20,196 16,912 -
Other current liabilities 279,208 361,423 385,888 441,760
Total current liabilities 635,161 836,314 848,710 833,841
Non-current liabilities
LT debt 31,787 9,914 - -
Deferred tax 14,762 12,252 7,796 -
Other 99,205 94,803 88,905 108,538
Total non-current liabilities 145,754 116,969 96,701 108,538
Total Liabilities 780,915 953,283 945,411 942,379
Minority interest 114,684 106,700 109,535 107,672
Equity 4,660,272 5,548,439 5,335,975 4,534,196
Total Liabilities & Equity 5,555,871 6,608,422 6,390,921 5,584,247
As of September 30th As of December 31st
Balance Sheet
(IDR million) 2018 2019 2019 2020
Current assets
Cash 1,444,310 2,040,591 1,682,562 710,205
Trade receivables 530,498 613,245 626,090 542,270
Inventories 708,773 987,927 832,215 1,094,795
Others 109,940 74,878 360,815 96,003
Total current assets 2,793,521 3,716,641 3,501,682 2,443,273
Non-current assets
Livestock 80,476 158,839 158,765 170,414
Investment in Associates and JV 101,506 108,477 109,154 155,791
Fixed assets 1,453,135 1,556,666 1,546,542 1,681,282
Government Bond 735,084 708,869 719,519 698,579
Other non current assets 392,149 358,930 355,259 434,908
Total non-current assets 2,762,350 2,891,781 2,889,239 3,140,974
Total assets 5,555,871 6,608,422 6,390,921 5,584,247
As of September 30th As of December 31st

Cash Flow StatementFull Year Ended 30 September
(IDR million) 2017 2018 2019 2020
Cash flow from operations
Cash receipts from operating activities 1,264,458 719,629 794,558 963,666
Interest income 80,355 60,084 70,801 91,953
Interest expense (1,500) (1,247) (1,268) (262)
Income tax (347,000) (291,922) (152,536) 232,542)
Others 76,203 89,279 (74,560) 110,526
Net cash generated from operating activities 1,072,516 575,823 636,995 933,341
Cash flow from investing
Capex (351,804) (348,138) (171,420) (321,245)
Others (47,883) (741,048) 10,448 (1,831,663)
Net cash from investing activities (399,687) (1,089,186) (160,972) (2,152,908)
Cash flow from financing
ST loans1 (470) 24,163 (23,732) (495)
LT loans - - (36,303) (17,164)
Others (73,331) (186,890) (177,736) (93,160)
Net cash from financing activities (73,801) (162,727) (237,771) (110,819)
Net increase/(decrease) in cash 599,028 676,090 238,252 (1,330,386)
Cash at beginning of year/period 1,521,372 2,120,400 1,444,310 2,040,591
Cash at end of year/period 2,120,400 1,444,310 1,682,562 710,205