company insight sunp in equity october 07, 2014...
TRANSCRIPT

Ambit Capital and / or its affiliates do and seek to do business including investment banking with companies covered in its research reports. As a result, investors should be aware that Ambit Capital may have a conflict of interest that could affect the objectivity of this report. Investors should not consider this report as the only factor in making their investment decision.
Adding to its ‘greatness’
Sun Pharma tops our 5’R’ (competitive mapping) and DNA (quality of growth) frameworks. Not only has the company exhibited the best quality of growth in the Indian pharma industry, but it has also shown best-in-class capital allocation and minimised risk to operations. Sun Pharma’s in-licensing of tildrakizumab from Merck signals a comforting focus on specialty whilst preserving its ‘greatness’. On the back of Taro’s recent round of price hikes in the US, Ranbaxy’s improved operating margins and Sun’s expanding gross margin and EBITDA margin (excluding Taro), we revise our earnings estimates by 10-11% for FY15E-16E. We revise our TP to `979/share (vs `730 earlier), implying 26.7x one-year forward earnings (vs 25x earlier). Key risks: USFDA issues at key plants like Halol; pricing decline at Taro.
Competitive position: STRONG Changes to this position: STABLE Sun catches up on evolution… ‘make or buy’ calls will keep us guessing Sun tops our 5R and DNA frameworks primarily on sustainable competitive advantages and superior quality of growth respectively. However, its commitment to long-term growth drivers (through SPARC and Dusa) has been lower than its peers like Dr. Reddy’s and Lupin. With the in-licensing of tildrakizumab, it has made another effective ‘make or buy’ call. We believe more such deals are in the offing. Our concerns on Sun’s ‘greatness-at-risk’ stand materially reduced In our report, “Well acquired, but ‘Greatness’ still ‘at risk’” dated 9 April 2014 we stated that post the Ranbaxy acquisition, Sun was likely to make a large specialty acquisition which would be unfamiliar territory and a credible risk. However, with the in-licensing of tildrakizumab, Sun has probably signaled the strategy for adding specialty. Our concerns are now materially reduced. Improvement in performance of Sun (ex-Taro), Taro and Ranbaxy Whilst Taro’s recent round of price hikes (see our note, “Taro revenues reflect price hikes taken in June ‘14” dated 8 August 2014) are likely to fuel near-term profit growth and EBITDA margin expansion, improvement in Sun’s base business is also encouraging. Ranbaxy has also shown improvement in EBITDA margins and domestic business growth. We upgrade our FY15 and FY16 estimates by 10-11%. We retain that Sun is likely to realise US$400mn synergies from the third year from Ranbaxy (guidance of US$250mn). Valuations – Premium to peers to remain Continued earnings momentum (27% FY14-17E EBITDA CAGR) owing to Taro’s price hikes, the Ranbaxy acquisition and high RoCE would support the rich valuations. We reset our cost of equity to 12.5% (from 13.1% earlier). Sun’s valuations, though apparently rich, would be at a lesser premium to peers once Ranbaxy synergies are realised inFY18/19E.
COMPANY INSIGHT SUNP IN EQUITY October 07, 2014
Sun PharmaceuticalsBUY
Analyst Details
Aditya Khemka +91 22 3043 3272
Paresh Dave
+91 22 3043 3212
Key financials Year to March (in ̀ mn) FY13 FY14 FY15E FY16E FY17E
Net Revenues (` mn) 112,389 160,044 185,226 352,252 391,126
Operating Profits 49,139 71,165 81,439 122,806 143,106
Net Profits 29,831 31,415 57,768 84,896 103,076
Diluted EPS 14.4 15.2 27.9 35.2 42.7
RoE (%) 21.9 18.7 27.8 30.6 27.9
P/E (x) 58.0 55.1 30.0 23.8 19.6
P/B (x) 11.6 9.3 7.5 6.2 4.9
Source: Company, Ambit Capital research
Healthcare
Recommendation Mcap (bn): `167/US$2.7 6M ADV (mn): `1776/US$29.0 CMP: `836 TP (12 mths): `979 Upside (%): 17
Flags Accounting: GREEN Predictability: AMBER Earnings Momentum: GREEN
Catalysts
Resolution of FDA issues at Ranbaxy (FY16E) and Caraco (till FY17E)
Price hikes in Taro and URL portfolios (timing uncertain)
Launch of unknown interesting products in US like Depo-Testosterone
Performance
Source: Bloomberg, Ambit Capital research
500600700800900
19,000 21,000 23,000 25,000 27,000 29,000
Oct
-13
Nov
-13
Jan-
14
Mar
-14
May
-14
Jul-
14
Sep-
14Sensex (LHS) Sun Pharma (RHS)

Sun Pharmaceuticals
October 07, 2014 Ambit Capital Pvt. Ltd. Page 2
Snapshot of company financials Profit and Loss Company Background Year to March (in ̀ mn) FY14 FY15E FY16E
Net revenues 160,044 185,904 354,873
Material cost 27,793 34,381 88,346
Employee cost 17,299 18,827 43,754
Other Mfg cost 43,787 51,122 100,308
Core EBITDA 71,165 81,574 122,465
Depreciation 4,094 4,718 9,848
Interest expense 442 802 4,490
Adjusted PBT 45,812 79,979 112,663
Tax 7,022 11,997 16,899
Reported net profit 31,415 57,822 84,171
Sun Pharmaceuticals was established by Mr. Dilip Shanghvi in 1983 in Kolkata, with five products to treat psychiatry ailments. The company has grown exponentially to become the largest chronic prescription company in India and a market leader in psychiatry, neurology, cardiology, orthopaedics, ophthalmology, gastroenterology and nephrology.
Over 70% of Sun Pharma’s sales are from markets outside India, primarily in the US. Manufacturing is across 23 locations, including the US, Canada, Brazil, Mexico and Israel.
Balance Sheet Cash flow Year to March (in ̀ mn) FY14 FY15E FY16E
Total Assets 293,708 350,147 556,567
Fixed Assets 58,242 62,524 124,225
Current Assets 177,393 229,550 373,546
Investments 27,860 27,860 28,583
Total Liabilities 293,708 350,147 556,567
Shareholders' equity 2,071 2,071 2,414
Reserves & Surplus 183,178 228,824 319,556
Total net worth 185,250 230,895 321,971
Total debt 25,609 25,609 91,587
Current liabilities 60,882 71,675 120,335
Deferred tax liability 2,757 2,757 2,124
Year to March (in ̀ mn) FY14 FY15E FY16E
PBT 45,812 79,844 113,004
Depreciation 4,092 4,718 9,848
Tax (7,889) (11,977) (17,584)
Net Working Capital (2,423) (29,531) (15,170)
CFO 39,592 43,054 90,098
Capital Expenditure (9,149) (9,000) (15,000)
Investment (16,679) - -
Other investments 1,982 2,767 3,376
CFI (23,846) (6,233) (11,624)
Issuance of Equity 182 - -
Inc/Dec in Borrowings 22,749 - -
Net Dividends (6,054) (12,165) (14,123)
Other Financing activities (11,811) (10,901) (14,309)
CFF 5,067 (23,067) (28,432)
Net change in cash 20,813 13,754 50,042
Closing cash balance 75,902 89,656 140,049
FCF 30,443 34,054 75,098
ANDA approval rate to improve in the US due to the GDUFA’s approval time target of 10 months vs the current 30 months
Sun Pharma has traded at 20.0-27.0x one-year forward earnings over the recent past led by a spike in RoCE owing to traction in the US business and acquisitions
30 2822
1320 20 20 20 20
15 17
2318
20 2635
45
68
01020304050607080
FY10
FY11
FY12
FY13
FY14
e
FY15
e
FY16
e
FY17
e
FY18
e
Filings Approvals
Price
10x
20x
30x
0100200300400500600700800900
1000
Mar
-05
Mar
-06
Mar
-07
Mar
-08
Mar
-09
Mar
-10
Mar
-11
Mar
-12
Mar
-13
Mar
-14
Sun Price Band chart
Sun Pharmaceuticals
October 07, 2014 Ambit Capital Pvt. Ltd. Page 3
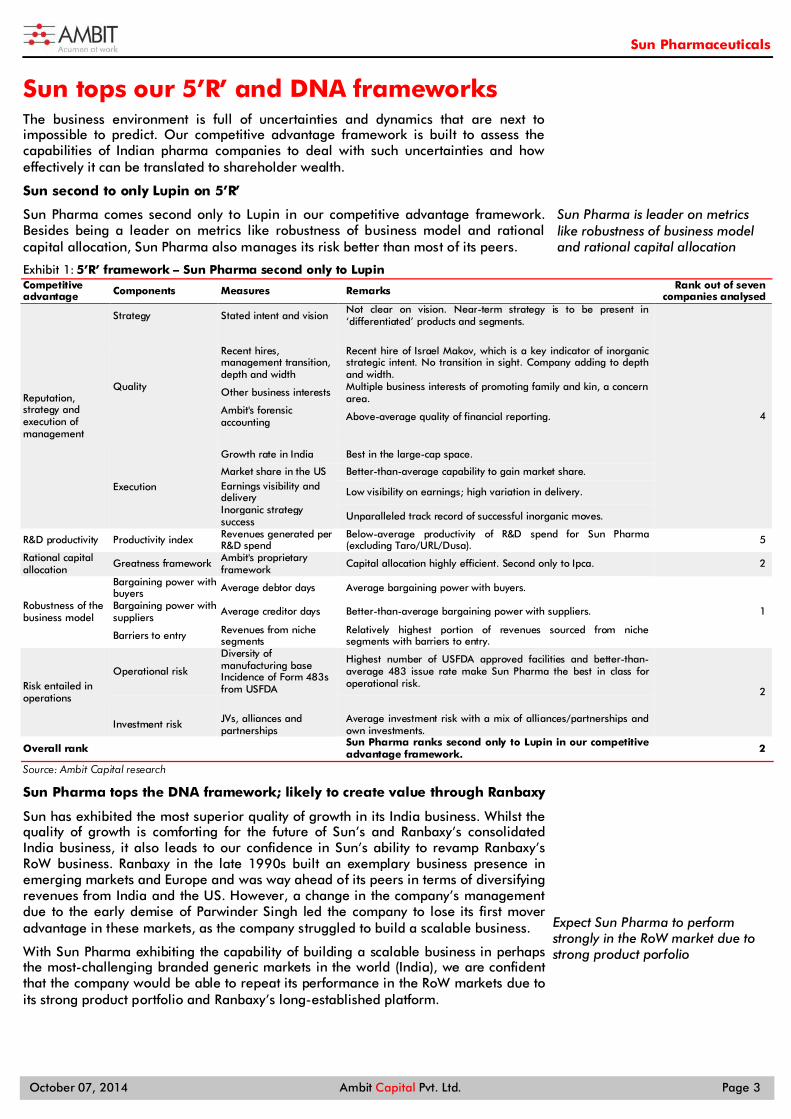
Sun tops our 5’R’ and DNA frameworks The business environment is full of uncertainties and dynamics that are next to impossible to predict. Our competitive advantage framework is built to assess the capabilities of Indian pharma companies to deal with such uncertainties and how effectively it can be translated to shareholder wealth.
Sun second to only Lupin on 5’R’
Sun Pharma comes second only to Lupin in our competitive advantage framework. Besides being a leader on metrics like robustness of business model and rational capital allocation, Sun Pharma also manages its risk better than most of its peers.
5’R’ framework – Sun Pharma second only to Lupin Exhibit 1:Competitive advantage Components Measures Remarks Rank out of seven
companies analysed
Reputation, strategy and execution of management
Strategy Stated intent and vision Not clear on vision. Near-term strategy is to be present in ‘differentiated’ products and segments.
4
Quality
Recent hires, management transition, depth and width
Recent hire of Israel Makov, which is a key indicator of inorganic strategic intent. No transition in sight. Company adding to depth and width.
Other business interests Multiple business interests of promoting family and kin, a concern area.
Ambit's forensic accounting Above-average quality of financial reporting.
Execution
Growth rate in India Best in the large-cap space.
Market share in the US Better-than-average capability to gain market share. Earnings visibility and delivery Low visibility on earnings; high variation in delivery.
Inorganic strategy success Unparalleled track record of successful inorganic moves.
R&D productivity Productivity index Revenues generated per R&D spend
Below-average productivity of R&D spend for Sun Pharma (excluding Taro/URL/Dusa). 5
Rational capital allocation
Greatness framework Ambit's proprietary framework
Capital allocation highly efficient. Second only to Ipca. 2
Robustness of the business model
Bargaining power with buyers Average debtor days Average bargaining power with buyers.
1 Bargaining power with suppliers
Average creditor days Better-than-average bargaining power with suppliers.
Barriers to entry Revenues from niche segments
Relatively highest portion of revenues sourced from niche segments with barriers to entry.
Risk entailed in operations
Operational risk
Diversity of manufacturing base
Highest number of USFDA approved facilities and better-than-average 483 issue rate make Sun Pharma the best in class for operational risk.
2 Incidence of Form 483s from USFDA
Investment risk JVs, alliances and
partnerships Average investment risk with a mix of alliances/partnerships and own investments.
Overall rank Sun Pharma ranks second only to Lupin in our competitive advantage framework. 2
Source: Ambit Capital research
Sun Pharma tops the DNA framework; likely to create value through Ranbaxy
Sun has exhibited the most superior quality of growth in its India business. Whilst the quality of growth is comforting for the future of Sun’s and Ranbaxy’s consolidated India business, it also leads to our confidence in Sun’s ability to revamp Ranbaxy’s RoW business. Ranbaxy in the late 1990s built an exemplary business presence in emerging markets and Europe and was way ahead of its peers in terms of diversifying revenues from India and the US. However, a change in the company’s management due to the early demise of Parwinder Singh led the company to lose its first mover advantage in these markets, as the company struggled to build a scalable business.
With Sun Pharma exhibiting the capability of building a scalable business in perhaps the most-challenging branded generic markets in the world (India), we are confident that the company would be able to repeat its performance in the RoW markets due to its strong product portfolio and Ranbaxy’s long-established platform.
Sun Pharma is leader on metrics like robustness of business model and rational capital allocation
Expect Sun Pharma to perform strongly in the RoW market due to strong product porfolio

Sun Pharmaceuticals
October 07, 2014 Ambit Capital Pvt. Ltd. Page 4
Overall ranking as per our DNA framework Exhibit 2:
Business DNA Drivers of growth Newer avenues for growth Associated risk to growth Overall Rank
Rank Product selection
Sales execution
Brand equity
Therapeutic coverage
Geographical coverage
Sales force productivity
Regulatory risk
Event specific risk
Weights 20% 20% 10% 10% 10% 5% 15% 10% 100%
Sun Pharma 6 1 3 10 12 1 1 9 1
Glenmark 3 3 7 12 9 7 8 10 2
Biocon 1 8 1 4 6 3 16 8 3
Ajanta 1 5 2 3 11 19 11 18 4
IPCA 6 3 5 7 13 17 10 6 5
Torrent 5 12 9 11 10 15 6 4 6
Lupin 6 1 8 17 18 9 2 13 7
Indoco 6 5 10 8 5 18 14 3 8
Cipla 16 8 13 19 8 8 3 5 9
Claris 18 12 4 1 3 11 18 2 10
Strides 6 12 19 5 1 14 17 1 11
Natco 18 8 6 2 2 12 19 11 12
FDC 6 17 18 6 4 2 12 7 13
Cadila 13 5 12 18 19 4 4 19 14
Unichem 3 12 15 13 16 13 13 15 15
Ranbaxy 6 17 17 16 7 6 5 14 16
Alembic 16 8 11 14 17 16 9 16 17
Dr. Reddy 13 17 14 9 14 10 7 17 18
Wockhardt 13 16 16 15 15 5 15 12 19
Source: Ambit Capital research; Note: We derive the weighted average overall rank by scoring each company (with a maximum score of 20) on the basis of the individual rank. For example, rank 1 in the individual rank would score 20 and rank 19 would score 1.

Sun Pharmaceuticals
October 07, 2014 Ambit Capital Pvt. Ltd. Page 5
Preserving its greatness…’make or buy’ calls will keep us guessing Historically, Sun Pharma has used an effective inorganic strategy. The strategy is based on a string of ‘make or buy’ decisions taken by the company. Invariably, the acquired companies have been either sub-optimally managed or in distress for lack of funding but at the same time they have helped to fill the gaps in Sun Pharma’s portfolio. The sub-optimally managed or under distress quotient has led to acquisitions with valuations within the company’s internal benchmark of 5-6 years of payback period. Effective ‘make or buy’ calls have kept us guessing on the future of Sun Pharma, and given the strategy, the scenario is unlikely to change.
Why we thought Sun Pharma’s ‘greatness’ was at risk?
The Ranbaxy deal was an all-stock deal and would not help Sun Pharma in deploying the surplus cash (>US$1bn as of FY13) on its books which otherwise is not generating operating business like returns. Hence, even post the large acquisition of Ranbaxy, Sun Pharma’s management would be under pressure to deploy the cash on its books, which otherwise destroys shareholder wealth.
Further, Ranbaxy would not exactly fulfil Sun Pharma’s ambitions on the specialty side of the business. Ranbaxy has some in-licensed specialty products in the US but does not develop innovative, specialty and branded products.
Moreover, we believe the Ranbaxy acquisition does not address the issue of sustainability and development of a ‘moat’ around Sun Pharma’s business. Sun Pharma has made very limited investments in longer-term growth drivers like NDDS-based products, biosimilars and novel molecules. We think the company will need to make an acquisition that provides these growth drivers for the future.
Hence, with cash still lying on its books, more to come from operations, unfulfilled ambitions on specialty and longer-term growth drivers, Sun Pharma could make a large acquisition in the specialty space sooner than most investors would expect.
Hence, though the Ranbaxy acquisition itself does not put Sun Pharma’s greatness ‘at risk’, the large cash pile, ambitions of being in the innovation game in a significant manner (inorganically) and the lack of management bandwidth to handle another large acquisition, do not alleviate our worries.
Why we are less concerned now? With the global in-licensing deal for tildrakizumab with Merck, Sun has probably signaled that it is unlikely to make large specialty company acquisitions and may rely more on product acquisitions. Such a strategy would materially reduce the risk to Sun Pharma’s ‘greatness’ in our view. We believe more such deals are in the offing.
Sun Pharma has agreed to pay US$80m upfront and staggered mid-single to teen royalties on sales to Merck for the exclusive global commercial rights for the product. The product currently is in Phase 3 and is undergoing registration clinical trials. Although Sun could market the product in India and the US, Ranbaxy’s platform will help the company to commercialise the product in Europe, Japan and emerging markets. However, products in Phase 3 trials are assigned 50% probability of success.
Sun could end up spending ~US$350mn on the product to get it commercialised, in our assessment. Assuming EBITDA margins of 40% (10% CoGS, 15% royalty and 35% selling and promotion costs), peak sales of US$200mn (global) could help Sun generate post-tax RoCE of >20%. The indications of the drug could be expanded at a later date to enable a wider target market. As a comparison, Stelara (targets IL12/23) marketed by Janssen for psoriasis currently has >US$2bn in annual sales.
We do not build in any upsides from tildrakizumab in our estimates yet
Since the molecule is undergoing Phase 3 trials with data expected to be reported in 2019, we do not build in any material upsides from the product yet in our estimates.
Acquired companies that have been either sub-optimally managed or distress for lack of funding
All stock deal for acquisition of Ranbaxy will not help deploy surplus cash
Sun Pharma could make a large acquisition in the specialty space
In-licensing deal strategy would materially reduce the risk to Sun Pharma’s ‘greatness’ in our view

Sun Pharmaceuticals
October 07, 2014 Ambit Capital Pvt. Ltd. Page 6
Improvement in financial performance of Sun (ex-Taro/one-offs), Taro and Ranbaxy Sun Pharma‘s gross margins and EBITDA margins (ex-Taro and one-off product opportunities) have improved in 4QFY14 and 1QFY15. Taro has also shown strong sequential revenue growth in 1QFY15 (ex-chargebacks in revenue) led by price hikes taken across products in June 2014. Ranbaxy reported material improvement in EBITDA margins in 1QFY15 largely led by better lower remediation costs and improvement in gross margins (up 128bps QoQ). Whilst we expect some pricing erosion at Taro from FY18E (2-3 years of lead time for competition to re-enter dermatology product), we incorporate the improvement in Sun’s and Ranbaxy’s base business into our medium-term projections.
Sun Pharma’s EBITDA margins have expanded
Excluding Taro and one-off product opportunities, Sun Pharma’s EBITDA margins have expanded by 1,232bps to 45.8% in 1QFY15 over 1QFY14. We believe that the improvement is a result of a mix of initiatives taken in the base business such as: (a) closure of Caraco’s Detroit facility (announced in May 2014); (b) re-launch of Caraco’s products (controlled substances) and URL’s products; (c) operating leverage in India and the US, and (d) higher INR realisation.
Excluding Taro and one-offs (Doxycyline), Sun’s Exhibit 3:EBITDA margins increased 12pps YoY
` mn Q1FY14 Q1FY15 YoY (%)
Total income 21923 31568 44%
Cost of Sales 3345 5066 51%
Gross profit 18578 26502 43%
Gross margin 84.7% 84.0% -79bps
Overheads 11240 12046 7%
EBITDA 7339 14456 97%
EBITDA margin 33.5% 45.8% 1232bps
Source: Company, Ambit Capital research
INR depreciation against the USD has aided Exhibit 4:EBITDA margin expansion for Sun Pharma
Source: Company, Ambit Capital research
Taro has taken price hikes across products
Taro reported 1QFY15 revenues of US$209mn (adjusted for charges on contractual obligations associated with price adjustments) and EBITDA of US$131mn. EBITDA margins increased 612bps sequentially (adjusted for charges on contractual obligations and write-back of contingencies). As the price hikes were taken in June and accounting for incremental sales of US$22mn (sequentially), we believe Taro is likely to report net sales of US$253mn in 2QFY15E and US$1,034mn for FY15E (ex-chargeback of US$79mn taken in 1QFY15) as compared to US$783mn in FY14 and EBITDA of US$175mn in 2QFY15 and US$700mn in FY15E (ex-chargebacks) vs US$495mn reported in FY14.
However, we expect some price erosion in Taro’s product portfolio over the medium term as competition (Sandoz’s Fougera and Actavis) steps back in the market attracted by higher pricing. Incumbents like Fougera and Actavis had earlier withdrawn products from the market largely due to low volumes and poor pricing. Since Taro has taken significant price hikes, these product segments are now more attractive and commercially viable for incumbents. However, as per our industry checks, incumbents might take 2-3 years to re-enter a product in the dermatology market in the US, due to various regulatory and manufacturing hurdles. Hence, we anticipate incremental competition to step in from FY18E, causing material price erosion in Taro’s product basket.
55.8
59.0 60.0 60.4 59.8 60.2
55.8
62.1 62.0 61.7 59.8 60.5
52.0 54.0 56.0 58.0 60.0 62.0 64.0
Q1
FY14
Q2
FY14
Q3
FY14
Q4
FY14
Q1
FY15
Q2
FY15
E
Cummulative exchange rate Spot Exchange Rate
Expect some pricing erosion at Taro from FY18E and medium term improvement in base business for Sun and Ranbaxy
Expect some price erosion in Taro’s product portfolio over the medium term as competition

Sun Pharmaceuticals
October 07, 2014 Ambit Capital Pvt. Ltd. Page 7
Weighted average price hike of 0.5x in 16 products contributing total of 13% Exhibit 5:to 4QFY14 US sales
Product Price as of 20 June 2014 / Price as of 30 May 2014
% revenue contribution in 4QFY14
Clobetasol propionate - external cream 6.55x 2.9%
Carbamazepine - tablet 6.01x 2.6%
Clobetasol propionate - external ointment 6.15x 2.4%
Fluocinonide - external cream 4.21x 1.6%
Phenytoin sodium - extended capsule 1.79x 1.5%
Clobetasol propionate - topical solution 3.63x 0.6%
Fluocinonide - external ointment 3.55x 0.6%
Carbamazepine - chewable tablet 3.06x 0.2% Clobetasol propionate/emoll - external cream 3.78x 0.2%
Hydrocortisone butyrate - external cream 1.70x 0.2% Fluocinonide/emollient base - external cream 3.26x 0.1%
Fluocinonide - topical gel 2.54x 0.1%
Hydrocortisone butyrate - external ointment 1.53x 0.1%
Clobetasol propionate - topical gel 7.31x 0.1%
Clotrimazole - topical solution 2.15x 0.1%
Hydrocortisone butyrate - topical solution 6.64x 0.0% Weighted average price increase / total contribution 0.5x 13%
Source: WK data, Ambit Capital research
Ranbaxy’s operational performance has improved even as FDA issues continue
For 1QFY15, Ranbaxy reported base business revenues of ` 23.7bn (down 10% YoY and 3% QoQ) in 1QFY15. Revenues from the US business declined 9% QoQ to `7bn. We believe that the decline was largely attributable to incremental competition in generic Caduet. Revenues from the domestic formulations business grew 17% YoY for the quarter vs an average 2% YoY growth over the past four quarters. Base business EBITDA margins improved 333bps QoQ to 9.5% led by lower remediation costs and improvement in gross margins (up 128bps QoQ).
We believe sustained growth momentum in the India business and improvement in base business EBITDA margins are largely a result of an improvement in product mix (lower API sales during the quarter due to voluntary halt at Dewas and Taonsa). Further, our primary data checks suggest that the Ranbaxy business managers have been on their toes since the announcement of acquisition by Sun Pharma, which in turn is reflecting in sales growth momentum in India and Western Europe, whilst other segment sales continue to be depressed due to various regulatory and structural issues.
Growth momentum in the India business and improvement in base business EBITDA margins are largely a result of an improvement in product mix for Ranbaxy

Sun Pharmaceuticals
October 07, 2014 Ambit Capital Pvt. Ltd. Page 8
Revenue mix Exhibit 6:
(̀ mn) 1QFY15 YoY (%) 2QCY13 QoQ (%) 5QFY14
North America 7,617 -11% 8,515 -10% 8,434
US 7,003 -9% 7,700 -9% 7,697
Canada 615 -25% 815 -17% 737
India 6,075 12% 5,426 10% 5,536
GHC 947 -8% 1,034 21% 783
India region 5,127 17% 4,392 8% 4,753
Europe and CIS 3,388 4% 3,261 -11% 3,786
Romania 1,682 9% 1,542 -8% 1,827
Russia 1,003 12% 896 -5% 1,053
Others 703 -15% 823 -22% 906
Western Europe 2,434 24% 1,958 -1% 2,452
APAC and LatAm 1,604 -23% 2,082 4% 1,547
APAC 1,142 -17% 1,383 27% 898
Sri Lanka 35 -56% 79 -64% 97
LATAM 428 -31% 620 -22% 552
Africa and ME 2,149 -24% 2,827 5% 2,049
API and Others 455 -80% 2,263 -18% 557
Total 23,722 -10% 26,332 -3% 24,361
Source: Company, Ambit Capital research
On the back of the acceleration in growth in the India business in 1QFY15, we raise our growth estimates from 7.3% CAGR over FY14-17E to 10%. We retain our growth estimates of 10% CAGR over the medium term (FY18E-27E) for the India business.
We continue to believe that Ranbaxy will monetise FTF Nexium
Ranbaxy has launched generic Diovan (API supplied by Divi’s Labs, formulation at Ohm Labs facility in US) and has gained a market share of more than 30%. We believe that the company would also be able to monetise the FTF Nexium opportunity (sales of US$210mn during 180 days exclusivity). Media reports of late suggest that various stakeholders have been writing to the FDA to forfeit Ranbaxy’s exclusivity either in the public interest or as per the statute.
Sun Pharma’s guidance of synergies at US$250mn by FY18E is conservative
We believe Sun Pharma’s acquisition of Ranbaxy almost mirrors Teva’s acquisition of Barr Pharma in 2008. Both acquisitions were primarily led by the rationale of gaining scale in the US and expanding presence in other markets.
Sun's Ranbaxy acquisition is similar to Teva's Barr acquisition owing to the rationale of the deals (US$ mn) Exhibit 7:
Year Acquirer Target Target's EV
Target's revenue
Target's EBITDA
Target's operating
costs
Synergy realised
Synergy realised as
% of cost
EV/(target EBITDA + synergy)
Rationale of acquisition
2003 Teva Ivax 7600 2020 325 1695 200 12% 14.5 Addition of respiratory portfolio to Teva's franchise; increasing scale of operations in the US
2008 Teva Barr 8800 2700 740 1960 500 26% 7.1 Gaining scale in the US and Central and Eastern Europe; acquiring Barr’s women health franchise in the US
2012 Watson Actavis 5600 2500 400 2100 300 14% 8.0 Gaining scale in Europe and RoW generics with some overlap in the US
2014 Sun Pharma Ranbaxy 4000 1800 175 1625 250 15% 9.4 Gaining scale in the US and India; expanding presence to RoW markets; acquiring Ranbaxy’s dermatology franchise in the US
Source: Company, Ambit Capital research
Expect Ranbaxy to monetize FTF Nexium (sales of US$210mn during 180 days exclusivity

Sun Pharmaceuticals
October 07, 2014 Ambit Capital Pvt. Ltd. Page 9
Deep diving into the source of synergies, we assess that Barr sourced ~75% of its revenues from the US and hence presumably ~75% of Barr’s operating costs largely overlapped with Teva, which itself had an established presence in the US. Hence, the realised synergies were ~35% of the operating cost overlap.
In case of Sun Pharma and Ranbaxy, Ranbaxy sources 50% of its revenues from the US and India, where Sun has an established presence. Ranbaxy’s cost base in the US and India, as per its disclosures in its FY13 annual report, is ~US$900mn. Hence, the stated guidance of US$250mn in synergy is ~28% of the operating cost overlap. Moreover, we highlight three factors that indicate that synergy as a percentage of operating cost overlap would be higher than Teva’s Barr acquisition:
a) Ranbaxy has a significant revenue-cost mismatch on its P&L: Barr was in the pink of health when it was acquired by Teva and hence, synergies were largely limited to operating cost rationalisation. Ranbaxy has four USFDA-approved manufacturing units that are not contributing meaningfully to sales and hence have a largely depressed sales profile. Hence, synergies from Ranbaxy would entail operating cost rationalisation in India and the US plus incremental EBITDA from removing the revenue-cost mismatch in the P&L. We expect a resolution of the consent decree over the next 12-24 months. Further, Ranbaxy currently incurs ~3% of sales (US$50mn-60mn) as costs to consultants. These costs would be rationalised once the consent decree is resolved.
b) Sun Pharma has spare capacity in manufacturing facilities outside India: Sun Pharma could derive some manufacturing cost synergies, as Ranbaxy’s disputed FDA units may be rationalised/disposed. With Sun possessing spare capacity through the acquisitions of Taro/URL/Caraco, Sun could manufacture Ranbaxy’s products at these units. Ranbaxy incurred manufacturing costs of ~US$100mn in CY13. The Teva-Barr acquisition did not involve rationalisation of manufacturing units.
c) India business has high costs associated to sales representatives: Sun Pharma has ~4,000 sales reps in India whilst Ranbaxy has ~5,300 reps. With the combined entity having more than 9,300 reps in India, we would expect some rationalisation in reps and managers in India, leading to cost synergies that did not benefit the Teva-Barr transaction.
We pencil in synergies of US$250mn by FY18E, in line with the management guidance. However, we believe that there is a material upside risk to these estimates for the reasons cited above.
Stated guidance of US$250mn in synergy is ~28% of the operating cost overlap
Material upside risk to the management guidance of US$250mn synergies

Sun Pharmaceuticals
October 07, 2014 Ambit Capital Pvt. Ltd. Page 10
Key assumptions Financial assumptions for the combined entity Exhibit 8:
` mn New estimates Old estimates Change
Particulars FY15E FY16E FY15E FY16E FY15E FY16E Comments
Sales assumptions
India sales (including OTC) 40,865 78,934 41,263 78,413 -1% 1% Expect growth momentum to continue at higher than the broader market for Sun's portfolio. FY16E numbers include Ranbaxy's sales in India (including OTC).
US sales 113,280 172,188 106,617 166,555 6% 3% Incorporating price hikes taken by Taro in US sales leads to upward revision in estimates.
RoW sales 22,280 83,071 24,305 86,896 -8% -4% Adjusting for lack of ramp up in RoW sales for Sun Pharma and Taro.
API and others 8,751 18,009 8,255 17,463 6% 3% Marginally increasing estimates based on reported 1QFY15.
Total sales 185,226 352,252 180,490 349,377 3% 1%
Gross profits 152,076 265,827 143,080 257,894 6% 3% We pencil in improvement in gross margins led by Taro price hikes and improvement in Sun's base business.
Overhead costs 70,637 143,021 71,566 151,028 -1% -5%
Overhead cost estimates stand reduced driven by Sun's disclosure of one offs in FY14 other expenses. Annual report suggests 99% YoY growth to `11.8bn in selling and distribution costs for FY14 and forex loss of `1.9bn.
EBITDA 81,439 122,806 71,515 106,866 14% 15% EBITDA margin improvement largely led by improvement in gross margins and lower-than-expected overhead costs.
EBITDA margins (%) 44.0% 34.9% 39.6% 30.6%
PAT 57,768 80,536 52,740 70,643 10% 14% PAT revision lower than EBITDA revision largely due to higher minority interest payments to Taro shareholders.
CFO 43,054 90,098 54,174 82,628 -21% 9% FY15E CFO stands reduced as debtor days are likely to normalise from 50 days in FY14 to 80 days in FY15.
R&D 10,279 16,649 10,126 16,759 2% -1% No significant change in our R&D spend expectations.
Source: Ambit Capital research

Sun Pharmaceuticals
October 07, 2014 Ambit Capital Pvt. Ltd. Page 11
Financial assumptions for Ranbaxy Exhibit 9:` mn New estimates Old estimates Change
Particulars FY15E FY16E FY15E FY16E FY15E FY16E Comments
Sales assumptions
India sales (including OTC) 30,084 33,342 28,944 31,609 4% 5%
Expect 10% CAGR over FY14-17E for prescription business to remain below the broader market led by high acute presence. Expect OTC revenues to grow in mid-teens.
US base sales 31,702 36,481 31,702 36,481 0% 0%
Growth in FY14E in base business largely led by ramp up in Absorica. Expect slowdown in FY15E as Absorica sales form a part of the base. We pencil in resolution of consent decree in FY16E leading to some acceleration in base business growth. Competition in Caduet to partially set off growth in other products.
RoW sales (Europe + EMs) 51,502 56,935 51,502 57,975 0% -2% We pencil in acceleration in RoW market growth for Ranbaxy in FY16E as we believe it is a low hanging fruit.
API and others 7,621 8,383 7,621 8,383 0% 0% We do not anticipate any acceleration in API sales.
Total sales 146,508 135,141 151,668 134,448 -3% 1% FY16E sales seem depressed due to high exclusivity sales in FY15E (Nexium, Valcyte and Diovan).
Gross profits 98,974 86,713 103,887 84,979 -5% 2%
We are tweaking our estimates for FY15E given the secondary data on generic Diovan. Ranbaxy's market share has been marginally below our estimates which would have an adverse impact on gross profit. FY16E estimates increase due to increase in India revenues.
Overhead costs 61,026 61,043 64,768 68,575 -6% -11% Ranbaxy has shown cost control in 1QFY15 and we expect the trend to persist. Hence, our cost estimates stand reduced by 6-11% for FY15-16E.
EBITDA 37,948 25,670 39,119 16,404 -3% 56%
Whilst FY15E EBITDA estimates are adversely impacted due to Diovan performance, FY16E EBITDA estimates are revised upwards due to better cost control and higher India sales. The delta in EBITDA appears high due to small base.
EBITDA margins (%) 25.9% 19.0%
We expect resolution of FDA issues in FY16E and hence pencil in EBITDA margins of 19%. Our EBITDA margin estimates for FY18E is at 25% implying synergies of US$250mn, in line with management guidance.
Source: Ambit Capital research
Financial assumptions for Taro Exhibit 10:US$ mn New estimates Old estimates Change
Particulars FY15e FY16e FY15e FY16e FY15e FY16e Comments
Sales assumptions
US sales 934 1,024 774 774 21% 32% Taro took price hikes in June 2014 as per secondary audit data. Whilst 1QFY15 sales were muted due to US$79mn chargebacks (generally associated with price hikes), sales growth from 2QFY15 should improve.
RoW sales 100 110 100 110 0% 0% No change in RoW estimates. We believe that the segment could outperform our expectations dependant on the success of Ranbaxy acquisition.
Total sales 1,034 1,134 874 884 18% 28% Upward revision fuelled by price hikes in the US.
Gross profits 913 986 726 718 26% 37% Upward revision fuelled by price hikes in the US.
Overhead costs 216 234 206 209 5% 12% Taro has increased spend on SG&A and R&D. We incorporate the same in o our estimates.
EBITDA 697 752 520 509 34% 48% EBITDA margin expansion fuelled by price hikes. EBITDA margins (%) 67.4% 66.3%
Source: Ambit Capital research

Sun Pharmaceuticals
October 07, 2014 Ambit Capital Pvt. Ltd. Page 12
Ambit vs consensus Our numbers are not strictly comparable as it seems that majority of the street is yet to consolidate Ranbaxy’s financials with Sun Pharma.
Our numbers are not strictly comparable as it seems that majority of the Exhibit 11:street is yet to consolidate Ranbaxy’s financials with Sun Pharma
Particulars (̀ m) Ambit Consensus Delta (%)
Sales FY15E 185226 184544 0%
FY16E 352252 228844 54%
FY17E 391126 243366 61%
EBITDA FY15E 81439 82479 -1%
FY16E 122806 97348 26%
FY17E 143106 109941 30%
Net profit FY15E 57768 62283 -7%
FY16E 84896 73896 15%
FY17E 103076 84375 22%
Source: Ambit Capital research

Sun Pharmaceuticals
October 07, 2014 Ambit Capital Pvt. Ltd. Page 13
Valuations rich but justifiably so Excellence in execution and strong track record lend comfort on rich valuations
The company is amongst the better-managed pharma companies in India. The company’s business appears to be robust, with high bargaining power with buyers and suppliers due to its significant presence in limited competition segments. The ranking on our DNA framework and 5’R’ framework leads us to believe that the company deserves a premium valuation versus peers.
The stock is currently trading at ~27.5x one-year forward EPS (adjusting for one-off value attributed to the imatinib opportunity). We concede that the valuations are comparatively rich but we argue that the same is supported by excellence in execution (track record), high cash flow generation, strong balance sheet, high RoE and scaling up the value chain. With enough levers to drive growth in the near to medium term, we believe the earnings momentum will sustain.
Valuation methodology
We value Sun Pharma using a DCF methodology wherein the EBITDA margin, medium-term revenue growth rate and terminal revenue growth rate are the key variables controlling the valuation. Furthermore, we use a free cash flow to equity methodology given that Sun Pharma is a net cash company.
Owing to the various dynamics of its operating segments, we undertake a SOTP valuation for: (a) US generics business, (b) India branded generics business, and (c) Other businesses (RoW formulations business and API business).
We value the stock at `979/share (our 12-month forward target price), which implies ~26.7x one-year forward EPS excluding the one-off value of `2/share for the Imatinib opportunity. We retain our BUY stance.
Three-stage valuation model: We have valued Sun Pharma using the two-stage free cash (FCFE) model:
High-growth period (FY15E-18E)
Stable-growth period (FY18E-27E)
Terminal growth period (FY27E onwards)
We tabulate our assumptions for each of the business segments below. We also present sensitivities to our growth assumptions.
We value Sun Pharma using a SOTP DCF methodology Exhibit 12:
Key assumptions US$ business India business Other businesses
Remarks (USD m) (INR m) (INR m)
Discount rate 12.5% 12.5% 12.5% Cost of equity
Terminal growth rate 3.0% 5.0% 7.0% Population growth rate + increasing penetration + medical insurance penetration + pricing
Medium term growth rate 10.1% 13.4% 14.5% RoW business is on a very small base; India growth above broader market; expect slowdown in US in absence of visibility on longer term growth drivers
EBITDA margins (FY15e) 56.5% 31.5% 14.7% US margins high due to Doxil, Prandin and doxycycline. Other businesses margins depressed due to small base and high overheads
EBITDA margins (FY29e) 43.9% 37.4% 40.0%
US margins to normalise but remain on the higher side due to niche segment presence. India and other businesses margins to increase due to operating leverage.
Total Enterprise Value 12,022 426,626 1,078,734
Terminal Value 4,381 222,447 771,606 Terminal value as % of total 36.0% 52.0% 72.0%
Source Ambit Capital research
Valuations are comparatively rich but we argue that the same is supported by excellence in execution (track record), high cash flow generation and high RoE

Sun Pharmaceuticals
October 07, 2014 Ambit Capital Pvt. Ltd. Page 14
Our 12-month forward target price is ̀ 979/share Exhibit 13:
Particulars ` mn Total EV 2,226,697 Net cash (FY17e) 137,539 Equity Value 2,364,236 Value / share 979
CMP 836 Upside / Downside 17.1% FY14 FY15E FY16E FY17E
Implied PE 39.1 35.0 29.3 24.2
Current PE 33.4 29.9 25.0 20.6
Source: Ambit Capital research
Cross-cycle valuation Sun Pharma has historically traded at 15.0-20.0x one-year forward EPS. The spike in P/E multiples over FY09-10 was led by depressed earnings largely due to FDA issues at Caraco. Over the past 12 months, the stock has re-rated to 20.0-28.0x one-year forward EPS. We assess that the re-rating over the past 12 months was largely due to the Ranbaxy, Taro and URL acquisitions. Whilst the latter two have driven earnings growth in the past 12 months, Ranbaxy will lead inorganic growth in the near future combined with Taro’s price hikes.
The stock has traded in a P/E band of 20.0x-Exhibit 14:28.0x over the last 12 months
Source: Company, Bloomberg, Ambit Capital research
Sun Pharma has traded in the band of 10-18x Exhibit 15:EV/EBITDA in the recent past
Source: Company, Bloomberg, Ambit Capital research
Price
10x
20x
30x
0100200300400500600700800900
1000
Mar
-05
Mar
-06
Mar
-07
Mar
-08
Mar
-09
Mar
-10
Mar
-11
Mar
-12
Mar
-13
Mar
-14
Sun Price Band chart
5.007.009.00
11.0013.0015.0017.0019.0021.0023.0025.00
Mar
-05
Mar
-06
Mar
-07
Mar
-08
Mar
-09
Mar
-10
Mar
-11
Mar
-12
Mar
-13
Mar
-14
One yr EV/EBITDA average of 14.8x

Sun Pharmaceuticals
October 07, 2014 Ambit Capital Pvt. Ltd. Page 15
RoE and PAT growth for FY14 adversely Exhibit 16:impacted by Protonix penalty of US$550mn
Source: Company, Ambit Capital research
Healthy EBITDA and RoCE over the past three Exhibit 17:years have led a re-rating of the stock
Source: Company, Ambit Capital research
Premium to local and global peers to remain
Whilst Sun trades at a premium to Dr. Reddy’s and Lupin, we believe that going forward, the premium would decline as Ranbaxy is consolidated and synergies are realised.
Sun’s premium valuations compared to global peers like Teva, would remain at a premium as a) Sun generates RoCE of 35-40% compared to Teva’s low double digits; b) Sun’s expected growth is higher at 20-30% CAGR compared to Teva’s single digit growth; c) Sun’s management structure calls for a lower agency cost compared to Teva which is completely fund owned.
On consensus estimates, Cipla is trading at a higher multiple compared to Sun Pharma for FY16E largely due to expectations from Cipla’s European respiratory portfolio.
Relative valuation summary Exhibit 18:
CMP Rating Consensus
TP
Upside Mcap EV/EBITDA (x) P/E (x) EV/Sales (x) CAGR (FY14-16) ROE (%)
(%) US$ mn FY14 FY15 FY16 FY15 FY16 FY15 FY16 EBITDA EPS FY14 FY15 FY16
Large caps
Sun Pharma* 836 BUY 979 17 28,666 23.2 20.1 15.8 30.0 23.8 8.9 5.5 31 19 19 28 31
Lupin* 1,396 BUY 1,387 (1) 10,189 18.9 14.4 12.4 25.8 22.9 4.1 3.4 21 22 30 31 27
Dr. Reddy's* 3,208 BUY 3,149 (2) 8,978 16.2 14.3 12.3 24.3 21.2 3.5 3.0 12 11 26 23 21
Cipla 617 NR 547 (11) 8,159 23.7 21.0 16.9 33.6 25.7 4.4 3.8 19 19 15 14 16
GSK Pharma 2,764 NR 2,296 (17) 3,863 NA 30.8 25.2 39.5 35.3 7.1 6.5 NA NA NA 29 32
Aurobindo Pharma* 947 SELL 828 (13) 4,618 15.0 12.7 10.1 17.5 14.0 2.7 2.2 16 24 37 35 32
Cadila* 1,330 BUY 1,510 14 4,457 24.7 18.9 14.2 27.4 19.6 3.6 2.8 30 30 25 26 29
Ranbaxy 627 NR 563 (10) 4,391 NA 14.3 18.4 24.1 30.4 2.4 2.4 NA NA NA 29 17
Divi's Laboratories 1,791 NR 1,640 (8) 3,889 23.1 19.2 16.0 26.5 21.9 7.7 6.5 20 19 28 28 28
Glenmark 717 NR 735 3 3,223 20.3 14.6 12.3 23.0 18.6 3.2 2.7 29 40 19 25 24
Average 20.6 18.0 15.3 27.2 23.3 4.7 3.9
Source: Company, Bloomberg, Ambit Capital research; Note: * indicates Ambit Capital estimates
0%
10%
20%
30%
40%
50%
-40%
-20%
0%
20%
40%
60%
80%
100%
FY05
FY06
FY07
FY08
FY09
FY10
FY11
FY12
FY13
FY14
PAT growth (LHS) RoE (RHS)
0%
10%
20%
30%
40%
50%
-50%
0%
50%
100%
150%
FY05
FY06
FY07
FY08
FY09
FY10
FY11
FY12
FY13
FY14
EBITDA growth (LHS) RoCE (RHS)

Sun Pharmaceuticals
October 07, 2014 Ambit Capital Pvt. Ltd. Page 16
Key risks to our investment thesis (a) Regulatory issues: Sun Pharma recently faced an FDA issue at its Karkhadi facility. As per media reports, the company’s Halol unit has undergone inspection and received a Form 483 detailing 23 issues which are mild in nature. We believe Halol is the largest US exporting plant for Sun Pharma and any escalation of issues at the plant could have a material adverse impact on target price and earnings outlook.
(b) Worse-than-expected pricing environment in the US: We assume a decline in the base business pricing for Caraco, Taro and URL in the US. This assumption is led by expectations of high approvals for competitors in the base business partly offset by increased FDA vigilance, keeping very small players out of the market.
(c) INR appreciation against USD: Sun Pharma has been a beneficiary of the INR depreciation against the USD. However, in the event of a reversal in trend, we assess that the company’s profits would decline by 1% for every 1% appreciation in the INR beyond the `60/USD levels.
(d) Other interests of management: Sun’s promoters have more directorships other than Sun Pharma and its subsidiaries. Other business interests create scope for a diversion in management focus and potential corporate governance issues. We assign an AMBER flag to Sun Pharma in this context, as the acquisition of a stake in Ranbaxy by Silverstreet, which had Sudhir Valia on its Board, raises questions on the company’s disclosure practices.
Catalysts (a) Price hikes in Taro and/or URL: Whilst we have assumed decline in Taro’s pricing over the medium term on the current base, further price hikes cannot be ruled out. The varying competitive landscape and size of products which have seen price hikes makes it difficult to assess the scope for similar hikes in future.
(b) Resolution of FDA issues at Ranbaxy: We expect resolution in 24 months. Resolution of FDA issues would aid in base business ramp up at Ranbaxy and address the revenue – cost mismatch in P&L.
(c) Unknown large filings in the US: We have taken a top-down approach for the unknown filings in the US at an average revenue rate of US$8mn per ANDA. However, as seen in the past, there is always an upside risk to such assumptions, as more complex and already off-patent products do not come under our radar.
(d) Progress on NDDS-based products in developed markets: Given the recent development disappointments, we do not pencil in any significant upside from SPARC’s NDDS-based products for Sun Pharma in developed markets. However, SPARC has stated that these products are not withdrawn and the company is working with regulatory bodies to understand the path ahead. Hence, an upside from these initiatives cannot be ruled out.
Our INR assumptions and sensitivity of target price to fundamental assumptions We have penciled in `60/USD for FY15E and beyond. Our sensitivity analysis suggests that for every percentage point appreciation/depreciation in the INR/USD, Sun Pharma’s net profit decreases/increases by 1%.
Sensitivity of our target price to terminal growth and EBITDA margins Exhibit 19:Target price Terminal growth rate
3.8% 4.8% 5.8% 6.8% 7.8%
Med
ium
ter
m
EBIT
DA
m
arg
in
35.8% 761 809 871 954 1,074 37.8% 808 859 925 1,014 1,141 39.8% 855 909 979 1,074 1,209 41.8% 903 960 1,034 1,134 1,276 43.8% 950 1,010 1,088 1,193 1,344
Source: Ambit Capital research

Sun Pharmaceuticals
October 07, 2014 Ambit Capital Pvt. Ltd. Page 17
Explanation for the flags on the cover page Exhibit 20:
Field Score Comments
Accounting GREEN
In our forensic analysis of 360 companies, Sun Pharma scores above the pharma industry average (comprising 26 companies). Sun Pharma scores high on ratios of: (a) CFO/EBITDA; (b) FCF to revenues; (c) change in reserves to retained earnings and (d) audit fees as a percentage of auditor’s remuneration. However, Sun has weaker scores on: (a) volatility in selling and distribution costs; and (b) fixed asset turnover.
Predictability AMBER Overall, the management has made timely announcements in its earnings calls, meetings and interviews regarding product filings, acquisitions and business outlook. However, the predictability remains moderate due to the highly acquisitive intent of the company.
Earnings momentum GREEN Consensus FY15 EBITDA and EPS estimates have been upgraded by 4-6% and FY16 EBITDA and EPS estimates have been upgraded by 5-7% over the past three months.
Source: Bloomberg, Ambit Capital research

Sun Pharmaceuticals
October 07, 2014 Ambit Capital Pvt. Ltd. Page 18
Revenue Mix
Year to March (in ̀ mn) FY13 FY14 FY15E FY16E FY17E
Sun Pharma Domestic 29,657 36,918 43,145 49,996 57,943
US 29,574 57,401 57,228 74,255 93,861
RoW 10,759 13,659 16,280 19,536 23,443
API 7,622 8,149 8,801 9,677 10,639
Ranbaxy (consolidated from FY16E) Domestic 25,394 27,151 30,084 33,342 36,964
US 50,281 30,820 57,301 36,481 33,266
RoW 44,630 47,207 51,502 56,935 62,753
API 6,034 6,975 7,621 8,383 9,221
Taro US 31,964 40,443 56,052 61,452 60,252
RoW 4,512 5,425 6,000 6,600 7,800
Consolidated sales 114,087 161,995 187,506 356,657 396,142
Source: Company, Ambit Capital research
Income statement Year to March (in ̀ mn) FY13 FY14 FY15E FY16E FY17E
Net revenues 112,389 160,044 185,226 352,252 391,126
Material cost 20,733 27,793 33,150 86,425 94,212
Employee cost 13,051 17,299 19,034 43,088 46,770
Other Mfg cost 29,465 43,787 51,603 99,933 107,038
Core EBITDA 49,139 71,165 81,439 122,806 143,106
Depreciation 3,362 4,094 4,718 9,848 10,739
Interest expense 432 442 802 4,490 4,490
Adjusted PBT 43,149 45,812 79,844 113,004 133,755
Tax 8,456 7,022 11,977 16,951 20,063
Reported net profit 29,831 31,415 57,768 84,896 103,076
Source: Company, Ambit Capital research
Balance sheet
Year to Mar (in ̀ mn) FY13 FY14 FY15E FY16E FY17E
Total Assets 205,827 293,708 350,030 558,181 650,126
Fixed Assets 50,771 58,242 62,524 124,225 132,487
Current Assets 110,434 177,393 229,433 375,160 458,844
Investments 24,116 27,860 27,860 28,583 28,583
Total Liabilities 205,827 293,708 350,030 558,181 650,126
Shareholders' equity 1,036 2,071 2,071 2,414 2,414
Reserves & Surplus 148,862 183,178 228,781 322,011 410,963
Total networth 149,897 185,250 230,852 324,425 413,378
Total debt 2,597 25,609 25,609 91,587 91,587
Current liabilities 34,928 60,882 71,600 119,496 122,248
Deferred tax liability 2,054 2,757 2,757 2,124 2,124
Source: Company, Ambit Capital research

Sun Pharmaceuticals
October 07, 2014 Ambit Capital Pvt. Ltd. Page 19
Cash flow statement
Year to March (in ̀ mn) FY13 FY14 FY15E FY16E FY17E
PBT 43,149 45,812 79,844 113,004 133,755
Depreciation 3,362 4,092 4,718 9,848 10,739
Tax (10,735) (7,889) (11,977) (17,584) (20,063)
Net Working Capital (2,210) (2,423) (29,531) (15,170) (20,665)
CFO 33,566 39,592 43,054 90,098 103,765
Capital Expenditure (8,591) (9,149) (9,000) (15,000) (19,000)
Investment (3,695) (16,679) - - -
Other investments (14,337) 1,982 2,767 3,376 4,718
CFI (26,623) (23,846) (6,233) (11,624) (14,282)
Issuance of Equity 357 182 - - -
Inc/Dec in Borrowings (749) 22,749 - - -
Net Dividends (5,115) (6,054) (12,165) (14,123) (14,123)
Other Financing activities (1,144) (11,811) (10,901) (14,309) (14,865)
CFF (6,650) 5,067 (23,067) (28,432) (28,989)
Net change in cash 293 20,813 13,754 50,042 60,494
Closing cash balance 40,587 75,902 89,656 140,049 200,544
FCF 24,975 30,443 34,054 75,098 84,765
Source: Company, Ambit Capital research
Valuation Parameters Year to March (in ̀ mn) FY13 FY14 FY15E FY16E FY17E
EPS 14.4 15.2 27.9 35.2 42.7
Book Value ( per share) 72.4 89.4 111.5 134.4 171.2
P/E (x) 58.0 55.1 30.0 23.8 19.6
P/BV (x) 11.6 9.3 7.5 6.2 4.9
EV/EBITDA(x) 34.0 23.2 20.1 15.8 13.1
EV/Sales (x) 14.9 10.3 8.9 5.5 4.8
EV/EBIT (x) 38.9 36.3 20.7 14.3 11.7
Source: Company, Ambit Capital research
Ratios Year to March (in ̀ mn) FY13 FY14 FY15E FY16E FY17E
Revenue growth 40.4 42.4 15.7 90.2 11.0
Core EBITDA growth 51.0 44.8 14.4 50.8 16.5
APAT growth 14.0 11.8 75.0 41.5 18.4
EPS growth 12.3 5.3 83.9 26.1 21.4
Core EBITDA margin 48.5 49.7 48.9 39.1 40.8
EBIT margin 38.8 28.9 43.5 33.4 35.3
Net profit margin 26.5 19.6 31.2 24.1 26.4
ROCE (%) 35.5 39.3 34.5 34.9 30.0
Reported RoE (%) 21.9 18.7 27.8 30.6 27.9
Debt Equity ratio (X) 0.0 0.1 0.1 0.3 0.2
Current Ratio 3.2 2.9 3.2 3.1 3.8
CFO/EBITDA (x) 0.7 0.6 0.5 0.7 0.7
Gross Block turnover (x) 1.8 2.0 2.1 2.4 1.9
Working Capital Turnover (x) 1.6 1.7 1.4 1.7 1.3
Source: Company, Ambit Capital research

Sun Pharmaceuticals
October 07, 2014 Ambit Capital Pvt. Ltd. Page 20
Institutional Equities Team Saurabh Mukherjea, CFA CEO, Institutional Equities (022) 30433174 [email protected]
Research
Analysts Industry Sectors Desk-Phone E-mail
Nitin Bhasin - Head of Research E&C / Infra / Cement / Industrials (022) 30433241 [email protected]
Aadesh Mehta Banking / Financial Services (022) 30433239 [email protected]
Achint Bhagat Cement / Infrastructure (022) 30433178 [email protected]
Aditya Khemka Healthcare (022) 30433272 [email protected]
Ashvin Shetty, CFA Automobile (022) 30433285 [email protected]
Bhargav Buddhadev Power Utilities / Capital Goods (022) 30433252 [email protected]
Dayanand Mittal, CFA Oil & Gas / Metals & Mining (022) 30433202 [email protected]
Deepesh Agarwal Power Utilities / Capital Goods (022) 30433275 [email protected] Gaurav Mehta, CFA Strategy / Derivatives Research (022) 30433255 [email protected]
Karan Khanna Strategy (022) 30433251 [email protected]
Krishnan ASV Real Estate (022) 30433205 [email protected]
Pankaj Agarwal, CFA Banking / Financial Services (022) 30433206 [email protected]
Paresh Dave Healthcare (022) 30433212 [email protected]
Parita Ashar Metals & Mining / Oil & Gas (022) 30433223 [email protected]
Rakshit Ranjan, CFA Consumer / Retail (022) 30433201 [email protected]
Ravi Singh Banking / Financial Services (022) 30433181 [email protected]
Ritesh Gupta, CFA Midcaps – Chemical / Retail (022) 30433242 [email protected]
Ritesh Vaidya Consumer (022) 30433246 [email protected] Ritika Mankar Mukherjee, CFA Economy / Strategy (022) 30433175 [email protected]
Ritu Modi Automobile (022) 30433292 [email protected]
Sagar Rastogi Technology (022) 30433291 [email protected]
Sumit Shekhar Economy / Strategy (022) 30433229 [email protected]
Tanuj Mukhija, CFA E&C / Infra / Industrials (022) 30433203 [email protected]
Utsav Mehta Technology (022) 30433209 [email protected]
Sales
Name Regions Desk-Phone E-mail
Sarojini Ramachandran - Head of Sales UK +44 (0) 20 7614 8374 [email protected]
Deepak Sawhney India / Asia (022) 30433295 [email protected]
Dharmen Shah India / Asia (022) 30433289 [email protected]
Dipti Mehta India / USA (022) 30433053 [email protected]
Hitakshi Mehra India (022) 30433204 [email protected]
Nityam Shah, CFA USA / Europe (022) 30433259 [email protected]
Parees Purohit, CFA UK / USA (022) 30433169 [email protected]
Praveena Pattabiraman India / Asia (022) 30433268 [email protected]
Production
Sajid Merchant Production (022) 30433247 [email protected]
Sharoz G Hussain Production (022) 30433183 [email protected]
Joel Pereira Editor (022) 30433284 [email protected]
Nikhil Pillai Database (022) 30433265 [email protected]
E&C = Engineering & Construction

Sun Pharmaceuticals
October 07, 2014 Ambit Capital Pvt. Ltd. Page 21
Explanation of Investment Rating Investment Rating Expected return
(over 12-month period from date of initial rating)
Buy >5%
Sell <5%
Disclaimer
This report or any portion hereof may not be reprinted, sold or redistributed without the written consent of Ambit Capital. AMBIT Capital Research is disseminated and available primarily electronically, and, in some cases, in printed form.
Additional information on recommended securities is available on request.
Disclaimer 1. AMBIT Capital Private Limited (“AMBIT Capital”) and its affiliates are a full service, integrated investment banking, investment advisory and brokerage group. AMBIT Capital is a Stock Broker, Portfolio
Manager and Depository Participant registered with Securities and Exchange Board of India Limited (SEBI) and is regulated by SEBI 2. The recommendations, opinions and views contained in this Research Report reflect the views of the research analyst named on the Research Report and are based upon publicly available information
and rates of taxation at the time of publication, which are subject to change from time to time without any prior notice. 3. AMBIT Capital makes best endeavours to ensure that the research analyst(s) use current, reliable, comprehensive information and obtain such information from sources which the analyst(s) believes to
be reliable. However, such information has not been independently verified by AMBIT Capital and/or the analyst(s) and no representation or warranty, express or implied, is made as to the accuracy or completeness of any information obtained from third parties. The information or opinions are provided as at the date of this Research Report and are subject to change without notice.
4. If you are dissatisfied with the contents of this complimentary Research Report or with the terms of this Disclaimer, your sole and exclusive remedy is to stop using this Research Report and AMBIT Capital shall not be responsible and/ or liable in any manner.
5. If this Research Report is received by any client of AMBIT Capital or its affiliate, the relationship of AMBIT Capital/its affiliate with such client will continue to be governed by the terms and conditions in place between AMBIT Capital/ such affiliate and the client.
6. This Research Report is issued for information only and should not be construed as an investment advice to any recipient to acquire, subscribe, purchase, sell, dispose of, retain any securities. Recipients should consider this Research Report as only a single factor in making any investment decisions. This Research Report is not an offer to sell or the solicitation of an offer to purchase or subscribe for any investment or as an official endorsement of any investment.
7. If 'Buy', 'Sell', or 'Hold' recommendation is made in this Research Report such recommendation or view or opinion expressed on investments in this Research Report is not intended to constitute investment advice and should not be intended or treated as a substitute for necessary review or validation or any professional advice. The views expressed in this Research Report are those of the research analyst which are subject to change and do not represent to be an authority on the subject. AMBIT Capital may or may not subscribe to any and/ or all the views expressed herein.
8. AMBIT Capital makes no guarantee, representation or warranty, express or implied; and accepts no responsibility or liability as to the accuracy or completeness or currentess of the information in this Research Report. AMBIT Capital or its affiliates do not accept any liability whatsoever for any direct or consequential loss howsoever arising, directly or indirectly, from any use of this Research Report.
9. Past performance is not necessarily a guide to evaluate future performance. 10. AMBIT Capital and/or its affiliates (as principal or on behalf of its/their clients) and their respective officers directors and employees may hold positions in any securities mentioned in this Research
Report (or in any related investment) and may from time to time add to or dispose of any such securities (or investment). Such positions in securities may be contrary to or inconsistent with this Research Report.
11. This Research Report should be read and relied upon at the sole discretion and risk of the recipient. 12. The value of any investment made at your discretion based on this Research Report or income therefrom may be affected by changes in economic, financial and/ or political factors and may go down as
well as up and you may not get back the full or the expected amount invested. Some securities and/ or investments involve substantial risk and are not suitable for all investors. 13. This Research Report is being supplied to you solely for your information and may not be reproduced, redistributed or passed on, directly or indirectly, to any other person or published, copied in whole
or in part, for any purpose. Neither this Research Report nor any copy of it may be taken or transmitted or distributed, directly or indirectly within India or into any other country including United States (to US Persons), Canada or Japan or to any resident thereof. The distribution of this Research Report in other jurisdictions may be strictly restricted and/ or prohibited by law or contract, and persons into whose possession this Research Report comes should inform themselves about such restriction and/ or prohibition, and observe any such restrictions and/ or prohibition.
14. Neither AMBIT Capital nor its affiliates or their respective directors, employees, agents or representatives, shall be responsible or liable in any manner, directly or indirectly, for views or opinions expressed in this Report or the contents or any errors or discrepancies herein or for any decisions or actions taken in reliance on the Report or inability to use or access our service or this Research Report or for any loss or damages whether direct or indirect, incidental, special or consequential including without limitation loss of revenue or profits that may arise from or in connection with the use of or reliance on this Research Report or inability to use or access our service or this Research Report.
Conflict of Interests 15. In the normal course of AMBIT Capital’s business circumstances may arise that could result in the interests of AMBIT Capital conflicting with the interests of clients or one client’s interests conflicting with
the interest of another client. AMBIT Capital makes best efforts to ensure that conflicts are identified and managed and that clients’ interests are protected. AMBIT Capital has policies and procedures in place to control the flow and use of non-public, price sensitive information and employees’ personal account trading. Where appropriate and reasonably achievable, AMBIT Capital segregates the activities of staff working in areas where conflicts of interest may arise. However, clients/potential clients of AMBIT Capital should be aware of these possible conflicts of interests and should make informed decisions in relation to AMBIT Capital’s services.
16. AMBIT Capital and/or its affiliates may from time to time have investment banking, investment advisory and other business relationships with companies covered in this Research Report and may receive compensation for the same. Research analysts provide important inputs into AMBIT Capital’s investment banking and other business selection processes.
17. AMBIT Capital and/or its affiliates may seek investment banking or other businesses from the companies covered in this Research Report and research analysts involved in preparing this Research Report may participate in the solicitation of such business.
18. In addition to the foregoing, the companies covered in this Research Report may be clients of AMBIT Capital where AMBIT Capital may be required, inter alia, to prepare and publish research reports covering such companies and AMBIT Capital may receive compensation from such companies in relation to such services. However, the views reflected in this Research Report are objective views, independent of AMBIT Capital’s relationship with such company.
19. In addition, AMBIT Capital may also act as a market maker or risk arbitrator or liquidity provider or may have assumed an underwriting commitment in the securities of companies covered in this Research Report (or in related investments) and may also be represented in the supervisory board or on any other committee of those companies.
Additional Disclaimer for U.S. Persons 20. The research report is solely a product of AMBIT Capital 21. AMBIT Capital is the employer of the research analyst(s) who has prepared the research report 22. Any subsequent transactions in securities discussed in the research reports should be effected through J.P.P. Euro-Securities, Inc. (“JPP”). 23. JPP does not accept or receive any compensation of any kind for the dissemination of the AMBIT Capital research reports. 24. The research analyst(s) preparing the research report is resident outside the United States and is/are not associated persons of any U.S. regulated broker-dealer and that therefore the analyst(s) is/are
not subject to supervision by a U.S. broker-dealer, and is/are not required to satisfy the regulatory licensing requirements of FINRA or required to otherwise comply with U.S. rules or regulations regarding, among other things, communications with a subject company, public appearances and trading securities held by a research analyst account.
Additional Disclaimer for Canadian Persons 25. AMBIT Capital is not registered in the Province of Ontario and /or Province of Québec to trade in securities nor is it registered in the Province of Ontario and /or Province of Québec to provide advice
with respect to securities. 26. AMBIT Capital's head office or principal place of business is located in India. 27. All or substantially all of AMBIT Capital's assets may be situated outside of Canada. 28. It may be difficult for enforcing legal rights against AMBIT Capital because of the above. 29. Name and address of AMBIT Capital's agent for service of process in the Province of Ontario is: Torys LLP, 79 Wellington St. W., 30th Floor, Box 270, TD South Tower, Toronto, Ontario M5K 1N2
Canada. 30. Name and address of AMBIT Capital's agent for service of process in the Province of Montréal is Torys Law Firm LLP, 1 Place Ville Marie, Suite 1919 Montréal, Québec H3B 2C3 Canada.
© Copyright 2014 AMBIT Capital Private Limited. All rights reserved.
Ambit Capital Pvt. Ltd. Ambit House, 3rd Floor 449, Senapati Bapat Marg, Lower Parel, Mumbai 400 013, India. Phone: +91-22-3043 3000 Fax: +91-22-3043 3100 CIN: U74140MH1997PTC107598 www.ambitcapital.com