compact soft x-ray microscopy: image processing and
TRANSCRIPT

Compact Soft X-Ray Microscopy:Image Processing and Instrumentation
HEIDE STOLLBERG
PhD ThesisDepartment of Applied PhysicsRoyal Institute of Technology
Stockholm, Sweden 2006

TRITA-FYS 2006:60ISSN 0280-316XISRN KTH/FYS/--06:60--SEISBN 91-7178-458-6
KTHSE-100 44 Stockholm
SWEDEN
Akademisk avhandling som med tillstånd av Kungl Tekniska högskolan framläg-ges till offentlig granskning för avläggande av teknologi doktorsexamen fredagenden 20 oktober 2006 kl. 10.30 i sal FD 5, Roslagstullsbacken 21, Albanova, KunglTekniska högskolan, Stockholm.
© Heide Stollberg, September 2006
Tryck: Universitetsservice US AB

Abstract
Soft x-ray microscopy is a powerful technique for natural-contrast, high-resolution imag-ing of organic materials. This Thesis describes new instrumentational and new image-processing methods to improve the image quality of the compact x-ray microscope at theBiomedical & X-Ray Physics division at KTH. The microscope is based on a laser-plasmasource combined with different condenser optics, either multilayer mirrors or zone plates.Imaging is performed by micro zone plates. The microscope works in the water window(λ = 2.3-4.4 nm), where the attenuation lengths of oxygen and carbon differ strongly, pro-viding high natural contrast for carbon-containing specimens in an aqueous environment.
By optimizing the properties of the laser-plasma source and fabricating multilayermirrors with high, uniform reflectivity, the performance of the microscope’s illuminationsystem could be improved and exposure times decreased significantly to about 2 min forimaging dry samples and 5 min for imaging wet samples. For imaging of wet samples, awet-specimen chamber was developed, which is vacuum-compatible. Since it is horizontallymounted in the microscope, it offers advantages for investigations in polymer and soilscience.
To improve the quality of images taken by the compact x-ray microscope an image-restoration algorithm was developed. Denoising is performed by a filtering algorithm basedon the discrete wavelet transform. This algorithm shows advantages compared to Fourier-based algorithms, since the filtering of spatial frequencies is done locally. An improvementin exposure time by a factor of about 2 could be realized without loss of image information.
To stimulate experiments on functional imaging in x-ray microscopy an image-analysisalgorithm for identifying colloidal-gold particles was developed. This algorithm is basedon a combination of a threshold with respect to the local absorption and a shape discrim-ination, realized by fitting a Gaussian profile to the potential particles. The algorithmwas evaluated and optimized on images taken by the transmission x-ray microscope atBESSY II. The size-selective identification and localization of single gold particles downto a diameter of 50 nm was demonstrated.
iii


List of Papers
Paper 1 H. Stollberg, J. Boutet de Monvel, A. Holmberg, and H. M. Hertz, Wavelet-based image restoration for compact x-ray microscopy. J. Microsc. 211, 154–160 (2003).
Paper 2 U. Vogt, R. Frueke, T. Wilhein, H. Stollberg, P. A. C. Jansson, and H. M.Hertz, High-resolution spatial characterization of laser produced plasmas atsoft x-ray wavelengths. Appl. Phys. B 78, 53–58 (2004).
Paper 3 H. Stollberg, P. Guttmann, P. A. C. Takman, and H. M. Hertz, Size-selectivecolloidal-gold localization in transmission x-ray microscopy. Accepted by J.Microsc. (2006).
Paper 4 H. Stollberg, S. Yulin, P. A. C. Takman, and H. M. Hertz, High-reflectivityCr/Sc multilayer condenser for compact soft x-ray microscopy. Submitted toRev. Sci. Instrum. (2006).
Paper 5 P. A. C. Takman, H. Stollberg, G. A. Johansson, A. Holmberg, M. Lindblom,and H. M. Hertz, Sub 30-nm resolution compact x-ray microscopy. Submittedto J. Microsc. (2006).
Paper 6 H. Stollberg, M. Pokorny, and H. M. Hertz, A vacuum-compatible wet-specimenchamber for compact x-ray microscopy. Submitted to J. Microsc. (2006).
v


Contents
Abstract iii
List of Papers v
Contents vii
1 Introduction 1
2 X-Ray Microscopy 32.1 Interaction between x-rays and matter . . . . . . . . . . . . . . . . . 32.2 History of x-ray microscopy . . . . . . . . . . . . . . . . . . . . . . . 52.3 Properties of soft x-ray microscopy . . . . . . . . . . . . . . . . . . . 6
3 Compact Soft X-Ray Microscopy 93.1 Plasma-based sources . . . . . . . . . . . . . . . . . . . . . . . . . . 9
3.1.1 Laser-plasma sources . . . . . . . . . . . . . . . . . . . . . . . . 93.1.2 Discharge sources . . . . . . . . . . . . . . . . . . . . . . . . . . 10
3.2 X-ray optics . . . . . . . . . . . . . . . . . . . . . . . . . . . . . . . . 103.2.1 Grazing-incidence mirrors . . . . . . . . . . . . . . . . . . . . . 113.2.2 Multilayer mirrors . . . . . . . . . . . . . . . . . . . . . . . . . 123.2.3 Zone plates . . . . . . . . . . . . . . . . . . . . . . . . . . . . . 15
4 Microscope Performance 194.1 Illumination system . . . . . . . . . . . . . . . . . . . . . . . . . . . 19
4.1.1 Liquid-jet laser-plasma source . . . . . . . . . . . . . . . . . . . 194.1.2 Condenser arrangements . . . . . . . . . . . . . . . . . . . . . . 21
4.2 Imaging system . . . . . . . . . . . . . . . . . . . . . . . . . . . . . . 264.3 Imaging of wet specimen . . . . . . . . . . . . . . . . . . . . . . . . . 28
5 Image Analysis for Soft X-Ray Microscopy 315.1 Improving the image quality . . . . . . . . . . . . . . . . . . . . . . . 31
vii
viii CONTENTS
5.1.1 Wavelet-based image denoising . . . . . . . . . . . . . . . . . . 325.2 Towards functional imaging . . . . . . . . . . . . . . . . . . . . . . . 35
5.2.1 Colloidal gold in x-ray microscopy . . . . . . . . . . . . . . . . 355.2.2 Localization of gold particles in x-ray microscopy images . . . . 36
6 Summary of the Original Work 39
Acknowledgements 41
Bibliography 43

Chapter 1
Introduction
Microscopy has a long history. The first microscope was probably built by Hansand Zacharias Jansen around 1600. Robert Hooke studied various objects with hismicroscope and published his results in "Micrographia" in 1664 [1]. In the 1670sAnton van Leeuwenhoek made some of the most important discoveries in biology.He investigated among others bacteria, sperm cells, and blood cells. In the 19thcentury several scientific and technical innovations made microscopes better andeasier to handle, which led to microscopy becoming more and more popular amongscientists [2]. Today, microscopy is one of the most important tools in science.
In microscopy two things are important: contrast and resolution. To enhancecontrast in light microscopy there exist two main classes of techniques. One class oftechniques is the visualization of specimen properties that are usually invisible byoptical means. To these methods belong among others phase-contrast imaging [3]and differential interference contrast [4]. The other group of techniques changes thespecimen properties, so that the specimen shows different transmission behavior orbecomes fluorescent. The resolution in a conventional far-field microscope is limitedby the imaging wavelength. For visible bright-field microscopy the best resolutionis about 0.44 times the employed wavelength [5]. With advanced illumination andimaging methods in fluorescence microscopy the actual resolution limit for visiblemicroscopy today lies at about 45 nm [6,7]. Other microscopy techniques with betterresolution have been developed in the 20th century, e. g., electron microscopy [8],x-ray microscopy [9], scanning tunneling microscopy [10], and its derivative atomicforce microscopy [11].
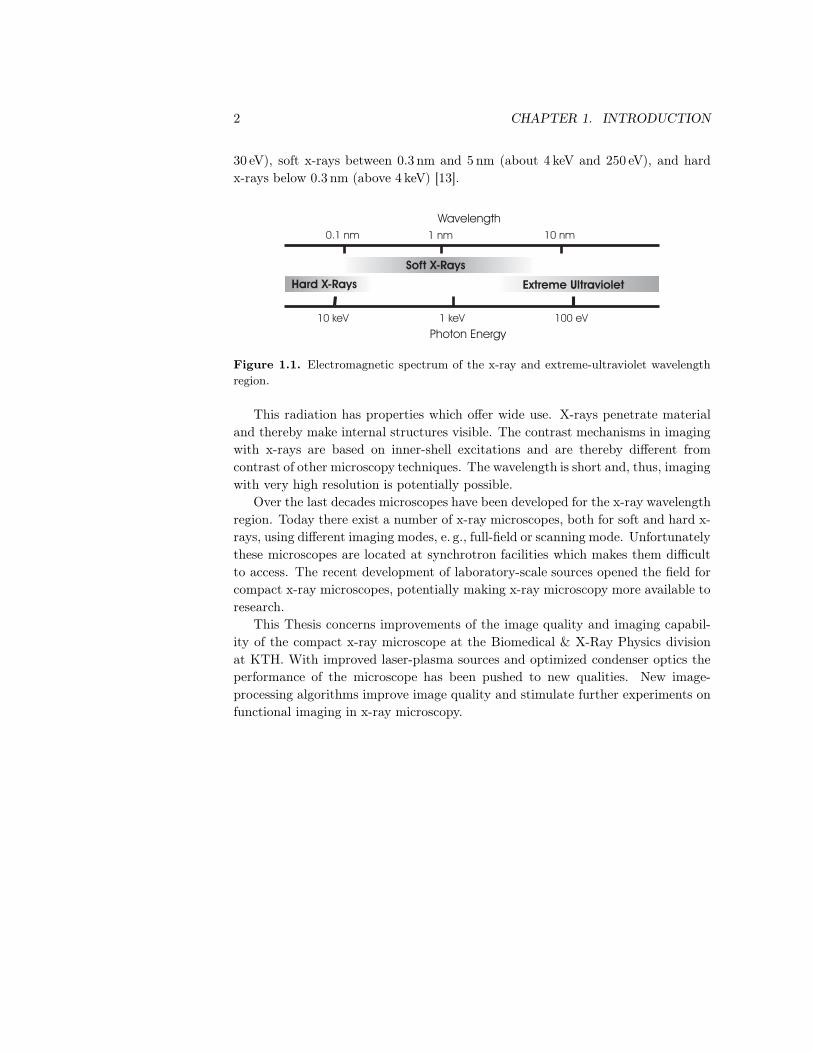
Wilhelm Conrad Röntgen announced in 1895 the discovery of a "new kind ofrays" [12], which he called x-rays. The electromagnetic spectrum for x-rays iscommonly divided into three different wavelength intervals (cf. Fig. 1.1): extreme-ultraviolet radiation with wavelengths between 5 nm and 40 nm (about 250 eV to
1
2 CHAPTER 1. INTRODUCTION
30 eV), soft x-rays between 0.3 nm and 5 nm (about 4 keV and 250 eV), and hardx-rays below 0.3 nm (above 4 keV) [13].
1 nm0.1 nm 10 nm
Wavelength
100 eV1 keV10 keV
Photon Energy
Soft X-Rays
Hard X-Rays Extreme Ultraviolet
Figure 1.1. Electromagnetic spectrum of the x-ray and extreme-ultraviolet wavelengthregion.
This radiation has properties which offer wide use. X-rays penetrate materialand thereby make internal structures visible. The contrast mechanisms in imagingwith x-rays are based on inner-shell excitations and are thereby different fromcontrast of other microscopy techniques. The wavelength is short and, thus, imagingwith very high resolution is potentially possible.
Over the last decades microscopes have been developed for the x-ray wavelengthregion. Today there exist a number of x-ray microscopes, both for soft and hard x-rays, using different imaging modes, e. g., full-field or scanning mode. Unfortunatelythese microscopes are located at synchrotron facilities which makes them difficultto access. The recent development of laboratory-scale sources opened the field forcompact x-ray microscopes, potentially making x-ray microscopy more available toresearch.
This Thesis concerns improvements of the image quality and imaging capabil-ity of the compact x-ray microscope at the Biomedical & X-Ray Physics divisionat KTH. With improved laser-plasma sources and optimized condenser optics theperformance of the microscope has been pushed to new qualities. New image-processing algorithms improve image quality and stimulate further experiments onfunctional imaging in x-ray microscopy.

Chapter 2
X-Ray Microscopy
In the following Sections the special properties of x-rays with regard to soft x-raymicroscopy will be described briefly, followed by a general introduction to x-raymicroscopy including a short historical overview.
2.1 Interaction between x-rays and matter
For microscopy the optical properties of matter are of importance. One parameterto describe these properties is the refractive index n. In the x-ray regime it iscommonly written as
n = 1 − δ − iβ , (2.1)
where δ is the refractive index decrement and β is the absorption or extinctioncoefficient [14]. The real part of the refractive index induces a phase shift for raystraveling through material, the imaginary part accounts for absorption. For soft x-rays the refractive index of most materials is close to unity, which strongly influencesthe characteristics of optical elements, as will be discussed further in Sect. 3.2. Therefractive index can be calculated from the atomic properties of a material by [13]
n = 1 − nareλ2
2π(f1 + if2) , (2.2)
where na is the average density of atoms in the material, re = 2.818 · 10−15 m isthe classical electron radius, λ is the x-ray wavelength, and f = f1 + if2 is theatomic scattering factor. Atomic scattering factors f of different elements can becalculated by analytical models [13]. Henke and colleagues tabulated the values ofthe atomic scattering factors in the x-ray region for the elements [15].
X-rays can interact with matter in different ways. The three types of photon–matter interaction are attenuation due to photoelectric absorption, elastic scatter-
3

4 CHAPTER 2. X-RAY MICROSCOPY
ing, and inelastic scattering. The cross sections for these individual processes area measure of the probability for the processes to occur. Figure 2.1 shows the crosssections for carbon as a function of photon energy. For soft x-rays the dominating
Energy (eV)
110 210 310 410 510 610
-210
-110
010
110
210
310
410
510
610
710
108
Cro
ssse
ctio
n(b
arn
s)
� (nm)100 10 1 0.10 0.01
�absorption
�elastic
�Compton
Figure 2.1. Cross sections for the different types of photon–matter interaction for car-bon. In the soft x-ray regime (250 eV - 4 keV) the dominating process is photoelectricalabsorption. For higher energies (above ∼20 keV) scattering processes become dominating.(Data from Ref. [15].)
attenuation process is photoelectrical absorption and its cross section σabs can becalculated with help of the atomic properties,
σabs = 2λ re f2 , (2.3)
where f2 is the imaginary part of the atomic scattering factor. The cross sectionfor elastic scattering σel is much smaller,
σel =83πr2e
(f21 + f2
2
). (2.4)
The cross section for inelastic, or Compton scattering, σCompton, is even smallerthan that for elastic scattering. Elastic and inelastic scattering can therefore beneglected for soft x-rays. Thus, in soft x-ray microscopy on thick specimens onecan expect to be free of haze due to scattered photons. For higher energies (above∼20 keV) scattering becomes the dominating process.
2.2. HISTORY OF X-RAY MICROSCOPY 5
Soft x-ray microscopy uses mainly absorption contrast. When x-rays travelthrough a material of thickness t, the intensity I will be attenuated according tothe Beer-Lambert law
I(t) = I0 e−µt , (2.5)
where I0 is the incident intensity. µ is the linear absorption coefficient, whichdepends on the wavelength λ and the imaginary part of the refractive index of thematerial (Eq. 2.1),
µ =4πβλ
. (2.6)
Even if absorption is the major contrast mechanism for soft x-ray microscopy, thereis a non-negligible phase shift φ for rays passing through matter of a thickness t,depending on the real part of the refractive index (Eq. 2.1),
φ(t) =2πδλ
t , (2.7)
making also phase-contrast imaging in x-ray microscopy possible.
2.2 History of x-ray microscopy
Microscopy has been employed in research since the 17th century. One major draw-back showed to be the limitation in resolution by the wavelength. The diffraction-limited resolution for far-field microscopy is according to the Rayleigh criterion
∆s = 0.61λ
NA, (2.8)
where ∆s is the minimum resolved distance between two points, when imaging witha wavelength λ and employing an objective with a numerical aperture NA.
The short wavelengths of x-rays combined with their long penetration depthseemed promising for microscopy. Unfortunately the refractive index of most mate-rials is close to unity, which makes the fabrication of proper optics difficult. Sincerefractive optics hardly can be used due to the high absorption in the soft x-raywavelength regime, other solutions had to be found. In 1923 Compton investigatedthe properties of grazing-incidence reflection of x-rays [16]. This led to the firstx-ray microscope ever, with grazing-incidence optics, working at wavelengths be-tween 1 Å and 10 Å, built by Kirkpatrick & Baez in 1949 [17]. A few years laterBaez proposed to use Fresnel zone plates, circular gratings, as focusing elementsfor soft x-rays and extreme-ultraviolet radiation [18]. However, first in the 1960sit was possible to manufacture zone plates with suitably small structure sizes by
6 CHAPTER 2. X-RAY MICROSCOPY
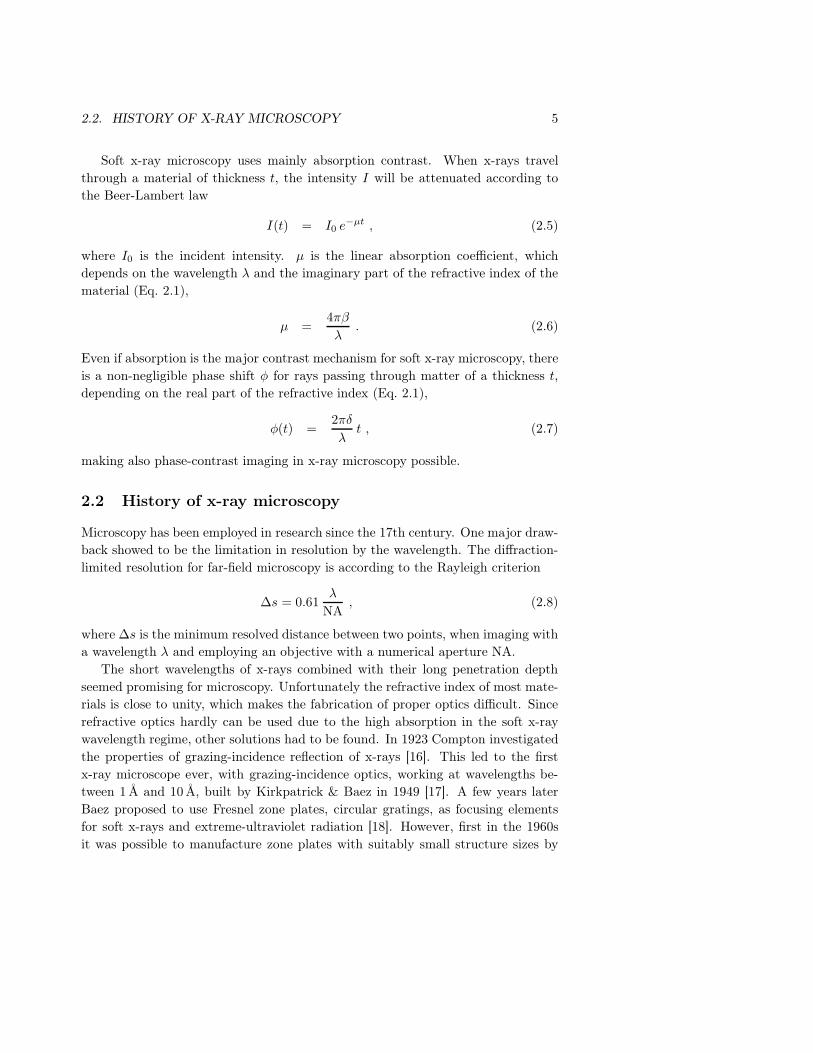
holographic methods [19]. In 1976 the first transmission soft x-ray microscope us-ing zone plates both as illumination elements and as imaging elements was builtat the synchrotron DESY in Hamburg, Germany [9]. The principle arrangement ofthis microscope is shown in Fig. 2.2. Since then the field of soft x-ray microscopy
Condenserzone plate
Specimen
Microzone plateobjective
Image
Monochromatorpinhole
Figure 2.2. Principle arrangement of the first soft x-ray microscope, using diffractiveoptics as condenser and objective.
has expanded and the major water-window microscopes today are located at theAdvanced Light Source in Berkeley, USA, at BESSY II in Berlin, Germany, at theNational Synchrotron Light Source in New York, USA, and at ASTRID in Aarhus,Denmark. An extended overview over the development of different microscopesand their applications can be found in the proceedings of the X-ray Microscopyconference series from 1983 until today [20–27].
2.3 Properties of soft x-ray microscopy
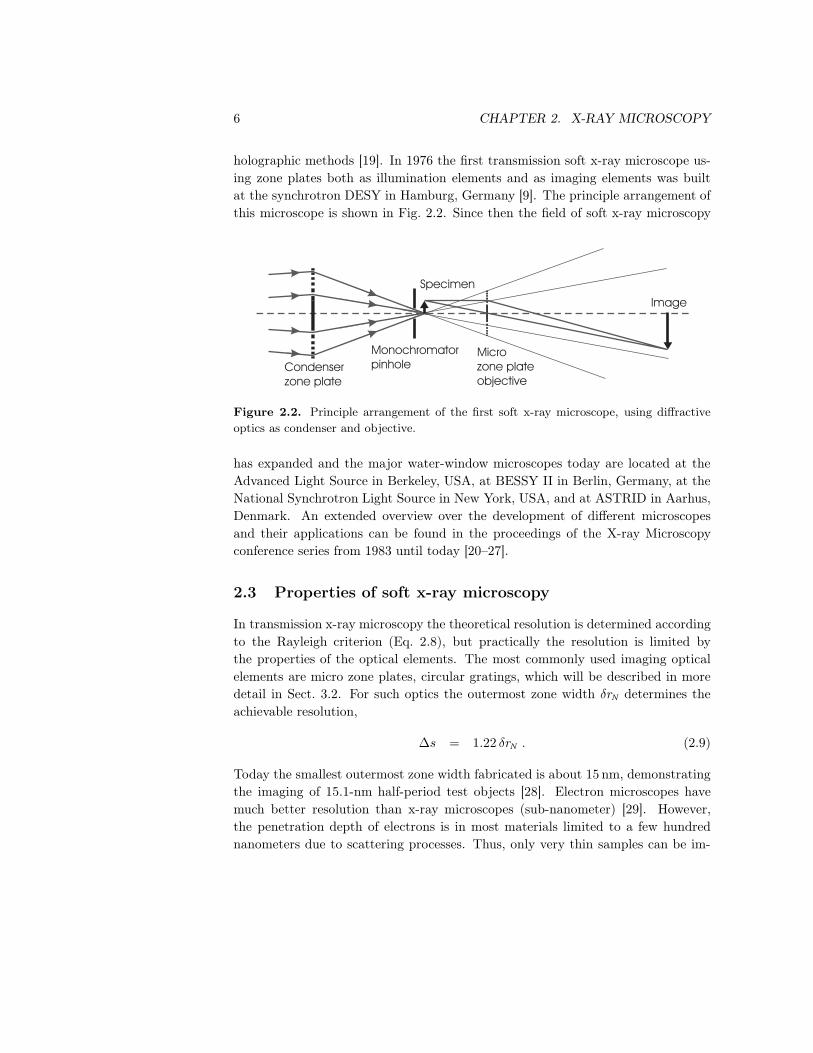
In transmission x-ray microscopy the theoretical resolution is determined accordingto the Rayleigh criterion (Eq. 2.8), but practically the resolution is limited bythe properties of the optical elements. The most commonly used imaging opticalelements are micro zone plates, circular gratings, which will be described in moredetail in Sect. 3.2. For such optics the outermost zone width δrN determines theachievable resolution,
∆s = 1.22 δrN . (2.9)
Today the smallest outermost zone width fabricated is about 15 nm, demonstratingthe imaging of 15.1-nm half-period test objects [28]. Electron microscopes havemuch better resolution than x-ray microscopes (sub-nanometer) [29]. However,the penetration depth of electrons is in most materials limited to a few hundrednanometers due to scattering processes. Thus, only very thin samples can be im-
2.3. PROPERTIES OF SOFT X-RAY MICROSCOPY 7
aged. X-rays have a much higher penetration depth, allowing the investigation ofthicker samples (a few micrometers).
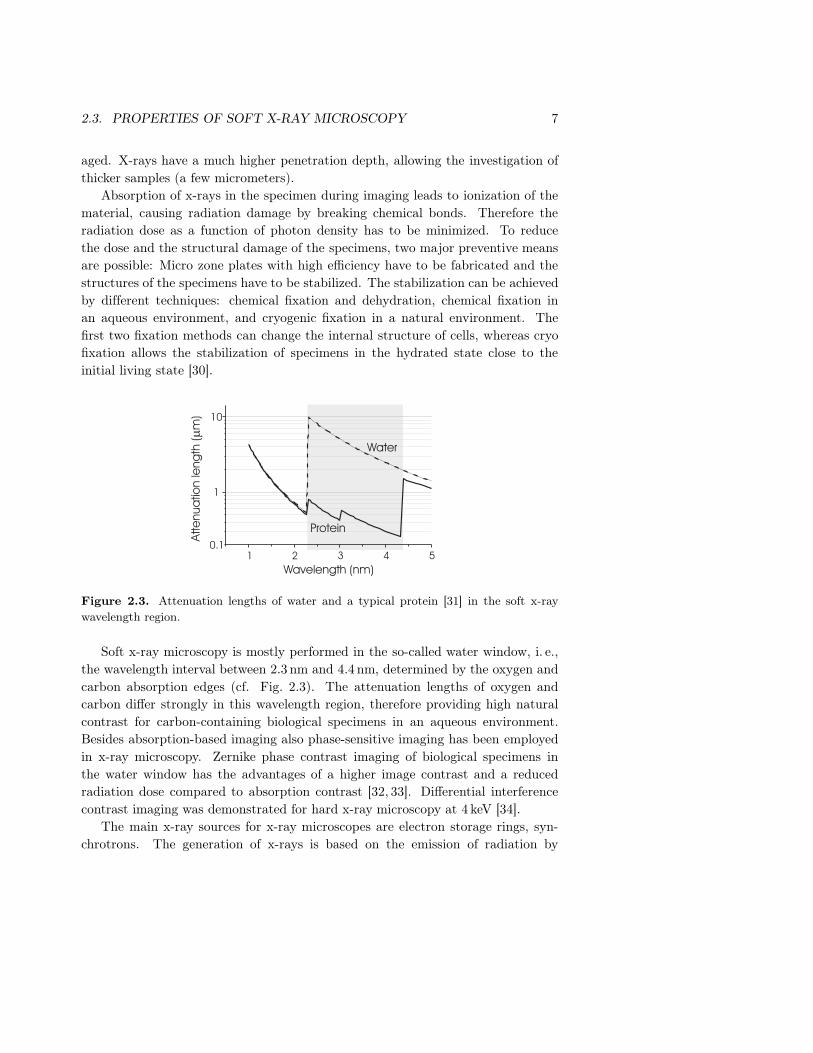
Absorption of x-rays in the specimen during imaging leads to ionization of thematerial, causing radiation damage by breaking chemical bonds. Therefore theradiation dose as a function of photon density has to be minimized. To reducethe dose and the structural damage of the specimens, two major preventive meansare possible: Micro zone plates with high efficiency have to be fabricated and thestructures of the specimens have to be stabilized. The stabilization can be achievedby different techniques: chemical fixation and dehydration, chemical fixation inan aqueous environment, and cryogenic fixation in a natural environment. Thefirst two fixation methods can change the internal structure of cells, whereas cryofixation allows the stabilization of specimens in the hydrated state close to theinitial living state [30].
Protein
Water
Wavelength (nm)1 2 3 4 5
Atte
nua
tion
leng
th(
m)
�
0.1
1
10
Figure 2.3. Attenuation lengths of water and a typical protein [31] in the soft x-raywavelength region.
Soft x-ray microscopy is mostly performed in the so-called water window, i. e.,the wavelength interval between 2.3 nm and 4.4 nm, determined by the oxygen andcarbon absorption edges (cf. Fig. 2.3). The attenuation lengths of oxygen andcarbon differ strongly in this wavelength region, therefore providing high naturalcontrast for carbon-containing biological specimens in an aqueous environment.Besides absorption-based imaging also phase-sensitive imaging has been employedin x-ray microscopy. Zernike phase contrast imaging of biological specimens inthe water window has the advantages of a higher image contrast and a reducedradiation dose compared to absorption contrast [32, 33]. Differential interferencecontrast imaging was demonstrated for hard x-ray microscopy at 4 keV [34].
The main x-ray sources for x-ray microscopes are electron storage rings, syn-chrotrons. The generation of x-rays is based on the emission of radiation by

8 CHAPTER 2. X-RAY MICROSCOPY
accelerated relativistic electrons in magnetic fields. Detailed information about thetheory, the properties, and the operation of synchrotrons can be found in Refs. [13]and [35].
To enable soft x-ray microscopy on a laboratory scale, compact sources, e. g.,x-ray lasers [36] or, more common, plasma-based sources, e. g., laser-plasma sources[37] and discharge sources [38], have been developed. For water-window compacttransmission microscopes different condenser arrangements in combination withthese sources are used. Elliptical grazing-incidence mirrors were employed as con-denser for a discharge source [39]. Elliptical or spherical multilayer mirrors havebeen combined with laser-plasma sources [40,41]. A condenser zone plate was usedboth with discharge and laser-plasma sources ([42], Paper 5). The imaging in thesemicroscopes is performed by micro zone plates. A compact microscope based on alaser-plasma source combined with Wolter systems both for illumination and imag-ing has also been constructed [43,44]. Additionally, other imaging modes in compactwater-window microscopy have been employed, e. g., contact microscopy [45] andscanning microscopy [46].

Chapter 3
Compact Soft X-Ray Microscopy
This Chapter gives an introduction to the major components of compact soft x-raymicroscopy. The basic properties of suitable laboratory-scale sources and optics arereviewed.
3.1 Plasma-based sources
3.1.1 Laser-plasma sources
When a high-intensity pulsed laser beam is focused onto a target material, a hot,dense plasma is generated [47]. The principle is shown in Fig. 3.1. The targetmaterial is heated due to the energy being transferred from the photons of the laserlight to the free electrons in the plasma. This hot, dense plasma is short-lived, andit expands and cools down rapidly. During a short period the temperature of theplasma is sufficient to emit x-rays. The radiation within the plasma has a spectraldistribution which basically depends on the temperature T (black-body radiation),with the peak of the spectrum at
λ =2.898 · 10−3 [Km]
T. (3.1)
The emitted radiation consists of a broad spectral continuum of bremsstrahlung(due to free-electron–ion encounters) and narrow line emission from bound–boundtransitions in atoms or ions of various charge states. For high-Z material brems-strahlung dominates, with few characteristic emission lines. For low-Z targets theline emission is dominating over the bremsstrahlung.
The source properties of importance for x-ray microscopy can be summarizedin the term brightness. Spectral brightness is defined as the number of photons pertime unit, source area, solid angle, and spectral band width. The size of the source
9

10 CHAPTER 3. COMPACT SOFT X-RAY MICROSCOPY
Target
Laser beam Plasma
Figure 3.1. Principle of a laser-plasma source. A laser beam is focused on the targetmaterial. In the focus a hot, dense plasma is created.
can be changed by the laser pulse length or the focus size. The average brightnessincreases with increased repetition rate of the laser. The target material deter-mines the spectral output of the x-ray emission. The emission spectrum dependsfurthermore on the properties of the laser, e. g., pulse energy and pulse length.
However, the plasma emits in addition to the x-rays also debris, i. e., atoms, ions,and clusters, which can damage sensitive components of the illumination system.Different target systems show different debris characteristics. The target systemsfor compact x-ray microscopes can roughly be divided into two groups: solid targetsand liquid-jet targets. The working principle is the same for both types, as describedabove. Liquid-jet targets show advantages compared to solid bulk targets. Thedebris emission from liquid targets is significantly lower [48]. Furthermore, liquid-jet targets are regenerative, allowing long-term high-repetition rate operation.
3.1.2 Discharge sources
Another type of plasma-based sources are pinch-plasma sources, where the plasmais created by an electrical discharge through a target material. For soft x-ray andextreme-ultraviolet radiation sources the target is a low-pressure gas. A high cur-rent is driven through the gaseous target. This current creates a low temperatureplasma. Simultaneously the current induces a magnetic field which compressesthe plasma, thereby increasing the plasma density and temperature. The emissioncharacteristic is similar to that of laser-based plasma sources. Gas discharge plas-mas are mostly used as sources for the extreme-ultraviolet wavelength region. Adetailed description of these sources can be found in, e. g., Ref. [49].
3.2 X-ray optics
Since the refractive index in the soft x-ray region is close to unity and absorptionis high, refractive lenses would need a very small radius of curvature in order torefract sufficiently and have to be extremely thin due to the high absorption, two
3.2. X-RAY OPTICS 11
incompatible demands. Therefore focusing optics for soft x-rays are based on re-flection or diffraction. Refractive optics are often used for hard x-rays due to thelower absorption for higher energies [50, 51]. In the following Sections the basicconcepts of reflective and diffractive optics for soft x-ray microscopy are presented.Detailed descriptions can be found in, e. g., Refs. [13, 14, 52].
3.2.1 Grazing-incidence mirrors
Reflectivity at a surface at normal incidence for soft x-rays is very small due tothe refractive index n of the surface material being close to unity. The reflectivitycalculated according to the Fresnel formula [53] is
R =∣∣∣∣n− nvac
n+ nvac
∣∣∣∣2
, (3.2)
where n is the complex refractive index. Since the refractive index for vacuum nvac
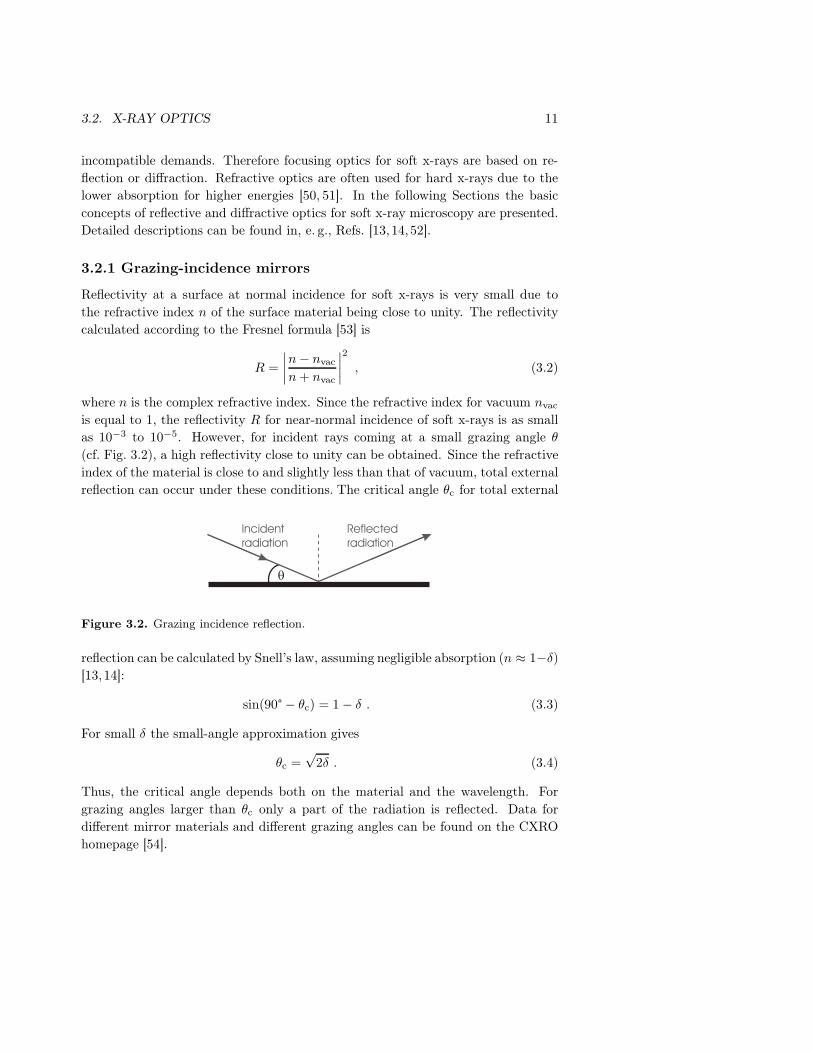
is equal to 1, the reflectivity R for near-normal incidence of soft x-rays is as smallas 10−3 to 10−5. However, for incident rays coming at a small grazing angle θ(cf. Fig. 3.2), a high reflectivity close to unity can be obtained. Since the refractiveindex of the material is close to and slightly less than that of vacuum, total externalreflection can occur under these conditions. The critical angle θc for total external
�
Incidentradiation
Reflectedradiation
Figure 3.2. Grazing incidence reflection.
reflection can be calculated by Snell’s law, assuming negligible absorption (n ≈ 1−δ)[13, 14]:
sin(90° − θc) = 1 − δ . (3.3)
For small δ the small-angle approximation gives
θc =√
2δ . (3.4)
Thus, the critical angle depends both on the material and the wavelength. Forgrazing angles larger than θc only a part of the radiation is reflected. Data fordifferent mirror materials and different grazing angles can be found on the CXROhomepage [54].

12 CHAPTER 3. COMPACT SOFT X-RAY MICROSCOPY
The major drawback of optics based on grazing-incidence reflection are thesignificant aberrations, namely astigmatism, spherical aberration, and coma. Toreduce aberrations, aspheric reflectors or compound systems are used. The twomain compound systems are the Kirkpatrick-Baez arrangement [55] and the Woltersystems [56]. In soft x-ray microscopy these type of reflective optics have been usedboth as condenser mirrors and as imaging optics, see, e. g., Refs. [17] and [43, 44].
3.2.2 Multilayer mirrors
To overcome the problem of the small reflectivity at near-normal incidence, a mul-tilayer coating is a good solution. Multilayer coatings consist of two or more al-ternating thin layers of different materials. The idea behind multilayers originatesfrom the scattering properties of electromagnetic radiation at boundaries with dif-ferent refractive indices [13, 52]. Since the scattered soft x-ray intensity at normalincidence is very low, the specularly scattered radiation from a number of inter-faces must therefore interfere constructively. This principle is shown in Fig. 3.3.The stack of bilayers forms an artificial crystal, and Bragg’s law can be used tocalculate the reflection behavior for incident radiation with a wavelength λ
mλ = 2Λ sin θ , (3.5)
where Λ is the thickness of the bilayer, and θ is the grazing angle. For first-orderdiffraction and normal incidence the bilayer thickness Λ has to be half of the to bereflected wavelength.
�
Substrate
�
H
L
Figure 3.3. Working principle of a multilayer stack. A bilayer with a thickness Λ consistsof one material with high (H) and one with low (L) refractive index. The radiation reflectedat each interface interferes constructively.

3.2. X-RAY OPTICS 13
When optimizing multilayers many parameters have to be taken into account.A simple approach for the choice of materials is the Fresnel equation for idealnormal-incidence reflection Ri at an interface between two materials,
Ri =∣∣∣∣n2 − n1
n2 + n1
∣∣∣∣2
, (3.6)
where n1 and n2 are the complex refractive indices of the two materials. Since therefractive index decrement δ and the extinction coefficient β in the refractive index(Eq. 2.1) are small, Eq. 3.6 can be approximated by
Ri ≈ ∆δ2 + ∆β2
4, (3.7)
where ∆δ and ∆β are the differences in the real and the imaginary part of therefractive index. The reflected intensity is maximized if ∆δ is chosen as large aspossible. For ∆β the relation is more complicated since β determines the absorp-tion (cf. Eq. 2.6). The materials are preferably chosen so that the absorption indexof one of the materials is low. Moreover, the materials have to fulfill mechani-cal, physical, and chemical conditions. They must be depositable and easily formsmooth boundaries, which have to be both chemically and physically stable, i. e., nochemical reactions at the interfaces are allowed and diffusion of material throughthe interfaces should be negligible. Since it is impossible to manufacture ideal in-terfaces, the interface between two layers gets a certain width σ larger than zero.The concept of interface width includes two different physical aspects: interfacialroughness and intermixing/interdiffusion. Real surfaces are a combination of thesetwo aspects. The reflectivity at such a surface is reduced compared to the idealreflectivity Ri as calculated by the Fresnel formula in Eq. 3.6. For normal incidencethe reduced reflectivity for a wavelength λ can be written as [14]
R = Ri e−(4π σ
λ )2
. (3.8)
In Fig. 3.4 the influence of the interface width is shown for a stack of Cr/Sc bilayers,optimized for λ = 3.374 nm.
The optimum number of bilayers in a multilayer stack depends on the balancebetween the superposition of the reflected amplitude and the absorption of the mate-rials. For the optimization of multilayers and choice of materials, calculations can beperformed with different programs, e. g., IMD [57], or on the CXRO homepage [54].
In the soft x-ray wavelength region it is difficult to find high performance multi-layer mirrors since the differences in the refractive indices are small and the numberof interfering reflections must therefore be large. A trade-off with the strong ab-sorption of most materials has to be found. Another problem when manufacturing

14 CHAPTER 3. COMPACT SOFT X-RAY MICROSCOPY
Interface width (Å)543210
Refle
ctiv
ity(%
)
40
30
20
10
0
Cr / ScN = 300; = 16.91 �
Figure 3.4. Reflectivity of a stack of Cr/Sc bilayers, optimized for λ = 3.374 nm atnormal incidence. Simulation was done with IMD [57]. The diagram shows clearly thedecrease in reflectivity for increasing interface width.
multilayers is the roughness of the substrates and the interface widths between thesingle layers. As shown in Fig. 3.4 these properties affect the obtained reflectivitysignificantly.
Over the last years the reflectivity for normal-incidence water-window multi-layers has been improved from a few to tens of percent. The improvement ofdifferent multilayers is listed on the CXRO homepage [58]. Established materialsfor the water-window wavelengths above 3 nm are multilayer stacks of W/B4C bi-layers with a demonstrated reflectivity of at least 1.9% at λ = 3.4 nm [58] or Cr/Scbilayers, which were pioneered by Salashchenko and colleagues [59]. For Cr/Sc areflectivity of 14.8% at λ = 3.11 nm was demonstrated [60]. With a dc-magnetronsputtering with tailored ion assistance 5.5% reflectivity was achieved at the for com-pact x-ray microscopy interesting carbon emission line λ = 3.374 nm [61]. Recentlymultilayers have been manufactured for the shorter wavelengths in the water win-dow, e. g., Cr/Ti with 17% reflectivity at λ = 2.73 nm or Cr/V with 9% reflectivityat λ = 2.42 nm [62]. These reflectivities were obtained on small substrates. Themajor task for the fabrication of multilayer condensers is the control of the layerthickness over a large area to obtain a uniform reflectivity over the whole condenserarea. Since the incidence angle of x-rays varies over the condenser area, the bestuniformity might be obtained by a graded multilayer stack, where the thickness isoptimized for the corresponding incidence angle.
3.2. X-RAY OPTICS 15
3.2.3 Zone plates
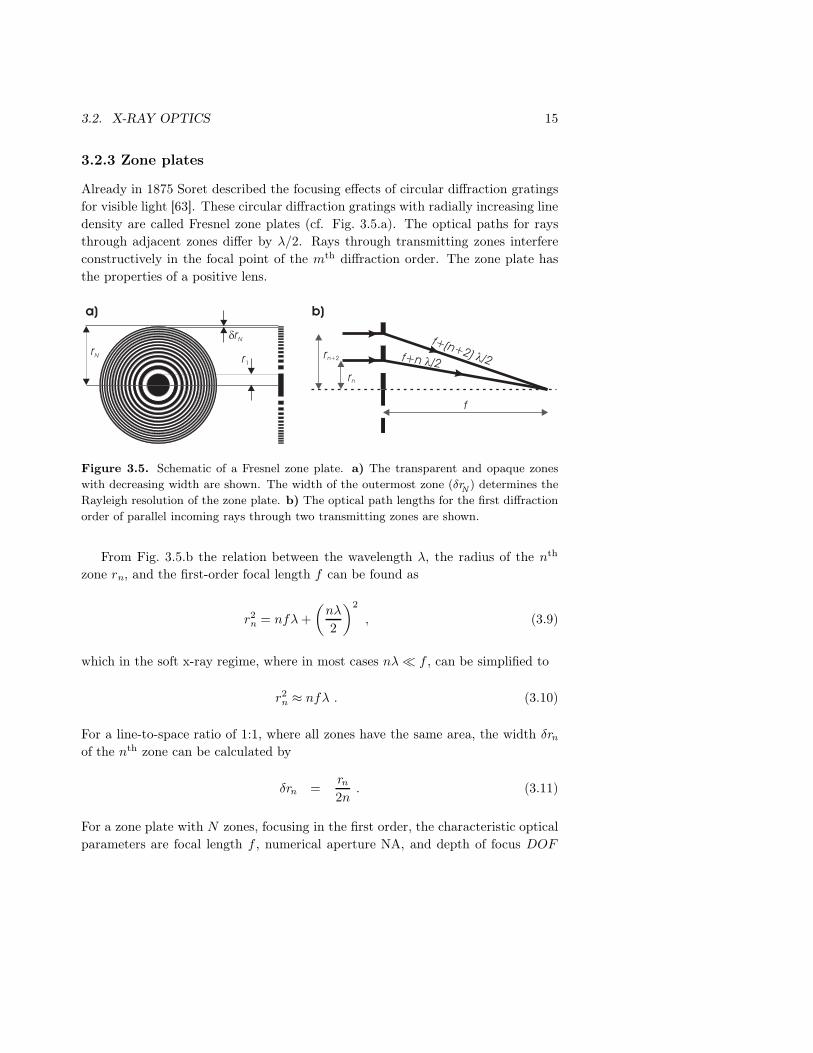
Already in 1875 Soret described the focusing effects of circular diffraction gratingsfor visible light [63]. These circular diffraction gratings with radially increasing linedensity are called Fresnel zone plates (cf. Fig. 3.5.a). The optical paths for raysthrough adjacent zones differ by λ/2. Rays through transmitting zones interfereconstructively in the focal point of the mth diffraction order. The zone plate hasthe properties of a positive lens.
rN
�rN
r1
a)
f
f+n /2�
f+(n+2) /2�
rn
rn+2
b)
Figure 3.5. Schematic of a Fresnel zone plate. a) The transparent and opaque zoneswith decreasing width are shown. The width of the outermost zone (δrN) determines theRayleigh resolution of the zone plate. b) The optical path lengths for the first diffractionorder of parallel incoming rays through two transmitting zones are shown.
From Fig. 3.5.b the relation between the wavelength λ, the radius of the nth
zone rn, and the first-order focal length f can be found as
r2n = nfλ+(nλ
2
)2
, (3.9)
which in the soft x-ray regime, where in most cases nλ� f , can be simplified to
r2n ≈ nfλ . (3.10)
For a line-to-space ratio of 1:1, where all zones have the same area, the width δrnof the nth zone can be calculated by
δrn =rn2n
. (3.11)
For a zone plate with N zones, focusing in the first order, the characteristic opticalparameters are focal length f , numerical aperture NA, and depth of focus DOF

16 CHAPTER 3. COMPACT SOFT X-RAY MICROSCOPY
(cf. Ref. [64]):
f =4N (δrN)2
λ, (3.12)
NA =λ
2δrN, (3.13)
DOF = ±2 (δrN)2
λ. (3.14)
The resolution of a zone plate under ideal conditions is determined by the out-ermost zone width δrN,
∆s = 1.22 δrN . (3.15)
Ideally, zone plates have no on-axis aberrations or distortion. Off-axis aberrationsoccur in imaging of extended objects, and are discussed in detail in Ref. [65]. Theseaberrations can be neglected for most x-ray microscope applications. However, itshould be noted that during the fabrication process defects can be introduced, whichcause on-axis aberrations. These defects are ellipticity, radial displacement of thezones, and nonconcentricity of the zones. Ellipticity is the difference in two perpen-dicular radii of the zone plate and causes astigmatism. The radial displacement isa measure of the displacement of the outermost zone and introduces spherical aber-rations. Nonconcentricity, describing the shift of the zones’ centers, causes coma.If the fabrication tolerances for these effects are less than about two times theoutermost zone width δrN the arising aberrations can be neglected [66]. Chromaticaberration will be severe unless the illumination is monochromatic, since the focallength depends on the wavelength (cf. Eq. 3.12). To avoid chromatic aberrationsthe following condition for a zone plate with N zones must be fulfilled:
∆λλ
≤ 1N
, (3.16)
where ∆λ is spectral bandwidth of the illumination. Hence for a typical zone platewith several hundred zones, the relative spectral bandwidth of the illuminatingradiation has to be less than 1%.
An important aspect in x-ray microscopy is the efficiency of the zone plates.One way to reduce radiation damage is the fabrication of high-efficiency zone plates.The diffraction efficiency ηm is defined as the diffracted intensity in the mth ordercompared to the incident intensity. For an ideal absorption zone plate the efficiencyηm for the individual diffraction orders m can be calculated by [14]
ηm =14,
1π2
,1
9π2, . . . ,
1m2π2
(3.17)
for m = 0 , ±1 , ±3 . . .

3.2. X-RAY OPTICS 17
When adding the efficiency of all diffraction orders, the overall efficiency is 50%, theremaining intensity is absorbed in the opaque zones. Only about 10% of the incidentradiation is diffracted into the first order. The efficiency can be increased by using socalled phase zone plates. Instead of a zone plate with absorbing and transmittingzones, all zones introduce a certain phase shift to the incident radiation. Thesimplest type was proposed by Lord Rayleigh already in 1888 [67]. The opaquezones of a transmission zone plate are replaced by zones introducing an optical pathdifference of λ/2 compared to the transparent zones. Thereby the superimposedamplitudes increase up to a factor of 2 and the intensity up a factor of 4. Thenecessary thickness t to obtain the phase shift of π can be calculated by Eq. 2.7,assuming that the absorption in the zone is negligible,
t =λ
2δ. (3.18)
For real zone plates the maximum obtainable diffraction efficiency depends on thechoice of material and the properties of the zones, since absorption and phase shiftare not independent of each other. The most critical parameters are the zoneheight and the zone-plate material. A good summary of the different influenceson the efficiency can be found in Refs. [68] and [69]. For the soft x-ray regimenickel has proven to be the best zone-plate material. It allows high efficiency withrelatively moderate zone heights. For a high-resolution nickel phase zone plate withan outermost zone width of 20 nm and a zone height of about 170 nm a diffractionefficiency in the first order of 9.2% at λ = 2.4 nm has been obtained [70].

Chapter 4
Microscope Performance
A compact soft x-ray microscope based on a liquid-jet laser-plasma source wasbuilt in 1999 [71] and improved during the following years [72]. The laser-plasmasource uses a methanol jet as target. As condenser a spherical multilayer mirroris employed and the high-resolution imaging is performed by a zone plate. Thisvertical microscope operates at a wavelength of λ = 3.374 nm. During the lastyears a new compact microscope has been constructed, which can operate at twodifferent wavelengths, λ = 2.478 nm and 3.374 nm. For λ = 2.478 nm a liquid-nitrogen jet is used as target for the laser-plasma source and a condenser zone plateis employed. The performance of this horizontal microscope at λ = 2.478 nm isdescribed in detail in Paper 5.
Both microscope arrangements can be divided into two different systems: theillumination system and the imaging system. The illumination system consists ofthe source module and the condenser arrangement. The imaging system is com-posed of three subsystems: sample stage, imaging optics, and image detector. Thevertical x-ray microscope, based on a methanol-jet laser-plasma source combinedwith a multilayer condenser is shown in Fig. 4.1. The experimental arrangement ofthe compact x-ray microscope with a condenser zone plate is similar to the principleshown in Fig. 2.2.
In the following sections all systems and subsystems of the compact x-ray micro-scopes will be described.
4.1 Illumination system
4.1.1 Liquid-jet laser-plasma source
In the compact x-ray microscopes a liquid-jet laser-plasma source provides radia-tion in the water window. Two different target materials are used: methanol and
19

20 CHAPTER 4. MICROSCOPE PERFORMANCE
Spherical
multilayer mirror
Soft x-ray source
Sample
Micro zone plate
CCD detector
Ima
gin
gsy
ste
mIllum
ina
tion
syst
em
Figure 4.1. Experimental arrangement of the vertical compact x-ray microscope. Theillumination system consists of the source and a condenser. The source is a laser-plasmasource with a methanol jet as target. As condenser a spherical multilayer mirror is used.A zone plate is employed as microscope objective, which images the specimens onto thex-ray-sensitive CCD detector. (Photograph from Ref. [72].)
liquid nitrogen. The basic concepts of laser-plasma-based sources can be found inSect. 3.1. The methanol-jet and liquid-nitrogen-jet source are described in Paper 2and Ref. [73], respectively. Here only the technical properties of the sources will bepresented.
The laser employed in the experiments is a frequency-doubled Nd:YAG (λ =532 nm) with a repetition rate of 100 Hz, a pulse length of 3 ns, and a pulse energyof about 115 mJ. The laser is focused onto the liquid jet to a full width at halfmaximum (FWHM) of ∼15 µm, resulting in an intensity of 2.2 · 1013 W/cm2, tocreate the plasma [73]. The liquid-jet target is delivered to the focal spot by afused-silica capillary nozzle with an orifice diameter of 10-20 µm [74].

4.1. ILLUMINATION SYSTEM 21
Methanol target
The emission lines of methanol in the water-window wavelength region are shown inFig. 4.2. The wavelength used for imaging with the x-ray microscope is the stronghydrogen-like carbon Kα-line at λ = 3.374 nm with a line width λ/∆λ>500 [75].For the 3.374-nm line the FWHM of the source is about 25 µm. The photon flux ofthe source at this wavelength is about 5 · 1011 photons/(pulse×sr×line). Althoughthe debris emission of the source is very low compared to solid targets, the plasmastill emits atomic and ionic debris, which slowly deposits on the nozzle tip, mak-ing regular nozzle changes necessary, and on the condenser optics, thereby slowlyreducing their reflectivity.
2.478 nm
2.879 nm
0
0.2
0.4
0.6
0.8
1.0
Inte
nsi
ty(a
.u.)
2.6 2.8 3.02.2 2.4
Wavelength (nm)
Nitrogen3.374 nm
4.027 nm
2.847 nm
2.6 2.8 3.0 3.2 3.4 3.6 3.8 4.02.4 4.2
Wavelength (nm)
Methanol
0
0.2
0.4
0.6
0.8
1.0
Inte
nsi
ty(a
.u.)
Figure 4.2. Water-window emission spectra of the liquid targets. On the left the emissionspectrum of methanol is shown. The emission spectrum of the liquid-nitrogen target inthe lower wavelength region of the water window is shown on the right. (The emissionline at λ = 2.490 nm is not resolved. Data from Ref. [73].)
Liquid-nitrogen target
The water-window emission spectrum of the liquid-nitrogen source is shown inFig. 4.2. In the x-ray microscope the strong hydrogen-like nitrogen Kα-line atλ = 2.478 nm is employed. For this line, with λ/∆λ>500 [75], the photon flux isabout 8 · 1011 photons/(pulse×sr×line). The FWHM of the source is about 20 µm.Since nitrogen is relatively inert, debris deposition from the liquid-nitrogen sourceis negligible.
4.1.2 Condenser arrangements
For the compact x-ray microscopes two different types of condensers are used: multi-layer mirrors and zone plates. The basic theory for these optics can be found in
22 CHAPTER 4. MICROSCOPE PERFORMANCE
Section 3.2. In the compact microscopes the illumination of the sample is doneby imaging the source onto the sample plane, so called critical illumination. Themajor requirements for the illumination arrangements are to provide a high photonflux and a uniform illumination in the sample plane, and to match the numericalaperture of the micro zone plate employed as objective. Since the backgroundillumination is much stronger than the by the specimens diffracted radiation ahollow-cone illumination is used. In the following the properties of the differentcondenser systems will be described with regard to these requirements.
Multilayer mirrors as condenser optics
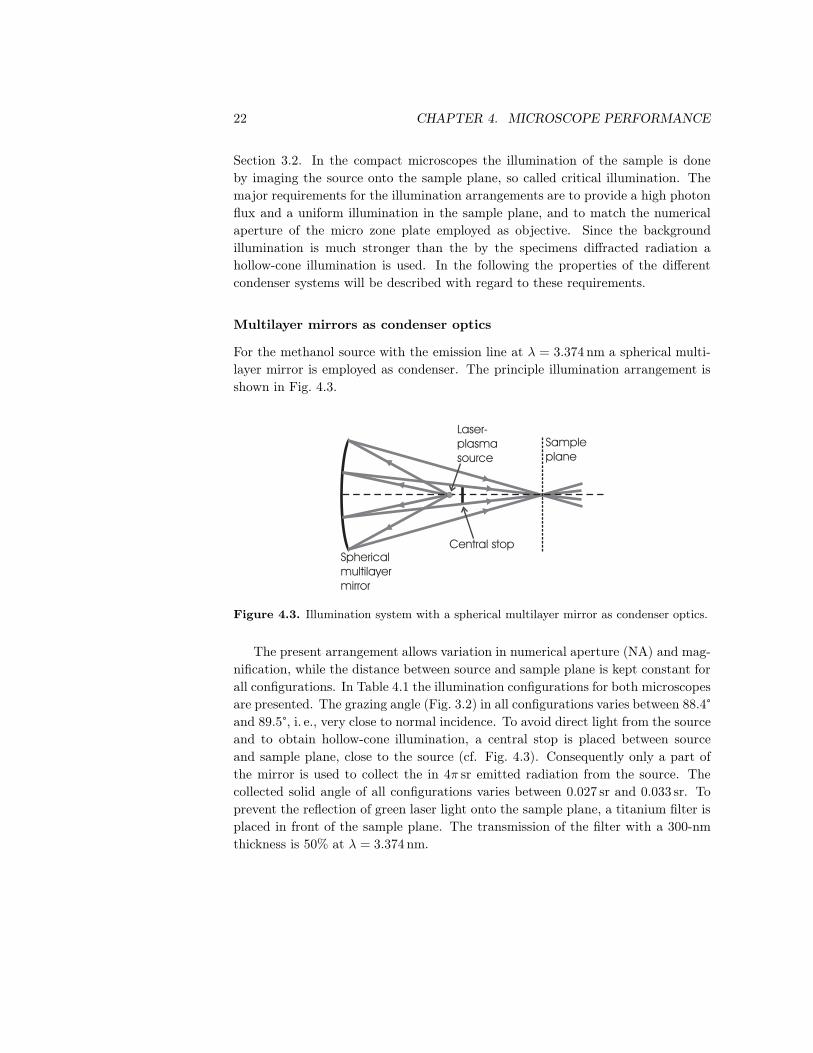
For the methanol source with the emission line at λ = 3.374 nm a spherical multi-layer mirror is employed as condenser. The principle illumination arrangement isshown in Fig. 4.3.
Sphericalmultilayermirror
Laser-plasmasource
Central stop
Sampleplane
Figure 4.3. Illumination system with a spherical multilayer mirror as condenser optics.
The present arrangement allows variation in numerical aperture (NA) and mag-nification, while the distance between source and sample plane is kept constant forall configurations. In Table 4.1 the illumination configurations for both microscopesare presented. The grazing angle (Fig. 3.2) in all configurations varies between 88.4°and 89.5°, i. e., very close to normal incidence. To avoid direct light from the sourceand to obtain hollow-cone illumination, a central stop is placed between sourceand sample plane, close to the source (cf. Fig. 4.3). Consequently only a part ofthe mirror is used to collect the in 4π sr emitted radiation from the source. Thecollected solid angle of all configurations varies between 0.027 sr and 0.033 sr. Toprevent the reflection of green laser light onto the sample plane, a titanium filter isplaced in front of the sample plane. The transmission of the filter with a 300-nmthickness is 50% at λ = 3.374 nm.

4.1. ILLUMINATION SYSTEM 23
Microscope Multilayer Distance Numericalsetup mirror source-sample
Magnificationaperture
W/B4 1.87 0.059vertical
Cr/Sc230 mm
1.85 0.058W/B4 1.65 0.064
horizontalCr/Sc
180 mm1.64 0.063
Table 4.1. Illumination configurations with a spherical multilayer mirror as condenserfor both compact x-ray microscopes. Details about the multilayer mirrors can be foundin Tab. 4.2.
For critical illumination the NA of the illumination should ideally be equal orlarger than the NA of the zone plate objective. In this case the resolution capacityof the micro zone plate can be completely utilized. This condition is fulfilled for allconfigurations presented in Tab. 4.1, since the NA of the imaging zone plate is inmost cases 0.058 or less.
Another important parameter of the illumination is its uniformity,
uniformity =Imax − Imin
Imax + Imin, (4.1)
where Imax is the maximum intensity and Imin is the minimum intensity of illumi-nation in the field of view. When the methanol source with its diameter of about25 µm is imaged onto the sample plane with a magnification larger than unity, agood uniformity of the illumination can be obtained. Assuming a diameter of 20 µmfor the field of view, the uniformity varies between 9% and 12% for the differentconfigurations. However, only the central part of the source is imaged inside thefield of view and up to 90% of the radiation can be outside the field of view andthereby lost, as shown in Fig. 4.4.
Number of Substrate properties Reflectivitybilayers diameter radius of curvature theoretical experimental
W/B4 200 58 mm 343 mm 9% 0.3%Cr/Sc 300 58 mm 350 mm 39% 3.0%
Table 4.2. Properties of the multilayer mirrors used as condenser optics for the methanol-jet laser-plasma source.
Two different types of multilayer coatings are used: W/B4C and Cr/Sc. Theproperties of the multilayer mirrors are summarized in Tab. 4.2. The W/B4C

24 CHAPTER 4. MICROSCOPE PERFORMANCE
Field of view
( m)�0 20 120120806040 140100
0.2
1
0
0.8
0.6
0.4
Inte
nsi
ty(a
.u.)
Field of view
20151050
( m)�
1
0.9
0.8
0Inte
nsi
ty(a
.u.)
Field of view
Figure 4.4. Illumination in the sample plane for the methanol-target source. The fullwidth at half maximum of the source is 25µm and the magnification of the illuminationsystem is 1.85. In the upper left an image of the source is shown. The scale bar correspondsto 20 µm in the sample plane. In the upper right the central part of the source is shownwith the size of the field of view marked by a circle. The lower left shows a profile throughthe source. On the lower right the part of the profile in the field of view is shown. Theintensity drops at the edges of the field of view to about 84% of the maximum value,resulting in an uniformity of about 9%.
multilayer mirrors, described in detail in Ref. [41], consist of 200 bilayers of Wand B4C on SiO2 substrates. The multilayer period matches the source wavelengthλ = 3.374 nm. The theoretical reflectivity of these W/B4C multilayers is 9%, themirrors show an average reflectivity of about 0.3%. The Cr/Sc multilayer mirrors,as described in Paper 4, are built of 300 bilayers on SiO2 substrates. The theoret-ical reflectivity is 39%. Experimentally, the mirrors show a uniform reflectivity ofabout 3%. The difference between the theoretical and the experimental reflectiv-ity is mainly due to substrate roughness and an interface width larger than zero(cf. Sect. 3.2.2).

4.1. ILLUMINATION SYSTEM 25
To achieve a high reflectivity for a given material combination the number ofbilayers has to be large. A higher number of bilayers corresponds to a narrowerspectral bandwidth of the reflected radiation. The bandwidth was determined tobe λ/∆λ ≈ 80 for the W/B4C mirrors and λ/∆λ ≈ 240 for the Cr/Sc mirrors. Themultilayer mirror therefore works as a monochromator in the illumination system,matching the selected emission line of the source.
The illumination efficiency can be calculated by taking all of the above de-scribed characteristics - collected solid angle, filter transmission, losses due tothe source magnification, and mirror reflectivity - into account. For the illumi-nation system with a multilayer mirror as condenser the illumination efficiency islow, resulting in an average brightness in the field of view of about 2.5 ·104 to3.5·105 photons/(s×µm2).
Zone plates as condenser optics
The compact microscope working with a liquid-nitrogen source at λ = 2.478 nm hasa zone plate as condenser since there still exist no normal-incidence multilayer mir-rors on sufficiently large substrates for wavelengths below 3 nm due to the advancedfabrication requirements to obtain a uniform high reflectivity over a large area. Theprinciple illumination arrangement is shown in Fig. 4.5. The condenser zone plate
Laser-plasmasource
Sampleplane
Condenserzone plate
Pinhole
Figure 4.5. Illumination setup with a zone plate as condenser optics.
(CZP) [76] is used in the first diffraction order (see Sect. 3.2), and the source isimaged 1:1 onto the sample plane. The first-order focal length of the CZP forλ = 2.478 nm is 90 mm. To obtain hollow-cone illumination, the central part of thezone plate is opaque. The resulting solid collection angle is about 1.5 · 10−4 sr. Thenumerical aperture (NA) for this illumination setup is 0.012. Thus, the NA of theillumination does not match the NA of the imaging micro zone plate, which resultsin partially coherent illumination. The field of view depends on the imaging opticsand is about 12 µm in diameter for most applications. The uniformity (Eq. 4.1)in this field of view is about 19%. The efficiency of the CZP was determined to

26 CHAPTER 4. MICROSCOPE PERFORMANCE
be 7.6% [77]. To protect the CZP from the scattered laser light from the plasma achromium filter with a thickness of 250 nm (transmission of 52% at λ = 2.478 nm) isused. The losses of radiation due to the size of the field of view are about 75%. Theresulting average brightness in the field of view is about 1 · 105 photons/(s×µm2).
Monochromaticity of the illumination. As shown in Fig. 4.2 nitrogen hasother emission lines close to the emission line at λ = 2.478 nm, which can not easilybe filtered by the chromium filter. Thus, the illumination is polychromatic, whichmay cause chromatic aberrations in the imaging system. In Sect. 3.2, Eq. 3.12 therelation between focal length f and wavelength λ for a zone plate is given as
f λ = constant . (4.2)
Since the object distance l between source and CZP is the same for all wavelengths(here: l = 2f2.478 = 180 mm), the image distance l′i will vary depending on thewavelength as
l′i = f2.478
(λi
λ2.478− 1
2
)−1
, (4.3)
where the index 2.478 is for λ = 2.478 nm and i stands for an arbitrary wave-length. This equation is valid if the 2.478-nm source is imaged 1:1 onto the sampleplane. Other lines in the emission spectrum are at λ = 2.490 nm and λ = 2.879 nm(cf. Fig. 4.2). For λ = 2.478 nm the source will be imaged at a distance of 180 mmfrom the CZP. For λ = 2.490 nm and λ = 2.879 nm the image distances are 178.3 mmand 135.9 mm, respectively. Due to large separation between l′2.478, l′2.490, and l′2.879and the hollow-cone illumination a pinhole mounted close to the sample plane blocksthe light of the unwanted wavelengths easily. The polychromaticity of the illumi-nation system therefore causes no chromatic aberrations or random background inthe imaging system.
4.2 Imaging system
Sample stage
In both compact microscopes the specimen is supported by a silicon nitride win-dow. The thickness of this window is usually 50 nm or 100 nm, corresponding to atransmission between 62% and 80%, depending on the wavelength and thickness.The window is centered on a silicon wafer, which is assembled in a frame, whichthen is mounted on the sample stage.
In the vertical microscope shown in Fig. 4.1 the sample stage, on which also themicro zone plate (MZP) is mounted, is in a small vacuum chamber. The sample

4.2. IMAGING SYSTEM 27
holder is aligned with respect to the MZP outside the chamber in a light microscope.The time to change the sample is therefore determined by the time needed topump and vent the sample chamber. To make the sample change easier and faster,in the new, horizontal microscope the sample stage is in a helium atmosphere atatmospheric pressure. A light microscope, which is brought into the setup, is usedto align the sample with respect to the MZP.
Imaging optics
Micro zone plates are employed as objectives. They are manufactured in nickelon a silicon nitride membrane employing a nano-lithography technique [78]. Out-ermost zone widths down to 25 nm were achieved [79]. MZPs with different focallengths (485 µm - 1.5 mm @ λ = 2.478 nm) are used in the microscopy experiments,depending on the experimentally required resolution and field of view. With a di-ameter of 58 µm, the numerical aperture (NA) of the imaging optics with a focallength of 500 µm is 0.058, compared to the illumination NA of 0.058-0.065 for thecondenser mirror and 0.012 for the condenser zone plate. Due to the mismatch ofthe NA in the latter arrangment, the maximum resolution can not be achieved.The magnification of the imaging system can be varied between 500× and 1300×.The distance between the sample plane and the MZP in all these configurations isabout the size of the focal length.
As stated in Sect. 3.2, MZPs show chromatic aberrations. For the MZPs usedin the x-ray microscopes the number of zones is 450 or larger. In combination withthe illumination system, which selects one single emission line with a line width ofabout λ/∆λ ≥ 500, chromatic aberrations can be neglected (Eq. 3.16).
Image detector
As detector for soft x-rays a cooled back-illuminated charge-coupled device (CCD)is used. The quantum efficiency of this type of detector in the wavelength rangeof 2-20 nm is typically about 0.6 [80]. For the compact x-ray microscopes, twodifferent CCD cameras were employed. One has a chip with 1024 × 1024 pixelswith a pixel size of 24 × 24 µm2. For high-resolution experiments a CCD camerawith 2048 × 2048 pixels with a pixel size of 13 × 13 µm2 is used. When imagingwith 1000× magnification onto the CCD camera with 24 × 24 µm2 pixel size, theexposure time for the compact microscope working at λ = 3.374 nm using a Cr/Scmultilayer condenser is less than two minutes for ∼1000 photons/pixel, providing agood signal-to-noise ratio.

28 CHAPTER 4. MICROSCOPE PERFORMANCE
4.3 Imaging of wet specimen
Biological investigations with the compact x-ray microscope have been performedon dried cells (COS7 and MX1 cell lines). Dehydration of the cells was done bya series of ethanol-water washes. However, it is difficult to tell how this dehydra-tion procedure affects the inner structures of the cells. Preparation methods todehydrate the specimens can have effects on their chemical properties, thereforeinvestigations are advantageously performed with the specimens in a liquid. Thisis especially valid in, e. g., polymer science, where the structure often is determinedby hydration forces [81]. Also in environmental and soil science it is preferable tokeep the specimens in their natural aqueous environment [82].
Wet-specimen chambers have been developed for transmission x-ray microscopy[83–85] and scanning x-ray microscopy [86]. A wet-specimen chamber for a com-pact x-ray microscope was developed by Rudolph and colleagues [39]. In all thesemicroscopes the wet-specimen chamber is mounted at atmospheric pressure, whichdoes not require an advanced sealing against liquid losses. To support the speci-mens silicon or silicon nitride windows or polymer films are used. By removing theresidual liquid the thickness of the specimen layer can be controlled.
Since in the vertical compact microscope based on the methanol-jet source(cf. Fig. 4.1) the sample is mounted in a vacuum chamber a wet-specimen chambermust be vacuum compatible. This wet-specimen chamber is described in Paper 6.The small working distances of the zone plate objectives (a few hundred microme-ters) made the design of the wet-specimen chamber demanding. In Fig. 4.6 a draw-ing of the wet-specimen chamber is shown. This design allows working distances
Metal shim
Silicon nitride
windows
O-ring
Filling hole
Figure 4.6. Drawing of the vacuum-compatible wet-specimen chamber for the verticalcompact x-ray microscope. (To show the main features the dimensions are not in scale.)
as small as 350 µm. Against liquid losses in vacuum a sealing is done mechanicallyby O-rings combined with a sealing with bio-compatible glue. As specimen sup-port silicon nitride windows are employed. The liquid losses are negligible when

4.3. IMAGING OF WET SPECIMEN 29
keeping the wet-specimen chamber in a vacuum of about 10−4 mbar for hours. Ex-periments demonstrating the working principle of the wet-specimen chamber havebeen performed with a lipid solution.
A potential advantage of this microscope arrangement is the horizontal mount-ing of the sample. Thus, no additional gravitational forces are applied on the spec-imens. Also the slow sedimentation of larger particles or macromolecule aggregatesout of the field of view can be avoided when performing long-time experiments.
In the horizontal compact microscope wet specimens are supported by two sili-con nitride windows, which are mounted vertically onto the sample stage. Sincethe sample is mounted in helium atmosphere at atmospheric pressure no vacuumsealing is necessary. First demonstration experiments with COS7 cells grown onsilicon nitride windows have been done, as described in Paper 5.


Chapter 5
Image Analysis for Soft X-RayMicroscopy
Digital image processing has numerous applications: One is the improvement ofthe image quality, which eases the interpretation of the image content. Secondly,the automization of image analysis, and thirdly image data compression. The bookby Gonzales & Woods [87] gives a good overview over the different fields of digitalimage processing.
For microscopy the improvement of image quality is of major interest. Depend-ing on the problem, also automatized image analysis is attractive. The followingSections give an introduction to the topics of Paper 1 and Paper 3. These papersare concerned with image improvement by denoising and automatized localizationof gold particles, respectively.
5.1 Improving the image quality
Image restoration, i. e., the improvement of image quality, in microscopy has a longtradition. The two main goals are the improvement of contrast by enhancing thesignal-to-noise ratio and the improvement of resolution. Different image restorationmethods have been developed and improved over the years. However, although alot of work has been done for microscopy in general, only a few attempts havebeen made in the field of soft x-ray microscopy. More common in x-ray microscopyis to change the quality of the images by experimental conditions. The contrast,e. g., can be enhanced by the right choice of the wavelength. If radiation damageis no problem, the achieved signal-to-noise ratio can be high. The main factor toimprove resolution is still the manufacturing of zone plates with smaller outermostzone widths (see Sect. 2.3). A major contribution to improve image quality by
31

32 CHAPTER 5. IMAGE ANALYSIS FOR SOFT X-RAY MICROSCOPY
digital image processing has been done by Sibarita [88] and colleagues [89–91] forimages taken by the transmission x-ray microscope at BESSY [84]. A deconvolu-tion algorithm in combination with noise suppression in the Fourier domain wasapplied. The contrast for structure sizes close to the resolution limit could therebybe enhanced significantly.
Compared to synchrotron-based microscopes the compact soft x-ray microscopesproduce images with a lower signal-to-noise ratio when the exposure times areacceptable. A denoising algorithm is one means to improve image quality. Sincethe images contain information on different size scales, this has to be taken intoconsideration by the noise-filtering method. Denoising procedures based on thewavelet transform show intrinsic advantages compared to Fourier-based methods.
5.1.1 Wavelet-based image denoising
When denoising images which contain structures of different sizes, it proves advan-tageous to treat the different spatial frequencies with regard to their position in thesignal. In wavelet analysis a scale parameter based on the local spatial frequencyis used rather than the global spatial frequency of the Fourier transform. Thus, asignal can be analyzed both in a position- and scale-dependent way.
A general introduction to wavelets and wavelet analysis is given by the bookby Daubechies [92]. References [93] and [94] give a detailed introduction into theuse of wavelet transforms in signal processing. Wavelet-based signal processinghas been applied to a variety of one-, two-, and three-dimensional data, see, e. g.,Refs. [95–97].
In the following, an introduction to the basic concepts is given. The continuouswavelet transform (CWT) is a way to localize the spectral components of a signal,since position and frequency information are given simultaneously. The CWT of asignal I(x) at a position x is defined as ( ∗ denotes the complex conjugate)
ΨψI (t, s) =
∫I(x)ψ∗
t,s(x)dx , (5.1)
where ψt,s(x) =1√|s| ψ
(x− t
s
). (5.2)
The transformed signal ΨψI (t, s) is a function of two variables: the translation t
and the scale s. Scale is defined as the inverse of the spatial frequency. Thetransforming function ψ(x) is called mother wavelet. The position of the motherwavelet is determined by the translation and its width by the scale. The CWT iscomputed by changing the width of the analysing window ψ, shifting this windowin position, multiplying with the signal, and integrating over all positions.

5.1. IMPROVING THE IMAGE QUALITY 33
Since the CWT is reversible, the original signal can be reconstructed by
I(x) = cψ
∫s
∫t
ΨψI (t, s)ψt,s(x)dt ds , (5.3)
where cψ is a constant which depends on the shape of the mother wavelet in thespatial domain of the signal. The mother wavelet can be chosen from a variety offunctions.
To implement the CWT, it has to be discretized. Both the scale parameter sand the translation t are discretized on a changing grid to preserve the resolutionproperties,
s = sjo with so > 1 ; j ε IN ,
t = ksjo to with to > 0 ; k ε IN .(5.4)
The continuous wavelet function (Eq. 5.2) can now be written with j and k as newparameters,
ψj,k(x) = s−j/2o ψ(s−jo x− kto) . (5.5)
The CWT (Eq. 5.1) and the reverse CWT (Eq. 5.3) of the discrete signal I(n)become
Ψψj,k
I =∑n
I(n)ψ∗j,k(n) , (5.6)
I(n) = cψj,k
∑j
∑k
Ψψj,k
I ψj,k(n) . (5.7)
The discretized CWT shows the same good position resolution at high spatial fre-quencies and good spatial-frequency resolution at low spatial frequencies as theCWT.
The idea behind wavelet denoising is to perform a multiscale analysis of thesignal. The basic scheme for multiscale analysis consists of repeated applicationsof two conjugate scaling transformations on the discrete signal I: I −→ L · I andI −→ H · I, where L is a low-pass filter and H a high-pass filter. The latter isformally defined as H · I = I − L · I. The repeated application of L allows oneto work on coarser and coarser resolution, whereas H allows to keep track of in-formation when passing from one scale to another. A method to implement thisscheme is the wavelet transform. The discrete wavelet transform (DWT) is usu-ally sampled on a dyadic grid (so = 2, to = 1 in Eq. 5.4). The DWT decomposesthe signal into a coarse approximation and detail information. In that way thesignal is analyzed at different spatial frequencies with different resolutions. Thedecomposition is done by a successive low- and high-pass filtering of the signal in
34 CHAPTER 5. IMAGE ANALYSIS FOR SOFT X-RAY MICROSCOPY
I(n)
H(n)
2
h1
L(n)
2
j
k
=1
=1,2...
H(n)
2
h2
L(n)
2
j
k
=2
=1,2...
H(n)
2
h3
L(n)
2
j
k
=3
=1,2...
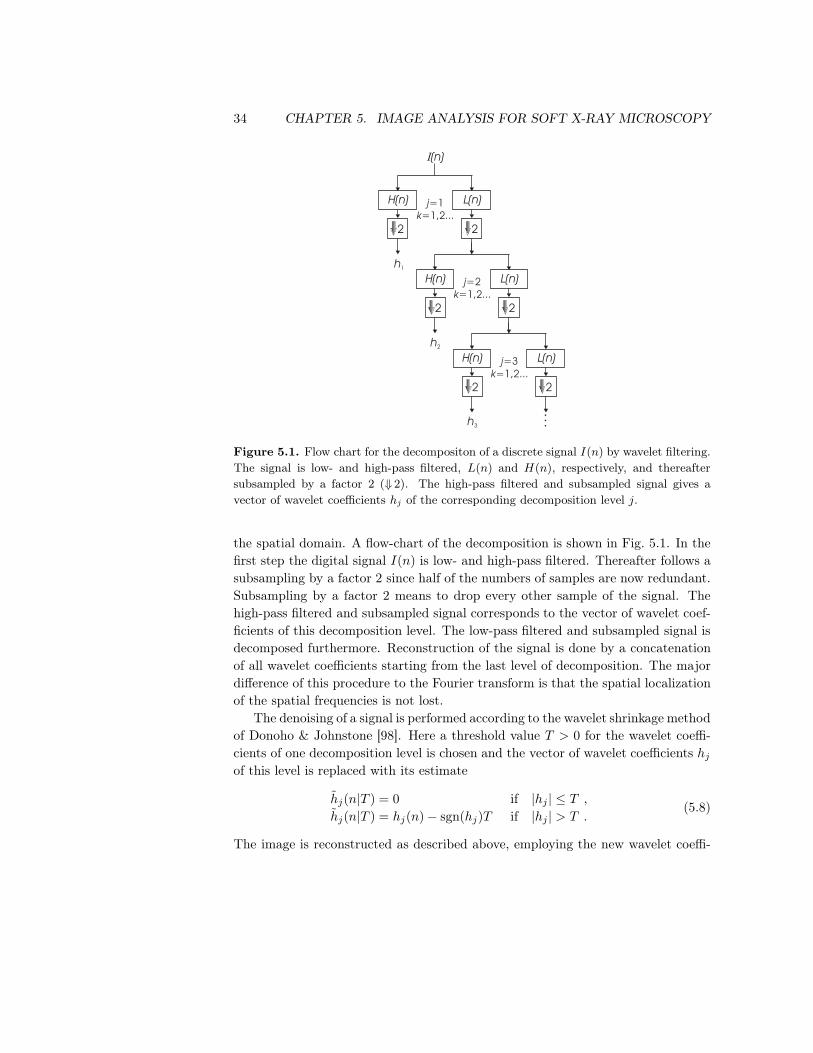
Figure 5.1. Flow chart for the decompositon of a discrete signal I(n) by wavelet filtering.The signal is low- and high-pass filtered, L(n) and H(n), respectively, and thereaftersubsampled by a factor 2 (⇓ 2). The high-pass filtered and subsampled signal gives avector of wavelet coefficients hj of the corresponding decomposition level j.
the spatial domain. A flow-chart of the decomposition is shown in Fig. 5.1. In thefirst step the digital signal I(n) is low- and high-pass filtered. Thereafter follows asubsampling by a factor 2 since half of the numbers of samples are now redundant.Subsampling by a factor 2 means to drop every other sample of the signal. Thehigh-pass filtered and subsampled signal corresponds to the vector of wavelet coef-ficients of this decomposition level. The low-pass filtered and subsampled signal isdecomposed furthermore. Reconstruction of the signal is done by a concatenationof all wavelet coefficients starting from the last level of decomposition. The majordifference of this procedure to the Fourier transform is that the spatial localizationof the spatial frequencies is not lost.
The denoising of a signal is performed according to the wavelet shrinkage methodof Donoho & Johnstone [98]. Here a threshold value T > 0 for the wavelet coeffi-cients of one decomposition level is chosen and the vector of wavelet coefficients hjof this level is replaced with its estimate
h̃j(n|T ) = 0 if |hj | ≤ T ,
h̃j(n|T ) = hj(n) − sgn(hj)T if |hj | > T .(5.8)
The image is reconstructed as described above, employing the new wavelet coeffi-

5.2. TOWARDS FUNCTIONAL IMAGING 35
cients h̃j .For the images taken by the vertical compact x-ray microscope based on a
methanol-jet source (cf. Chapt. 4) the denoising is performed with the SURE(Stein’s unbiased risk estimate) wavelet shrinkage procedure described by Donoho& Johnstone in Ref. [99]. A detailed description of the denoising algorithm canbe found in Paper 1. First the DWT is applied to the image as described above.After applying a threshold to the first two levels of decomposition (cf. Eq. 5.8),the reverse DWT produces the denoised image. The SURE method to choose thethreshold value is adapted to Poisson noise, which dominates in x-ray microscopeimages. With this denoising procedure the exposure time could be improved by afactor of about 2 while keeping the signal-to-noise ratio constant.
5.2 Towards functional imaging
To understand processes in cell biology, it is valuable to know the location of themolecules, mostly proteins, which are responsible for these processes [100]. Toenable the localization, proteins are labeled with markers. Immunolabeling is amethod to attach a marker to a protein and is often performed in two steps: First,a primary antibody binds to the protein to be investigated, a secondary antibodywith the attached marker binds to the primary antibody. The marker can then bedetected by a microscope equipped for the detection of this specific marker. Sincethe introduction of colloidal gold as a marker for electron microscopy in 1971 byFaulk & Taylor [101], these markers are widely used both in electron microscopyand light microscopy [102,103]. To study different proteins simultaneously, double-labeling experiments are performed where different proteins are labeled with dif-ferent markers. In electron microscopy double-labeling experiments with colloidalgold as marker are based on both element-selective and size-selective detectionmethods [102,104].
To increase the visibility of the colloidal-gold markers a silver intensificationwas introduced [105,106]. This technique provides an additional amplification step.Silver enhancement is based on the photochemical process commonly used in pho-tographic films where silver ions are reduced to metallic silver. Gold acts as ancatalyst in this reaction, metallic silver is deposited on the gold particles increasingthereby the particle size from a few to a few tens of nanometers.
5.2.1 Colloidal gold in x-ray microscopy
Colloidal gold with subsequent silver enhancement has been used as label in differentfields of soft x-ray microscopy. The first experiments date back to the beginningof the 1990s, where surface proteins were labeled with silver-enhanced colloidal

36 CHAPTER 5. IMAGE ANALYSIS FOR SOFT X-RAY MICROSCOPY
gold for imaging by contact x-ray microscopy [107]. Other experiments had thepurpose of investigating proteins located in the nuclei with transmission x-ray mi-croscopy [108,109] or to visualize the low-contrast microtubule network of cells [110].The images with the labeled proteins were compared to images of unlabeled speci-mens or to images taken with other microscopy techniques, e. g., light microscopy,confocal microscopy, or electron microscopy. The immunolabeling with gold wasmainly performed to enhance the contrast in these experiments. An accurate lo-calization of single proteins was not done. In scanning x-ray microscopy, Chapmanand colleagues investigated dark-field imaging of gold-labeled cells [111]. In thedark-field image only the signal of the gold particles is detected and in combina-tion with the bright-field image a localization of the gold particles within 60 nmis possible [112]. Recently x-ray tomography experiments have been performed,where specimens were labeled with silver-enhanced colloidal gold and additionalgold particles of 100-nm size were used as fiducial markers [113,114].
In transmission x-ray microscopy, the above mentioned techniques do not allowthe determination of the exact location of the proteins. Thus size-selective double-labeling experiments would be difficult to perform.
5.2.2 Localization of gold particles in x-ray microscopy images
To stimulate further experiments on functional imaging in transmission x-ray mi-croscopy an image-analysis algorithm to localize single gold particles was developed.This algorithm is based both on intensity information and size information, as de-scribed in detail in Paper 3. To develop and evaluate the algorithm, images ofsamples containing diatoms and gold particles of different sizes (40-100 nm) wererecorded at the transmission x-ray microscope at BESSY II [115]. Diatoms as cell-like specimens were used in order to have a number of durable samples, even if theidentification of gold particles was more demanding in this background structurethan, e. g., in a cell. The input parameters for the algorithm are the nominal sizeof the gold particles, as given by the manufacturer, and the average absorptionfor these particles, which can be calculated with help of the previously determinedcontrast of gold particles in the employed microscope. The principle steps in thealgorithm are the application of a threshold followed by two perpendicular one-dimensional Gaussian fits to the pre-identified regions of interest. The Gaussianfits are the crucial step for a shape discrimination and thereby cause the size selec-tivity of the algorithm.
We showed that the image-analysis algorithm performs very well for larger par-ticle diameters with a high signal-to-noise ratio. For smaller particles, a highsignal-to-noise ratio and a particle diameter of at least five pixels are necessaryto separate the particles from the background structure. The algorithm proved

5.2. TOWARDS FUNCTIONAL IMAGING 37
to be size-selective for 50-nm and 80-nm gold particles, which can be utilized indouble-labeling experiments. The diameters of the used gold particles should inthis case differ sufficiently as should their average absorption value. Similar resultsas for the BESSY-II images were obtained when the algorithm was applied to im-ages recorded by the compact x-ray microscope based on a liquid-nitrogen source.For silver-enhanced colloidal-gold markers it is possible to use the image-analysisalgorithm, if the water-window wavelength in the experiment is below a wavelengthλ ≈ 3 nm. For longer wavelengths the attenuation length of silver increases signifi-cantly, and, thus, the signal-to-noise ratio for small silver particles decreases.
The algorithm may be applied for accurate localization of proteins labeled withgold particles. Silver enhancement may be necessary to obtain particles with resolv-able sizes. For x-ray tomography these silver-enhanced gold particles can be usedsimultaneously as fiducial markers. Due to the size sensitivity of the algorithm,double-labeling experiments comparable to those done with electron microscopyare feasible.


Chapter 6
Summary of the Original Work
This Thesis is based on the articles listed below. The author has been the mainresponsible for Papers 1, 3, 4, and 6. The programming of the algorithm in Paper 1was done by the second author J. Boutet de Monvel. In Paper 4 the author did notparticipate in the development of the fabrication process of the Cr/Sc multilayers.This work was done by the second author S. Yulin. In the other papers the authorhas been active in the planning and performing of the experiments and the evalu-ation of the results.
Paper 1 describes an image-restoration method for compact soft x-ray microscopyimages. The image restoration, namely denoising, is based on multiscale analysisimplemented with the wavelet transform. With this method the exposure timescan be reduced by a factor of 2 at constant signal-to-noise ratio.
Paper 2 reports on the experiments done to spatially characterize the liquid-jetlaser-plasma source. The targets in these experiments were a methanol and anethanol jet. Characterization of the source parameters was done for different laserenergies, different pulse lengths, and different jet diameters.
Paper 3 describes an image-analysis algorithm to identify single gold particles inx-ray microscope images. The size-sensitive algorithm was developed and evaluatedwith images taken at the transmission x-ray microscope at BESSY II in Berlin. Thealgorithm was furthermore successfully tested on images taken by the compact softx-ray microscope based on a liquid-nitrogen source.
Paper 4 presents the development of large-diameter spherical Cr/Sc multilayermirrors, suitable as condenser in the compact x-ray microscope. The mirrors ope-
39

40 CHAPTER 6. SUMMARY OF THE ORIGINAL WORK
rate at λ = 3.374 nm and show an average reflectivity of 3% with good uniformity.Thus, exposure time in the compact x-ray microscope was improved by a factor of10.
Paper 5 presents the instrumentation and performance of a sub-30 nm resolu-tion compact x-ray microscope based on a liquid-nitrogen laser-plasma source.The microscope works in the lower wavelength region of the water window, atλ = 2.478 nm. First applications, e. g., imaging of test samples for the gold-identification algorithm and of wet specimens, were performed.
Paper 6 describes the wet-specimen chamber which was developed for the verticalcompact microscope working at λ = 3.374 nm. Since in this microscope the sampleis mounted in vacuum, the wet-specimen chamber had to be vacuum compatible.This was achieved by a combined mechanical sealing and glueing. The workingprinciple was demonstrated by imaging lipid solution. The horizontal mount of thewet-specimen chamber makes it especially appropriate for investigations in polymerand soil science.

Acknowledgements
This work would not have been possible without the help and support by many,I wish to express my gratitude to all of them.
First I would like to thank my supervisor Hans Hertz for his guidance, support,and encouragement during my research.
During these years I had the opportunity to work together with many people indifferent projects. I would like to thank all past and present members of the teamworking somewhere on the construction site "X-ray microscope": Göran Johans-son, Per Takman, Anders Holmberg, Jaco de Groot, Stefan Rehbein, and MagnusLindblom. There was always somebody to ask, always somebody to discuss with,always somebody to hear me crying, and always somebody to celebrate successfulexperiments with. Many thanks to Jacques Boutet de Monvel from the Center forHearing and Communication Research, Karolinska University Hospital, who intro-duced me to the principles of wavelet transforms and did the initial programmingon the denoising algorithm. Thanks to Ulrich Vogt und Rolf Frueke for a goodtime in the lab during the characterization of the methanol source. I am gratefulto Peter Guttmann at BESSY II in Berlin, who worked many night shifts to recordimages for the colloidal-gold project, and to Rikard Gothäll, whose method to findlatex spheres was a starting point for my gold rush. My thanks also go to SergiyYulin from the Fraunhofer IOF in Jena, who fabricated the new multilayer mirrors,which made doing microscopy fun. I would especially like to thank the people whohelped me with the wet-specimen-chamber project during all those years: MilanPokorny, who had many clever mechanical ideas, without him I would have beenlost, and Rolf Helg and Kjell Hammarström from the mechanical workshop for theirpatience when another idea should be tested.
Thanks to all past and present colleagues at the Biomedical & X-Ray Physicsdivision - ingen nämnd, ingen glömd. Thank you for all interesting discussionsand for making BIOX a wonderful place to work. My special thanks go to An-ders Liljeborg, who never complained (openly) about my computer problems, toGöran Manneberg, who showed me how much fun teaching can be, and to JessicaHultström for her valuable help in the cell lab.
41

42 ACKNOWLEDGEMENTS
Very important are all the people who made my stay in Sweden a success: Ullaand Lars Åkerlind, who made me feel welcome. Linda Lundström, who became aclose friend after all the years sharing the office. Per Takman, with whom doingmicroscopy was great and who became a friend. Thanks to my family back homeand all my friends, wherever they live. I would especially like to thank UlrichNeuhäusler, who convinced me to try out x-ray microscopy research. Thanks alsoto Andreas Hirstius - whenever I had a LATEX-problem, he knew help.

Bibliography
[1] R. Hooke, Micrographia. Project Gutenberg, http://www.gutenberg.org/(2005).
[2] S. Bradbury. The quality of the image produced by the compound microscope:1700-1840. In: S. Bradbury and G. L’ E. Turner (eds.), Historical Aspects ofMicroscopy, 151–173. Heffer, Cambridge (1967).
[3] F. Zernike, Phase contrast. A new method for the microscopic observation oftransparent objects. Physica 9 (7), 686–698 (1942).
[4] G. Nomarski and A. R. Weill, Application à la métallographie des méthodesinterférentielles à deux ondes polarisées. Revue de métallurgie LII (2), 121–134 (1955).
[5] M. Born and E. Wolf, Principles of Optics, Chapter 6.6, Cambridge Univer-sity Press (1999).
[6] V. Westphal and S. W. Hell, Nanoscale resolution in the focal plane of anoptical microscope. Phys. Rev. Lett. 94, 143903 (2005).
[7] K. I. Willig et al., STED microscopy reveals that synaptotagmin remainsclustered after synaptic vesicle exocytosis. Nature 440, 935–939 (2006).
[8] M. Knoll and E. Ruska, Das Elektronenmikroskop. Mitteilungen aus demHochspannungslaboratorium der Technischen Hochschule Berlins, 318–339(1932).
[9] B. Niemann, D. Rudolph, and G. Schmahl, X-ray microscopy with syn-chrotron radiation. Appl. Opt. 15 (8), 1883–1884 (1976).
[10] G. Binnig, H. Rohrer, Ch. Gerber, and E. Weibel, Surface studies by scanningtunneling microscopy. Phys. Rev. Lett. 49 (1), 57–61 (1982).
[11] G. Binnig, C. F. Quate, and Ch. Gerber, Atomic force microscope. Phys.Rev. Lett. 56 (9), 930–934 (1986).
43
44 BIBLIOGRAPHY
[12] W. C. Röntgen, Ueber eine neue Art von Strahlen. Sitzungsberichte derphysikal.-medicin. Gesellschaft, 132–141 (1895).
[13] D. Attwood, Soft X-Rays and Extreme Ultraviolet Radiation. CambridgeUniversity Press (2000).
[14] A. G. Michette, Optical systems for soft X-rays. Plenum Press, New York(1986).
[15] B. L. Henke, E. M. Gullikson, and J. C. Davis, X-ray interactions: Photoab-sorption, scattering, transmission and reflection at E = 50-30,000 eV, Z =1-92. Atomic Data and Nuclear Data Tables 54 (2), 181–342 (1993).
[16] A. H. Compton, The total reflection of x-rays. Phil. Mag. 45 (270), 1121–1131(1923).
[17] A. V. Baez and P. Kirkpatrick, Design and construction of an x-ray micro-scope. Phys. Rev. 78 (1), 83 (1950).
[18] A. V. Baez, Fresnel zone plate for optical image formation using extremeultraviolet and soft x radiation. J. Opt. Soc. Am. 51 (4), 405–412 (1961).
[19] G. Schmahl and D. Rudolph, Lichtstarke Zonenplatten als abbildende Systemefür weiche Röntgenstrahlung. Optik 29 (6), 577–585 (1969).
[20] G. Schmahl and D. Rudolph (eds.), X-Ray Microscopy. Springer-Verlag,Berlin (1984).
[21] D. Sayre, M. Howells, J. Kirz, and H. Rarback (eds.), X-Ray Microscopy II.Springer-Verlag, Berlin (1988).
[22] A. Michette, G. Morrison, and C. Buckley (eds.), X-Ray Microscopy III.Springer-Verlag, Berlin (1992).
[23] V. V. Aristov and A. I. Erko (eds.), X-Ray Microscopy IV. BogorodskiiPechatnik, Chernogolovka (1994).
[24] J. Thieme, G. Schmahl, D. Rudolph, and E. Umbach (eds.), X-Ray Mi-croscopy and Spectromicroscopy. Springer-Verlag, Berlin (1998).
[25] W. Meyer-Ilse, T. Warwick, and D. Attwood (eds.), X-Ray Microscopy. AIP,Melville (2000).
[26] J. Susini, D. Joyeux, and F. Polack (eds.), X-Ray Microscopy. EDP Sciences,Les Ulis (2003).
45
[27] S. Aoki, Y. Kagoshima, and Y. Suzuki (eds.), X-Ray Microscopy. IPAP, Tokyo(2006).
[28] W. Chao et al., Soft x-ray microscopy at a spatial resolution better than15 nm. Nature 435, 1210–1213 (2005).
[29] L. Reimer, Transmission Electron Microscopy. Springer Verlag, Berlin (1984).
[30] G. Schneider et al., Cryo x-ray microscopy. Synchrotron Radiation News 8(3), 19–28 (1995).
[31] D. Sayre et al., Transmission microscopy of unmodified biological materi-als: Comparative radiation dosages with electron and ultrasoft x-ray photons.Ultramicroscopy 2, 337–349 (1977).
[32] G. Schmahl et al., Phase contrast x-ray microscopy studies. Optik 97 (4),181–182 (1994).
[33] G. Schneider, High-Resolution X-Ray Microscopy of Radiation Sensitive Ma-terial. Cuvillier Verlag, Göttingen (1999).
[34] T. Wilhein et al., Differential interference contrast x-ray microscopy withsubmicron resolution. Appl. Phys. Lett. 78 (14), 2082–2084 (2001).
[35] A. C. Thompson et al. (eds.), X-ray data booklet. Lawrence Berkeley NationalLaboratory, Berkeley (2001).
[36] B. J. MacGowan et al., Demonstration of x-ray amplifiers near the carbon Kedge. Phys. Rev. Lett. 65 (4), 420–423 (1990).
[37] L. Rymell, M. Berglund, and H. M. Hertz, Debris-free single-line laser plasmasource for microscopy. Appl. Phys. Lett. 66 (20), 2625–2627 (1995).
[38] R. Lebert, W. Neff, and D. Rothweiler, Pinch plasma source for x-ray mi-croscopy with nanosecond exposure time. J. X-Ray Sci. Technol. 6, 107–140(1996).
[39] D. Rudolph et al., Wet specimen imaging with an x-ray microscope with apulsed plasma source. In [23], 381–386.
[40] S. Nakayama et al., Zone-plate x-ray microscope using a laser plasma source.Jpn. J. Appl. Phys. 33 (2/9A), L1280–L1282 (1994).
[41] H. M. Hertz et al., Normal-incidence condenser mirror arrangement for com-pact water-window x-ray microscopy. Proc. SPIE 3766, 247–251 (1999).

46 BIBLIOGRAPHY
[42] G. Schmahl et al., A laboratory x-ray microscope with a plasma x-ray source.In [22], 66–69.
[43] S. Aoki, T. Ogata, S. Sudo, and T. Onuki, Sub-100 nm-resolution grazingincidence soft x-ray microscope with a laser-produced plasma source. Jpn. J.Appl. Phys. 31, 3477–3480 (1992).
[44] M. Hoshino and S. Aoki, Development of a soft x-ray microscope with Woltermirrors for the observation of biological specimens in the atmospheric. In [27],124–126.
[45] A. G. Michette et al., Soft x-ray contact microscopy using laser plasmasources. J. Phys. D: Appl. Phys. 19, 363–372 (1986).
[46] A. G. Michette et al., Progress with the King’s College laboratory scanningx-ray microscope. In [26], 123–126.
[47] D. Attwood, Chapter 6, in [13].
[48] L. Malmqvist, L. Rymell, M. Berglund, and H. M. Hertz, Liquid-jet targetfor laser-plasma soft x-ray generation. Rev. Sci. Instrum. 67 (12), 4150–4153(1996).
[49] J. A. Samson and D. L. Ederer (eds.), Vacuum Ultraviolet Spectroscopy I,Chapter 4, Academic Press, San Diego (1998).
[50] C. G. Schroer and B. Lengeler, Focusing hard x rays to nanometer dimensionsby adiabatically focusing lenses. Phys. Rev. Lett. 94, 054802 (2005).
[51] A. Snigirev, V. Kohn, I. Snigireva, and B. Lengeler, A compound refractivelens for focusing high-energy x-rays. Nature 384, 49–51 (1996).
[52] E. Spiller, Soft X-Ray Optics. SPIE Optical Engineering Press, Bellingham(1994).
[53] M. Born and E. Wolf, Chapter 1, in [5].
[54] http://www-cxro.lbl.gov.
[55] P. Kirkpatrick and A. V. Baez, Formation of optical imaging by x-rays. J.Opt. Soc. Am. 38 (9), 766–774 (1948).
[56] H. Wolter, Spiegelsysteme streifenden Einfalls als abbildende Optiken fürRöntgenstrahlen. Ann. Physik 10, 94–114 (1952).

47
[57] D. L. Windt, IMD - Software for modeling the optical properties of multilayerfilms. Computer in Physics 12 (4), 360–370 (1998).
[58] http://www-cxro.lbl.gov/multilayer/survey.html.
[59] N. N. Salashchenko and E. A. Shamov, Short-period x-ray multilayers basedon Cr/Sc. Opt. Commun. 134, 7–10 (1997).
[60] S. Yulin, F. Schäfers, T. Feigl, and N. Kaiser, High-performance Cr/Sc mul-tilayers for the soft x-ray range. Proc. SPIE 5193, 172–176 (2004).
[61] F. Eriksson et al., 14.5% near-normal incidence reflectance of Cr/Sc x-raymultilayer mirrors for the water window. Opt. Lett. 28 (24), 2494–2496(2003).
[62] E. M. Gullikson, F. Salmassi, A. L. Aquila, and F. Dollar, Progress in shortperiod multilayer coating for water window applications. In: The 8th Inter-national Conference on The Physics of X-Ray Multilayer Structures, S8 O4(abstract). Sapporo, Japan (2006).
[63] J. L. Soret, Ueber die durch Kreisgitter erzeugten Diffractionsphänomene.Annalen der Physik und Chemie 156, 99–113 (1875).
[64] D. Attwood, Chapter 9, in [13].
[65] M. Young, Zone plates and their aberrations. J. Opt. Soc. Am. 62 (8),972–976 (1972).
[66] Y. Vladmimirsky and H. W. P. Koops, Moiré method and zone plate patterninaccuracies. J. Vac. Sci. Technol. B 6 (6), 2142–2146 (1988).
[67] Lord Rayleigh, Wave theory of light. Encyclopaedia Britannica (9th ed.)XXVI, 429–451 (1888).
[68] J. Maser, Theoretische Beschreibung der Beugungs- und Abbildungseigen-schaften hochauflösender Zonenplatten für die Röntgenmikroskopie. VerlagShaker, Aachen (1994).
[69] D. Hambach, Nanostrukturen mit hohem Aspektverhältnis als lichtstarkeRöntgenoptiken für hohe Beugungsordnungen, Chapter 2, Cuvillier Verlag,Göttingen (2001).
[70] M. Peuker, High-efficiency nickel phase zone plates with 20 nm minimumoutermost zone width. Appl. Phys. Lett. 78 (15), 2208–2210 (2001).
48 BIBLIOGRAPHY
[71] M. Berglund et al., Compact water-window transmission x-ray microscopy.J. Microsc. 197 (3), 268–273 (2000).
[72] G. A. Johansson, A. Holmberg, H. M. Hertz, and M. Berglund, Design andperformance of a laser-plasma-based compact soft x-ray microscope. Rev. Sci.Instrum. 73 (3), 1193–1197 (2002).
[73] P. A. C. Jansson, U. Vogt, and H. M. Hertz, Liquid-nitrogen-jet laser-plasmasource for compact soft x-ray microscopy. Rev. Sci. Instrum. 76, 43503 (2005).
[74] J. de Groot, G. A. Johansson, and H. M. Hertz, Capillary nozzles for liquid-jetlaser-plasma x-ray sources. Rev. Sci. Instrum. 74 (8), 3881–3882 (2003).
[75] T. Wilhein et al., Off-axis reflection zone plate for quantitative soft X-raysource characterization. Appl. Phys. Lett. 71 (2), 190–192 (1997).
[76] S. Rehbein et al., Fabrication and characterization of a condenser zone platefor compact x-ray microscopy. J. Vac. Sci. Technol. B 22 (3), 1118–1122(2004).
[77] M. Bertilson, Zone-Plate Diffraction Efficiency Measurements using a Com-pact Soft X-Ray Laser-Plasma Source, Master’s thesis, Royal Institute ofTechnology/KTH, Stockholm (2006).
[78] A. Holmberg, S. Rehbein, and H. M. Hertz, Nano-fabrication of condenserand micro-zone plates for compact x-ray microscopy. Microelectron. Eng.73-74, 639–643 (2004).
[79] A. Holmberg, M. Lindblom, S. Rehbein, and H. M. Hertz, Nickel zone platesfor compact soft x-ray microscopy. In [27], 124–126.
[80] T. Wilhein, Gedünnte CCDs: Charakterisierung und Anwendungen im Be-reich weicher Röntgenstrahlung. Verlag Shaker, Aachen (1994).
[81] A. P. Hitchcock et al., Soft x-ray spectromicroscopy of biological and syntheticpolymer systems. J. Electron. Spectrosc. Relat. Phenom. 144-147, 259–269(2005).
[82] U. Neuhäusler, S. Abend, C. Jacobsen, and G. Lagaly, Soft x-ray spectro-microscopy on solid-stabilized emulsions. Colloid Polym. Sci. 277, 719–726(1999).
[83] R. Medenwaldt, C. David, N. Hertel, and E. Uggerøj, The Aarhus x-ray mi-croscope. In [23], 322–326.

49
[84] B. Niemann et al., The new Göttingen x-ray microscope with object holder inair for wet specimens. In [23], 66–75.
[85] W. Meyer-Ilse et al., X-ray microscopy in Berkeley. In [24], I3–I12.
[86] U. Neuhäusler et al., A specimen chamber for soft x-ray spectromicroscopyon aqueous and liquid samples. J. Synchrotron Rad. 7, 110–112 (2000).
[87] R. C. Gonzales and R. E. Woods, Digital Image Processing. Addison-Wesley,Reading (1993).
[88] J.-B. Sibarita, Formation et restauration des images en microscopie a rayonsX & application a l’observation d’enchantillons biologiques, PhD thesis, Uni-versité Joseph Fourier, Grenoble (1996).
[89] J. Lehr, J.-B. Sibarita, and J.-M. Chassery, Image restoration in x-ray mi-croscopy: PSF determination and biological applications. IEEE Trans. ImageProc. 7 (2), 258–263 (1998).
[90] J.-B. Sibarita, J.-M. Chassery, and M. Robert-Nicoud, Image restorationapplied to x-ray microscopy - Application to images with low signal to noiseratio. Proc. SPIE 2329, 337–347 (1995).
[91] J.-B. Sibarita et al., Image quality enhancement in x-ray microscopy. In [24],I135–I139.
[92] I. Daubechies, Ten Lectures on Wavelets. Society for Industrial and AppliedMathematics, Philadelphia (1992).
[93] P. Maaß and H.-G. Stark, Wavelets and digital image processing. Surv. Math.Ind. 4, 195–235 (1994).
[94] S. Mallat, A Wavelet Tour of Signal Processing. Academic Press, San Diego(1999).
[95] M. Fligge and S. K. Solanski, Noise reduction in astronomical spectra usingwavelet packets. Astron. Astrophys. Suppl. Ser. 124 (3), 579–587 (1997).
[96] J. L. Starck, A. Bijaoui, and C. Perrier, Image reconstruction by the wavelettransform applied to aperture synthesis. Astron. Astrophys. 283, 349–360(1994).
[97] J. Boutet de Monvel, S. Le Calvez, and M. Ulfendahl, Image restoration forconfocal microscopy: Improving the limits of deconvolution, with applicationto the visualization of the mammalian hearing organ. Biophys. J. 80 (5),2455–2470 (2001).

50 BIBLIOGRAPHY
[98] D. L. Donoho and I. M. Johnstone, Ideal spatial adaptation by waveletshrinkage. Biometrika 81 (3), 425–455 (1994).
[99] D. L. Donoho and I. M. Johnstone, Adapting to unknown smoothness viawavelet shrinkage. JASA 90 (432), 1200–1224 (1995).
[100] B. Alberts et al., Molecular Biology of the Cell. Garland Publishing, NewYork (2002).
[101] W. P. Faulk and G. M. Taylor, An immunocolloid method for the electronmicroscope. Immunochemistry 8, 1081–1083 (1971).
[102] J. Roth. The colloidal gold marker system for light and electron microscopiccytochemistry. In: G. R. Bullock and P. Petrusz (eds.), Techniques in Im-munochemistry, vol. 2, 217–284. Academic Press, London (1983).
[103] J. Roth, The silver anniversary of gold: 25 years of the colloidal gold markersystem for immunocytochemistry and Histochemistry. Histochem. Cell Biol.106 (1), 1–8 (1996).
[104] J. Roth and M. Binder, Colloidal gold, ferritin and peroxidase as markersfor electron microscopic double labeling lectin techniques. J. Histochem. Cy-tochem. 26 (3), 163–169 (1978).
[105] G. Danscher, Localization of gold in biological tissue. Histochemistry 71 (1),81–88 (1981).
[106] P. M. Lackie, Immunogold silver staining for light microscopy. Histochem.Cell Biol. 106 (1), 9–17 (1996).
[107] S. H. Jia, W. D. Yan, X. W. Xuan, and T. E. Sheng, Soft x-ray images ofimmunogold labelling of tumor cell surface antigens. In [22], 413–416.
[108] L. B. Da Silva et al., X-ray laser microscopy of rat sperm nuclei. Science258, 269–271 (1992).
[109] S. Vogt et al., X-ray microscopic studies of the Drosophila dosage compensa-tion complex. J. Struct. Biol. 132 (2), 123–132 (2000).
[110] W. Meyer-Ilse et al., High resolution protein localization using soft x-raymicroscopy. J. Microsc. 201 (3), 395–403 (2001).
[111] H. N. Chapman, C. Jacobsen, and S. Williams, A characterisation of dark-field imaging of colloidal gold labels in a scanning transmission x-ray micro-scope. Ultramicroscopy 62, 191–213 (1996).
51
[112] H. N. Chapman, J. Fu, C. Jacobsen, and S. Williams, Dark-field x-ray mi-croscopy of immunogold-labeled cells. J. Microscopy Soc. Amer. 2 (2), 53–62(1996).
[113] G. Schneider et al., Computed tomography of cryogenic cells. Surf. Rev. Lett.9 (1), 177–183 (2002).
[114] C. A. Larabell and M. A. Le Gros, X-ray tomography generates 3-D recon-structions of the yeast, Saccharomyces cerevisiae, at 60-nm resolution. Mol.Biol. Cell 15, 957–962 (2004).
[115] P. Guttmann et al., The transmission x-ray microscope at BESSY II. In [26],85–90.