commute-friendly, gas-electric hybrid vehicle testing
TRANSCRIPT

Portland State University Portland State University
PDXScholar PDXScholar
TREC Final Reports Transportation Research and Education Center (TREC)
10-2013
Commute-Friendly, Gas-Electric Hybrid Vehicle Commute-Friendly, Gas-Electric Hybrid Vehicle
Testing Testing
James Long Oregon Institute of Technology
Hugh Currin Oregon Institute of Technology
Xin Wang Oregon Institute of Technology
Follow this and additional works at: https://pdxscholar.library.pdx.edu/trec_reports
Part of the Environmental Sciences Commons, and the Transportation Commons
Let us know how access to this document benefits you.
Recommended Citation Recommended Citation Long, J., Currin, H., Wang, X., Commute-Friendly Gas-Electric Hybrid Vehicle Testing. OTREC-RR-13-11. Portland, OR: Transportation Research and Education Center (TREC), 2013. https://doi.org/10.15760/trec.64
This Report is brought to you for free and open access. It has been accepted for inclusion in TREC Final Reports by an authorized administrator of PDXScholar. Please contact us if we can make this document more accessible: [email protected].

A National University Transportation Center sponsored by the U.S. Department of
Transportation’s Research and Innovative Technology Administration
OREGON
TRANSPORTATION
RESEARCH AND
EDUCATION CONSORTIUM OTREC FINAL REPORT


COMMUTE-FRIENDLY, GAS-ELECTRIC HYBRID
VEHICLE TESTING
Final Report
OTREC-RR-497
by
Prof. James N. Long
Prof. Hugh Currin, Ph.D.
Prof. Xin Wang, Ph. D.
Oregon Institute of Technology
for
Oregon Transportation Research
and Education Consortium (OTREC)
P.O. Box 751
Portland, OR 97207
October 2013


i
Technical Report Documentation Page 1. Report No.
OTREC-RR-13-11
2. Government Accession No.
3. Recipient’s Catalog No.
4. Title and Subtitle COMMUTE-FRIENDLY, GAS-ELECTRIC HYBRID VEHICLE TESTING
5. Report Date October 2013
6. Performing Organization Code
7. Author(s) Prof. James N. Long
Prof. Hugh Currin, Ph.D.
Prof. Xin Wang, Ph. D.
8. Performing Organization Report No.
9. Performing Organization Name and Address
Oregon Institute of Technology 3201 Campus Drive
Klamath Falls, Oregon 97624
10. Work Unit No. (TRAIS)
11. Contract or Grant No.
12. Sponsoring Agency Name and Address
Oregon Transportation Research
and Education Consortium (OTREC) P.O. Box 751
Portland, Oregon 97207
13. Type of Report and Period Covered
14. Sponsoring Agency Code
15. Supplementary Notes
16. Abstract
Overview
Green Lite Motors is a Portland-based company building a hybrid commuter vehicle targeted for urban and suburban areas. The vehicle is a front/back, two-seat configuration with three wheels (two front and one rear-drive wheel). The vehicle is classed as a motorcycle, giving it all
the advantages of a smaller footprint in parking and highway travel; however, the advanced roll-cage design and fairing give the vehicle safety
and comfort advantages of a standard passenger car. The unique combination of internal combustion engine and electric motor give the vehicle mileage possibilities greater than 100 mpg as well as the convenience and advantages of a plug-in hybrid. The current vehicle has been
developed with a gas-electric hybrid drive system as result of a prior Oregon BEST Commercialization Grant. The coverage of the OTREC
grant effort relates to the dynamometer and highway testing for verification of mechanical operation, computer hardware and software integration, and control algorithm operational efficiency as well as implementation of resulting modifications related to initial system issues.
Mechanical System
The mechanical system involves the testing of the hybrid interface system proving seamless utilization and control of the internal combustion engine and electric motor. The configuration will be analyzed and tests will be designed for validation and verification of mechanical system
integrity.
Embedded Control System Objective
The embedded control system consists of a real-time computer system tasked with calculation and application throttle control to the internal
combustion engine and electric motor. The control system acquires real-time data from the internal combustion engine propulsion system, the
electric motor propulsion system, and the vehicle user. From this input, both propulsion systems will be digitally controlled with the goal of optimizing power plant operation to get the most efficient use of the provided energy stores for moving the vehicle at the users desired
performance levels. This system must be exhaustively tested for fault conditions and commissioned for optimal operation.
Integrated System
The vehicle will be dynamometer tested as a fully functional system. Different driving scenarios will be tested for vehicle performance,
handling, and control system behavior. Mileage factors will be derived with a goal of 100 mpg under normal operation.
17. Key Words
Hybrid Vehicle, Gas-Electric Hybrid
18. Distribution Statement
No restrictions. Copies available from OTREC:
www.otrec.us
19. Security Classification (of this report)
Unclassified
20. Security Classification (of this page)
Unclassified
21. No. of Pages
42
22. Price

ii

iii
ACKNOWLEDGEMENTS
The principal investigators of this grant would like to recognize the help and support given by
OTREC and affiliates. We would especially like to thank Hau Hagedorn and Carol Wallace for
help in report preparation, budget management and timeline maintenance. We would also like to
recognize the work put into the project by Tim Miller, CEO of Green Lite Motors, and Bob
Simpson, CEO of EV Drive, for their help and guidance in the construction and troubleshooting
of the various components used in vehicle construction.
DISCLAIMER
The contents of this report reflect the views of the authors, who are solely responsible for the
facts and the accuracy of the material and information presented herein. This document is
disseminated under the sponsorship of the U.S. Department of Transportation University
Transportation Centers Program, Oregon Transportation Research and Education Consortium,
Oregon Institute of Technology and Green Lite Motors, Inc. in the interest of information
exchange. The U.S. Government, Oregon Transportation Research and Education Consortium,
Oregon Institute of Technology and Green Lite Motors, Inc. assume no liability for the contents
or use thereof. The contents do not necessarily reflect the official views of the U.S. Government
Oregon Transportation Research and Education Consortium, Oregon Institute of Technology or
Green Lite Motors, Inc. This report does not constitute a standard, specification, or regulation.

iv

v
TABLE OF CONTENTS
EXECUTIVE SUMMARY .......................................................................................................... 1
1.0 PROJECT DESCRIPTION ............................................................................................. 3 1.1 VEHICLE DESIGN ............................................................................................................ 3
1.1.1 Previous Prototype Modifications............................................................................... 4 1.1.2 Next-generation Prototype Design .............................................................................. 5
1.1.2.1 Mechanical Systems ................................................................................................ 5 1.1.2.2 Electrical System ................................................................................................... 10
1.1.2.3 Digital System ....................................................................................................... 14 1.2 TEST PLATFORM ........................................................................................................... 16
1.2.1 Dynamometer ............................................................................................................ 16
1.2.2 Vehicle Instrumentation ............................................................................................ 18 1.2.2.1 Fuel Consumption ................................................................................................. 19 1.2.2.2 Electrical Power Consumption ............................................................................. 20
1.2.3 Data Acquisition ....................................................................................................... 20
1.3 EDUCATIONAL OBJECTIVES ..................................................................................... 21
2.0 TESTING METHODOLOGY ....................................................................................... 23 2.1 OVERVIEW ..................................................................................................................... 23 2.2 INTERNAL COMBUSTION DRIVE TESTING ............................................................ 23 2.3 ELECTRIC DRIVE TESTING......................................................................................... 23
2.4 HYBRID DRIVE TESTING ............................................................................................ 23
3.0 TESTING RESULTS.................................................................................................... 244 3.1 OVERVIEW ................................................................................................................... 244
3.2 INTERNAL COMBUSTION RESULTS ....................................................................... 244
3.3 ELECTRIC DRIVE RESULTS ...................................................................................... 255 3.4 HYBRID DRIVE RESULTS ............................................................................................ 29
4.0 ANALYSIS .................................................................................................................... 300 4.1 OVERVIEW ................................................................................................................... 300 4.2 INTERNAL COMBUSTION ......................................................................................... 300
4.3 ELECTRIC DRIVE ........................................................................................................ 300 4.4 HYBRID DRIVE ............................................................................................................ 311 4.5 EDUCATIONAL OUTCOME ....................................................................................... 311
5.0 CONCLUSION ............................................................................................................. 322
6.0 REFERENCES .............................................................................................................. 344
LIST OF TABLES
Table 1.1: Futurlec flow meter pulse calibration .......................................................................... 19 Table 3.1: Gasoline drive system testing results – Test 1 ........................................................... 255
Table 3.2: Gasoline drive system testing results – Test 2 ........................................................... 255 Table 3.3: Electric drive system testing results .......................................................................... 266 Table 3.4: Hybrid drive system testing results – 20 amps ............................................................ 29

vi
LIST OF FIGURES
Figure 1.1 – Green Lite first-generation prototype ......................................................................... 3 Figure 1.2 – Green Lite concept drawing of the second-generation vehicle .................................. 4
Figure 1.3 – CAD drawing of left swing arm with sprag clutch..................................................... 6 Figure 1.4 – Picture of left swing arm with idler gears .................................................................. 7 Figure 1.5 – Exploded view of right swing arm ............................................................................. 8 Figure 1.6 – Picture of original and new right swing arm .............................................................. 9 Figure 1.7 – Solid model of electric drive, sectioned ................................................................... 10
Figure 1.8 – Curtis 1238 controller ............................................................................................... 11 Figure 1.9 – AC 15 electric motor ................................................................................................ 11
Figure 1.10 – One side of the Green Lite Motors battery bank (in the middle of a rebuild cycle)
............................................................................................................................................... 12 Figure 1.11 – 10AH Headway Cell............................................................................................... 12 Figure 1.12 – Manzanita Micro SOC Head .................................................................................. 13
Figure 1.13 – Green Lite Motors next-generation electric system block diagram ....................... 13 Figure 1.14 – Quick Charge battery charger ................................................................................. 14 Figure 1.15 – The digital control system, peripheral definition, and wiring connections ............ 16
Figure 1.16 – The dynamometer with the Green Lite vehicle in the OIT dynamometer test room
............................................................................................................................................... 17
Figure 1.17 – Fuel-flow sensor used in the testing setup .............................................................. 19 Figure 1.18 – AcuAMP DCT200 Hall Effect current transducer used for power consumption data
acquisition ............................................................................................................................. 20
Figure 1.19 – NI USB 6009 PC DAQ Module ............................................................................. 21
Figure 3.1 – x axis: mph, y axis: mpg ......................................................................................... 255 Figure 3.2 – Electric drive system range (x – speed in mph vs. y – range in miles) .................. 266 Figure 3.3 – Electric drive amp consumption (x – speed in mph vs. y instantaneous amps) ..... 277
Figure 3.4 – Electric drive amp consumption (x – speed in mph vs. y instantaneous amps) ..... 277 Figure 3.5 – The manufacturing defect discovered upon disassembly of one of the battery banks
............................................................................................................................................. 288

1
EXECUTIVE SUMMARY
Green Lite Motors has developed a small, three-wheeled, gas-electric hybrid vehicle based on a
platform of a Suzuki Bergman scooter. The target market for this vehicle is urban commute
zones where large numbers of individuals migrate from suburban homes to city-based
professions. Under normal commute circumstances, traffic and parking congestion contribute to
loss of worker productivity, increase in air pollutants and unnecessary waste of gasoline. The
introduction of the Green Lite Motors vehicle into this market could have a large impact due to
the vehicle’s high mileage and small footprint. The manufacturing plan is to modify an existing
scooter platform to create an enhanced platform with better mileage and more commuter appeal.
The use of existing technology decreases engineering overhead while leveraging the design
expertise of a large vehicle engineering team.
The first prototype was developed based on a Suzuki Bergman 450 as the platform vehicle. This
vehicle proved the engineering concept and pushed the creation of a second vehicle. The second
prototype was based on a larger platform, the Suzuki Bergman 650. This work was done under
an Oregon BEST Commercialization Grant (Long, Currin & Wang, 2012). The hybridization of
the 650 required a completely new engineering solution, thus newer battery technology was
adapted as well a complete re-engineering of the hybrid drive system.
The project outcome detailed in this report encompasses the testing and troubleshooting of this
second prototype. To perform the tests, a small dynamometer was funded and purchased through
the grant. The dynamometer was used to provide laboratory-based road loads for the vehicle
while also gathering some basic information on the performance of the internal combustion (IC)
engine. A fuel-flow meter was also adapted to the IC drive system to get an independent measure
of fuel consumption. The electric system was instrumented as an independent drive system for
measurement of coulomb consumption in an attempt to measure miles per watt/hour.
Problems with the LiFePO4 battery system plagued the operation of the electric drive system,
eventually bringing an early end to the vehicle testing. This was due to an expenditure of funds
in the repairing of the LiFePO4 battery banks. In light of the battery issues, the vehicle’s
mechanical and electrical systems were tested and several issues were identified and corrected.
The report contains information related to:
1. Vehicle configuration
2. Test platforms and configuration
3. Educational objectives
4. Testing results
5. Final analysis

2

3
1.0 PROJECT DESCRIPTION
1.1 VEHICLE DESIGN
Green Lite's commercialization collaboration with the Oregon Institute of Technology (OIT),
funded through Oregon BEST (Long, Currin & Wang, 2012) developed its next proof-of-concept
vehicle. The first-generation vehicle was based on a smaller Suzuki Bergman platform, the
Bergman 450 (Figure 1.1).
Figure 1.1 – Green Lite first-generation prototype
The next-generation prototype development goal, in the collaboration with OIT, was hybrid
conversion of a larger capacity Suzuki Burgman 650 platform scooter. Once the scooter was
converted, Green Lite would pursue the three-wheel lean steering and a fairing design. The target
concept vehicle is an enclosed, three-wheel vehicle targeted at the commuter market (Figure 1.2).

4
Figure 1.2 – Green Lite concept drawing of the second-generation vehicle
Green Lite's collaboration with OIT was to develop its next proof-of-concept vehicle. Green
Lite's goals included a larger capacity scooter, specifically a Suzuki Burgman 650. Green Lite
had previously pursued a concept vehicle using a Suzuki 450 scooter. The goal of the
collaboration with OIT was to convert the Burgman 650 to hybrid operation. After scooter
conversion, Green Lite would pursue the three-wheel lean steering and a fairing design.
1.1.1 Previous Prototype Modifications
The first prototype was studied and a series of target features were identified for hybridization of
the Burgman 650.
1. Add a freewheeling mechanism for the internal combustion (IC) drive train.
2. Add an electric motor for a gas/electric hybrid.
3. Adapt an AC motor and a Curtis controller for future use of braking regeneration.
4. Introduce single throttle operation through servo movement and analog signal generation.
5. Introduce rudimentary battery charge management for use in power control.
6. Update the battery pack to utilize LiFePO4 battery chemistry.
7. Add a single board computer control system for hybrid drive function.
The first was not attempted on the previous proof-of-concept vehicle. It was found that if a
freewheeling mechanism wasn't included, the IC engine acts like a compressor during coasting,

5
dissipating energy. This isn't a major problem with a stock scooter; the compression on coasting
only hurts efficiency slightly. However, with a hybrid electric motor, the IC motor's drag is a
larger problem since back driving the IC motor with the electric motor is a major loss of
efficiency.
In the first proof-of-concept vehicle, the electric motor was mounted to the rear swing arm. This
added unsprung weight wasn't optimum. Unsprung weight promotes fatigue failures or added
structural weight. Also, there was no reasonable way to mount an electric motor, of the size
needed, on the Burgman 650's swing arm. Thus a design was needed to move the motor to the
scooter's frame.
The first proof-of-concept vehicle had two throttles, one for the IC engine and one for the
electric motor. This made operation and demonstration difficult. A major goal of the controls
was to incorporate both throttles into a single control.
The electric drive system was also updated to utilize newer, more power-dense LiFePO4 battery
chemistry. This proves to have a better watt-per-pound rating; however, management of the
charge/discharge curve for these batteries can be problematic. The AC system was added as an
enhancement over the first-generation prototype for utilization of regenerative braking in hope of
squeezing more performance out of the electric system. The Curtis controller provides good
functionality for regenerative and AC motor control; however, the level of customization for this
controller made it somewhat difficult to initially configure. The Curtis controller allows for use
of an analog signal for control of the throttle from any variable voltage source.
The previous prototype did not have a unified hybrid drive system. To introduce this, a single
board computer was added to take in the desired performance of the driver (economy or power);
the type of trip the driver was making (city high-frequency start and stop or rural continuous
cruising); the current charge gauge of the battery bank; and the power request from the throttle.
The control algorithm then calculated the percentage of power from both the IC and the electric
motor.
1.1.2 Next-generation Prototype Design
In making the mechanical modifications to the Burgman 650, it was found that the bike is a very
well-designed and integrated scooter. These are good qualities for a scooter but it makes major
modifications very difficult. Mechanical and electrical systems had to be added for full hybrid
vehicle implementation. The space and power efficiency built into the original Burgman 650
made additions a challenging task.
1.1.2.1 Mechanical Systems
Several configurations were considered for adding a freewheeling mechanism. A hard
look was given to converting the centrifugal clutch of manual/electric operation. Also,
consideration was given to putting a sprag clutch (freewheel mechanism) inside the

6
clutch housing. Both seemed difficult and likely to lead to a less reliable system. The
final drive on this bike is a series of idler gears rather than a chain. The idlers made
adding a freewheel more difficult than if a chain were used. However, it was the surest
way to configure the new system.
One idler gear was removed from the series of idlers in the left swing arm. Shafts from
the adjacent gears were extended outside the swing arm case. Connecting these two shafts
with a chain drive gave an equivalent mechanical system. On one shaft, a sprag clutch
(freewheeling mechanism) was included. Thus power could flow from the IC engine to
the rear wheel, but the rear wheel could not drive the IC engine backwards. The idler
gears turned out to be non-standard. Figure 1.3 shows the final configuration.
Figure 1.3 – CAD drawing of left swing arm with sprag clutch
The stock Burgman idler gears needed to be modified rather than obtaining new stock
gears. However, the idler gears are well optimized. They have thin webs from the hub to
the gear teeth and a radially thin hub, as shown in Figure 1.4. This is good for their use as
idlers, but difficult to add a shaft to. The thin hub doesn't leave enough material for a
keyway and also hardened. In addition, the thin hub caused problems with a press or
shrink fit. Its lack of material limits the pressure applied to an interference fit. It was

7
decided to use the heaviest shrink fit that was thought workable. The shaft was cooled in
dry ice and the gear heated to a temperature thought to be below its tempering
temperature. The shrink fit is thought to be adequate for the torques present but with little
margin for error.
Figure 1.4 – Picture of left swing arm with idler gears
In addition to issues with the idler gear/clutch modification, the electric motor was
difficult to integrate. Green Lite wanted to retain the option to implement regeneration.
For this to be effective, energy needs to be transmitted to and from the rear wheel. By far
the most effective transmission element for the electric motor is a flexible transmission
element, a belt or chain. For regeneration, a flexible element will have tension on both
sides and no “slack” side. Thus, use of a spring tensioner was not possible, and the center
distance between sprockets or sheaves needed to remain constant. The only way to
maintain a constant center distance was to place one sprocket/sheave of each stage on the
swing arm pivot axis. This was not feasible on the left, idler side of the swing arm, so
modification to the right swing arm was pursued.
To keep the swing arm width as narrow as feasible, chains were selected for the transition
through the swing arm pivot. To mount two sprockets on the swing arm axis, the swing
arm had to be moved out some 3 inches. Figure 1.5 shows an exploded view of the new
swing arm. A number of plates were used to space the swing arm further outboard, and

8
the outer steel structure made as a weldment. Figure 1.6 shows a picture of the new swing
arm along with the original.
Figure 1.5 – Exploded view of right swing arm

9
Figure 1.6 – Picture of original and new right swing arm
The initial concept used a three-stage electric drive. A chain transmitted power from the
rear wheel sprocket to a sprocket at the swing arm axis. Another stage ran from a second
sprocket on the swing arm axis to an intermediate shaft under the seat. A timing belt
stage connected this intermediate shaft to the electric motor. The removal of a storage bin
and gas tank from under the seat in the original scooter configuration made room for the
electric motor and a smaller gas tank. Figure 1.7 shows the final configuration of the
electric drive; however, the upper chain idler was removed, allowing a straight run to the
pivot sheave. The three-stage drive was replaced with a two-stage chain setup. This
simplified the system considerably, though the chains are running above recommended
speed. It was thought this would function well but lead to shortened chain life.

10
Figure 1.7 – Solid model of electric drive, sectioned
1.1.2.2 Electrical System
The electrical system encompasses a high-voltage system running at 72 volts and a low-
voltage system running at a standard 12 volts. The low-voltage system provides for
service-level electronics required of the stock vehicle systems as well as the augmented
power requirements of the hybrid operation control system. The high-voltage system
drives the electric motor and must be monitored for charge level so battery status can be
used as an input variable into the control algorithm.
The high-voltage drive system consists of a Curtis 1230 AC controller (Figure 1.8),

11
Figure 1.8 – Curtis 1238 controller
an AC 15 three-phase electric motor run at 72 volts with a peak amp draw of 500 amps,
producing a peak of 40 horsepower (Figure 1.9),
Figure 1.9 – AC 15 electric motor
and a battery bank (Figure 1.10) of LiFePO4 Headway 3.2v 10AH 38120S cells (Figure
1.11).

12
Figure 1.10 – One side of the Green Lite Motors battery bank (in the middle of a rebuild cycle)
Figure 1.11 – 10AH Headway Cell
The batteries were split up into two series cases where each case contained eight cells in
parallel, with 11 of the parallel strings in a series. This configuration makes a battery
bank of 80AH, 70V nominal, 80V fully charged. To monitor the batteries’ state of
charge, a Manzanita Micro SOC Head (Figure 1.12) unit was deployed to monitor the
current across a 750-amp shunt.

13
Figure 1.12 – Manzanita Micro SOC Head
The SOC Head Unit acts as a “charge gauge,” keeping track of the percentage full for the
battery pack. A block diagram showing the electric system and wiring is shown in Figure
1.13.
Figure 1.13 – Green Lite Motors next-generation electric system block diagram

14
For maintenance charging of the batteries during the test cycles, a charger from Quick
Charge Corporation was purchased. The charger was custom modified for the LiFePO4
battery configuration used in the vehicle. The charger is shown in Figure 1.14.
Figure 1.14 – Quick Charge battery charger
The single battery charger was chosen based on advice from our domain expert in the
area of electric-vehicle power systems. Since the battery banks were new, it was not
expected the individual cells would fall out of balance enough such that charging the
bank as a single unit would cause damage to any individual cell. The other option would
have been to purchase a battery-management system (BMS). At the time of equipment
acquisition for the project, BMS charging systems were prohibitively expensive and
could not be supported by the project budget. This decision proved to have detrimental
effects on the overall system testing, as will be discussed in the testing results.
1.1.2.3 Digital System
The digital system contains circuits for acquiring analog control input as sensing systems
and control output systems. The control computer itself is based on a Mips PIC32
microprocessor. The control system input was made simple. Four input parameters are
required:

15
1. Throttle potentiometer input, an analog signal from 0-5 volts capturing the
driver’s request for drive system power.
2. Digital user interface (UI) input for the trip type. This is a 16-bit value
representing 0-100, where the trip type represents intended vehicle behavior; 0
represents a trip in a rural setting where the vehicle will be cruising with very few
starts and stops.
3. Digital UI input for the driving mode. This is a 16-bit value representing 0-100; 0
represents high economy, favoring fuel efficiency over driving speed and
acceleration, and 100 represents sport mode where fast acceleration is favored
over fuel and battery efficiency.
4. Digital UI input for the drive engagement. This represents electric-only, IC-only
and hybrid operation.
5. ASCII input from the SOC Head Unit. This is a value between 0-100%
representing the current charge capacity of the battery bank.
The control algorithm uses a fuzzy logic calculation (Xin Wang, 2012) based on the
throttle input, trip type, diving mode and percentage battery bank charge. The output
produced is:
1. Zero- to 5-volt throttle signal to the Curtis controller for power request to the AC
15 electric motor.
2. Servo control to IC engine throttle servo for power request to the IC engine.
A block diagram of the digital system is shown in Figure 1.15.

16
Figure 1.15 – The digital control system, peripheral definition, and wiring connections
1.2 TEST PLATFORM
The main objective for the grant is to test the Green Lite vehicle next-generation prototype for
mechanical, electrical and hybrid operation. First and foremost is the testing and verification of
the operation of each mechanical fabrication as a subsystem, then a fully functional system. The
systems under consideration are the IC drive mechanism, the electric motor drive system, and the
hybrid link to allow both IC and electric to run in parallel for full hybrid vehicle operation. To
perform system-independent tests, a small dynamometer was deployed and the vehicle systems
instrumented for data acquisition independent of the developed hybrid drive systems.
1.2.1 Dynamometer
The dynamometer acquired for the testing is a Motorcycle/ATV Dynamometer.
Land and Sea DYNOmite Dynamometer: 850 UTV/Formula SAE EC Dyno (Figure 1.16)

17
Figure 1.16 – The dynamometer with the Green Lite vehicle in the OIT dynamometer test room
The dynamometer was set up in the following configuration for all tests:
Engine settings:
11.2 compression ratio
2 cylinder
75.5 mm bore
71.3 mm stroke = displacement of 638.44cc
Inertia settings:
RPM-A = 0.0615 ft-lb-sec2
RPM-B = 8.824 ft-lb-sec2
RPM-C = 0.192 ft-lb-sec2
RPM-b/a ratio = 1.000
RPM-c/b ratio = 2.029
Calculate torque with: #1 compensation on
Vehicle settings:
Bike weight for simulation = 800 lbs. (assumed factory dry weight of 524 lbs
minus 24 lbs of plastic, 150 lbs. of equipment and 150 lbs. of rider)

18
Coast down G’s set for 0.07 at 55 mph.
Tire diameter of 21.56.
Speedometer source of #0 shaft rpm
Acceleration source #0 speedometer
Pitch compensation 0%
Dynamometer specific settings:
Vehicle speed factor 21
Drive ratio = 2.029
Roll diameter 16 inches
RPM source= #3
RPM-A, RPM-C, torque source #0 DYNOmiteTM board
Tests were run with an automatic simulated grade test, which uses the eddy current absorber
when set in automatic mode. Simulation settings were:
max hill grade 0%
min time between hills = 400 seconds
# of hills per lap = 5
# of laps this test = 4
Recording rate was not used, and both the randomized hill grade and randomized time between
hills were turned off so it would be over the 10-minute run times for tests. It was also set to offer
the most resistance during starting acceleration and just a little bit at a given speed (what they
have figured for drag while riding at a given speed).
The DYNO-MAX has a Road Load Simulation mode where vehicle speed is controlled based on
the cumulative power applied during the test calculated against the vehicle drag and weight
information input. In this mode there is an exponentially increasing load applied to the vehicle as
it accelerates. Conversely, a coasting effect will be applied during deceleration. This is a
convenient mode for engine management system mapping or diagnostic testing. The coast down
G’s values typical bike (touring) 800 pounds = 0.070.
The RPM source was taken from the bike’s number one signal (positive coil) wire through the
Hall Effect sensor for the dyne. This gives bike rpm. The speed of the roller is detected with
another Hall Effect sensor to get exact mph readings of the bike. The bike on-board speedometer
was incorrect because of the modifications to the gear train.
1.2.2 Vehicle Instrumentation
Parameters of interest from the vehicle were fuel flow for integration of fuel consumption during
a test run, charge flow for integration of electric energy consumption during a test run, vehicle
speed, distance traveled, and time.

19
1.2.2.1 Fuel Consumption
The fuel-flow sensor used is a Futurlec 2.0 to 30.0 L/hr Diesel and Gasoline Flow Sensor.
This flow meter was mounted directly in line with the gasoline feed to get an independent
measure of fuel consumption. Specifications of this device are:
Flow rate 2.0 - 30.0 liter/hr
Digital output
Fitting for 3/8" barb
Suitable for both diesel and gasoline
Open collector output
Fluid temperature: 0 to 60oC
Fluid pressure: up to 85 psi
Supply voltage: 2.4 - 26V
The sensor is shown in Figure 1.17.
Figure 1.17 – Fuel-flow sensor used in the testing setup
The sensor was connected to a National Instruments data acquisition harness (described
below) for counting of sensor pulses during a run.
Table 1.1 shows the calibration setting for the sensor.
Table 1.1: Futurlec flow meter pulse calibration
Flow Rate(LPH) Liters per Pulse
2.0 0.00038
4.0 0.00050
12.0 0.00050
30.0 0.00050
For each run, the pulses were counted and used to sum the final fuel consumption.

20
1.2.2.2 Electrical Power Consumption
To measure electrical power consumption, an AcuAMP DCT200-10B-24-S
Hall Effect current transducer was placed around the positive power cable leading out of
the battery bank. Specifications for this device are:
0-200A input
24V DC powered
bi-polar +/- 0-10 VDC output
An image of the transducer is shown in Figure 1.18.
Figure 1.18 – AcuAMP DCT200 Hall Effect current transducer used for power consumption data acquisition
The -10 volt to 10 volt signal was sampled and integrated over time to accumulate the
amp-hours consumed during any specific run.
1.2.3 Data Acquisition
To capture the data, a National Instruments USB 6009 PC DAQ Module was used to pick up the
analog signal from the current transducer and the pulse from the fuel-flow meter. The National
Instruments module is shown in Figure 1.19.

21
Figure 1.19 – NI USB 6009 PC DAQ Module
Vehicle runs were done at a steady state speed to avoid issues related to correlating vehicle speed
over time to the data produced by the current transducer and flow meters.
Data acquisition was done with a standard desktop PC running LabView software. A program
was developed for acquiring the data and performing initial data reduction tasks.
1.3 EDUCATIONAL OBJECTIVES
In addition to performing the testing of the Green Lite vehicle, in line with OIT’s mission, the
project was used to educate undergraduate students in vehicle technology, hybrid vehicle design
and deployment, as well as vehicle software systems implementation and deployment. As a
necessary part of any research project taken on at OIT, undergraduate involvement is integrated
into the project in the form of student projects (Long, 2012), student assistants, and individual
work as laboratory assignments or case studies. Objectives for this project were to engage
students in:
Vehicle test planning and test execution
Creation of a data telemetry system for test drive data acquisition
Creation of a remote vehicle access and control system
Assistance in mechanical system testing involving dynamometer use
Work on control algorithm and user interface implementation

22

23
2.0 TESTING METHODOLOGY
2.1 OVERVIEW
Testing was primarily performed in the dynamometer laboratory with a few simple and
abbreviated parking lot tests. No extended road tests were performed due to equipment failure in
the early phases of electric drive system testing. The testing was done in three phases. First the
internal combustion (IC) engine drive system was tested without the use of the electric drive
system. Second, the electric drive system was tested with the IC engine idling. Third, the two
systems were engaged to test hybrid operation.
2.2 INTERNAL COMBUSTION DRIVE TESTING
The IC drive system was tested at steady state speeds to capture mileage performance through 10
mph increments up through 70 mph. Steady state testing was done with the electric motor chain
drive connected but not energized. It was acting only as a flywheel. Testing was done by
bringing the bike up to testing speed, initiating a data acquisition run and holding the speed
constant for five minutes. Dynamometer readings of RPM and horsepower (for the second set of
tests) at the rear wheel were recorded. The miles-per-gallon indicator on the Burgman control
panel was used to get a reading at the end of each run. The gage was reset at the beginning of a
run and read at the end of the run. The flow meter was also used to capture fuel consumed for
each run through the LabView data acquisition program.
2.3 ELECTRIC DRIVE TESTING
The electric drive system was also tested at steady state speeds to capture miles-per-watt-hour
performance through 10 mph increments up through 50 mph. Steady state testing was done with
the IC engine in idle, a requirement imposed through the use of the dynamometer and its
dependence on operation of the IC engine. As with the IC engine testing, this was done by
bringing the bike up to testing speed, initiating a data acquisition run and holding the speed
constant for five minutes. The LabView system was used to capture the amps used during the
test runs.
2.4 HYBRID DRIVE TESTING
Hybrid mode testing was also done at steady state speeds where the percentage of electric power
being utilized was also held at a steady state. The goal was to test different levels of electric
power use in conjunction with the IC engine to gain a mileage curve based on different energy
levels of support of the electric motor. In these tests, the vehicle was brought up to speed using
the IC engine, then the electric throttle was adjusted while backing off of the gasoline throttle
until the electric motor was held steady at the required amp rating while holding the steady miles
per hour. Each run was done for five minutes. The LabView system was used to capture the
amps and fuel consumption during each test run.

24
3.0 TESTING RESULTS
3.1 OVERVIEW
All testing was performed in OIT’s dynamometer lab. The IC drive system was completed with
some issues being discovered in the construction of the drive chain in the power transfer system
to the bike’s rear wheel. The electric system testing was completed up through the 50-mph mark,
with catastrophic failure occurring in the battery system halfway through the 50-mph, five-
minute interval. After an overhaul of the battery bank and replacement of the damaged cells, the
hybrid tests were started. Once again, due to an insufficient battery-management procedure, the
battery bank had a second, test-induced failure, which was, in fact, the third battery bank failure.
At this point, the test project was out of funds and it was clear the system would not be stable
without the purchase and integration of a battery-management system for concise control of the
battery bank state of charge. The testing was terminated at this point.
3.2 INTERNAL COMBUSTION RESULTS
During the first sequence of tests, the first-stage electric motor drive chain was very tight. During
the 70 mph run the chain and bearing at the swing arm became so hot the test was aborted. The
chain was found to have overheated enough to discolor it and freeze some links. To alleviate this
problem, a better-quality motorcycle chain was installed rather than an industrial chain.
The second sequence of runs was done with a looser chain tension. Even with these changes the
chain tended to overheat. The drive chains were running beyond their recommended speed,
which was probably the cause of the chain overheating. During design it was thought the chains
would have a shortened life but otherwise function adequately. However, the increased speed
causes overheating problems. Running the cycle for extended periods at speed is likely not
possible. Testing is feasible for the short-duration tests required in this investigation. A redesign
is needed for longer-term testing. In light of the current system limitations, design of a three-
stage system with a high-speed timing belt stage would be a feasible solution.
During the second sequence of runs, the testing was suspended between speeds to allow the
chain to cool. The chains indeed become hotter at higher speeds, validating suspicion of the
chain-over-speed problem. This was enough of a problem that the 70 mph test was shortened
from five minutes to two.
Tables 3.1 and 3.2 show the testing results of both sequences. Figure 3.1 shows the data in
graphical form.

25
Table 3.1: Gasoline drive system testing results – Test 1
MPH Flow Meter Count MPG % error
10 803 10.3 3.3
20 727 22.8 3.3
30 810 30.7 1.6
40 1138 29.2 8.2
50 1220 34.0 2.4
60 1398 35.8 4.8
70 n/a n/a n/a
Table 3.2: Gasoline drive system testing results – Test 2
MPH Flow Meter Count MPG % error
10 829 10.0 3.3
20 823 22.1 3.3
30 1240 30.3 1.6
40 1191 26.8 8.2
50 1329 34.8 2.4
60 1398 37.5 4.8
70 758* 30.7 n/a
* Two-minute run. All other runs are five minutes.
Figure 3.1 – x axis: mph, y axis: mpg
3.3 ELECTRIC DRIVE RESULTS
The electric drive testing went well for measuring of steady state 10, 20, 30 and 40 mph. On the
run for 50 mph, the battery bank crashed, damaging 12 of the cells. Results of these tests are
shown in Table 3.3 and a plot of y – Miles vs. x – Speed in mph is shown in Figure 3.2. Figure
0
5
10
15
20
25
30
35
40
0 20 40 60 80
MPG1
MPG 2

26
3.3 shows the energy consumption trend for the vehicle as the steady state speed increases, and
Figure 3.4 shows the rate of electric energy consumption of speed vs. kWh/100 mo. The range is
based on exhausting the 80Ah battery bank to 25% of full charge.
Table 3.3: Electric drive system testing results
MPH Elapsed Time (s) Ave Amps Total Ah Vehicle Range (Miles) kWh/100mi
10 300 23 1.9 26 16.56
20 300 40 3.4 30 14.4
30 300 59 4.9 30 14.16
40 300 99 8.2 24 17.82
50 123 175 6.0 17 25.2
Figure 3.2 – Electric drive system range (x – speed in mph vs. y – range in miles)
0
5
10
15
20
25
30
35
0 20 40 60
Vehicle Range (Miles)
Vehicle Range (Miles)

27
Figure 3.3 – Electric drive amp consumption (x – speed in mph vs. y instantaneous amps)
Figure 3.4 – Electric drive amp consumption (x – speed in mph vs. y instantaneous amps)
In spite of the entire bank being fully charged prior to the runs and the runs themselves totaling
25 amp hours, the battery discharge caused catastrophic battery failure. By calculating for the
individual runs, the battery bank should have been drained to 68%. Despite this monitoring,
several of the series strings of cells had been drawn down to the point of damage. Upon
disassembly of the battery bank, a washer was recovered from one of the strings. The placement
of the washer was such that it appeared to short out one of the cells in the string. This
0
20
40
60
80
100
120
140
160
180
200
0 10 20 30 40 50 60
Ave Amps
Ave Amps
0
5
10
15
20
25
30
0 10 20 30 40 50 60
kWh/100mi
kWh/100mi
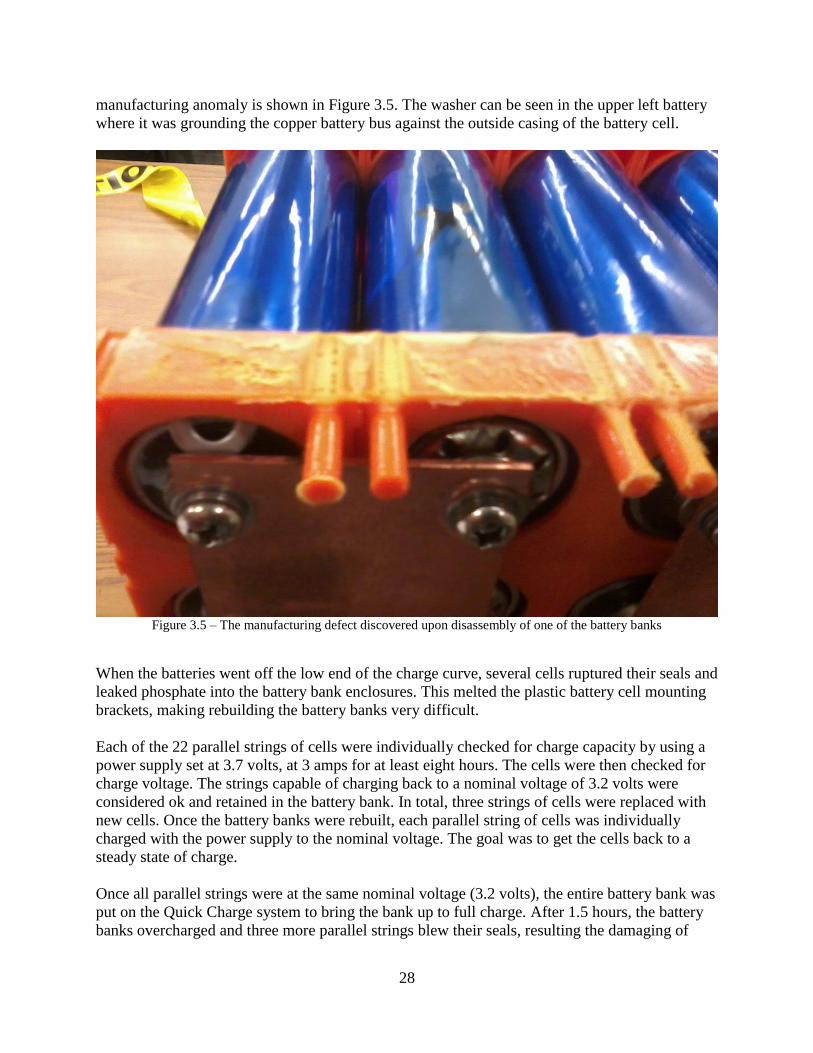
28
manufacturing anomaly is shown in Figure 3.5. The washer can be seen in the upper left battery
where it was grounding the copper battery bus against the outside casing of the battery cell.
Figure 3.5 – The manufacturing defect discovered upon disassembly of one of the battery banks
When the batteries went off the low end of the charge curve, several cells ruptured their seals and
leaked phosphate into the battery bank enclosures. This melted the plastic battery cell mounting
brackets, making rebuilding the battery banks very difficult.
Each of the 22 parallel strings of cells were individually checked for charge capacity by using a
power supply set at 3.7 volts, at 3 amps for at least eight hours. The cells were then checked for
charge voltage. The strings capable of charging back to a nominal voltage of 3.2 volts were
considered ok and retained in the battery bank. In total, three strings of cells were replaced with
new cells. Once the battery banks were rebuilt, each parallel string of cells was individually
charged with the power supply to the nominal voltage. The goal was to get the cells back to a
steady state of charge.
Once all parallel strings were at the same nominal voltage (3.2 volts), the entire battery bank was
put on the Quick Charge system to bring the bank up to full charge. After 1.5 hours, the battery
banks overcharged and three more parallel strings blew their seals, resulting the damaging of

29
another three strings of batteries. The battery banks were once again tested for permanent dead
cells, new cells were purchased, and the battery banks were rebuilt.
At this point, it was determined the battery bank cell groups were too out of balance to use the
Quick Charge system, so the entire battery bank was charged using the slow method of
individually charging parallel strings. The main issue with this method is there was no way to
know the state of charge when beginning the power supply charge cycle, resulting in uncertainty
about the charge state of the overall battery bank. We decided to move forward and attempt to
obtain test results from the vehicle running in hybrid mode.
3.4 HYBRID DRIVE RESULTS
With the batteries seemingly fully charged, the hybrid drive operational tests were undertaken.
The goal was to measure steady state mileage for 20 mph, 20 amp draw, 30 mph, 20 amp draw,
up through 70 mph, 200 amp draw. This was to be repeated for 30 amp, 40 amp, 50 amp, 60
amp, and 70 amp, at each level of mph draw. Each test was to be done at the steady state for each
different pair of mph-amp parameters. To keep close tabs on the batteries’ actual draw down, the
SOC Head Unit was used to double check the Hall Effect current transducer results. The system
was to only be drawn down a maximum of 50%, leaving a good margin for the undermined state
of battery charge. The test was performed successfully for 20 mph with a 20 amp draw and 30
mph with a 20 amp draw. During the 40 mph-20 amp draw test, the battery bank once again
crashed. Postmortem analysis of the battery bank confirmed destruction of another four parallel
strings of eight batteries. At this point, the project budget was depleted and testing had to be
terminated. Table 3.4 shows results of the hybrid test.
Table 3.4: Hybrid drive system testing results – 20 amps
MPH Electric Range (miles) MPG
20 59 25
30 87 21
40 118 1
The boost in miles range for the battery system in hybrid mode vs. electric-only mode is good;
however, the mpg as compared to the IC-engine only tests shows anomalies. The test needs to be
run again to verify the mpg results.

30
4.0 ANALYSIS
4.1 OVERVIEW
The complete test cycle was not possible because of issues encountered in the battery system;
however, the testing performed was extensive enough to validate the operation and integrity of
the different drive systems and their integration. During the course of testing, several small
issues in system construction were uncovered and corrected. This included small items such as
chain-to-frame interference, wire routing, chassis grounding, and high-speed mechanical system
interference. From this course of testing, some key modifications were discovered that need to be
implemented for the vehicle to be fully road tested.
Although initial testing of the gasoline drive system shows results lower than the stock Burgman
mileage, early results from the electric range of the hybrid drive operation show a dramatic
increase over electric-only drive range. Better instrumentation for the fuel-flow meter is required
to get a fully accurate measure of the fuel mileage. The consistent poor mileage readings
combined with results from the final run bring the low-cost Futurlec fuel-flow meter output into
question.
4.2 INTERNAL COMBUSTION
Internal combustion (IC) drive system testing shows initial mileage lower than the factory
reported mileage of 45 mpg (Cope, 2013) for the Burgman 650. The highest mileage reported in
the test runs of the Green Lite prototype vehicle is that of the 60 mph run, registering at 37.5
mpg. It is not surprising that the IC system has a lower mileage because of the extra mechanics
involved in the overall drive system. The fuel-flow meter used for independent verification of
fuel consumption is also suspect as a potential problem in the test sequences. Although it had
mostly consistent data, on occasion it would report results abnormally high, causing some test
runs to be rejected as outliers. The overheating of the drive chain also hints at an area of design
inefficiency and possible drain on mileage.
Although the mpg of the tests was low compared to a stock vehicle, they were not out of
expected range given the modifications made to the drive system. Expectation is the IC engine
drive combined with the electric drive for full hybrid operation will increase mileage
considerably.
4.3 ELECTRIC DRIVE
Electric motor drive system testing shows more promising results. The highest level of efficiency
is reported at roughly 25 mph with an energy consumption of 14.2 kWh/100mi. The energy
consumption for the 50-mph run is 25.5 kWh/100mi. These results are quite good for a two-
passenger vehicle. For a comparison to a current high vehicle, designed to be only electric, the
2013 Smart Car electric vehicle gets a combined city/highway energy consumption of 32
kWh/100mi (Energy, 2013). The Green Lite prototype configuration has roughly 50% higher
kWh mileage at 40 mph if the Smart Car mileage is assumed to be captured at an average speed
of 40 mph in mileage tests.

31
4.4 HYBRID DRIVE
Although the hybrid-mode tests were inconclusive due to battery bank failure and fuel-flow
meter anomalies, results did show the combined use of the IC engine and electric motor
enhanced the range of the vehicle dramatically. In the electric-only test, at 20 amps, the range of
the vehicle came out to 26 miles at a speed of 10 mph. In hybrid mode, the IC-engine assist
increased the range from 30 miles to 87 miles. As an electric-motor assist, the combination is
quite effective in increasing vehicle range.
From a fuel-consumption perspective, the results are dismal but the meter for measuring fuel
flow is suspect in the results it produced. To get a good measure of overall fuel efficiency, the
hybrid tests need to be completed with a higher-grade, fuel-flow meter in the fuel line. The tests
for hybrid-mode fuel consumption are inconclusive.
4.5 EDUCATIONAL OUTCOME
The project proved to be a very beneficial educational opportunity for OIT. Project issues and
technical challenges were used in several case studies in the Renewable Energy Engineering
program, the Embedded Systems Engineering program, and the Software Engineering program.
Students had the opportunity to gain hands-on experience in working directly with the
engineering, specification and prototype construction in all phases of the project. Roughly 30
students were involved over the life of the project. Several side projects were generated from the
Green Lite prototype testing grant cycle:
Testing and Remote Telemetry System – This project involved four software engineering
students in a three-term effort to create a data acquisition and remote data telemetry
system for use on the vehicle during road tests. This was integrated into a junior-level
design and construction course.
Remote Vehicle Control – This project involved four software engineering students in a
three-term effort to build a wireless, iPad application that would allow the vehicle to be
remotely controlled and status monitored over a wireless network connection. This
project was integrated into a junior-level design and construction course.
Vehicle to Grid System Design – This was a problem presented to a senior-level
renewable energy design course. The project involved producing a hardware design to
allow the battery bank from a vehicle to be used as peak-use storage for a utility
company. Ten students looked at the vehicle and grid-based charger side of the system to
produce a proposed hardware design for both the grid-based charge and the vehicle-based
charging. A monetary incentive program was also proposed to give vehicle owners
incentive to use their vehicles as temporary grid-based storage.
In addition to the coursework project integration, several students were employed under the grant
contract throughout the course of the grant. This involved management and running of the
dynamometer tests, implementation of the embedded control system and control algorithm,
implementation of the embedded controller user interface, and work on data acquisition and
sensor circuits.

32
5.0 CONCLUSION
The Green Lite prototype project was not able to prove the ultimate efficiency of the Green Lite
next-generation hybrid vehicle prototype. Problems with the battery system and management of
the LiFePO4 battery bank caused unexpected time, effort and expense to creep into the project
scope. Ultimately, battery failure and depletion of the project budget brought the testing to a
premature end.
The prototype design shows promise as an electric vehicle. As compared to current two-person
electric vehicles, the kWh/100 mi performance is better than popular systems. The main issue of
the Green Lite vehicle as an electric vehicle is driving range. With the IC engine brought in as a
parallel hybrid drive the electric system’s range is extended, making the Green Lite platform a
good commute vehicle favoring mainly the electric system as the primary source of power.
Performance of the IC engine drive is undetermined, and further testing of the IC engine needs to
be done to characterize full hybrid operation.
The following recommendations result in the initial testing of the Green Lite second-generation
prototype:
1. Drive train modification – The current system has drive chains for transfer of energy
from the electric motor to the rear wheel. These chains overheated during the higher
speed tests, forcing a limited time the vehicle could be run. A five-minute run produced
intolerable chain heat. This portion of the drive system needs to be redesigned with a
high-speed timing belt. It is believed that a belt-based solution would not have the heat
issues present in the normal application of a drive chain.
2. Integration of a full battery-management system – The lack of a battery-management
system in conjunction with the volatile LeFePO4 battery chemistry proved to be the
Achilles’ heel of the project. Although the battery cells are well balanced when new, a
simple error in manufacture or charging can cause the cell state of charge to be different.
This causes issues when attempting to charge an entire battery bank as a single unit. An
integrated battery-management system would alleviate issues of cell charge by managing
smaller units of the overall battery bank.
3. Replacing the fuel-flow meter with a higher-quality unit – The flow meter used in testing
mpg of the vehicle test runs had erratic behavior. This unit was an order of magnitude
cheaper than the next level of meter. Reliable mileage numbers in the test phases of
vehicle development will depend on a good device for data acquisition.
4. Further testing of the hybrid drive behavior – Due to equipment failure, the testing of the
hybrid drive performance is inconclusive. To fully characterize the hybrid drive function,
the entire suite of hybrid drive tests should be performed.
5. Adaptation of a later model vehicle – Due to the highly engineered nature of vehicles
such as the Suzuki Bergman, modification to the vehicle and drive structure is extremely
difficult. In the Bergman scooter product line, each new generation had an entirely new
drive structure. For the hybrid modification to be applied to subsequent model years, each
new year would require an engineering effort starting from reverse engineering of the
new drive system. As the design of these vehicles become more fuel efficient, the

33
modification of any given platform becomes increasingly difficult. Commercialization of
a retrofit effort such as this needs a good supply of original vehicles to avoid continuous
re-engineering of the hybridization solution.

34
6.0 REFERENCES
Cope, B. (2013, April 28). 2013 Suzuki Burgman 650 Executive ABS review. Retrieved June 5,
2013, from Road Tests: http://www.visordown.com/road-tests-first-rides/2013-suzuki-
burgman-650-executive-abs-review/22676.html
Energy, U. D. (2013, 6 10). Electriv Vehicles: Compare side by side. Retrieved 7 5, 2013, from
Fuel Economy.gov: http://www.fueleconomy.gov/feg/evsbs.shtml
Long, J. N. (2012). Integrating Electric Vehicles into Software Engineering Project Based
Education. ASEE Annual Conference and Exposition, 2012 ASEE Conference and
Exposition.
Long, J., Currin, H., & Wang, X. (2012). Green Lite Hybrid Drive Commercialization Grant
Final Report. Portland: Oregon BEST.
Xin Wang, Ph. D. (2012). Robust State Dependent Control of Discrete Time Nonlinear Systems
with Random Actuator Failures. American Society of Mechanical Engineers, 2012 ASME
Dynamical Systems and Control Conference.

P.O. Box 751 Portland, OR 97207
OTREC is dedicated to stimulating and conducting collaborative multi-disciplinary research on multi-modal surface transportation issues, educating a diverse array of current practitioners and future leaders in the transportation field, and encouraging implementation of relevant research results.