communitystabilityand selective extinction during the permian...
TRANSCRIPT

droplets are assumed to evaporate in a uniformlyand thoroughly mixed volume. Results from passesthrough the two clouds previously described areshown to illustrate that the trends are quite gen-eral. The data points in both examples showstriking agreement with the inhomogeneous hy-pothesis, confirming for the first time from directmeasurements of the droplet size distribution inlocalized volumes that clouds indeed have sharpedges down to centimeter scales. Apparently, evenwhen the edges, which represent the signatureof transient mixing events, eventually diffuseaway, they do so after sufficient evaporationoccurs that the majority of remaining dropletshave relatively undisturbed diameter.The holographic measurements show that tur-
bulent clouds are inhomogeneous, with sharp tran-sitions between cloud and clear-air propertiespersisting to dissipative scales (1 to 10 mm). Asa result, the droplet size distribution fluctuatesstrongly in number density but with a nearlyunchanging mean droplet diameter, down tothe smallest turbulent scales. This 3D view ofthe cloud structure has several implications,including motivation for including the effectsof microphysical mixing in subgrid-scale repre-sentation of entrainment in cloud models(13, 14, 29). This in turn will influence the modeledoptical and dynamical cloud properties, alongwith their role in weather and climate (see thesupplementary text). For example, the predom-inance of inhomogeneous mixing suggests thatthe optical depth susceptibility St ¼ @lnt=@lnwl
is closest to its maximum possible value of 1.The observations also add further plausibility tothe hypothesis that mixing and the resultingevaporation can lead ultimately to enhanceddroplet growth (18): Inhomogeneous response tomixing leaves droplets of the same diameter asin the undiluted regions of cloud but with con-siderably reduced competition for excess watervapor. Perhaps, however, the qualitative pictureof clouds having sharp edges down to the centi-meter scale is the most vivid impression to betaken from the work.
REFERENCES AND NOTES
1. G. Feingold, I. Koren, H. Wang, H. Xue, W. A. Brewer, Nature466, 849–852 (2010).
2. B. Stevens, S. Bony, Science 340, 1053–1054 (2013).3. P. R. Bannon, J. Atmos. Sci. 59, 1967–1982 (2002).4. E. Bodenschatz, S. P. Malinowski, R. A. Shaw, F. Stratmann,
Science 327, 970–971 (2010).5. M. B. Baker, R. G. Corbin, J. Latham, Q. J. R. Meteorol. Soc.
106, 581–598 (1980).6. M. B. Baker, R. E. Breidenthal, T. W. Choularton, J. Latham,
J. Atmos. Sci. 41, 299–304 (1984).7. J. B. Jensen, P. H. Austin, M. B. Baker, A. M. Blyth, J. Atmos.
Sci. 42, 173–192 (1985).8. I. R. Paluch, D. G. Baumgardner, J. Atmos. Sci. 46, 261–278
(1989).9. F. Burnet, J.-L. Brenguier, J. Atmos. Sci. 64, 1995–2011 (2007).10. K. Lehmann, H. Siebert, R. A. Shaw, J. Atmos. Sci. 66,
3641–3659 (2009).11. C. Lu, Y. Liu, S. Niu, J. Geophys. Res. 116, D20207 (2011).12. C. Lu, Y. Liu, S. Niu, S. Endo, J. Geophys. Res. 119, (2014).13. S. K. Krueger, C.-W. Su, P. A. McMurtry, J. Atmos. Sci. 54,
2697–2712 (1997).14. W. W. Grabowski, J. Atmos. Sci. 64, 3666–3680 (2007).15. Materials and methods are available as supplementary
materials on Science Online.
16. J. P. Fugal, R. A. Shaw, Atmos. Meas. Tech. 2, 259–271(2009).
17. S. M. Spuler, J. Fugal, Appl. Opt. 50, 1405–1412 (2011).18. W. A. Cooper, S. G. Lasher-Trapp, A. M. Blyth, J. Atmos. Sci.
70, 1727–1743 (2013).19. F. Chosson, J.-L. Brenguier, L. Schüller, J. Atmos. Sci. 64,
2670–2682 (2007).20. A. M. Blyth, J. Appl. Meteorol. 32, 626–641 (1993).21. W. W. Grabowski, J. Clim. 19, 4664–4682 (2006).22. C. A. Jeffery, J. Geophys. Res. 112 (D24), D24S21 (2007).23. G. Feingold, W. L. Eberhard, D. E. Veron, M. Previdi,
Geophys. Res. Lett. 30, 1287 (2003).24. D. Baumgardner, B. Baker, K. Weaver, J. Atmos. Ocean.
Technol. 10, 557–565 (1993).25. B. A. Baker, J. Atmos. Sci. 49, 387–404 (1992).26. J.-L. Brenguier, J. Appl. Meteorol. 32, 783–793 (1993).27. A. Davis, A. Marshak, H. Gerber, W. Wiscombe, J. Geophys. Res.
104, 6123–6144 (1999).28. H. E. Gerber, G. M. Frick, J. B. Jensen, J. G. Hudson,
J. Meteorol. Soc. Jpn. 86A, 87–106 (2008).29. C. Lu, S. Niu, Y. Liu, A. M. Vogelmann, Geophys. Res. Lett. 40,
2333–2338 (2013).30. T. Heus, H. J. J. Jonker, J. Atmos. Sci. 65, 1003–1018 (2008).
ACKNOWLEDGMENTS
We thank J. French and the aircraft staff for assistance with theinstrument deployment on the University of Wyoming King Airresearch group. We thank the staff of the National Center forAtmospheric Research (NCAR) Earth Observing Laboratory forassistance with the instrument deployment on the NSF/NCARC130. This project was supported by U.S. National ScienceFoundation grant AGS-1026123, by the U.S. Department of Energyas part of the Atmospheric Radiation Measurement ClimateResearch Facility, and by a NASA Earth and Space ScienceFellowship. NCAR is sponsored by the U.S. National ScienceFoundation. Data are available according to instructions in thesupplementary materials on Science Online.
SUPPLEMENTARY MATERIALS
www.sciencemag.org/content/350/6256/87/suppl/DC1Materials and MethodsSupplementary TextFigs. S1 to S10References (31–69)
11 March 2015; accepted 28 August 201510.1126/science.aab0751
PALEOECOLOGY
Community stability and selectiveextinction during the Permian-Triassicmass extinctionPeter D. Roopnarine1* and Kenneth D. Angielczyk2
The fossil record contains exemplars of extreme biodiversity crises. Here, we examinedthe stability of terrestrial paleocommunities from South Africa during Earth's mostsevere mass extinction, the Permian-Triassic. We show that stability depended criticallyon functional diversity and patterns of guild interaction, regardless of speciesrichness. Paleocommunities exhibited less transient instability—relative to modelcommunities with alternative community organization—and significantly greaterprobabilities of being locally stable during the mass extinction. Functional patternsthat have evolved during an ecosystem's history support significantly more stablecommunities than hypothetical alternatives.
Accelerating rates of extinctionwill have neg-ative impacts on Earth’s ecosystems andhumanwell-being (1), but they have nomod-ern precedents, and ecosystem responses areuncertain (2). The Earth's history, however,
has recorded episodes of extreme biodiversityloss. Here, we use themost severe of those events,the Permian-Triassic mass extinction (PTME), toexamine how the short-term stability of ecologicalcommunities may vary as their functional struc-tures are altered by extinction.Wemodeled paleo-community stability as local stability (3), andtransientdynamics afterperturbation (4). Bothmea-sures describe paleocommunity dynamics whenspecies populations are perturbed. Paleocommu-nity structures were determined by species rich-nesses, species partitioning among functionalgroups or trophic guilds, and the distribution of
interspecific trophic interactions (Fig. 1A). Weexamined the relationships between these param-eters and stability by comparing paleocommunityfood webs to hypothetical alternatives, whereinspecies richness, the number of trophic interac-tions, and average interaction strength were heldconstant as we varied patterns of functionalpartitioning and trophic interaction distribu-tions (Fig. 1, B to F). We thus characterized paleo-community stability before, during, and after themass extinction.We assembled paleocommunity data for the
Middle Permian toMiddle Triassic terrestrial eco-systems of the Beaufort Group in the Karoo Basinof South Africa (5) (Fig. 2). Only four tetrapodgenera of over 50 are known to have crossed thePermian-Triassic boundary (PTB) (6–8), and rich-ness remained low in the Early Triassic (9). Ourpaleocommunities include the PermianPristerogna-thus, Tropidostoma, Cistecephalus, and Dicynodonassemblage zones, and the Triassic Lystrosaurusand Cynognathus assemblage zones (table S1).We used a two-pulsed extinction (10) to recon-struct three communities from the Dicynodon
90 2 OCTOBER 2015 • VOL 350 ISSUE 6256 sciencemag.org SCIENCE
1Institute for Biodiversity Science and Sustainability,California Academy of Sciences, 55 Music Concourse Drive,San Francisco, CA 94118, USA. 2Integrative Research Center,Field Museum of Natural History, Chicago, IL 60605, USA.*Corresponding author. E-mail: [email protected]
RESEARCH | REPORTSon M
arch 1, 2019
http://science.sciencemag.org/
Dow
nloaded from

assemblage zone (DAZ): (i) a Phase 0 (Ph0) com-munity comprising all taxa that occurred withinthe DAZ; (ii) a Phase 1 (Ph1) survivor community
that spanned the lower part of the extinctioninterval; and (iii) a Phase 2 (Ph2) survivor com-munity comprising taxa that became extinct just
before the PTB or survived into the Early Trias-sic. We refer to Ph1 and Ph2 throughout as massextinction intervals, and all other paleocommun-ities, including Ph0, as intervals of backgroundextinction.Species were partitioned among guilds accord-
ing to trophic ecology and body size (11) (Fig. 1A).Amniotes were divided into ten guilds, with herbi-vores feeding on a single producer guild, whilefaunivores preyed on amniote herbivores and fau-nivores up to two size classes larger and smallerthan themselves, with the smallest two faunivoreguilds also preying on arthropods (tables S2 andS3). Temnospondyl guildspreyedon temnospondyland amniote guilds up to two size classes largerand smaller than themselves, as well as fish, in-sects, and aquatic invertebrates. Fish fed on aqua-tic producers, insects, aquatic invertebrates, andtemnospondyls. Insects were divided into herbiv-orous, omnivorous, and predatory guilds (5). Fewnoninsect invertebrates are known from theBeaufort Group, but our data include molluscs,myriapods, and conchostracans. Plant specieswere not treated individually because taxonomicresolution is currently insufficient. We insteadassume that producer species behaved neutrallywith respect to competition and herbivory, and sowe aggregated them into four guilds: aquaticmicrophytes, aquaticmacrophytes, terrestrial pro-duction accessible to insects and amniotes, andterrestrial production available to insects only(arboreal amniotes were absent from the Beau-fort Group).Although paleontological data lack details of
biotic interactions that are available for modernspecies, paleotrophic interactions can be inferredfrom predatory traces, preserved gut contents (12),functional morphological interpretations, bodysize relationships, and habitat (13). These de-fine partitions of paleocommunity species rich-ness (S) into a fixed number of trophic guilds, aswell as a pattern of functional organization orinteractions among guilds. Thus, of all food webtopologies possible given S (14), only a subsetwould be consistent with paleocommunity data(15) (Fig. 1B). We constrained this subset fur-ther by assuming a hyperbolic decay distribution
SCIENCE sciencemag.org 2 OCTOBER 2015 • VOL 350 ISSUE 6256 91
Fig. 1. Guild interactions and alternative models. (A) Beaufort Group food web. Guild richnessesare listed in table S2. (B to F) Food web models: (B) Example paleocommunity web, with four guildsand two species per guild. Blue arrows, guild interactions; black arrows, species interactions. (C to F)Alternative models of community organization.
Fig. 2. BeaufortGroup paleocom-munity composi-tions. (Right) Graybars represent theextinction stages;missing bars indicatethat richness waszero. Total amniotespecies are subdi-vided by body size.(Left) Correlationsbetween BeaufortGroup assemblagezones and the geo-logical time scale. The subdivisions of the Dicynodon assemblage zone, illustrated as of equal length, were of unequal durations (10). Stratigraphic units: Ans,Anisian; Cap, Capitanian; Chx, Changhsingian; Ind, Induan; Ole, Olenekian; Wuc, Wuchiapingian. Assemblage zones: Cist, Cistecephalus; Cyno, Cynognathus;Dicyn, Dicynodon; Lyst, Lystrosaurus assemblage zone; Prist, Pristerognathus; Trop, Tropidostoma.
5 guilds 20 taxa
Trophic Guilds Species Richness
5 taxa
AllVerySmall Small Medium Large
VeryLarge
Amniote Species Richness
Prist
Trop
Cist
Ph0
Ph1
Ph2
Lyst
Cyno
Dic
yn
Tria
ssic
Perm
ian
Cap
Wuc
Chx
IndOleAns
SGCS SA
RESEARCH | REPORTSon M
arch 1, 2019
http://science.sciencemag.org/
Dow
nloaded from

for the number of prey species per consumerspecies (5, 16), with more species being rela-tively specialized, and the distribution’s heavytail representing fewer, relatively generalizedconsumers. Finally, we sampled food webs fromthe constrained subset, describing species in-teractions with generalized Lotka-Volterra (LV)functions, and each food web as a S × S matrixof interspecific interactions. Time-averaging andincomplete preservation limit measurementof the number of biotic interactions and theirstrengths, so we parameterized interaction num-ber with stochastic draws of the number ofprey per consumer from the hyperbolic distri-bution, as well as corresponding interaction co-efficients from uniform distributions (5). Positiveoff-diagonal elements represent predation, andnegative elements represent the impacts of pred-atory species. Diagonal terms describe pop-ulation growth in the absence of interspecificinteractions and are always negative in our mod-els. Each paleocommunity's matrices are thereforeof statistically similar connectance and averageinteraction strength.We formulated a series of alternative food web
models, each one relaxing a constraint on topol-ogy, to understand how changing functionalorganization would have affected paleocom-munity stability during the PTME (Fig. 1, C toF). Each model expands the subset of food websto include webs that are inconsistent with some
aspect of the paleocommunity. For example,the first model retains species richness, as wellas guild structure, but randomizes species as-signments to consumer guilds (Fig. 1C). Subse-quentmodels randomize interactions and speciesassignments to consumer guilds (holding guildnumber constant) (Fig. 1D); or remove guildstructure altogether but retain the interactiondistribution (Fig. 1E); or assign trophic inter-actions randomly, yielding short-tailed Poissondistributions (Fig. 1F) (17).Paleocommunity andmodel stabilities were as-
sessed as the proportion of stochastically gener-ated webs that are locally stable and the transientinstability of each web. Local stability is a math-ematically simplified but tractablemeasure of sta-bility given typical community complexity, with acommunity in equilibrium returning to equilib-rium after a minor perturbation. The simplifica-tion restricts local stability analysis to minorperturbations but is, nonetheless, a useful firstapproximation (3). We measured local stability asthe real (noncomplex) part of the dominant eigen-value of a LVmatrix. Negative eigenvalues indicatethat any perturbationwill decline asymptotically tozero, whereas webs with positive eigenvalues donot return to equilibrium. At least 100 LVmatriceswere generated stochastically for each model andpaleocommunity.No matrices of the background extinction pale-
ocommunities, or their alternative models, were
locally stable. This is consistent with the negativerelationship between the probability of localstability, and species richness, density of inter-specific interactions, and average interactionstrength (17). S ranged from 71 to 140 for thosepaleocommunities. The fractions of locally sta-ble webs do increase for Ph1 and Ph2, to 25%and 84%, respectively, as S declined to 43 and19, respectively. The increase is not a function ofdeclining richness but, instead, of functionalorganization, because, whereas holding S andfunctional organization constant but partition-ing species randomly (Fig. 1C) yielded frequenciesof 56% and 88% in Ph1 and Ph2, respectively,frequencies were significantly lower when func-tional organization was also randomized (Fig.1D); 2% and 24%, respectively [Ph1: c2(df = 2,n = 400) = 74.78, P < 0.0001; Ph2: c2(df = 2, n =400) = 134.86, P < 0.0001]. Removing guildcompartmentalization (Fig. 1E) also reducesthe frequencies significantly, to 0% and 41% forPh1 and Ph2, respectively [c2(df = 1, n = 300) =30, P < 0.0001; c2(df = 1, n = 300) = 58.33,P < 0.0001, respectively]. Poisson-distributedmodels (Fig. 1F) yielded no locally stable webs.Real patterns of functional organization there-fore promoted significantly greater probabili-ties of yielding locally stable food webs duringthe PTME, regardless of how species werepartitioned.Multispeciesmodels generally amplify perturba-
tions and return to equilibriumnonmonotonically.Such transient short-lived instability is common inreal communities (18) and contributes to dynamicswhen perturbations are frequent, as would beexpected during the PTME. We therefore mea-sured three transient responses to perturbation:reactivity, maximum amplification, and the timingof maximum amplification (4, 5). Reactivity is theinstantaneous rate of displacement in response toperturbation. The dynamics of the displacementyield the maximum amplification during the re-turn to equilibrium. We measured locally stablematrices only, using a Monte Carlo optimizationapproach to ensure local stability (5) even if astochastically generated matrix was not initiallystable.Paleocommunitieswere significantlymore reac-
tive than alternative models (e.g., Ph0, F4,497 =1119.07, P < 0.0001) (table S4), and reactivitydecreases from the most structured model tothe least (Fig. 1, C to F). Almost all backgroundextinction paleocommunities amplify pertur-bations to a significantly lesser degree, and ear-lier in time, than do models with alternativeguild structure or hyperbolically distributed in-teractions, although Poisson-distributedwebs areleast amplified (e.g., Ph0, Kruskal-Wallis H =97.734, df = 4, P = 0.0001) (Fig. 3, A and B). Spe-cies responses to perturbation would thus besignificantly dampened in paleocommunitiesrelative to alternatively structured communities.The mass extinction Ph1 paleocommunity is nomore amplified than alternative models (H =136.385, df = 4, P = 0.0001) (Fig. 3, C and D),except the Poissonmodel, which remains themoststable. During Ph2, paleocommunity perturbations
92 2 OCTOBER 2015 • VOL 350 ISSUE 6256 sciencemag.org SCIENCE
Fig. 3. Paleocommunities and alternative model transient dynamics. (A and B) DAZ Ph0; (C andD) Ph1; (E and F) Ph2; (G and H) LAZ (see text for explanation). Colors correspond to modelsillustrated in Fig. 1, B to F; deep blue are paleocommunity results. Lines represent median of 100simulations per model, and filled envelopes are 25th and 75th percentiles.
RESEARCH | REPORTSon M
arch 1, 2019
http://science.sciencemag.org/
Dow
nloaded from
are amplified significantly less than those of thefunctionally altered models (H = 32.613, df = 2,P = 0.0001) (Fig. 3F), but there is no longer anydistinction based on interaction distributions(H = 2.176, df = 2, P = 0.1402) (Fig. 3E).Paleocommunities during the PTME weretherefore as stable or significantly more stablethan models with alternative functional organi-zation. The Early Triassic Lystrosaurus assem-blage zone (LAZ)paleocommunity, in the aftermathof the PTME, is indistinguishable from the guild-randomized and hyperbolic interaction distri-bution models (H = 3.759, df = 3, P = 0.2887)(Fig. 3, F and G) but differs significantly from thePoisson-distributed model (H = 53.455, df = 1,P = 0.0001) (Fig. 2F). This paleocommunity wastherefore no more stable than the randomizedmodels, an observation consistent with LAZ’sinferred hypersensitivity to simulated disrup-tions of primary productivity (11). By theMiddleTriassic, though, the Cynognathus assemblagezone community exhibited dynamics similar tothose of the premass extinction communities(table S4).The increased frequencies of locally stable pale-
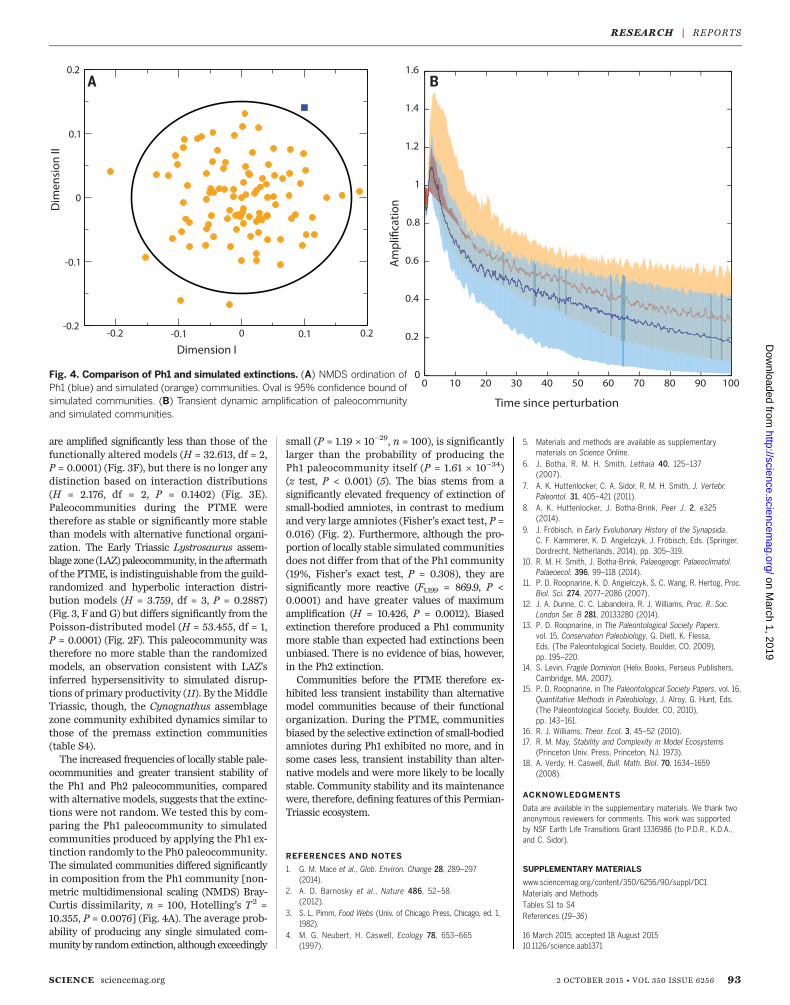
ocommunities and greater transient stability ofthe Ph1 and Ph2 paleocommunities, comparedwith alternative models, suggests that the extinc-tions were not random. We tested this by com-paring the Ph1 paleocommunity to simulatedcommunities produced by applying the Ph1 ex-tinction randomly to the Ph0 paleocommunity.The simulated communities differed significantlyin composition from the Ph1 community [non-metric multidimensional scaling (NMDS) Bray-Curtis dissimilarity, n = 100, Hotelling’s T 2 =10.355, P = 0.0076] (Fig. 4A). The average prob-ability of producing any single simulated com-munity by randomextinction, althoughexceedingly
small (P = 1.19 × 10⁻²⁹, n = 100), is significantlylarger than the probability of producing thePh1 paleocommunity itself (P = 1.61 × 10⁻³⁴)(z test, P < 0.001) (5). The bias stems from asignificantly elevated frequency of extinction ofsmall-bodied amniotes, in contrast to mediumand very large amniotes (Fisher’s exact test, P =0.016) (Fig. 2). Furthermore, although the pro-portion of locally stable simulated communitiesdoes not differ from that of the Ph1 community(19%, Fisher’s exact test, P = 0.308), they aresignificantly more reactive (F1,199 = 869.9, P <0.0001) and have greater values of maximumamplification (H = 10.426, P = 0.0012). Biasedextinction therefore produced a Ph1 communitymore stable than expected had extinctions beenunbiased. There is no evidence of bias, however,in the Ph2 extinction.Communities before the PTME therefore ex-
hibited less transient instability than alternativemodel communities because of their functionalorganization. During the PTME, communitiesbiased by the selective extinction of small-bodiedamniotes during Ph1 exhibited no more, and insome cases less, transient instability than alter-native models and were more likely to be locallystable. Community stability and its maintenancewere, therefore, defining features of this Permian-Triassic ecosystem.
REFERENCES AND NOTES
1. G. M. Mace et al., Glob. Environ. Change 28, 289–297(2014).
2. A. D. Barnosky et al., Nature 486, 52–58(2012).
3. S. L. Pimm, Food Webs (Univ. of Chicago Press, Chicago, ed. 1,1982).
4. M. G. Neubert, H. Caswell, Ecology 78, 653–665(1997).
5. Materials and methods are available as supplementarymaterials on Science Online.
6. J. Botha, R. M. H. Smith, Lethaia 40, 125–137(2007).
7. A. K. Huttenlocker, C. A. Sidor, R. M. H. Smith, J. Vertebr.Paleontol. 31, 405–421 (2011).
8. A. K. Huttenlocker, J. Botha-Brink, Peer J. 2, e325(2014).
9. J. Fröbisch, in Early Evolutionary History of the Synapsida,C. F. Kammerer, K. D. Angielczyk, J. Fröbisch, Eds. (Springer,Dordrecht, Netherlands, 2014), pp. 305–319.
10. R. M. H. Smith, J. Botha-Brink, Palaeogeogr. Palaeoclimatol.Palaeoecol. 396, 99–118 (2014).
11. P. D. Roopnarine, K. D. Angielczyk, S. C. Wang, R. Hertog, Proc.Biol. Sci. 274, 2077–2086 (2007).
12. J. A. Dunne, C. C. Labandeira, R. J. Williams, Proc. R. Soc.London Ser. B 281, 20133280 (2014).
13. P. D. Roopnarine, in The Paleontological Society Papers,vol. 15, Conservation Paleobiology, G. Dietl, K. Flessa,Eds. (The Paleontological Society, Boulder, CO, 2009),pp. 195–220.
14. S. Levin, Fragile Dominion (Helix Books, Perseus Publishers,Cambridge, MA, 2007).
15. P. D. Roopnarine, in The Paleontological Society Papers, vol. 16,Quantitative Methods in Paleobiology, J. Alroy, G. Hunt, Eds.(The Paleontological Society, Boulder, CO, 2010),pp. 143–161.
16. R. J. Williams, Theor. Ecol. 3, 45–52 (2010).17. R. M. May, Stability and Complexity in Model Ecosystems
(Princeton Univ. Press, Princeton, NJ, 1973).18. A. Verdy, H. Caswell, Bull. Math. Biol. 70, 1634–1659
(2008).
ACKNOWLEDGMENTS
Data are available in the supplementary materials. We thank twoanonymous reviewers for comments. This work was supportedby NSF Earth Life Transitions Grant 1336986 (to P.D.R., K.D.A.,and C. Sidor).
SUPPLEMENTARY MATERIALS
www.sciencemag.org/content/350/6256/90/suppl/DC1Materials and MethodsTables S1 to S4References (19–36)
16 March 2015; accepted 18 August 201510.1126/science.aab1371
SCIENCE sciencemag.org 2 OCTOBER 2015 • VOL 350 ISSUE 6256 93
Fig. 4. Comparison of Ph1 and simulated extinctions. (A) NMDS ordination ofPh1 (blue) and simulated (orange) communities. Oval is 95% confidence bound ofsimulated communities. (B) Transient dynamic amplification of paleocommunityand simulated communities.
RESEARCH | REPORTSon M
arch 1, 2019
http://science.sciencemag.org/
Dow
nloaded from

Community stability and selective extinction during the Permian-Triassic mass extinctionPeter D. Roopnarine and Kenneth D. Angielczyk
DOI: 10.1126/science.aab1371 (6256), 90-93.350Science
, this issue p. 90; see also p. 38Sciencecatastrophic extinctions.current extinction. Thus, the current anthropogenically driven extinction is fundamentally different from previous smaller-bodied species being more prone to extinction. This pattern is in direct contradiction to the patterns seen in ourcommunities were key predictors of stability through the event. Furthermore, extinctions were not random, with of the largest, the Permian-Triassic Extinction (see the Perspective by Marshall). The structure and diversity oftimes, but there have been several comparable events during Earth's history. Roopnarine and Angielczyk examined one
Human activities are creating a mass extinction event. The intensity of this event is unprecedented during humanNo precedent
ARTICLE TOOLS http://science.sciencemag.org/content/350/6256/90
MATERIALSSUPPLEMENTARY http://science.sciencemag.org/content/suppl/2015/09/30/350.6256.90.DC1
CONTENTRELATED http://science.sciencemag.org/content/sci/350/6256/38.full
REFERENCES
http://science.sciencemag.org/content/350/6256/90#BIBLThis article cites 27 articles, 3 of which you can access for free
PERMISSIONS http://www.sciencemag.org/help/reprints-and-permissions
Terms of ServiceUse of this article is subject to the
is a registered trademark of AAAS.Sciencelicensee American Association for the Advancement of Science. No claim to original U.S. Government Works. The title Science, 1200 New York Avenue NW, Washington, DC 20005. 2017 © The Authors, some rights reserved; exclusive
(print ISSN 0036-8075; online ISSN 1095-9203) is published by the American Association for the Advancement ofScience
on March 1, 2019
http://science.sciencem
ag.org/D
ownloaded from