community sport vop programme · community sport vop programme full report –confidentialised ......
TRANSCRIPT

COMMUNITY SPORTVOP PROGRAMME
FULL REPORT – CONFIDENTIALISEDFOR SPORTS INVOLVED
MARCH 2016
Co
pyr
igh
t ©
2012
Th
e N
iels
en C
om
pan
y. C
on
fid
enti
al a
nd
pro
pri
etar
y.
2
CONTENTS
OBJECTIVES AND APPROACH
QUANTITATIVE RESULTS
• Key Insights and Quantitative Methodology
• Key Metric Results
• Driver Analysis
• New Members
• Injuries
• Gender Differences
• Sample Profiles
ANALYSIS OF THE QUESTIONNAIRE
ANALYSIS OF THE PROCESS
FINAL RECOMMENDATIONS

Co
pyr
igh
t ©
2012
Th
e N
iels
en C
om
pan
y. C
on
fid
enti
al a
nd
pro
pri
etar
y.
3
SUMMARY• Overall the pilot worked well and we have created a clear, succinct questionnaire to be used in the
future by NSOs to understand players’ experiences at their club.
• As part of the pilot we tested three different approaches to conducting the research. The results showed the approach does not appear to impact response rates – meaning surveys in future could be distributed in a number of ways, using either open or individualised links to an online survey.
• Instead more important factors for NSOs to consider are:
The quality of their database and how contact details can be collected for online surveys.
How they communicate the survey to achieve cut through. Ideally initial pre-notification about the survey should be done well in advance as part of a communicated programme of work aimed at improving the player experience. Communication should be clear and concise, using a number of different methods e.g. newsletters, website, individualised emails - each reinforcing the importance of the research.
Whether to include an incentive or not (note: this was not tested in the pilot).
How they will ‘close the loop’ i.e. provide the results back to the players via the clubs or NSOs showing what will change as a result of the players’ feedback. This will have the largest impact on future response rates, by showing their feedback is valued and acted on.
• Finally, a big thank you to everyone at Bowls New Zealand, Football New Zealand, New Zealand Rugby League and Tennis New Zealand who helped with this pilot.

Co
pyr
igh
t ©
2012
Th
e N
iels
en C
om
pan
y. C
on
fid
enti
al a
nd
pro
pri
etar
y.
4
CONFIDENTIALISED• This report has been adapted from the original report to remove individual sport results, and any other
identifiers of either individual or sport results.
• In confidentialising this report, a number of graphics have been removed and sport names have been changed. The changes have not affected the results or the importance of the findings.
CONTACT DETAILS• For individuals or sports interested in this report, or participating in the ongoing voice-of-participant
programme, please contact Sport NZ.
• All media enquires should be submitted via the Sport NZ website – www.sportnz.org.nz

OBJECTIVES AND APPROACH
Co
pyr
igh
t ©
2014
Th
e N
iels
en C
om
pan
y. C
on
fid
enti
al a
nd
pro
pri
etar
y.
6
VOICE-OF-PARTICIPANT PROGRAMME• Sport New Zealand is embarking on a major programme called Voice-of-Participant (VOP) to develop and
implement a cross sport and recreation sector approach to capturing, analysing, interpreting and using participant/ membership survey data.
• The objectives of the VOP programme are:
• To empower the sport system to respond to the wants and needs of participants.
• To embed processes that continually put the participant at the centre of decision making.
• To improve the development and delivery of products and services that meet the needs of participants.
• To complement and systematize existing participant information and the processes by which participant information is gathered and analysed.
• To ‘bring’ the voice of the participant to the centre of the sport system (including Sport NZ).
• Stage 1 development of the VOP programme is to design a suite of survey tools which can be used by National Sports Organisations (NSOs) to survey their members (i.e. players) to understand the player’s participant experience with their club.
• In future the programme could roll out to cover events/ tournaments, RSTs/RSDs, TAs/ Councils, activities and even children doing sport at school.
• A participant experience approach is one that looks at behaviours, attitudes and needs as they relate to specific interaction points across total engagement with a sport/ service. It is valuable to organisationswith members as it helps them understand how different interactions are perceived and what is really important to get right in order to retain and grow membership.

Co
pyr
igh
t ©
2014
Th
e N
iels
en C
om
pan
y. C
on
fid
enti
al a
nd
pro
pri
etar
y.
7
VOP STAGE 1 - APPROACH• While some work had already been undertaken by Sport NZ and NSOs to create a draft ‘welcome’ and
‘mid-season’ survey, it was felt it was important to incorporate the participant’s point of view on what was most important to them and then test the reviewed surveys.
• In designing the survey tools, the project was made up of three broad areas:
Identify the most important elements of the sport experience from the
member’s perspective
Test the survey and the different ways of delivering the survey to NSO members
Design a survey that captures these elements
Identify Design Pilot/ Test
• Stage 1 involved both qualitative and quantitative components:
• The qualitative (two online bulletin boards with 28 participants) was to understand what makes a good or bad club experience and what players consider their ideal experience
• Based on the qualitative findings we then designed an online questionnaire
• We piloted the questionnaire, using three different methods of delivery, with members of four NSOs; New Zealand Football, Tennis New Zealand, Bowls New Zealand and New Zealand Rugby League.
• This report covers the results of the pilot, as well as a review of how the process/ communications and questionnaire worked (the full qualitative findings are reported separately).

Co
pyr
igh
t ©
2014
Th
e N
iels
en C
om
pan
y. C
on
fid
enti
al a
nd
pro
pri
etar
y.
8
THE QUALITATIVE IDENTIFIED SEVEN DRIVERS OF CLUB SATISFACTION
POSITIVE CLUBMEMBER
EXPERIENCE
FRIENDLY & WELCOMING
PROFESSIONALISM &EXPERTISE
GOOD COMMUNICATIONS
DECENT FACILITIES
GREAT COACHES
FULFILLING POTENTIAL
GOOD SOCIALENVIRONMENT

Co
pyr
igh
t ©
2014
Th
e N
iels
en C
om
pan
y. C
on
fid
enti
al a
nd
pro
pri
etar
y.
9
What this means• The club is open and inclusive in its culture• The club welcomes new members• The club makes it easy for new members to feel at ease – buddy system, history of club, tour of facilities,• Introduction to coaches and managers, supplies contact lists• The club is not hierarchical• The club fosters a culture of approachability, understanding and warmth – all key personnel display these
values: make conversation, smile, say hello to each other, invite people in• All members are encouraged to take part in things• Everyone is given a fair go at field/play• The club encourages good sportsmanship• The club provides a safe and welcoming environment for families/children – juniors, secure, youth events
Negative indicators• The club is cliquey/old guard/élitist• People don’t acknowledge or talk to each other• People get ignored or rebuffed
FRIENDLY AND WELCOMINGThe club makes all members feel welcome and demonstrates an open and friendly culture

Co
pyr
igh
t ©
2014
Th
e N
iels
en C
om
pan
y. C
on
fid
enti
al a
nd
pro
pri
etar
y.
10
What this means• Well-run (organised and efficient) and financially stable• Transparency – governance, objectives, finances• Good etiquette on and off the fields• Club uniform (if required) – smart and fosters pride• Sponsorship – brands/businesses want to be associated with it• Ability to secure local government funding• Competing in events nationally • Regularly involved in the wider sports area e.g. at regional and national level• Builds profile – interaction with other clubs • Caring but firm with the rules• Strong retention of members and development of new membership
Negative indicators• Finances are a mess• Inward looking and lacking good organisation
DEMONSTRATING PROFESSIONALISM AND EXPERTISE The club operates in a professional manner and has sporting expertise
Co
pyr
igh
t ©
2014
Th
e N
iels
en C
om
pan
y. C
on
fid
enti
al a
nd
pro
pri
etar
y.
11
What this means• All club members have access to communications• The club fully informs its members of events and activities and changes to schedules• The club communicates in a meaningful, relevant and timely manner• There is consistency in communications• Communications are concise and accurate• Communications are two-way e.g. mechanism for members to easily feedback to leadership
committee/suggestion boxes etc.• Ability to choose how I receive e.g. text, email etc.• Weekly newsletter during the season – past week’s results, upcoming events, today’s events, information
about the club, event opportunities in New Zealand, social events and activities• Wide range of ways to communicate – face-to-face, text, email, Facebook, Twitter, Snapchat• Up-to-date website
Negative indicators• Sporadic and inaccurate communications and not timely• Failure to communicate last minute changes e.g. cancellations, changes of pitch/venue• Conflicting or confusing communications
GOOD COMMUNICATIONSThe club communicates well and appropriately

Co
pyr
igh
t ©
2014
Th
e N
iels
en C
om
pan
y. C
on
fid
enti
al a
nd
pro
pri
etar
y.
12
What this means• The pitches/grounds are well-looked after and fit for purpose (e.g. grass cut and pitches well-marked)• There is the right equipment, in good condition and there is enough of it (e.g. balls, cones, bibs, nets
etc.)• Clean and tidy changing rooms – benches, bins• Hot water• Large showers• Appropriate necessities e.g. hair dryers, heated mirrors, for swimming clubs• Cold drinking water is readily available• There are good and working kitchen facilities – preparation and wash-up area, dishwasher, kettles,
oven etc. and BBQ for outdoors• Good and ample parking• Club bar – alcohol and soft drinks• Club-room for social activities
Negative indicators• Dirty changing rooms and club areas• No hot water• Damp, leaky and mouldy changing areas• Lack of or damaged equipment
FACILITIESThe club has decent facilities
Co
pyr
igh
t ©
2014
Th
e N
iels
en C
om
pan
y. C
on
fid
enti
al a
nd
pro
pri
etar
y.
13
What this means• Coaches are knowledgeable, understanding and compassionate• They are available, patient and supportive• Coaches have technical expertise• Coaches can identify the strengths and weakness of players and act accordingly• They offer constructive criticism• Coaches offer suggestions/areas for improvement to players e.g. chiropractor, gym exercises, running
coaches for stamina/cross training• Coaches respecting the individual and their technique – one size does not fit all• The coaches are good communicators and communicate clearly• They are passionate and enthusiastic about their sport and share this• Available for the whole club e.g. workshops and master-classes
Negative indicators• Inexperienced and lacking in people skills• Not interested in developing players• Not readily available/difficult to get access to them
GREAT COACHESThe club provides great coaching to all its members
Co
pyr
igh
t ©
2014
Th
e N
iels
en C
om
pan
y. C
on
fid
enti
al a
nd
pro
pri
etar
y.
14
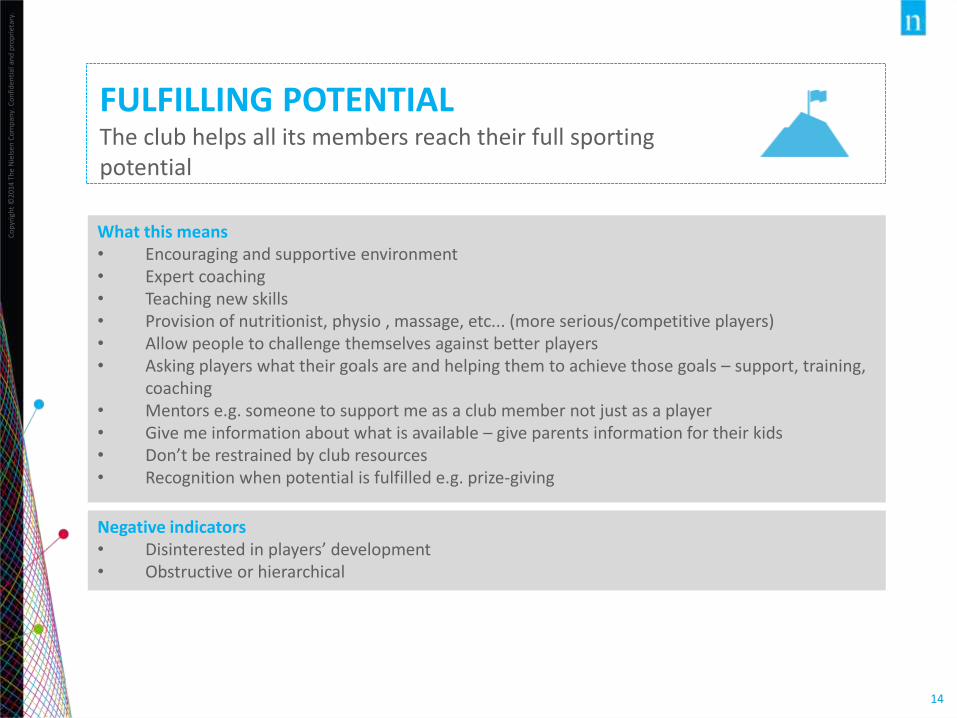
What this means• Encouraging and supportive environment• Expert coaching• Teaching new skills• Provision of nutritionist, physio , massage, etc... (more serious/competitive players)• Allow people to challenge themselves against better players• Asking players what their goals are and helping them to achieve those goals – support, training,
coaching• Mentors e.g. someone to support me as a club member not just as a player• Give me information about what is available – give parents information for their kids• Don’t be restrained by club resources• Recognition when potential is fulfilled e.g. prize-giving
Negative indicators• Disinterested in players’ development• Obstructive or hierarchical
FULFILLING POTENTIALThe club helps all its members reach their full sporting potential

Co
pyr
igh
t ©
2014
Th
e N
iels
en C
om
pan
y. C
on
fid
enti
al a
nd
pro
pri
etar
y.
15
What this means• Contact and interaction between teams/players – mix things up e.g. men train with women• Mid-week tournaments• Good sized club-room with appropriate facilities (e.g. kitchen, bar)• End of season prize-giving – not just the best performing player but e.g. fair play award, most improved
etc.• Social events and functions throughout the season e.g. . Cinema, quiz night, Junior Quiz, vinyl evening,
lip synch, fancy dress, dinners, BBQs• Events that are alcohol free as well as ones with alcohol• Include partners/family where appropriate• Promote safety and comfort• Well-organised induction
Negative indicators• Silo’d approach to players/teams• No events or out of play activities
GOOD SOCIAL ENVIRONMENTThe club provides a good social environment for players to enjoy and relax in

Co
pyr
igh
t ©
2014
Th
e N
iels
en C
om
pan
y. C
on
fid
enti
al a
nd
pro
pri
etar
y.
16
THE QUANTITATIVE QUESTIONNAIRE STRUCTUREThe questionnaire designed after the qualitative workshop was as follows:
Other
• Satisfaction• Comparison to other
clubs• Value for money• Recommendation• Why/ why not
recommend• Likelihood to rejoin
next year
Overall measures
Drivers of satisfaction
• Overall rating for each of:
- Friendly and welcoming
- Professional and well managed
- Good communications
- Good facilities- Great coaches- Fulfilling potential- Good social
environment
• Then ratings of 29 attributes that described the drivers above
• Preferred method of communication
• Why dissatisfied with Fulfilling Potential
• Incidence of injury, and how club supported during that period
• Actual detracting and advocating behaviours done in last 3 months
• New member attributes*
• One thing to improve
Demographics
• Confirmation of player status (upfront)
• Tenure of membership(upfront)
• Age• Region• Postcode• Gender• Role at club• Representative• Household
composition• Occupation• Re-contact
* Rather than a separate questionnaire, if respondents had been at their club for less than a year, they answered a new member’s section.

Co
pyr
igh
t ©
2014
Th
e N
iels
en C
om
pan
y. C
on
fid
enti
al a
nd
pro
pri
etar
y.
17
THE QUANTITATIVE PILOT• The aims of the pilot were to test:
• The questionnaire content
• The response rates from different ways to send the survey to players.
• An email invitation, containing an online link, was sent to players to invite them to complete the survey
• The type of link and who sent the links out, varied depending on one of three different approaches:
3NSO OPEN
The NSO sends a single open link to each
email address
1 2NIELSEN INDIVIDUAL
Nielsen sends individual links directly to each
email address
NSO INDIVIDUAL
The NSO sends out individual links (created
by Nielsen) to each email address

Co
pyr
igh
t ©
2012
Th
e N
iels
en C
om
pan
y. C
on
fid
enti
al a
nd
pro
pri
etar
y.
18
CONTEXT• It is important to note some key differences between the NSOs in the pilot and to interpret the results in
the right context
• As different sports were at different points in their seasons, this may impact response rates and views of their experience
• Different sports have different types of players, demographic make ups, which again will impact responses rate and views of their experience.

QUANTITATIVE RESULTS

Co
pyr
igh
t ©
2012
Th
e N
iels
en C
om
pan
y. C
on
fid
enti
al a
nd
pro
pri
etar
y.
20
KEY INSIGHTS #1• The results for all of the key metrics are relatively high but given belonging to a sports clubs is a voluntary
activity that people do for fun or leisure, we believe the results could be better.
• The type of player who is more positive on the key metrics are office holders/ committee members, officials/ judges and players who have been selected to represent their club at a regional event i.e. those that are more involved at the club. Those who have been at the club for longer are also more positive.
• Overall NPS detractors and those who are less likely to rejoin their club, are more likely to be young adults and live in Auckland.
• When asked to state why they would recommend their club, promoters said it related to a great atmosphere and other members being friendly and welcoming.
• When detractors were asked what needs to improve, better club management/ committee, more fairness/equal opportunity and better atmosphere/ friendlier were the top three things mentioned.
• In terms of actual behaviour i.e. have complained to their club – this is more likely to be players who are also managers, coaches or officials/ judges and those who have represented their region at a national event or have played for the top team at the club. The same type of player has also actually recommended their club in the last three months or said something positive.

Co
pyr
igh
t ©
2012
Th
e N
iels
en C
om
pan
y. C
on
fid
enti
al a
nd
pro
pri
etar
y.
21
KEY INSIGHTS #2• Approximately half of new members are satisfied with the ease of the joining process but this drops to
40% satisfied with protocols and how everything works at the club being explained.
• The order of the seven drivers of a positive club experience (identified in the qualitative stage) varies depending on whether we are looking at satisfaction or recommendation. Allowing me to fulfil my potential is the number one driver for satisfaction, whereas value for money is the number one driver for recommendation. However, analysing which drivers are more important and how clubs are performing overall, shows there are three areas of focus for clubs:
• allowing me to fulfil my potential
• being professional and well managed
• having good communication.
• These are the same three areas of focus for new members.
• Looking into allowing me to fulfil my potential more (as this is a trickier one to understand), clubs need to think about how they can provide better coaches/training, including coaching clinics and having fewer players per session. Fairness and equal opportunity was also important to players in relation to fulfilling potential, and included team selection and access to the facilities.
• If there is a change in situation (venue, time etc.) – then half of players would like to be notified by text message, and another third by email. The traditional channels of 0800 # to call and radio overall are no longer desired.

Co
pyr
igh
t ©
2012
Th
e N
iels
en C
om
pan
y. C
on
fid
enti
al a
nd
pro
pri
etar
y.
22
WHAT DOES THIS MEAN?• Not surprisingly tenure is related to the key metrics – if you are not satisfied as a new member (albeit
there may be a honeymoon period), then you are unlikely to be a long term member of your club.
• Are there issues in Auckland and with young adults that clubs need to think about how to cater for the needs of these types of players?
• Committees and club management are at the forefront when it comes to a lack of recommendation, there is also an equality issue for some – both gender and competitive hierarchy related.
• When it comes to actual behaviour clubs are hearing from a much smaller group of players and arguably only those that are more involved. The same people are those who have also actually recommended their club in the last three months or said something positive. So they are more vocal both positively and negatively. But what about everyone else? Clubs are not hearing why they are unhappy or dissatisfied.

Co
pyr
igh
t ©
2012
Th
e N
iels
en C
om
pan
y. C
on
fid
enti
al a
nd
pro
pri
etar
y.
23
KEY INSIGHTS #3• Looking at the differences between the four NSOs on the driver attributes…
• Fulfilling potential:
• Sport X clubs perform lower on providing resources and opportunities to fulfil potential
• Communication:
• Sport Y clubs perform better on communications that are relevant
• Sport X clubs perform lower on timely communications, which Sport Z and Sport Y perform better on
• Sport Y clubs appear to be more responsive to feedback
• Sport Y and Sport Z clubs perform better on communications being accessible
• Professional and well managed:
• Sport Z and Sport Y clubs tend to do better on the professional and well managed attributes, whereas X clubs perform lower
• Sport X clubs perform lower on being an organisation you can trust, well managed and organised, being transparent about finances, being responsive to needs and requirements and having qualified officials available
• Sport W clubs perform higher on fostering a sense of pride
• Sport Z clubs perform better at engaging with the local community and having qualified officials available
• Sport Y clubs perform lower at being transparent about team selection

Co
pyr
igh
t ©
2012
Th
e N
iels
en C
om
pan
y. C
on
fid
enti
al a
nd
pro
pri
etar
y.
24
KEY INSIGHTS #3• Friendly and welcoming
• Sport Y clubs perform better at being welcoming to all members and being inclusive to all members in the club
• Facilities
• Sport X and Sport W clubs are rated lower on all the facilities attributes whereas Sport Y and Sport Z clubs are rated higher
• Coaches
• Sport Y clubs do well on the coaching attributes, whereas Sport Z and Sport X clubs are rated lower
• Value for money
• Sport Y and Sport Z clubs are rated higher for value for money whereas Sport X clubs score much lower on the level of satisfaction with value for money
• While the demographics and context is different for each NSO, are there common learnings that could be shared or different ways of addressing areas where players are rating clubs lower?

Co
pyr
igh
t ©
2012
Th
e N
iels
en C
om
pan
y. C
on
fid
enti
al a
nd
pro
pri
etar
y.
25
QUANTITATIVE METHODOLOGY
9269 CLUB MEMBERS 16/18+
from across four NSOs were invited to take part in this survey. Current (or recent season) players were supplied by each NSO. To ensure robust results for each NSO, additional booster samples were invited during fieldwork.
ONLINE SURVEY
Fieldwork took place between 29 October – 17 November 2015, at
the beginning of the Bowls and Tennis season and after the League
and Football season. Booster samples were invited during the week commencing 9 November.
WEIGHTING
Weighting was applied to the results to ensure each NSO
contributed evenly to the total results (i.e. each NSO contributes
to 25% of the total).
1662 PLAYERS
A total of 1662 players completed the survey giving a maximum margin of error of ±2.4%.
THE RESEARCH
Co
pyr
igh
t ©
2013
Th
e N
iels
en C
om
pan
y. C
on
fid
enti
al a
nd
pro
pri
etar
y.
26
NOTES TO THIS REPORTStatistical Significance
Statistically significant differences are highlighted or commented on in this report. Where no highlighting has been used (or no commentary included about a subgroup), it may safely be assumed that differences from the total/average are not statistically significant or they are not pertinent.
• Statistically significant differences in this report are significant at the 95% confidence level. That is, we are 95% confident results are not just normal expected variances that result from talking to a different sample within the same population (the smaller the sample size the higher the expected variance between samples).
• Statistical significance is reported in the following ways:
Downward arrows– result is significantly lower than the average/total.
Upward arrows – result is significantly higher than the average/total.
Weighting
Results were weighted at a total level, with each NSO contributing equally to the overall result. When the results in the report are broken down by subgroup (e.g. region or tenure) the NSOs will not be contributing to 25% of result due to variations in subgroup composition within each NSO.

KEY METRIC RESULTS

Co
pyr
igh
t ©
2012
Th
e N
iels
en C
om
pan
y. C
on
fid
enti
al a
nd
pro
pri
etar
y.
28
HOW ARE CLUBS PERFORMING?
OVERALL SATISFACTION (% very satisfied or extremely satisfied)
COMPARED TO OTHERS(% better than other or much better than others)
NET PROMOTER SCORE(% promoters less % detractors)
LIKELIHOOD TO REJOIN(% quite likely or very likely)
SIX IN TEN (61%) PLAYERS ARE SATISFIED
NPS SCORE = 43
SEVEN IN TEN (68%) RATE THEIR CLUB AS BEING BETTER THAN OTHER CLUBS
83% ARE LIKELY TO REJOIN THEIR CURRENT CLUB NEXT SEASON
Sport Z Sport X Sport W Sport Y
64% 54% 59% 68%
Sport Z Sport X Sport W Sport Y
72% 61% 68% 70%
Sport Z Sport X Sport W Sport Y
53 23 48 48
Sport Z Sport X Sport W Sport Y
86% 78% 77% 90%
Significantly higher/lower than total

Co
pyr
igh
t ©
2012
Th
e N
iels
en C
om
pan
y. C
on
fid
enti
al a
nd
pro
pri
etar
y.
29
HOW SATISFIED ARE PLAYERS WITH THEIR CLUB?
6%
30%
37%
24%
EXTREMELY SATISFIED VERY SATISFIEDSATISFIED DISSATISFIEDEXTREMELY DISSATISFIED
61% of players are satisfied with the overall experience of playing at their club
Base: All Respondents excluding don't know/ can't say (n=1650)Q4. To what extent are you satisfied or dissatisfied with the overall experience of playing <insert sport> at your club?
SUBGROUP DIFFERENCES
Those significantly more likely to be satisfied compared with the total of 61% are:
• Club presidents/office holders (76%), official/ judges (76%) or committee members (74%)• Living in Otago (75%), Hawke’s Bay (74%) or Canterbury (69%)• Players who have been selected to represent their club at a regional event/ competition
(67%)• Players who have been members of their current club for more than 10 years (66%)• Young retirees (67%).
While those significantly less likely to be satisfied are:• Living in Wellington (52%)• Players who have been members of their current club for 3 -5 years (54%).
Significantly higher/lower than total
64%54% 59%
68%
BOWLS (N=496) FOOTBALL (N=214)
RUGBY LEAGUE (N=164)
TENNIS (N=776)
OVERALL SATISFACTION (BY NSO)
SPORT Y players are significantly more likely to more satisfied with their club experience (68% compared to the total of 61%).
SPORT X players on the other hand are significantly less likely to be satisfied (54%) with their overall club experience.
SPORT Z SPORT X SPORT W SPORT Y

Co
pyr
igh
t ©
2012
Th
e N
iels
en C
om
pan
y. C
on
fid
enti
al a
nd
pro
pri
etar
y.
30
SEVEN IN TEN PLAYERS PERCEIVE THEIR CLUB TO BE BETTER THAN OTHERS
1% 9% 22% 41% 27%
MUCH WORSE THAN OTHERS WORSE THAN OTHERS THE SAME AS OTHERS
BETTER THAN OTHERS MUCH BETTER THAN OTHERS
Base: All Respondents excluding don't know/ can't say (n=1510)Q5. Compared to other clubs that you know if, what is your overall opinion about your club?
SUBGROUP DIFFERENCES
Those significantly more likely to rate their club as being better than others are:
• Living in Manawatu-Whanganui (83%), Canterbury (75%) or Otago (74%)
• Officials/judges (85%), committee members (81%) or club presidents/office holders (76%)
• Players who have been selected to represent their club at a regional event/ competition (75%)
• Players who have been members of their current club for more than 10 years (73%).
While those significantly less likely to rate their club as being better than others are:• Living in Waikato (55%) or Auckland
(62%)• Players who have been members of their
current club for less than 5 years (62%).
68% of players perceive their club to be
better than others clubs that they know of.
10% perceive their club
to be worse than others.
Significantly higher/lower than total
72% 61%
68% 70%
5%
17% 12%
6%
OPINION OF CLUB (BY NSO)
SPORT Y and SPORT Z players are significantly more likely to rate their club as being better than other clubs (72% and 70% respectively compared to the total of 68%).
SPORT X players on the other hand are significantly more likely to rate their club as being worse than others (17% compared to 10%).
BET
TER
TH
AN
O
THER
SW
OR
SE T
HA
NO
THER
S
SPORT Z SPORT X SPORT W SPORT Y

Co
pyr
igh
t ©
2012
Th
e N
iels
en C
om
pan
y. C
on
fid
enti
al a
nd
pro
pri
etar
y.
31
NET PROMOTER SCORE: HOW LIKELY ARE PLAYERS TO RECOMMEND THEIR CLUB?
16%
25%
59%
DETRACTORS PASSIVES PROMOTERS
NPS: + 43
PROMOTERS(rated 9 or 10 –extremely likely)
PASSIVES(rated 7 or 8)
DETRACTORS(rated 0 – not at all likely to 6)
Base: All Respondents excluding don't know/ can't say (n=1653)Q7. Someone is interested in playing <insert sport> wants to join a club. How likely are you to recommend your club, using a scale of 0 to 10 where 0 is not at all likely and 10 is extremely likely?
NPS = % PROMOTERS - % DETRACTORS
Six in ten (59%) players are highly likely to recommend their club to someone interested in
playing their sport (rated 9 or 10, with 10 being extremely likely).
SUBGROUP DIFFERENCES
Those more likely to be promoters are:• Club presidents/office holders (78%), committee members (77%) or official/ judges (74%) • Living in Northland (76%), Hawke’s Bay (74%) or Otago (72%)• Retirees (70% older retirees; 67% younger retirees)• Players who have been selected to represent their club at a regional event/ competition
(67%)• Players who have been members of their current club for more than 10 years (65%).
Those more likely to be detractors are:• Young adults (24% compared with 16% total)• Living in Auckland (20%)• Players who have been members of their current club for 3 -5 years (20%).
13% 23%
15% 12%
21%
30%
22% 29%
66% 46%
63% 60%
BOWLS (N=498) FOOTBALL (N=214) RUGBY LEAGUE (N=167)
TENNIS (N=774)
+ 53 + 23 + 48 + 48NPS (BY NSO)
SPORT Z players are significantly more likely to be promoters, while SPORT X players are significantly more likely to be detractors.
SPORT Z SPORT X SPORT W SPORT Y Significantly higher/lower than total

Co
pyr
igh
t ©
2012
Th
e N
iels
en C
om
pan
y. C
on
fid
enti
al a
nd
pro
pri
etar
y.
32
REASONS FOR RECOMMENDATION
58%
18%
18%
17%
16%
13%
11%
11%
9%
9%
7%
5%
5%
4%
4%
4%
4%
7%
GREAT ATMOSPHERE/ FRIENDLY/ SUPPORTIVE/ WELCOMING
OPTIONS/ VARIOUS LEVELS OF PLAYERS/ SERIOUS PLAYERS/EVERYONE
GREAT CLUB/ THE BEST/ BETTER THAN OTHER CLUBS/WELL ESTABLISHED
GREAT/ STRONG COACHES/ COACHING SUPPORT FOR YOUNG,OLD AND NEW PLAYERS
WELL MANAGED/ STRONG/ INVOLVED COMMITTEES
GOOD FACILITIES/EQUIPMENT
COMPETITIVE/SUCCESSFUL CLUB/HIGH LEVEL OF PLAY
SOCIAL CLUB - SOCIAL EVENTS/ ACTIVITIES/ SOCIAL PLAYING/TOURNAMENTS
FAMILY ORIENTATED/FAMILY FRIENDLY
GOOD/MORE PLAYING SURFACES
GREAT LOCATION/AREA
GOOD SUPPORT FOR JUNIORS/ GOOD JUNIOR PROGRAMME
DIFFERENT OPTIONS OF DAYS/ TIMES TO PLAY/ ALL YEAR PLAY
SIZE OF CLUB IS GOOD - LARGE/NOT TOO LARGE
NEED MORE MEMBERS/MORE MID-WEEK/NEED TO RETAIN MEMBERS
NICE CLUB HOUSE
COMMUNITY SUPPORT/FEELING
OTHER
Six in ten (59%) players are likely to recommend their
club to someone interested in playing.
When asked about the reason for their rating, 58% of
players mentioned reasons relating to a club having a
great atmosphere and other members being friendly,
supportive and welcoming.
Base: Players who are highly likely to recommend their club (rated 9 or10), excluding don’t know/none (n=982)Q8. For what reason (s) did you give this rating?
Sport Z Sport X Sport W Sport Y
1Great atmosphere/
friendly and welcoming (64%)
Great atmosphere/ friendly and
welcoming (49%)
Great atmosphere/ friendly and
welcoming (48%)
Great atmosphere/ friendly and
welcoming (68%)
2Options/ various levels of players
(18%)
Wellmanaged/strong
committees (20%)
Great club/ better than other clubs
(30%)
Options/ various levels of players
(30%)
3
Good facilities/ equipment (16%) &
Good playing surfaces (16%)
Great club/ better than other clubs
(19%)
Family orientated/ family friendly (24%)
Great/strong coaches (20%) &
Social club – events and activities (20%)
TOP THREE REASONS (BY NSO)
Co
pyr
igh
t ©
2012
Th
e N
iels
en C
om
pan
y. C
on
fid
enti
al a
nd
pro
pri
etar
y.
33
SOME COMMENTS….
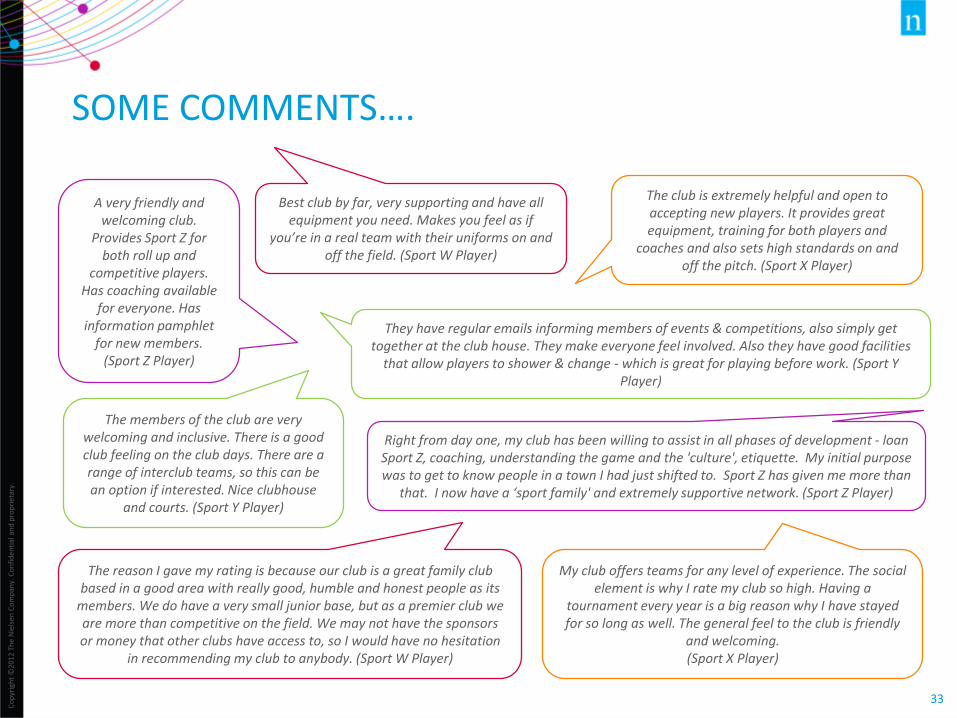
The members of the club are very welcoming and inclusive. There is a good club feeling on the club days. There are a range of interclub teams, so this can be an option if interested. Nice clubhouse
and courts. (Sport Y Player)
The reason I gave my rating is because our club is a great family club based in a good area with really good, humble and honest people as its
members. We do have a very small junior base, but as a premier club we are more than competitive on the field. We may not have the sponsors or money that other clubs have access to, so I would have no hesitation
in recommending my club to anybody. (Sport W Player)
The club is extremely helpful and open to accepting new players. It provides great equipment, training for both players and
coaches and also sets high standards on and off the pitch. (Sport X Player)
My club offers teams for any level of experience. The social element is why I rate my club so high. Having a
tournament every year is a big reason why I have stayed for so long as well. The general feel to the club is friendly
and welcoming. (Sport X Player)
Right from day one, my club has been willing to assist in all phases of development - loan Sport Z, coaching, understanding the game and the 'culture', etiquette. My initial purpose was to get to know people in a town I had just shifted to. Sport Z has given me more than
that. I now have a ‘sport family' and extremely supportive network. (Sport Z Player)
A very friendly and welcoming club.
Provides Sport Z for both roll up and
competitive players. Has coaching available
for everyone. Has information pamphlet
for new members. (Sport Z Player)
Best club by far, very supporting and have all equipment you need. Makes you feel as if
you’re in a real team with their uniforms on and off the field. (Sport W Player)
They have regular emails informing members of events & competitions, also simply get together at the club house. They make everyone feel involved. Also they have good facilities
that allow players to shower & change - which is great for playing before work. (Sport Y Player)

Co
pyr
igh
t ©
2012
Th
e N
iels
en C
om
pan
y. C
on
fid
enti
al a
nd
pro
pri
etar
y.
34
WHAT DO CLUBS NEED TO IMPROVE?
24%
23%
23%
12%
12%
12%
11%
10%
10%
9%
8%
5%
4%
19%
BETTER CLUB MANAGEMENT/ COMMITTEE
MORE FAIRNESS/EQUAL OPPORTUNITIES - TEAM SELECTION/ ACCESS TO BEST COURTS/GREENS/TRAINING
GEAR
BETTER/ MORE ATMOSPHERE/ FRIENDLY/ HELPFUL/ SUPPORTIVE CLUB MEMBERS
NEED MORE MEMBERS/ MORE MID-WEEK/ NEED TO RETAIN MEMBERS
PROVIDE BETTER/ MORE/ COACHES /TRAINING /COACHING AT ALL LEVELS
BETTER /MORE FACILITIES /EQUIPMENT
PLAYING OPPORTUNITIES THAT FIT NEEDS OF MEMBERS
CLUB HOUSE /UPGRADE CLUBHOUSE /CLUB BUILDINGS/ROOMS
BETTER /MORE COMMUNICATION/INFORMATION
MORE COMPETITIVE CLUB /HIGHER STANDARD OF PLAYERS/COMPETITIONS
BETTER /LOWER /CHEAPER FEES
BETTER SOCIAL CLUB - SOCIAL EVENTS/ACTIVITIES/SOCIAL PLAYING/TOURNAMENTS
BETTER OPTIONS OF DAYS/TIMES TO PLAY/ALL YEAR PLAY
OTHER
16% of players are unlikely to recommended their club to someone interested in playing (detractors - rated 0 to 6, with 0 being not at all likely to recommended).
When players were asked what needs to improve at the club in order for their rating to improve, around one in five detractors made comments relating to the following areas of improvement:
24% Better club management / committee
23% More fairness/ equal opportunities – team selection/ access to best courts/ facilities/ training gear
23% Better/ more atmosphere/ friendly, helpful and supportive club members.
Sport Z Sport X Sport W Sport Y
1Better club
management/committee (24%)
More fairness/ equalopportunities (30%)
Better club management/
committee (36%)
Playing opportunities that fit needs of members (24%)
2More fairness/ equalopportunities (22%)
Better/ more atmosphere/
supportive club (30%)
More fairness/ equalopportunities (20%)
Need more members/need to retain
members (20%)
3Better/ more atmosphere/
supportive club (22%)
Better club management/
committee & Better/ more facilities (22%)
Better/ more atmosphere/
supportive club (20%)
More fairness/ equalopportunities (15%)
TOP THREE AREAS OF IMPROVEMENT (BY NSO)
Base: Players who are not likely to recommend their club (rated 0 to 6), excluding don’t know/none (n=226)Q8. for what reason (s) did you give this rating? * Small base size

Co
pyr
igh
t ©
2012
Th
e N
iels
en C
om
pan
y. C
on
fid
enti
al a
nd
pro
pri
etar
y.
35
BETTER CLUB MANAGEMENT
Administration to be more transparent. Less "old boys club" and nepotism. All members should be
viewed as equals. (Sport X Player)
Management style needs to improve and less of those people that have an agenda, and make sure them and their children are looked after.
It’s a club and everyone should be treated the same, not given preference. (Sport W Player)
Better club management/ committee was an area of improvement mentioned by 24% of players when asked what needs to be done to improve their recommendation rating.
Better club management/committee includes:
• Club management being more pro-active and flexible
• More transparency around decisions/running of the club
• Issues with current club management including…
• Current club management having no backbone
• Club management being dictatorial and using their position to bully
other members
Clubs and their club programs are still living in past decades and refuse to accept that times have changed and that there are greater pressures on peoples available time to play now
have very different priorities. (Sport Z Player)
Management of club need to stick to the constitution of the club. The club is slowly disintegrating because of very poor management. Constitutional
procedures are not followed.(Sport Y Player)
The season needs to be cheaper, we get nothing out of what we pay for and the
committee is very biased and choose which teams they prefer to help out and which
teams they don't. There is no new kits given to the teams that need them even if
it’s their turn, the new kit is given to a team that is favourites.(Sport X Player)
24%
22%
36%
13%
BOWLS
FOOTBALL
RUGBY LEAGUE
TENNIS
AREA OF IMPROVEMENT (BY NSO)
Better club management/ committee is the most commonly mentioned area of improvement among SPORT W players.
SPORT Y players are significantly less likely to make comments relating to better club management as an area of improvement.
SPORT Z
SPORT X
SPORT W
SPORT Y

Co
pyr
igh
t ©
2012
Th
e N
iels
en C
om
pan
y. C
on
fid
enti
al a
nd
pro
pri
etar
y.
36
FAIRNESS AND EQUAL OPPORTUNITY
Difference in facilities and opportunities between genders. There is still a large gap with female Sport X still seen as second class to men which is
reflected throughout the club. (Sport X Player)
More fairness / equal opportunities including team selection/ access to facilities was an area of improvement mentioned by 23% of players when asked what needs to be done to improve their recommendation rating.
Improved fairness / equal opportunities involves:
• Resources being shared equally among groups (between genders/ competitive
levels)
• Top players not consistently having first priority for the best facilities/ equipment
• More transparency around team selection, including objective selections
Females are significantly more likely to mention their club providing equal opportunities as an area of improvement (33% cf. 19% of males).
Women's SPORT W is not taken serious at this club. I always felt that we were looked down upon. Also having to pay to go to our prize giving when
its only being held at the actual club rooms. (Sport W Player)
Same people playing together most of the time. Not enough top players playing with newer players all clubs seem to be the same players only wont to
get their name on the honours board. (Sport Z Player)
There are very few who come and play social Sport Y. There are certain members who only play arranged Sport Y between
themselves and don't mix with others. The club is run by a few who vote each other back onto the committee each
year. It is not run according to the constitution. (Sport Y Player)
Sometimes it seems that the club revolves around the interclub players so if your not one of them then you can feel left out a bit.
It would be good if there were more club tournaments both on Sundays and on different days during the week. It would also be
good to have a club night during the week. (Sport Y Player)
22%
30%
20%
15%
BOWLS
FOOTBALL
RUGBY LEAGUE
TENNIS
AREA OF IMPROVEMENT (BY NSO)
More fairness / equal opportunities one of the most commonly mentioned area of improvement among SPORT X players
SPORT Y players are significantly less likely to make comments relating to more fairness / equal opportunity as an area of improvement.
SPORT Z
SPORT X
SPORT W
SPORT Y

Co
pyr
igh
t ©
2012
Th
e N
iels
en C
om
pan
y. C
on
fid
enti
al a
nd
pro
pri
etar
y.
37
Comments relating to improved (better/more) atmosphere and club members being friendly, helpful and supportive were mentioned by 23% of players when asked what needs to improve at their club.
This includes:
• Club members providing more encouragement
• Being positive (not complaining or being negative)
• Being friendly and supportive of new players
• Club duties being shared
• More harmony among players (new/old/competitive/non-competitive)
MORE ATMOSPHERE / FRIENDLY AND SUPPORTIVE CLUB MEMBERS
The club members don't gel well, there is a lot of infighting and niggling, especially about the
officials but at the same time no commitment to put themselves in
an official position. Deeply political and sometimes quite unpleasant.
(Sport Z Player)
Ladies pay the same fee as men yet they dominate. Also ladies are asked to many times over the season to work in the kitchen for
tournaments when the men should be capable. We are Sport Z and after playing for 24 years there is still a 1960 attitude. (Sport Z
Player)
Better welcome for new players from the person at the end of the website query/registration. My welcome was impersonal and offhand. (Sport Y Player)
Better support of coaches… Better collective (shared vision, one team/one dream). More defined hierarchy, not each for their own.
Decisions made with consultation of people affected. (Sport X Player)
More social awareness and support for players; ensuring players needs and aspirations are being met; ensuring that potential NRL players have the support both financially, emotionally, culturally and socially; better higher level playing
competition. (Sport W Player)
AREA OF IMPROVEMENT (BY NSO)
More/ better atmosphere/ friendly and supportive club members is the most commonly mentioned area of improvement among SPORT X players
30% mentioned this along with more fairness / equal opportunities, also 30%.
22%
30%
20%
11%
BOWLS
FOOTBALL
RUGBY LEAGUE
TENNIS
SPORT Z
SPORT X
SPORT W
SPORT Y

Co
pyr
igh
t ©
2012
Th
e N
iels
en C
om
pan
y. C
on
fid
enti
al a
nd
pro
pri
etar
y.
38
SOME MORE COMMENTS….
The quality of Sport Y coaching. I feel as though there are too many people in group coaching sessions and the coaches simply do not have the time to help each player improve on a more individual level. Generally we have a lot of young players and a lot of older
players leaving the club (Sport Y Player)
My club is run by a very hard working committee who are older or retired. They don't always cater for younger working
people. More could be done in this area -for instance our ladies club champs are played on week days. (Sport Z Player)
More interaction with other club members and information as to what is happening around the club. Committee don't produce newsletters etc. so unless you are in the know, information is
limited. (Sport X Player)
I will list some of the challenges: Small club, low number of senior teams, low number of volunteers, a large focus on
premier northern league Sport X, high fees, no formal coaching for lower teams, teams are left to own devices with little
guidance or interaction, un-manned club-bar means we go down the road after matches, no changing rooms when athletic
meets are on. (Sport X Player)
New members need to be included in teams not just top players together until the end of time. I helped at have a go day and there was a good response. New members find it hard to be
included so I wonder what is the good of have a go day. (Sport Z Player)
We play in school boys and are concerned about the behaviours around alcohol especially at home games with parents sitting on
sidelines with alcohol. The use of language and behaviour of parents. Intensity from parents. Angry. Swearing. Belittling the
opposition. Management of club isn't very good. Not very approachable especially the men who have been associated with the
club for many, many years. (Sport W Player)
Social Sport Y is extremely weak and the number of members
turning up has been decreasing for years, the Committee appear to have no solutions nor have they
actually tried anything innovative on a consistent basis to stem the
tide, they appear to more focused on the Senior team/s and their play at the club...which has by
default had a negative impact on social Sport Y (Sport Y Player)
The club needs to invest in the junior grades with regards to funding. There has been
countless times where I have observed money misappropriated to higher grades because of
influence rather than common sense. (Sport W Player)

Co
pyr
igh
t ©
2012
Th
e N
iels
en C
om
pan
y. C
on
fid
enti
al a
nd
pro
pri
etar
y.
39
ONE IN TEN PLAYERS ARE UNLIKELY TO REJOIN THEIR CLUB NEXT YEAR
5%4%
8%
13%
70%
VERY UNLIKELY UNLIKELY
SOMEWHAT LIKELY LIKELY
VERY LIKELY
83% of players
are likely to rejoin their
current club next season
Base: All Respondents excluding don't know/ can't say (n=1644)Q9. How likely are you to play for / rejoin your current club next season?
SUBGROUP DIFFERENCES
Those significantly more likely to rejoin their current club next season are:
• Club presidents/office holders (93%) or committee members (90%)• Living in Hawke’s Bay (93%) or Otago (90%)• Players who have been members of their current club for more than 10 years (89%)• Young retirees (89%) or older adults (87%).
While those significantly less likely to rejoin their current club are:• Living in Auckland (79%)• Players who have been members of their current club for less than 5 years (78%)• Young adults (67%) or tertiary (64%).
Significantly higher/lower than total
86% 78% 77%
90%
BOWLS (N=498) FOOTBALL (N=210)
RUGBY LEAGUE (N=161)
TENNIS (N=775)
HOW LIKELY TO REJOIN CURRENT CLUB (BY NSO)
SPORT Y and SPORT Z players are significantly more likely to rejoin their current club next season (90% and 86% respectively compared to the total of 83%).
SPORT W players on the other hand are significantly less likely to rejoin their club next season (77%).
SPORT Z SPORT X SPORT W SPORT Y

Co
pyr
igh
t ©
2012
Th
e N
iels
en C
om
pan
y. C
on
fid
enti
al a
nd
pro
pri
etar
y.
40
IN THE LAST THREE MONTHS…
HAVE
COMPLAINED TO
THEIR CLUB
12%HAVE BAD
MOUTHED THEIR
CLUB
7%HAVE
RECOMMENDED
THEIR CLUB
67%HAVE SAID
SOMETHING
POSITIVE
79%
SUBGROUP DIFFERENCESThose more likely to have complained to their club in the last three months:
• Have been selected to represent their region at a national event (19% complained) or have played for the top team at their club (15%)
• Club managers (25%), coaches (23%) and officials/judges (21%).
SUBGROUP DIFFERENCESThose more likely to have bad mouthed their club online or in person in the last three months:
• Managers (19%) and coaches (12%) • Have been a member for less than a
year (12%)• Have played for the top team at their
club (10%)• Females (9%)
Those less likely to have bad mouthed their club are:• Committee members (3%)
SUBGROUP DIFFERENCESThose more likely to have recommended their club in the last three months:
• Club presidents /office holders (88%), committee members (85%), officials /judges (83%) and club managers (80%)
• Have been selected to represent their club at a regional level (80%) or played for the top team at their club (74%)
SUBGROUP DIFFERENCESThose more likely to have said something positive about their club in the last three months:
• Club presidents /holders (94%) and committee members (93%)
• Have been selected to represent their club at a regional level (87%) or played for the top team at their club (83%)
Those less likely to have said some positive about their club in person or online :• Have been members for 1 to 2 years
(72%)
Base: All Respondents (n=1662)Q22. Have you done any of the following? Significantly higher/lower than total
13% 15% 11% 7%
BOWLS FOOTBALL LEAGUE TENNIS
5% 11% 7% 4%
BOWLS FOOTBALL LEAGUE TENNIS
73% 53%
79%64%
BOWLS FOOTBALL LEAGUE TENNIS
84% 67%
84% 80%
BOWLS FOOTBALL LEAGUE TENNISSPORT Z SPORT X SPORT W SPORT Y SPORT Z SPORT X SPORT W SPORT Y SPORT Z SPORT X SPORT W SPORT Y SPORT Z SPORT X SPORT W SPORT Y

Co
pyr
igh
t ©
2012
Th
e N
iels
en C
om
pan
y. C
on
fid
enti
al a
nd
pro
pri
etar
y.
41
HOW CAN CLUBS IMPROVE MEMBERS EXPERIENCE
Base: Those who are dissatisfied with their club helping to fulfil their potential excluding don't know/none/nothing/everything all good (n=1274)Q25. If there was one thing your club could do to improve your <insert sport> experience, what would that be?
13%
13%
12%
11%
10%
10%
8%
8%
7%
7%
5%
5%
1%
8%
PROVIDE BETTER/ MORE COACHES/ TRAINING/ COACHING/ BETTER COACHING PROGRAMMES
BETTER/MORE FACILITIES/EQUIPMENT
BETTER/MORE PLAYING SURFACES
NEED MORE MEMBERS/MORE MID-WEEK PLAYERS/NEED TO RETAIN MEMBERS
UPGRADE/BUILD NEW CLUB HOUSE/LARGER/PROPER CLUB ROOMS
MORE FAIRNESS/EQUAL OPPORTUNITIES - TEAM SELECTION/ ACCESS TO BEST COURTS/GREENS/TRAINING GEAR
BETTER/MORE ATMOSPHERE /ENCOURAGEMENT /FRIENDLINESS /HELPFULNESS /SUPPORT
MORE SOCIAL EVENTS/TOURNAMENTS/COMPETITIONS/SOCIAL TEAMS
BETTER/MORE COMMUNICATION/INFORMATION
BETTER CLUB MANAGEMENT/COMMITTEE
BETTER/LOWER/CHEAPER FEES/HAVE ALL FEES INCLUSIVE OF CLUB SUBS
PLAYING OPPORTUNITIES/COMPETITIONS THAT FIT NEEDS OF MEMBERS
BETTER/MORE CLUB DAYS/NIGHTS
OTHER
Providing greater resources to members including coaching, equipment and facilities is among the most commonly mentioned thing clubs can do to improve their members experience.
In addition to improving the club facilities, increasing the number and type of members was mentioned by 11% of players.
Have more free things - everything seems to be an extra charge - for the coaches business. I don't mind the fundraising for new clubhouse,
but think the members should get a few drilling sessions or events free. The annual sub is already fairly large. (Sport Y Player)
More inviting to the wider Sport W community and their needs but also needing more volunteers to step up. (Sport W Player)
Make sure there are some COMPETENT club-based refs we can call on. Not just someone who went to a course and got the shirt - people who actually
KNOW the game and ref well, and are available. (Sport X Player)

Co
pyr
igh
t ©
2012
Th
e N
iels
en C
om
pan
y. C
on
fid
enti
al a
nd
pro
pri
etar
y.
42
HOW HAVE OPINIONS CHANGED IN THE LAST YEAR
Base: Those who have been a member of their current club for more than one year (n=1527)
Q23.Has you satisfaction/ overall opinion of your club increased, remained the same, or decreased compared to last year
28%
62%
10%
INCREASED COMPARED TO LAST YEAR
REMAINED THE SAMEDECREASED COMPARED TO LAST YEAR
Significantly higher/lower than total
A third (28%) of players indicated that their overall opinion of their club has increased compared to last year.
SUBGROUP DIFFERENCES
Those significantly more likely to have an increased opinion of their club compared to last year are:
• Young adults (44%) or Secondary (42%)• Players who have been selected to
represent their region at a national event/ competition (42%) and/or have played for the top team at their club (35%)
• Coaches (39%) or club presidents/office holders (35%).
However players who have been selected to represent their region at national event/competition are also more likely to have a decreased opinion of their club compared to last year (16% compared to 10% of total).
CHANGE IN OVERALL OPINION
24%
28%
44%
18%
10%
14% 8% 8%
SPORT Z(N=484)
SPORT X(N=194)
SPORT W(N=147)
SPORT Y(N=702)
INC
REA
SED
DEC
REA
SED
CHANGE IN OVERALL OPINION OF CLUB (BY NSO)
SPORT W players are more likely to have an improved opinion of their club (44% increased), while the overall opinion of SPORT X players is more likely to have decreased since last year.
SPORT Z SPORT X SPORT W SPORT Y

DRIVER ANALYSISWHAT IS IMPORTANT?

Co
pyr
igh
t ©
2012
Th
e N
iels
en C
om
pan
y. C
on
fid
enti
al a
nd
pro
pri
etar
y.
44
EXPLANATION OF REGRESSION
• Regression is a statistical process for estimating the relationship between a dependent variable
and one or more independent variables (or ‘drivers'). It helps us to understand the importance or
impact of a ‘driver’ by measuring its contribution to explaining variance in the dependent variable.
We have used a regression approach called Modified Kruskal, which addresses any multi-
collinearity issues.
• For this project we constructed two regression models, one using NPS as the dependent variable
and one using Satisfaction as the dependent variable.
• The independent variables in both were the seven drivers identified in the qualitative stage, plus
the attribute value for money. (Note: we completed a number of factor analyses to determine
these drivers were the best independent variables using different combinations of the drivers and
the attributes used to describe them. The resulting models were chosen as they were the simplest
with the highest R2 - an indication of how well the model determines what impacts on the
dependent variable.)
• Regression analysis derives the importance of each attribute and assigns a score ranging from zero
to one – the higher the score the more important/ impact the attribute has.
• The following charts show the impact of the drivers on the left hand side (from the regression
model), and how players are rating their satisfaction with their club on each of these drivers. This
allows us to see what is more important but rated lower and that is where clubs should focus to
improve satisfaction/ NPS.

Co
pyr
igh
t ©
2012
Th
e N
iels
en C
om
pan
y. C
on
fid
enti
al a
nd
pro
pri
etar
y.
45
DRIVERS OF NPS
69%
76%
57%
67%
57%
57%
53%
55%
19%
17%
16%
14%
13%
11%
7%
3%
IMPACT PERFORMANCE
% VERY SATISFIED OR EXTREMELY SATISIFED
Sport Z Sport X Sport W Sport Y
80% 49% 68% 79%
78% 71% 75% 81%
64% 45% 54% 64%
67% 65% 66% 70%
60% 48% 58% 61%
62% 47% 54% 67%
48% 43% 57% 65%
73% 39% 44% 64%
VALUE FOR MONEY (n=1646)
BEING FRIENDLY AND WELCOMING (n=1657
BEING PROFESSIONAL AND WELL MANAGED (n=1644)
PROVIDING A GOOD SOCIAL ENVIRONMENT (n=1641)
ALLOWING ME TO FULFIL MY POTENTIAL (n=1593)
HAVING GOOD COMMUNICATIONS (n=1657)
HAVING GREAT COACHES (n=1446)
HAVING GOOD FACILITIES E.G. PLAYING VENUES,COMPETITION VENUES, CHANGING ROOMS,
CLUB ROOMS (n=1654)
Value for money, being professional and well managed and being friendly and welcoming are key drivers of a player’s likelihood to recommend their club to others.
Base: All Respondents, excluding those who answered don’t know/can’t say and not applicable
Q10. How would you rate your overall satisfaction with your <insert sport> club on each of the following… Significantly higher/lower than total

Co
pyr
igh
t ©
2012
Th
e N
iels
en C
om
pan
y. C
on
fid
enti
al a
nd
pro
pri
etar
y.
46
DRIVERS OF OVERALL SATISFACTION
57%
67%
69%
76%
57%
57%
53%
55%
19%
18%
15%
14%
13%
9%
7%
5%
IMPACT PERFORMANCE
% VERY SATISFIED OR EXTREMELY SATISIFED
Sport Z Sport X Sport W Sport Y
60% 48% 58% 61%
67% 65% 66% 70%
80% 49% 68% 79%
78% 71% 75% 81%
64% 45% 54% 64%
62% 47% 54% 67%
48% 43% 57% 65%
73% 39% 44% 64%
ALLOWING ME TO FULFIL MY POTENTIAL (n=1593)
PROVIDING A GOOD SOCIAL ENVIRONMENT (n=1641)
VALUE FOR MONEY (n=1646)
BEING FRIENDLY AND WELCOMING (n=1657)
BEING PROFESSIONAL AND WELL MANAGED (n=1644)
HAVING GOOD COMMUNICATIONS (n=1657)
HAVING GREAT COACHES (n=1446)
HAVING GOOD FACILITIES E.G. PLAYING VENUES,COMPETITION VENUES, CHANGING ROOMS,
CLUB ROOMS (n=1654)
In addition to value for money, a club allowing players to fulfil their potential and a good social environment are the top three drivers of a player’s overall satisfaction with their club.
Base: All Respondents, excluding those who answered don’t know/can’t say and not applicable
Q10. How would you rate your overall satisfaction with your <insert sport> club on each of the following… Significantly higher/lower than total

Co
pyr
igh
t ©
2012
Th
e N
iels
en C
om
pan
y. C
on
fid
enti
al a
nd
pro
pri
etar
y.
47
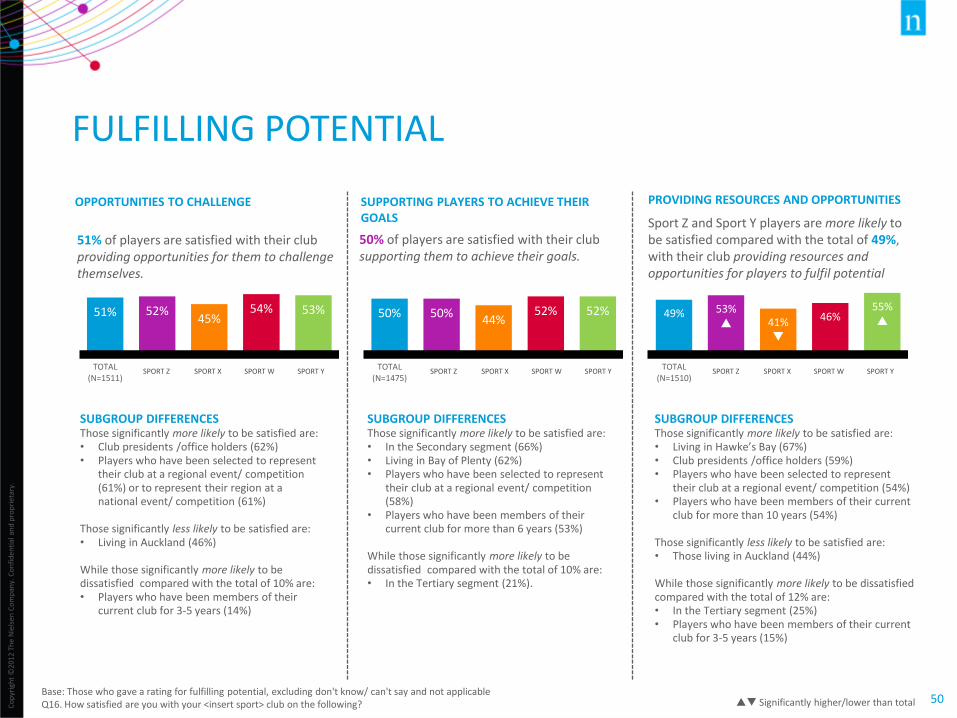
FULFILLING POTENTIAL
8%
9%
10%
39%
40%
40%
31%
30%
28%
20%
20%
20%
PROVIDING OPPORTUNITIES FOR ME TO CHALLENGE
MYSELF (N=1511)
SUPPORTING ME TO ACHIEVE MY GOALS (N=1475)
PROVIDING THE RESOURCES AND OPPORTUNITIES FOR ME
TO FULFIL MY POTENTIAL (N=1510)
EXTREMELY DISSATISFIED DISSATISFIED SATISFIED VERY SATISFIED EXTREMELY SATISFIED
% VERY SATISFIED OR EXTREMELY SATISIFED
TOTAL Sport Z Sport X Sport W Sport Y
51% 52% 45% 54% 53%
50% 50% 44% 52% 52%
49% 53% 41% 46% 55%
Base: Those who gave a rating for fulfilling potential, excluding don't know/ can't say and not applicable Q16. How satisfied are you with your <insert sport> club on the following?
Around half of players are satisfied with how well their club meets their personal sporting needs and goals. Those who have represented their club at a regional event/ competition are significantly more likely to be more satisfied across all of the attributes.
Significantly higher/lower than total

Co
pyr
igh
t ©
2012
Th
e N
iels
en C
om
pan
y. C
on
fid
enti
al a
nd
pro
pri
etar
y.
48
HOW CAN CLUBS HELP PLAYERS FULFIL THEIR POTENTIAL?Around one in ten players are dissatisfied with their club aiding them in meeting their personal sporting needs or goals.
Providing better coaches and training was mentioned by 36% of players. This includes clubs providing coaching clinics and having fewer players in a session.
Base: Those who are dissatisfied with their club helping to fulfil their potential ,excluding don't know/none/nothing/everything all good (n=195)Q17. What would you need from your club to be more satisfied with the aspects rated extremely dissatisfied or dissatisfied above?
36%
23%
17%
13%
11%
9%
6%
5%
5%
5%
5%
4%
9%
PROVIDE BETTER/ MORE COACHES/ TRAINING/ COACHING/ BETTER COACHING PROGRAMMES
MORE FAIRNESS/EQUAL OPPORTUNITIES - TEAM SELECTION/ ACCESS TO BEST COURTS/GREENS/TRAINING GEAR
PLAYING OPPORTUNITIES/COMPETITIONS THAT FIT NEEDS OF MEMBERS
BETTER/MORE COMMUNICATION/INFORMATION
BETTER/MORE FACILITIES/EQUIPMENT
BETTER/MORE ATMOSPHERE ENCOURAGEMENT/FRIENDLINESS/HELPFULNESS/SUPPORT
BETTER CLUB MANAGEMENT/COMMITTEE
MORE FUNDS/FINANCIAL SUPPORT
BE MORE TRANSPARENT/OPEN
MORE COMPETITIVE PLAY/ATTRACT HIGH LEVEL/BETTER SKILLED PLAYERS
BETTER/MORE PLAYING SURFACES
NEED MORE MEMBERS/MORE MID-WEEK PLAYERS/NEED TO RETAIN MEMBERS
OTHER

Co
pyr
igh
t ©
2012
Th
e N
iels
en C
om
pan
y. C
on
fid
enti
al a
nd
pro
pri
etar
y.
49
FULFILLING PLAYERS POTENTIAL (BY NSO)Sp
ort
ZSp
ort
XSp
ort
WSp
ort
Y
45%
27%
23%
PROVIDE BETTER/ MORE COACHES/ COACHING
BETTER/ MORE COMMUNICATION/ INFORMATION
BETTER/ MORE FACILITIES/ EQUIPMENT
31%
25%
23%
FAIRNESS/EQUAL OPPORTUNITIES -TEAM SELECTION/ ACCESS TO
FACILITIES
PLAYING OPPORTUNITIES THAT FIT NEEDS OF MEMBERS
PROVIDE BETTER/ MORE COACHES/ COACHING
45%
26%
16%
PROVIDE BETTER/ MORE COACHES/ COACHING
FAIRNESS/EQUAL OPPORTUNITIES -TEAM SELECTION/ ACCESS TO
FACILITES
PLAYING OPPORTUNITIES THAT FIT NEEDS OF MEMBERS
27%
23%
23%
PLAYING OPPORTUNITIES THAT FIT NEEDS OF MEMBERS
PROVIDE BETTER/ MORE COACHES/ COACHING
FAIRNESS/EQUAL OPPORTUNITIES -TEAM SELECTION/ ACCESS TO
FACILITES
Better balance of player skills. This would also assist new players to improve their playing ability. At most team events you will find the top players playing together. Lesser skilled
players have little chance of enjoying the event.
The club does not provide the environment or seek the information to enable individuals to systematically grow their game. The clubs main focus is "social" for its ageing membership.
Allowing female Sport Xers to get the same respect, opportunities and attention as men. Tend to be forgotten about and not seen as important in comparison to the male teams therefore get second rate training facilities that
do not allow players to truly fulfil their potential individually and as a team
Put more emphasis on the teams that want to learn, Have coaching sessions once a week for (specialist role) other than just the usual team training.
The people who are in place at the club are passionate to their players but tend to have very little support from the outside of the club. Giving them the tools to work with is just too hard.
Gym, more strict on smoking around premises, more information for technique and better ways to workout and what sort of exercise, stretches works best for players what sort of diet that players need
to work on to be at full potential posted at gym. Promote healthy living and ways to do it.
They put a lot of effort into juniors which is fine but probably 70% of the paying members are over 30 I’d say. The rep teams are not fairly selected. They don't run meetings or selections using any form of democracy . Most
decisions are made my one very narrow minded individual
Being able to play other players of a similar or better level on a frequent basis. The better players don't want to be associated with players of less ability.
Co
pyr
igh
t ©
2012
Th
e N
iels
en C
om
pan
y. C
on
fid
enti
al a
nd
pro
pri
etar
y.
50
FULFILLING POTENTIAL
Base: Those who gave a rating for fulfilling potential, excluding don't know/ can't say and not applicable Q16. How satisfied are you with your <insert sport> club on the following?
SUBGROUP DIFFERENCESThose significantly more likely to be satisfied are:• Club presidents /office holders (62%)• Players who have been selected to represent
their club at a regional event/ competition (61%) or to represent their region at a national event/ competition (61%)
Those significantly less likely to be satisfied are:• Living in Auckland (46%)
While those significantly more likely to be dissatisfied compared with the total of 10% are:• Players who have been members of their
current club for 3-5 years (14%)
51% of players are satisfied with their club providing opportunities for them to challenge themselves.
SUBGROUP DIFFERENCESThose significantly more likely to be satisfied are:• In the Secondary segment (66%)• Living in Bay of Plenty (62%)• Players who have been selected to represent
their club at a regional event/ competition (58%)
• Players who have been members of their current club for more than 6 years (53%)
While those significantly more likely to be dissatisfied compared with the total of 10% are:• In the Tertiary segment (21%).
50% of players are satisfied with their club supporting them to achieve their goals.
SUBGROUP DIFFERENCESThose significantly more likely to be satisfied are:• Living in Hawke’s Bay (67%)• Club presidents /office holders (59%)• Players who have been selected to represent
their club at a regional event/ competition (54%) • Players who have been members of their current
club for more than 10 years (54%)
Those significantly less likely to be satisfied are:• Those living in Auckland (44%)
While those significantly more likely to be dissatisfied compared with the total of 12% are:• In the Tertiary segment (25%)• Players who have been members of their current
club for 3-5 years (15%)
Sport Z and Sport Y players are more likely to be satisfied compared with the total of 49%, with their club providing resources and opportunities for players to fulfil potential
Significantly higher/lower than total
OPPORTUNITIES TO CHALLENGE SUPPORTING PLAYERS TO ACHIEVE THEIR GOALS
PROVIDING RESOURCES AND OPPORTUNITIES
51% 52%45%
54% 53%
TOTAL (N=1511)
BOWLS (N=477)
FOOTBALL (N=187)
RUGBY LEAGUE (N=160)
TENNIS (N=687)
50% 50%44%
52% 52%
TOTAL (N=1475)
BOWLS (N=468)
FOOTBALL (N=187)
RUGBY LEAGUE (N=159)
TENNIS (N=661)
49% 53% 41%
46%55%
TOTAL (N=1510)
BOWLS (N=478)
FOOTBALL (N=187)
RUGBY LEAGUE (N=161)
TENNIS (N=684)
SPORT Z SPORT X SPORT W SPORT YSPORT Z SPORT X SPORT W SPORT Y SPORT Z SPORT X SPORT W SPORT Y

Co
pyr
igh
t ©
2012
Th
e N
iels
en C
om
pan
y. C
on
fid
enti
al a
nd
pro
pri
etar
y.
51
GREAT COMMUNICATION
6%
8%
8%
10%
41%
40%
41%
39%
31%
31%
30%
31%
20%
20%
20%
18%
COMMUNICATIONS ARE RELEVANT TO ME (N=1621)
COMMUNICATIONS ARE TIMELY (N=1629)
COMMUNICATIONS ARE ACCESSIBLE I.E. THEY USE A
VARIETY OF MEDIUMS (N=1622)
BEING RESPONSIVE TO FEEDBACK (N=1506)
EXTREMELY DISSATISFIED DISSATISFIED SATISFIED VERY SATISFIED EXTREMELY SATISFIED
% VERY SATISFIED OR EXTREMELY SATISIFED
TOTAL Sport Z Sport X Sport W Sport Y
51% 54% 46% 49% 56%
51% 54% 43% 47% 57%
50% 54% 44% 47% 55%
49% 48% 44% 51% 53%
Base: Those who gave a rating for club communications excluding don't know/ can't say and not applicable Q14. How satisfied are you with your <insert sport> club on the following?
Significantly higher/lower than total
Sport Y players are more likely to be satisfied with their club communications in terms of relevancy, timeliness responsiveness and the accessibility, compared to half of all players.

Co
pyr
igh
t ©
2012
Th
e N
iels
en C
om
pan
y. C
on
fid
enti
al a
nd
pro
pri
etar
y.
52
COMMUNICATIONS
SUBGROUP DIFFERENCESThose significantly more likely to be satisfied are:• Living in Otago (69%)• Committee members or Club presidents/office holders (both 64%)• Players who have been members for 1-2 years (58%).
Those significantly more likely to be dissatisfied compared with 13% of total are:• Managers (24%) or coaches (20%)• Living in Waikato (22%).
COMMUNICATIONS ARE RELEVANT51% of players are satisfied with the communications being relevant to them.
RESPONSIVE TO FEEDBACK
49% of players are satisfied with their club being responsive to feedback
SUBGROUP DIFFERENCESThose significantly more likely to be satisfied are:• Committee members (69%) or club presidents/office holders (65%)• Living in Otago (67%) or Bay of Plenty (63%)• Players who have been selected to represent their club at a regional
event/competition (57%)• Young retirees (57%).
Significantly higher/lower than totalBase: Those who gave a rating for club communications excluding don't know/ can't say and not applicable Q14. How satisfied are you with your <insert sport> club on the following?
COMMUNICATIONS ARE TIMELYCompared with the total of 51%, Sport X players are less likely to be satisfied with communications being timely.
SUBGROUP DIFFERENCESThose significantly more likely to be satisfied are:• Living in Bay of Plenty (64%) or Otago (60%)• Committee members (63%) or Club presidents/office holders (60%)• Players who have been members of their current club for 1-2 years (59%)• Young retirees (58%).
Those significantly more likely to be dissatisfied compared with 10% of total are:• Tertiary (22%)• Living in Waikato (18%).
COMMUNICATIONS ARE ACCESSIBLESport Y and Sport Z players are more likely to be satisfied with communications being accessible.
SUBGROUP DIFFERENCESThose significantly more likely to be satisfied are:• Living in Bay of Plenty (64%) or Otago (63%)• Committee members (63%) or Club presidents/office holders (62%)• Young retirees (57%).
Those significantly more likely to be dissatisfied compared with 9% of total are:
• Tertiary (21%).
51% 54%46% 49% 56%
TOTAL (N=1621)
BOWLS (N=493)
FOOTBALL (N=204)
RUGBY LEAGUE (N=162)
TENNIS (N=762)
51% 54%
43%
47%57%
TOTAL (N=1629)
BOWLS (N=498)
FOOTBALL (N=206)
RUGBY LEAGUE (N=161)
TENNIS (N=764)
49% 48% 44% 51% 53%
TOTAL (N=1506)
BOWLS (N=483)
FOOTBALL (N=195)
RUGBY LEAGUE (N=162)
TENNIS (N=666)
50% 54%
44% 47%55%
TOTAL (N=1622)
BOWLS (N=494)
FOOTBALL (N=211)
RUGBY LEAGUE (N=163)
TENNIS (N=754)
SPORT Z
SPORT X
SPORT W
SPORT Y
SPORT Z
SPORT X
SPORT W
SPORT Y
SPORT Z
SPORT X
SPORT W
SPORT Y
SPORT Z
SPORT X
SPORT W
SPORT Y

Co
pyr
igh
t ©
2012
Th
e N
iels
en C
om
pan
y. C
on
fid
enti
al a
nd
pro
pri
etar
y.
53
PREFERRED METHOD OF COMMUNICATION
46%
34%
9%
3%
1%
1%
6%
Base: All Respondents (n=1662)Q15. What is your preferred method of communication for notifying you of a change in situation (e.g. change of venue, time etc)?
TEXT MESSAGE
MESSAGE ON WEBSITE
0800 # TO CALL
RADIO
OTHER
Nearly half (46%) of players would prefer to be notified via text message about a change in situation (e.g. change of venue, time etc).
SUBGROUP DIFFERENCES
Those significantly more likely to prefer to be notified via text message are:
• Living in Waikato (62%) or Auckland (50%)• Players who have been selected to represent their
region at a national event/ competition (58%)• Those who have been members of their current club
for less than 5 years (52%)
Those significantly more likely to prefer to be notified via email are:
• Living in Hawke’s Bay (61%) or Bay of Plenty (45%)• Players who have been members of their current club
for more than 10 years (39%)

Co
pyr
igh
t ©
2012
Th
e N
iels
en C
om
pan
y. C
on
fid
enti
al a
nd
pro
pri
etar
y.
54
PROFESSIONAL AND WELL MANAGED
7%
6%
5%
9%
8%
10%
8%
12%
15%
27%
30%
33%
33%
34%
37%
40%
36%
40%
34%
32%
33%
32%
30%
30%
31%
29%
25%
32%
30%
29%
24%
25%
22%
19%
20%
17%
FOSTERING A SENSE OF PRIDE IN OUR CLUB (N=1605)
HAVING A POSITIVE CULTURE (N=1614)
BEING AN ORGANISATION THAT YOU CAN TRUST (N=1609)
BEING WELL MANAGED AND ORGANISED (N=1630)
BEING TRANSPARENT ABOUT FINANCES (N=1476)
ENGAGING WITH THE LOCAL COMMUNITY (N=1464)
BEING RESPONSIVE TO YOUR NEEDS AND REQUIREMENTS (N=1593)
BEING TRANSPARENT ABOUT TEAM SELECTION (N=1397)
HAVING QUALIFIED OFFICIALS AVAILABLE WHEN I COMPETE (N=1189)
EXTREMELY DISSATISFIED DISSATISFIED SATISFIED VERY SATISFIED EXTREMELY SATISFIED
% VERY SATISFIED OR EXTREMELY SATISIFED
TOTAL Sport Z Sport X Sport W Sport Y
65% 65% 62% 74% 60%
63% 59% 56% 69% 66%
61% 64% 56% 58% 66%
56% 61% 46% 54% 63%
55% 67% 41% 51% 60%
51% 57% 47% 51% 50%
50% 53% 41% 51% 55%
49% 51% 46% 52% 46%
42% 55% 28% 43% 43%
Base: Those who gave a rating for how they club is run, excluding don’t know/can’t say and not applicableQ18. How satisfied are you with your <insert sport> club on the following?
A club being professional and well managed is a key driver in a players likelihood to recommend their club. In terms of the way a club is run, players are most satisfied with the club culture – more specifically their club fostering a sense of pride (65% satisfied) and having a positive culture (63% satisfied).
Significantly higher/lower than total

Co
pyr
igh
t ©
2012
Th
e N
iels
en C
om
pan
y. C
on
fid
enti
al a
nd
pro
pri
etar
y.
55
PROFESSIONAL AND WELL MANAGED
Significantly higher/lower than total
FOSTERING A SENSE OF PRIDE
65% of players are satisfied with their club fostering a sense of pride, with Sport W players more likely to rate their club positively for this attribute.
SUBGROUP DIFFERENCESThose significantly more likely to be satisfied are:• Club presidents/office holders (77%) or
committee members (74%) • Players who have been selected to represent
their club at a regional event/competition (74%).
Those significantly more likely to be dissatisfied compared with 7% of total are:• Living in Waikato (14%)• Coaches (13%).
POSITIVE CULTURE
Six in ten (63%) are satisfied with the club having a positive culture. Sport X players are less likely to be satisfied with the culture at their club.
SUBGROUP DIFFERENCESThose significantly more likely to be satisfied are:• Living in Otago (77%)• Club presidents/office holders (74%) or
committee members (73%) • Players who have been selected to represent
their club at a regional event/competition (70%)
• Young families (69%)• Players who have been injured in the last 12
months (67%).
Those significantly more likely to be dissatisfied compared with 8% of total are:• Managers (16%) or Coaches (14%) • Older adults (11%).
BEING AN ORGANISATION PLAYERS CAN TRUST
Compared with 61% of total, Sport Y players are more likely to view their club as a trusted organisation.
SUBGROUP DIFFERENCESThose significantly more likely to be satisfied are:• Living in Otago (74%)• Committee members (81%) or club
presidents/office holders (77%)• Players who have been selected to represent
their club at a regional event/competition (70%)
• Players who have been members of their current club for more than 10 years (66%).
Those significantly more likely to be dissatisfied compared with 6% of total are:• Tertiary (15%)• Those who have played for the top team at
their club (9%)
65% 65% 62%74%
60%
TOTAL (N=1605)
BOWLS (N=495)
FOOTBALL (N=208)
RUGBY LEAGUE (N=167)
TENNIS (N=735)
63% 59% 56%
69% 66%
TOTAL (N=1614)
BOWLS (N=491)
FOOTBALL (N=212)
RUGBY LEAGUE (N=165)
TENNIS (N=746)
61% 64%56% 58%
66%
TOTAL (N=1609)
BOWLS (N=493)
FOOTBALL (N=208)
RUGBY LEAGUE (N=164)
TENNIS (N=744)
SPORT Z SPORT X SPORT W SPORT YSPORT Z SPORT X SPORT W SPORT Y SPORT Z SPORT X SPORT W SPORT Y

Co
pyr
igh
t ©
2012
Th
e N
iels
en C
om
pan
y. C
on
fid
enti
al a
nd
pro
pri
etar
y.
56
PROFESSIONAL AND WELL MANAGED
Significantly higher/lower than total
WELL MANAGED AND ORGANISED
Compared with 56% of total, Sport X players are less likely to be satisfied with the organisation and management of their club.
SUBGROUP DIFFERENCESThose significantly more likely to be satisfied are:• Club presidents/office holders (67%) or
committee members (62%)• Young retirees (61%).
Those significantly more likely to be dissatisfied are:• Living in Waikato (19% compared with 11% of
total).
BEING TRANSPARENT ABOUT FINANCES
55% are satisfied with the transparency around club finances. However 10% of players are unable to rate their club on this attribute.
SUBGROUP DIFFERENCESThose significantly more likely to be satisfied are:• Club presidents/office holders (77%), committee
members (62%) or official/judges (69%) • Players who have been selected to represent
their club at a regional event/competition (66%) and/or have played for the top team at their club (61%)
• Retirees (Older, 64% and Young, 63%)• Those who have been members of their current
club for more than 10 years (60%).
Those significantly more likely to be dissatisfied compared with 11% of total are:• Young adults (20%)• Coaches (19%).
ENGAGING WITH THE LOCAL COMMUNITY
Sport Z players are more likely to be satisfied with the way their club engages with the local community (57% compared with 51% of total).
SUBGROUP DIFFERENCESThose significantly more likely to be satisfied are:• Club presidents/office holders (61%)• Those who have been members of their current
club for more than 10 years (56%)
Those significantly more likely to be dissatisfied compared with 11% total are:• Young adults (19%)• Those who have played for the top team at their
club (15%).
56% 61%
46%
54%63%
TOTAL (N=1630)
BOWLS (N=496)
FOOTBALL (N=215)
RUGBY LEAGUE (N=165)
TENNIS (N=754)
55%67% 41%
51%60%
TOTAL (N=1476)
BOWLS (N=484)
FOOTBALL (N=186)
RUGBY LEAGUE (N=153)
TENNIS (N=653)
51% 57%
47% 51% 50%
TOTAL (N=1464)
BOWLS (N=476)
FOOTBALL (N=195)
RUGBY LEAGUE (N=158)
TENNIS (N=635)
SPORT Z SPORT X SPORT W SPORT YSPORT Z SPORT X SPORT W SPORT Y SPORT Z SPORT X SPORT W SPORT Y

Co
pyr
igh
t ©
2012
Th
e N
iels
en C
om
pan
y. C
on
fid
enti
al a
nd
pro
pri
etar
y.
57
PROFESSIONAL AND WELL MANAGED
Significantly higher/lower than total
RESPONSIVENESSAround half of Sport Z, Sport W and Sport Y players are satisfied with their club being responsive to their needs and requirements. In contrast Sport X players are less likely to be satisfied with the responsiveness of their club.
SUBGROUP DIFFERENCESThose significantly more likely to be satisfied are:• Living in Otago (64%)• Club presidents/office holders or committee
members (both 61%) • Players who have been selected to represent
their club at a regional event/competition (58%)• Young adults (55%).
Those significantly more likely to be dissatisfied are:• Living in Wellington (16% compared with 10% of
total).
BEING TRANSPARENT ABOUT TEAM SELECTION
49% are satisfied with their club being transparent about team selection. Sport Y players are less likely to be satisfied with the transparency of team selection.
SUBGROUP DIFFERENCESThose significantly more likely to be satisfied are:• Living in Otago (69%)• Club presidents/office holders (65%) or
committee members (57%) • Players who have played for the top team at their
club (56%).
Those significantly more likely to be dissatisfied are:• Young adults (24% compared with 15% of total)• Those who have been members of their current
club for less than 1 year (23%)• Living in Auckland (19%).
HAVING QUALIFIED OFFICIAL AVAILABLE
One in five (18%) of players are dissatisfied with the availability of qualified officials when they compete.Sport Z players are more likely to be satisfied with the availability, while only 28% of Sport X players are satisfied.
SUBGROUP DIFFERENCESThose significantly more likely to be satisfied are:• Young retirees (56%)• Players who have been selected to represent
their club at a regional event/competition or to represent their region at a national event/competition (both 54%)
• Club presidents/office holders (51%)
Those significantly more likely to be dissatisfied compared with 18% total are:• Living in Waikato (34%)• Young adults (26%).
50% 53%41%
51% 55%
TOTAL (N=1593)
BOWLS (N=491)
FOOTBALL (N=209)
RUGBY LEAGUE (N=162)
TENNIS (N=731)
49% 51% 46% 52% 46%
TOTAL (N=1397)
BOWLS (N=484)
FOOTBALL (N=188)
RUGBY LEAGUE (N=161)
TENNIS (N=564)
42%55% 28%
43% 43%
TOTAL (N=1189)
BOWLS (N=473)
FOOTBALL (N=198)
RUGBY LEAGUE (N=161)
TENNIS (N=357)
SPORT Z SPORT X SPORT W SPORT YSPORT Z SPORT X SPORT W SPORT Y SPORT Z SPORT X SPORT W SPORT Y

Co
pyr
igh
t ©
2012
Th
e N
iels
en C
om
pan
y. C
on
fid
enti
al a
nd
pro
pri
etar
y.
58
FRIENDLY AND WELCOMINGThree quarters (74%) of players are satisfied their club is being friendly and welcoming. Satisfaction is lower for the attribute being inclusive to all members in the club.
4%
4%
8%
25%
24%
27%
36%
34%
33%
35%
37%
31%
ENCOURAGING GOOD SPORTSMANSHIP AND FAIR
PLAY (N=1624)
BEING WELCOMING TO ALL MEMBERS (N=1645)
BEING INCLUSIVE TO ALL MEMBERS IN THE CLUB
(N=1629)
EXTREMELY DISSATISFIED DISSATISFIED SATISFIED VERY SATISFIED EXTREMELY SATISFIED
% VERY SATISFIED OR EXTREMELY SATISIFED
TOTAL Sport Z Sport X Sport W Sport Y
71% 71% 64% 75% 73%
71% 72% 65% 73% 74%
64% 65% 58% 64% 69%
Base: Those who gave a rating for friendly and welcoming, excluding don't know/ can't say and not applicable Q11. How satisfied are you with your <insert sport> club on the following? Significantly higher/lower than total

Co
pyr
igh
t ©
2012
Th
e N
iels
en C
om
pan
y. C
on
fid
enti
al a
nd
pro
pri
etar
y.
59
FRIENDLY AND WELCOMING
Significantly higher/lower than total
GOOD SPORTMANSHIP AND FAIRPLAY
71% of players are satisfied with their club encouraging good sportsmanship and fair play.
SUBGROUP DIFFERENCESThose significantly more likely to be satisfied are:
• Club presidents/office holders (87%), official/judges (86%) or committee members (84%)
• Living in Otago (80%)• Players who have been selected to represent
their club at a regional event/competition (78%) and/or have played for the top team at their club (75%).
• Those who have been members of their current club for more than 6 years (73%)
BEING WELCOMING TO ALL MEMBERS
Seven in ten (71%) are satisfied with their club being welcoming to all members.
SUBGROUP DIFFERENCESThose significantly more likely to be satisfied are:
• Official/judges (87%), club presidents/office holders (85%) or committee members (81%)
• Living in Otago (80%)• Players who have been selected to represent
their club at a regional event/competition (77%) and/or have played for the top team at their club (76%).
BEING INCLUSIVE TO ALL MEMBERS IN THE CLUBSport Y players are more likely to be satisfied with the their club being inclusive to all members. In contrast Sport X players are more likely to be dissatisfied with the inclusiveness of their club (14% cf. 9% total).
SUBGROUP DIFFERENCESThose significantly more likely to be satisfied are:
• Club presidents/office holders (78%) or committee members (77%)
• Older families (75%)• Living in Otago (74%)• Players who have been selected to represent
their club at a regional event/competition (70%) and/or have played for the top team at their club (69%).
Club presidents / other office holders and committee members are more likely to be satisfied across all aspects of their club being friendly and welcoming.
71% 71% 64%75% 73%
TOTAL (N=1624)
BOWLS (N=496)
FOOTBALL (N=214)
RUGBY LEAGUE (N=165)
TENNIS (N=749)
71% 72% 65%73% 74%
TOTAL (N=1645)
BOWLS (N=497)
FOOTBALL (N=213)
RUGBY LEAGUE (N=165)
TENNIS (N=770)
64% 65% 58% 64% 69%
TOTAL (N=1629)
BOWLS (N=495)
FOOTBALL (N=212)
RUGBY LEAGUE (N=166)
TENNIS (N=756)
SPORT Z SPORT X SPORT W SPORT YSPORT Z SPORT X SPORT W SPORT Y SPORT Z SPORT X SPORT W SPORT Y

Co
pyr
igh
t ©
2012
Th
e N
iels
en C
om
pan
y. C
on
fid
enti
al a
nd
pro
pri
etar
y.
60
FACILITIESLevels of satisfaction with the facilities at Sport Z and Sport Y clubs are higher across all attributes. Having clean and well maintained facilities is the main driver of satisfaction with club facilities overall.
5%
9%
9%
8%
35%
34%
34%
34%
32%
30%
31%
29%
26%
26%
24%
26%
THE EASE OF ACCESSING VENUES/ FIELDS/ COURTS FOR TRAINING OR CASUAL PLAYING
(N=1633)
CLEAN AND WELL MAINTAINED FACILITIES E.G. CLUBROOMS, CHANGING ROOMS, TOILETS
(N=1639)
FIT FOR PURPOSES TRAINING VENUES/ FIELDS/ COURTS
(N=1616)
WELL MAINTAINED PLAYING VENUES/ FIELDS/ COURTS
(N=1649)
EXTREMELY DISSATISFIED DISSATISFIED SATISFIED VERY SATISFIED EXTREMELY SATISFIED
% VERY SATISFIED OR EXTREMELY SATISIFED
TOTAL Sport Z Sport X Sport W Sport Y
58% 74% 43% 48% 68%
56% 74% 44% 44% 61%
55% 73% 35% 45% 66%
55% 64% 36% 43% 64%
Base: Those who gave a rating for club facilities excluding don't know/ can't say and not applicable Q12. How satisfied are you with your <insert sport> club on the following? Significantly higher/lower than total

Co
pyr
igh
t ©
2012
Th
e N
iels
en C
om
pan
y. C
on
fid
enti
al a
nd
pro
pri
etar
y.
61
FACILITIES
SUBGROUP DIFFERENCESThose significantly more likely to be satisfied are:• Living in Hawke’s Bay (73%) and Otago (66%)• Retirees (Older,69% and Young, 72%) and older adults (62%)• Club presidents/office holders (69%) or committee members (62%)• Those who have been members of their current club for more than 10 years (60%)
Those significantly more likely to be dissatisfied compared to the total of 11% are:• Tertiary (27%), young adults (20%) and young families (16%)• Living in Waikato (27%)• Coaches (24%)• Those who have played for the top team at their club (15%).
FIT FOR PURPOSES TRAINING VENUES
55% of players are satisfied with their club having fit for purposes training venues.
Significantly higher/lower than total
WELL MAINTAINED PLAYING VENUES
Eight in ten (77%) Sport Z players are satisfied with the playing venues, while only 36% of Sport X players are satisfied with their playing venues.
SUBGROUP DIFFERENCESThose significantly more likely to be satisfied are:• Retirees (Older and Young, both 75%) and older adults (62%)• Club presidents/office holders (68%) or committee members (62%)• Living in Canterbury (65%) and Otago (64%)• Players who have been selected to represent their club at a regional event/
competition (62%)• Those who have been members of their current club for more than 6 years (61%).
Those significantly more likely to be dissatisfied compared to the total of 11% are:• Tertiary (30%)• Living in Waikato (24%).
ACCESSING FACILITIES FOR TRAINING/CASUAL PLAYING
Six in ten (58%) of players are satisfied with the ease of accessing facilities for training or casual playing.
CLEAN AND WELL MAINTAINED FACILITIES
56% are satisfied with facilities being clean and well maintained.
SUBGROUP DIFFERENCESThose significantly more likely to be satisfied are:• Living in Bay of Plenty (71%)• Retirees (Older and Young, both 70%) and older adults (61%)• Club presidents/office holders (69%) or committee members (63%)• Players who have been selected to represent their club at a regional event/
competition (62%)• Those who have been members of their current club for more than 10 years (61%).
Those significantly more likely to be dissatisfied compared to the total of 10% are:• Young adults (22%)• Living in Waikato (18%)• Coaches (18%).
SUBGROUP DIFFERENCESThose significantly more likely to be satisfied are:• Retirees (Young, 74% and Older, 70%)• Club presidents/office holders (72%) or committee members (70%)• Living in Canterbury (71%) and Otago (70%)• Players who have been selected to represent their club at a regional event/
competition (65%)• Those who have been members of their current club for more than 6 years
(61%).
Those significantly more likely to be dissatisfied compared to the total of 6% are:• Older families (11%) and Young families (10%).
58%74% 43%
48%
68%
TOTAL (N=1633)
BOWLS (N=493)
FOOTBALL (N=214)
RUGBY LEAGUE (N=162)
TENNIS (N=764)
56%74% 44%
44%
61%
TOTAL (N=1639)
BOWLS (N=498)
FOOTBALL (N=212)
RUGBY LEAGUE (N=161)
TENNIS (N=768)
55%73% 35%
45%
66%
TOTAL (N=1616)
BOWLS (N=486)
FOOTBALL (N=214)
RUGBY LEAGUE (N=161)
TENNIS (N=755)
55%
77% 36%
43%
64%
TOTAL (N=1649)
BOWLS (N=497)
FOOTBALL (N=213)
RUGBY LEAGUE (N=166)
TENNIS (N=773)
SPORT Z
SPORT X
SPORT W
SPORT Y
SPORT Z
SPORT X
SPORT W
SPORT Y
SPORT Z
SPORT X
SPORT W
SPORT Y
SPORT Z
SPORT X
SPORT W
SPORT Y

Co
pyr
igh
t ©
2012
Th
e N
iels
en C
om
pan
y. C
on
fid
enti
al a
nd
pro
pri
etar
y.
62
GREAT COACHES
14%
12%
13%
14%
32%
34%
34%
35%
27%
27%
26%
25%
25%
25%
25%
24%
HAVING COACHES WITH THE RIGHT TECHNICAL EXPERTISE
(N=1299)
HAVING COACHES WITH GOOD PEOPLE MANAGEMENT SKILLS
(N=1311)
HAVING COACHES WHICH SUIT THE SKILL LEVEL OF THE PLAYERS
(N=1307)
HAVING COACHES THAT SUIT ME (N=1220)
EXTREMELY DISSATISFIED DISSATISFIED SATISFIED VERY SATISFIED EXTREMELY SATISFIED
% VERY SATISFIED OR EXTREMELY SATISIFED
TOTAL Sport Z Sport X Sport W Sport Y
52% 43% 41% 57% 68%
52% 44% 46% 55% 65%
51% 43% 42% 55% 65%
49% 41% 41% 55% 61%
Base: Those who gave a rating for club coaches excluding don't know/ can't say and not applicable Q13. How satisfied are you with your <insert sport> club on the following? Significantly higher/lower than total
Levels of satisfaction are significantly lower across all attributes for Sport Z players. While Sport Y players are more satisfied with their coaches, they are also more likely to indicate that they do not have a coach (8% not applicable).

Co
pyr
igh
t ©
2012
Th
e N
iels
en C
om
pan
y. C
on
fid
enti
al a
nd
pro
pri
etar
y.
63
GREAT COACHES
SUBGROUP DIFFERENCESThose significantly more likely to be satisfied are:• Living in Hawke’s Bay (69%)• Secondary (65%)• Players who have been members for 1-2 years (67%).
Those significantly more likely to be dissatisfied compared with 15% of total are:• Living in Waikato (29%)• Tertiary (27%) or young adults (23%).
COACHES WITH THE RIGHT TECHNICAL EXPERTISE52% of players are satisfied with their club have coaches with the right technical expertise.
SKILL LEVEL TO SUIT PLAYERS
Half (51%) of players are satisfied with their club having coaches which suit the skill level of players.
SUBGROUP DIFFERENCESThose significantly more likely to be satisfied are:• Secondary (68%)• Players who have been members of their current club for 1-2 years (67%).• Living in Canterbury (63%).
Those significantly more likely to be dissatisfied compared with 16% of total are:• Tertiary (37%) and Young adults (25%).• Living in Waikato (33%)• Those who have played for the top team at their club (20%).
Significantly higher/lower than total
COACHES WITH GOOD PEOPLE MANAGEMENT SKILLSCompared with the total of 52%, Sport Z players are less likely to be satisfied with coaches having good people management skills.
SUBGROUP DIFFERENCESThose significantly more likely to be satisfied are:• Secondary (72%)• Players who have been members of their current club for 1-2 years (63%)• Living in Canterbury (63%).
Those significantly more likely to be dissatisfied compared with 14% of total are:• Tertiary (29%)• Living in Waikato (23%)• Those who have played for the top team at their club (18%).
HAVING COACHES THAT SUIT PLAYERSSport Z and Sport X players are less likely to be satisfied with having coaches that suit them.
SUBGROUP DIFFERENCESThose significantly more likely to be satisfied are:• Secondary (66%)• Players who have been members of their current club for 1-2 years (63%).
Those significantly more likely to be dissatisfied compared with 16% of total are:
• Tertiary (29%).
Players in the Secondary segment are more likely to be satisfied with their club having coaches with the right technical expertise, appropriate skills (people management and skill level) and that suit them.
52% 43%
41%
57%68%
TOTAL (N=1299)
BOWLS (N=410)
FOOTBALL (N=182)
RUGBY LEAGUE (N=161)
TENNIS (N=546)
52% 44%
46%55%
65%
TOTAL (N=1311)
BOWLS (N=413)
FOOTBALL (N=184)
RUGBY LEAGUE (N=163)
TENNIS (N=551)
51% 43%
42%
55%65%
TOTAL (N=1307)
BOWLS (N=412)
FOOTBALL (N=186)
RUGBY LEAGUE (N=160)
TENNIS (N=549)
49% 41%
41%
55% 61%
TOTAL (N=1220)
BOWLS (N=394)
FOOTBALL (N=173)
RUGBY LEAGUE (N=160)
TENNIS (N=493)
SPORT Z
SPORT X
SPORT W
SPORT Y
SPORT Z
SPORT X
SPORT W
SPORT Y
SPORT Z
SPORT X
SPORT W
SPORT Y
SPORT Z
SPORT X
SPORT W
SPORT Y

Co
pyr
igh
t ©
2012
Th
e N
iels
en C
om
pan
y. C
on
fid
enti
al a
nd
pro
pri
etar
y.
64
PERCEIVED VALUE FOR MONEY
4%
7%
21%
40%
29%
STRONGLY DISAGREE DISAGREE
SOMEWHAT AGREE AGREE
STRONGLY AGREE
69% of players
agree that the opportunities, services and benefits they
receive are worth the money they
pay
SUBGROUP DIFFERENCES
Those significantly more likely to agree that they receive value for money are:
• Club presidents/office holders (86%) or committee members (81%) • Living in Hawke’s Bay (86%), Bay of Plenty (80%) or Otago (78%)• Players who have been selected to represent their club at a regional event/ competition
(77%)• Retirees (Older, 84% and Young, 80%).
While those significantly less likely to agree that they receive value for money are:
• Living in Waikato (57%)• Tertiary (55%) or Young adults (57%).
Base: All Respondents excluding don't know/ can't say (n=1646) Q6. To what extent do you agree or disagree with the following: The opportunities, services and benefits that you receive from your club make it well worth the money you pay. Significantly higher/lower than total
80%
49%
68%79%
BOWLS (N=495) FOOTBALL (N=213)
RUGBY LEAGUE (N=163)
TENNIS (N=775)
PERCEIVED VALUE (BY NSO)
SPORT Z and SPORT Y players are significantly more likely to perceive that they receive value for money (80% and 79%).
SPORT X players on the other hand are significantly less likely to agree that the opportunities and benefits they receive are worth the money (49%).
SPORT Z SPORT X SPORT W SPORT Y

NEW MEMBERS

Co
pyr
igh
t ©
2012
Th
e N
iels
en C
om
pan
y. C
on
fid
enti
al a
nd
pro
pri
etar
y.
66
NEW MEMBERS
3%
3%
10%
11%
41%
47%
43%
49%
25%
18%
17%
19%
31%
30%
27%
20%
EASE OF THE JOINING PROCESS (N=133)
PROVIDING INFORMATION ON HOW TO JOIN (N=131)
INTRODUCING YOU TO KEY PEOPLE AT THE CLUB E.G.
COACHES, ADMIN STAFF ETC (N=129)
EXPLAINING PROTOCOLS, HOW TO PLAY, USE FACILITIES,
LOCATION VENUES, SELECTION, HOW IT WORKS ETC (N=128)
EXTREMELY DISSATISFIED DISSATISFIED SATISFIED VERY SATISFIED EXTREMELY SATISFIED
% VERY SATISFIED OR EXTREMELY SATISIFED
TOTAL Sport Z Sport X Sport W Sport Y
56% 60% 45% 62% 59%
48% 50% 30% 57% 53%
44% 60%* 29% 48% 50%
39% 36%* 19%* 52%* 44%
Base: New Members (Those who have been a member of their current club for less than one year), excluding don’t know/can’t sayQ24. How satisfied are you with your <insert sport> club on the following?
9% of players have been members of their current club for less than a year. Over half (56%) of new
members are satisfied with the ease of the joining process at their current club. While four in ten (39%) are satisfied with the explanation of the protocols at the club.
Significantly higher/lower than total

Co
pyr
igh
t ©
2012
Th
e N
iels
en C
om
pan
y. C
on
fid
enti
al a
nd
pro
pri
etar
y.
67
53%59%
54%
66% 66%
LESS THAN 1 YEAR
(N=131)
1-2 YEARS (N=220)
3-5 YEARS(N=396)
6-10 YEARS(N=316)
MORE THAN 10 YEARS
(N=587)
58%64% 63%
70% 73%
LESS THAN 1 YEAR
(N=114)
1-2 YEARS(N=189)
3-5 YEARS(N=351)
6-10 YEARS(N=297)
MORE THAN 10 YEARS
(N=559)
76% 78% 80%
83% 89%
LESS THAN 1 YEAR
(N=130)
1-2 YEARS(N=219)
3-5 YEARS(N=395)
6-10 YEARS (N=317)
MORE THAN 10 YEARS
(N=583)
KPI BY TENURE
20
40 33
51 53
LESS THAN 1 YEAR
(N=135)
1-2 YEARS (N=219)
3-5 YEARS (N=397)
6-10 YEARS (N=317)
MORE THAN 10 YEARS
(N=585)
NET PROMOTER SCORE
COMPARED TO OTHERS
OVERALL SATISFACTION
New members have lower ratings across all KPIs (although the difference is not significant). With the exception of likelihood to rejoin, there is a decline in ratings across the KPIs at the 3-5 year membership mark.
LIKELIHOOD TO REJOIN
TOTAL43
Significantly higher/lower than total
TOTAL61%
TOTAL83%
TOTAL68%

Co
pyr
igh
t ©
2012
Th
e N
iels
en C
om
pan
y. C
on
fid
enti
al a
nd
pro
pri
etar
y.
68
DRIVERS OF NPS NEW MEMBERS PERFORMANCE
60%
68%
48%
59%
51%
47%
52%
48%
19%
17%
16%
14%
13%
11%
7%
3%
IMPACT PERFORMANCE
% VERY SATISFIED OR EXTREMELY SATISIFED
Sport Z Sport X Sport W Sport Y
93% 30% 65% 74%
93% 41% 71% 83%
60% 36% 43% 63%
60% 45% 62% 71%
36% 36% 57% 63%
67% 23% 57% 53%
80% 35% 57% 60%
80% 23% 48% 64%
VALUE FOR MONEY (n=131)
BEING FRIENDLY AND WELCOMING (n=135)
BEING PROFESSIONAL AND WELL MANAGED (n=131)
PROVIDING A GOOD SOCIAL ENVIRONMENT (n=133)
ALLOWING ME TO FULFIL MY POTENTIAL (n=127)
HAVING GOOD COMMUNICATIONS (n=134)
HAVING GREAT COACHES (n=98)
HAVING GOOD FACILITIES E.G. PLAYING VENUES,COMPETITION VENUES, CHANGING ROOMS,
CLUB ROOMS (n=133)
Value for money, being professional and well managed and being friendly and welcoming are key drivers of a player’s likelihood to recommend their club to others.
Base: New Members (those who have been a member of their current club for less than one year), excluding those who answered don’t know/can’t say and not applicable
Q10. How would you rate your overall satisfaction with your <insert sport> club on each of the following…
Note: Results are weighted, with each NSO contributing 25% to the total result. Due to variations between subgroups (e.g. tenure) the average of the NSO results will not equal the total.

Co
pyr
igh
t ©
2012
Th
e N
iels
en C
om
pan
y. C
on
fid
enti
al a
nd
pro
pri
etar
y.
69
DRIVERS OF SATISFACTION NEW MEMBERS PERFORMANCE
51%
60%
59%
68%
48%
47%
52%
48%
19%
17%
16%
14%
13%
11%
7%
3%
IMPACT PERFORMANCE
% VERY SATISFIED OR EXTREMELY SATISIFED
Sport Z Sport X Sport W Sport Y
36% 36% 57% 63%
93% 30% 65% 74%
60% 45% 62% 71%
93% 41% 71% 83%
60% 36% 43% 63%
67% 23% 57% 53%
80% 35% 57% 60%
80% 23% 48% 64%
ALLOWING ME TO FULFIL MY POTENTIAL (n=127)
VALUE FOR MONEY (n=131)
PROVIDING A GOOD SOCIAL ENVIRONMENT (n=133)
BEING FRIENDLY AND WELCOMING (n=135)
BEING PROFESSIONAL AND WELL MANAGED (n=131)
HAVING GOOD COMMUNICATIONS (n=134)
HAVING GREAT COACHES (n=98)
HAVING GOOD FACILITIES E.G. PLAYING VENUES,COMPETITION VENUES, CHANGING ROOMS,
CLUB ROOMS (n=133)
In addition to value for money, a club allowing players to fulfil their potential and a good social environment are key drivers of a player’s overall satisfaction with their club.
Base: New Members (those who have been a member of their current club for less than one year), excluding those who answered don’t know/can’t say and not applicable
Q10. How would you rate your overall satisfaction with your <insert sport> club on each of the following…
Note: Results are weighted, with each NSO contributing 25% to the total result. Due to variations between subgroups (e.g. tenure) the average of the NSO results will not equal the total.
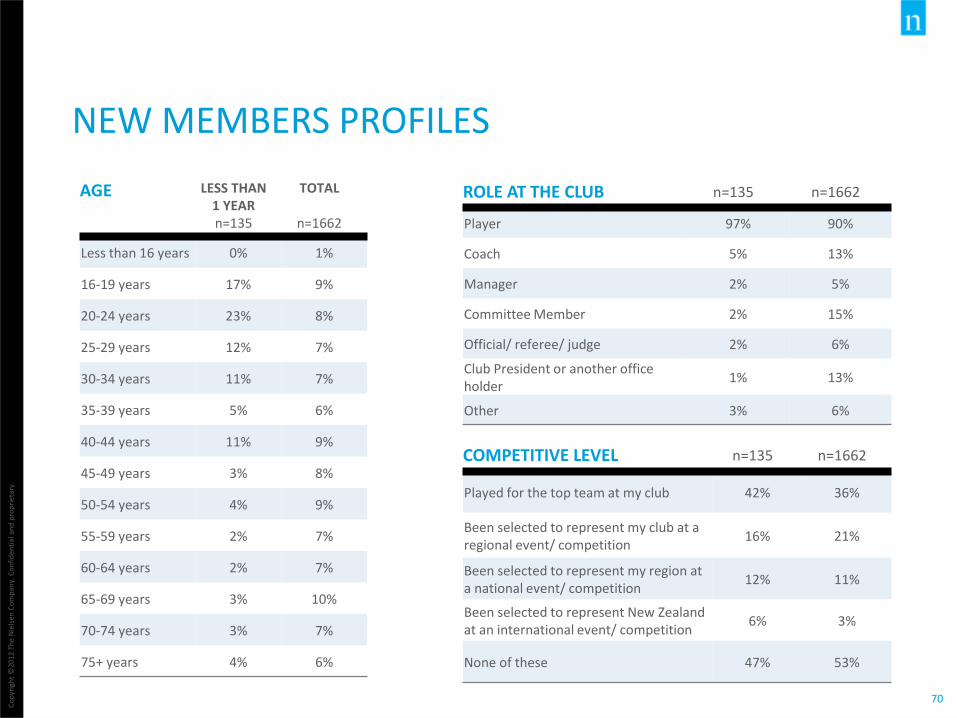
Co
pyr
igh
t ©
2012
Th
e N
iels
en C
om
pan
y. C
on
fid
enti
al a
nd
pro
pri
etar
y.
70
NEW MEMBERS PROFILES
AGE LESS THAN 1 YEARn=135
TOTAL
n=1662
Less than 16 years 0% 1%
16-19 years 17% 9%
20-24 years 23% 8%
25-29 years 12% 7%
30-34 years 11% 7%
35-39 years 5% 6%
40-44 years 11% 9%
45-49 years 3% 8%
50-54 years 4% 9%
55-59 years 2% 7%
60-64 years 2% 7%
65-69 years 3% 10%
70-74 years 3% 7%
75+ years 4% 6%
ROLE AT THE CLUB n=135 n=1662
Player 97% 90%
Coach 5% 13%
Manager 2% 5%
Committee Member 2% 15%
Official/ referee/ judge 2% 6%
Club President or another office holder
1% 13%
Other 3% 6%
COMPETITIVE LEVEL n=135 n=1662
Played for the top team at my club 42% 36%
Been selected to represent my club at a regional event/ competition
16% 21%
Been selected to represent my region at a national event/ competition
12% 11%
Been selected to represent New Zealand at an international event/ competition
6% 3%
None of these 47% 53%

INJURIES

Co
pyr
igh
t ©
2012
Th
e N
iels
en C
om
pan
y. C
on
fid
enti
al a
nd
pro
pri
etar
y.
72
SUPPORTING INJURED PLAYERS
7%
5%
11%
36%
41%
42%
31%
28%
25%
25%
25%
20%
CONTINUING TO INVOLVE YOU IN CLUB ACTIVITIES WHILE YOU
WERE INJURED (N=366)
NOT PUSHING YOU BACK INTO PLAY TOO SOON (N=363)
SUPPORTING YOU WHILE YOU RECOVERED FROM AN INJURY
(N=353)
EXTREMELY DISSATISFIED DISSATISFIED SATISFIED VERY SATISFIED EXTREMELY SATISFIED
Over half (55%) of players who have been injured in the last 12 months are satisfied with their club continuing to involve them in activities.
% VERY SATISFIED OR EXTREMELY SATISIFED
TOTAL Sport Z Sport X Sport W Sport Y
55% 52% 45% 54% 53%
53% 50% 44% 52% 52%
45% 53% 41% 46% 55%
Base: Those who have been injured in the last 12 months excluding don't know/ can't say and not applicable Q20. Have you been injured while playing or training for <insert sport> in the last 12 months/Q21. How satisfied are you with your <insert sport> club on the following?
39% of players have been injured while playing or
training for their sport in the last 12 months.
Sport Z Sport X Sport W Sport Y
4% 56% 68% 27%
Significantly higher/lower than total
GENDER DIFFERENCES

Co
pyr
igh
t ©
2012
Th
e N
iels
en C
om
pan
y. C
on
fid
enti
al a
nd
pro
pri
etar
y.
74
THREE OUT OF TEN PLAYERS ARE FEMALE
NPS SATISFACTION LIKELIHOOD TO REJOIN COMPARED TO OTHERS
FEMALE 47 60% 84% 66%
MALE 41 62% 82% 68%
KPI BY GENDERPerformance across the KPIs is similar when broken down by gender. The higher NPS for female players is driven by a larger proportion being promoters, while a similar proportion of males and females are detractors. Female players are significantly more likely to be promoters (62% cf. 57% of males).
27%
21%
19%
BETTER CLUB MANAGEMENT/COMMITTEE
BETTER/MORE ATMOSPHERE/FRIENDLY/HELPFUL/
SUPPORTIVE CLUB MEMBERS
FAIRNESS/EQUAL OPPORTUNITIES -TEAM SELECTION/ ACCESS TO
FACILITIES
When players were asked what needs to improve at the club in order for them to be more likely to recommend their club to others, females were more likely to mention more fairness / equal opportunities.
In contrast the most commonly mentioned area of improvement among males was better club management/committee. Males were also more likely to mention better facilities/equipment (15% cf. 4% females)
TOP THREE AREAS OF IMPROVEMENT (BY GENDER)
32%
25%
17%
FAIRNESS/EQUAL OPPORTUNITIES -TEAM SELECTION/ ACCESS TO
FACILITIES
BETTER/MORE ATMOSPHERE/FRIENDLY/HELPFUL/
SUPPORTIVE CLUB MEMBERS
BETTER CLUB MANAGEMENT/COMMITTEE

SAMPLE PROFILES
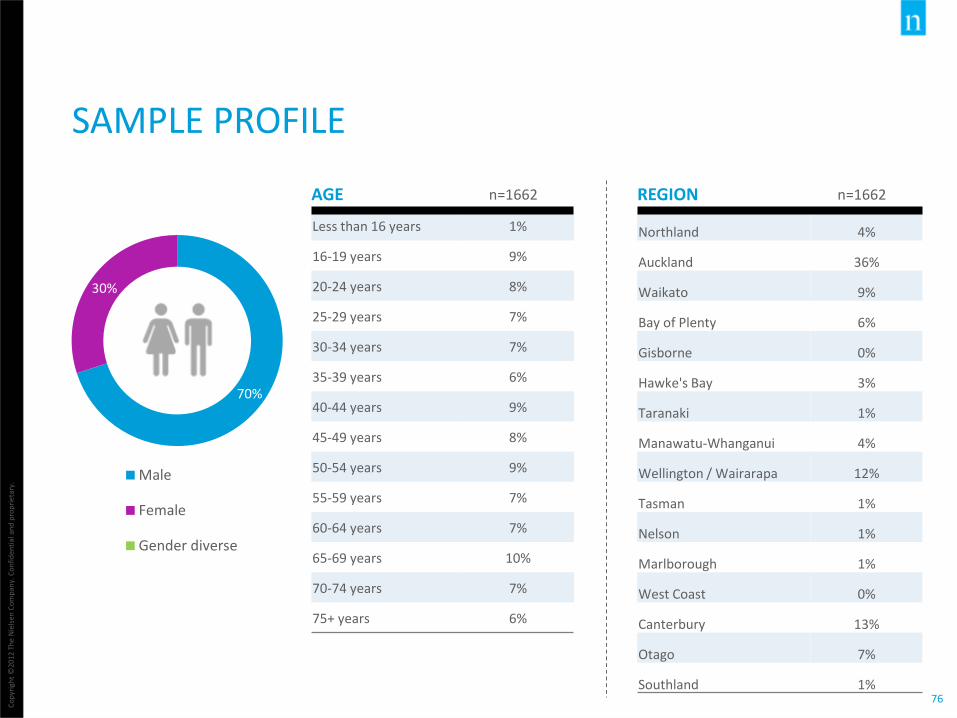
Co
pyr
igh
t ©
2012
Th
e N
iels
en C
om
pan
y. C
on
fid
enti
al a
nd
pro
pri
etar
y.
76
SAMPLE PROFILE
AGE n=1662
Less than 16 years 1%
16-19 years 9%
20-24 years 8%
25-29 years 7%
30-34 years 7%
35-39 years 6%
40-44 years 9%
45-49 years 8%
50-54 years 9%
55-59 years 7%
60-64 years 7%
65-69 years 10%
70-74 years 7%
75+ years 6%
REGION n=1662
Northland 4%
Auckland 36%
Waikato 9%
Bay of Plenty 6%
Gisborne 0%
Hawke's Bay 3%
Taranaki 1%
Manawatu-Whanganui 4%
Wellington / Wairarapa 12%
Tasman 1%
Nelson 1%
Marlborough 1%
West Coast 0%
Canterbury 13%
Otago 7%
Southland 1%
70%
30%
Male
Female
Gender diverse

Co
pyr
igh
t ©
2012
Th
e N
iels
en C
om
pan
y. C
on
fid
enti
al a
nd
pro
pri
etar
y.
77
ROLE AT THE CLUB n=1662
Player 90%
Coach 13%
Manager 5%
Committee Member 15%
Official/ referee/ judge 6%
Club President or another office holder 13%
Other 6%
COMPETITIVE LEVEL n=1662
Played for the top team at my club 36%
Been selected to represent my club at a regional event/ competition
21%
Been selected to represent my region at a national event/ competition
11%
Been selected to represent New Zealand at an international event/ competition
3%
None of these 53%
PLAYER PROFILE

Co
pyr
igh
t ©
2012
Th
e N
iels
en C
om
pan
y. C
on
fid
enti
al a
nd
pro
pri
etar
y.
78
MEMBERSHIP TENURE n=1662
Less than 1 year 9%
1-2 years 16%
3-5 years 23%
6-10 years 18%
More than 10 years 34%
LIFESTAGE n=1662
Secondary 7%
Tertiary 6%
Young adults 12%
Young families (parents) 21%
Older families (parents) 10%
Older adults 24%
Young retirees 15%
Older retirees 6%
PLAYER PROFILE

Co
pyr
igh
t ©
2012
Th
e N
iels
en C
om
pan
y. C
on
fid
enti
al a
nd
pro
pri
etar
y.
79
HOUSEHOLD DESCRIPTION n=1662
Young couple - no children 7%
Household with youngest child under 5 10%
Household with youngest child at primary or intermediate school
14%
Household with youngest child at secondary school or tertiary education
15%
Middle Age/Older couple - no children/no children at home
33%
Single/One person household 9%
Flat - not a family home 6%
Other 7%
EMPLOYMENT STATUS n=1662
Home duties (not otherwise employed) 3%
Retired 21%
Social Welfare Beneficiary/ Unemployed 1%
Student - Secondary 7%
Student - Tertiary 6%
Employed - part time 10%
Employed - full time 52%
PLAYER PROFILE

ANALYSIS OF THE QUESTIONNAIRE

Co
pyr
igh
t ©
2012
Th
e N
iels
en C
om
pan
y. C
on
fid
enti
al a
nd
pro
pri
etar
y.
81
THE QUESTIONNAIRE• This was a pilot questionnaire and therefore we included questions to ‘test’ how players would respond, in
order to select the most meaningful questions for the final questionnaire.
• The average length of the pilot was 15 mins – this is longer than we would recommend for a survey of this type, therefore in the analysis of the questionnaire one of the objectives was to remove any unnecessary questions.
• Using the total weighted responses we completed the following:
o Step 1: Identified key metrics – correlation analysis to see if we could remove any of the key metric questions.
o Step 2: Determined what explained the key metrics - regression analysis to see what were the drivers of the KPI questions, do they vary by KPI, which model was the best ‘fit’ statistically.
o Step 3: Checked drivers adequately explained - correlation analysis to see how related the different attributes were, and regression analyses to determine if the attributes explained the drivers.
• We also analysed the generic feedback question which contained suggestions from respondents about the survey, looking for any common themes around improvements or areas of concern and discussed these with Sport NZ.
• Finally we sought feedback from the pilot NSOs about their preference for including the drivers, the attributes or a mixture of both. The overall preference was for a short simple questionnaire.
• Taking all of the above into consideration, we then created a final version of the questionnaire post pilot, with mainly closed questions and a couple of open enders to minimise respondent burden, yet focusing on what is important to players.

Co
pyr
igh
t ©
2012
Th
e N
iels
en C
om
pan
y. C
on
fid
enti
al a
nd
pro
pri
etar
y.
82
STEP 1: IDENTIFICATION OF KEY METRICS• We included in the questionnaire a number of questions that could be considered key metrics. These
were:
• Satisfaction with overall experience (Q4)
• Comparison of your club to others clubs that you know of (Q5)
• Recommendation (Q7)
• How likely to play for or rejoin you club next season (Q9)
• Looking at the correlations between these four questions we found that Comparison of your club (Q5) and Recommendation (Q7) had the highest correlation coefficient of 0.618. Practically the Recommendation provides a metric that clubs and other organisations are already familiar with i.e. NPS, therefore we recommended removing the Comparison of your club question.
• The other three metrics all had lower correlations, so we recommended to include the remaining three questions as they are measuring slightly different aspects of the experience.
Q4 Q5 Q7 Q9
Q4 1.000 0.550 0.556 0.371
Q5 1.000 0.618 0.381
Q7 1.000 0.490
Q9 1.000
Note: All references to question numbers are for the Final Pre-pilot version dated 10/11/15

Co
pyr
igh
t ©
2012
Th
e N
iels
en C
om
pan
y. C
on
fid
enti
al a
nd
pro
pri
etar
y.
83
STEP 2: EXPLANATION OF THE METRICS
• As mentioned earlier Regression is a statistical process for estimating the relationship between a dependent variable and one or more independent variables (or ‘drivers'). It helps us to understand the importance or impact of a ‘driver’ by measuring its contribution to explaining variance in the dependent variable. We used a regression approach called Modified Kruskal, which addresses any multi-collinearity issues.
• We ran several regression models using different combinations of independent variables; the list of seven drivers identified in the qualitative stage (Q10), key metric questions (Q4,Q5,Q7,Q9) and factors created from the driver attributes (Q6, Q11-Q19).
• The R2 achieved for each regression is an indication of how well the model created determines what impacts on the dependent variable. An R2 of 1 means the dependent variable is explained totally by the independent variable. An R2 is considered ‘good’ in market research when it falls between 0.4 and 0.7.
• We determined that for this project we required two regression models, one using NPS as the dependent variable and one using Satisfaction as the dependent variable – as the drivers were quite different – possibly reflecting the different stages from satisfaction to recommendation.
• The two best models used the seven drivers from Q10 plus the attribute Value for Money in Q6 (R2 of 47% for NPS and 43% for Satisfaction - so the model for NPS was slightly better).
Note: When doing the factor analysis of the 29 attributes, based on their correlations these were best summarised into seven themes. These seven themes perfectly matched the attributes’ associated drivers – reinforcing that the drivers in Q10 were sufficient inputs into the models (and meant the questionnaire could be much shorter).

Co
pyr
igh
t ©
2012
Th
e N
iels
en C
om
pan
y. C
on
fid
enti
al a
nd
pro
pri
etar
y.
84
STEP 3: EXPLANATION OF THE DRIVERS
• While the models selected adequately explain the key metrics of Satisfaction and NPS, there are times when organisations may want more detail to explain why they are performing poorly on a certain driver, or they may want to understand a particular issue they are facing.
• Therefore the next stage was to examine the individual attributes in Q11-19 to see if we wanted to include any of these, as well as the core drivers in Q10.
• Firstly, we completed correlation analyses to see how correlated the different attributes were. Most were highly correlated (i.e. if someone gave a high score in one they were likely to give a high score in the other, indicating there is some sort of relationship).
• Next we used regression analysis with each driver as the dependent variable and the associated attributes as the independent variables. This was to ensure that there was nothing significantly missing from the drivers identified in the qualitative. The R2 values ranged from 54-68% except the model for Providing a good social environment (R7 in Q10) which had a R2 value of 48%. It also showed us the order of impact the attributes had on the drivers.
• Using this information and after discussions with Sport NZ, we made a few tweaks to the drivers and selected some additional attributes to be included in the final questionnaire that were either less correlated or we felt assisted understanding for the NSO on a particular issue or area of concern. The majority of these were positioned as ‘optional’ in the final questionnaire so an individual NSO could select one or more of them if they wanted to include them or not. We also added an open ended question to drill into any drivers that were rated lower to provide NSOs with an understanding of why.

ANALYSIS OF THE PROCESS

Co
pyr
igh
t ©
2012
Th
e N
iels
en C
om
pan
y. C
on
fid
enti
al a
nd
pro
pri
etar
y.
86
OVERVIEW OF THE PROCESS• Overall feedback on the process was very positive from the pilot NSOs. They appreciated the guidance
and examples provided by Nielsen and the regular communications to ensure everything was on track. They did not have any suggestions for improvement. Based on antedoctal feedback we believe it may have been a little bit more time consuming than some initially thought it would be, so this needs to be allowed for in the future.
• Fieldwork started roughly at the same time however some NSOs required ‘booster samples’ that were not in field for as long. The total fieldwork spanned roughly three weeks and allowed for several reminders (except for the ‘boosters’).
• In terms of the three different approaches used for sending out invitations, not all NSOs had the internal capability/ systems to send out individualised links. For those that did, the response rates were fairly similar, with an open link performing just as well as individualised links. There was also very little difference in rates depending on whether Nielsen or the NSO sent the links.
• We believe response rates were impacted more by the quality of the database used (meaning in some cases the sourcing of multiple samples), the type of people playing the sport (demographics) and the timing of the survey in relation to the start/end of the playing season. An incentive may also help but was not tested in the pilot.
• Communications may have also impacted response rates, however we do not know readership levels of the newsletters used for pre-notification of the survey, or the regularity of other communications that could have prevented cut through. The response rates were higher for Sport Y and Sport Z who used different methods of pre-notification and while we would normally say individualised communications works better, this was not the case with Sport X players.
• The following slides provide more detail about the process including responses rates by approach, fieldwork timing, communications used, completion rates and completion rates by device.

FINAL RECOMMENDATIONS

Co
pyr
igh
t ©
2012
Th
e N
iels
en C
om
pan
y. C
on
fid
enti
al a
nd
pro
pri
etar
y.
88
RECOMMENDATIONS• Overall the pilot worked well and we have created a clear, succinct questionnaire to be used in the
future, that could be distributed via open or individualised links to club players. (Note: It includes a new member section which is answered if the player has been at the club less than a year.)
• Some important things to consider in future research include:
The timing of the survey – ideally the survey should be undertaken a month or two into the season to maximise engagement and response rates
Communications about the survey need to be clear and concise and achieve cut through –ideally initial pre-notification about the survey should be done well in advance as part of a communicated programme of work aimed at improving the player experience. Communications should be done using a number of different methods e.g. newsletters, website, individualised emails - each reinforcing the importance of the research. If possible confidentiality of responses should be ensured, if this is not possible then NSOs need to be up front about this in any communications and introductions.
Fieldwork should be based on one clean sample, allowing players two to three weeks to respond. This allows for up to two reminders to be sent to individuals as well as continual promotion of the research in other mediums e.g. newsletters. The sample should only include players who have given permission for the NSO to contact them for marketing and other related activity.

Co
pyr
igh
t ©
2012
Th
e N
iels
en C
om
pan
y. C
on
fid
enti
al a
nd
pro
pri
etar
y.
89
RECOMMENDATIONS CTD• Some important things to consider in future research include (ctd):
Frequency of surveying is normally based on size of membership and response rates, however to keep the process simple for NSOs we recommend surveying should be undertaken once a year to all players enabling enough time for NSO/ clubs to act on the results. Or if there are two clear seasons (or players participate all year round) then surveying could be conducted twice a year (but ensuring each player is only contacted once every 12 months).
In addition by giving everyone the opportunity to participate, the NSO doesn’t have to worry about more frequent sub samples having different demographics and requiring weighting.
Ideally even the annual sample should be weighted to reflect the key demographics of each NSO’s total members, however in the majority of cases this is probably too complicated for NSOs to administer themselves. Instead we recommend they report (and track over time) sample profiles so the results can be interpreted in the context of who responded to each survey.
• It will now be critical to ‘close the loop’ by providing the results back to the players via the clubs or NSOs and showing what will change as a result of their feedback. This will have the largest impact on future response rates – showing the players that their feedback is valued and acted on.
