community-scale solar plus thermal storage and demand-response
TRANSCRIPT

Community-Scale Solar Plus Thermal Storage and Demand-Response
A Modeling Study of Local Grid Benefits
Community Solar Value Project September 2017
Santiago Sena, Public Service Company of New Mexico
Jon Hawkins, PNM Resources

Summary
WorkingwiththeteamfromtheCommunitySolarValueProject(CSVP),aprogramco-fundedbytheU.S.DOESunShotprogram,PublicServiceCompanyofNewMexico(PNM)hasexaminedtheideaofcombiningcommunity-scalesolarwithstorageanddemand-response(DR)measures.Thisstrategyhasbeendiscussedintheutilityindustry,asameansofcapturingnumerousbenefits,frommanagingsystempeakstoofferingcustomersmoreclean-energychoices,asrenewable-energypenetrationincreases.Anotherbenefitmightbetheopportunitytositesolarandsolar-plusmeasurestocapturegridbenefits.Thus,thisstudyexaminesanopportunitytomitigatelow-voltageissuesonafeedercomprisedprimarilyofresidentialloads.MightdistributedsolargenerationplusthermalstorageandDRbenefitthiscircuit,ormighttheycreatenewproblems?
PNMmodeledtheimpactonadistributionfeederofmultiplecombinationsofsolararraysofvaryingsizeswithcontrolofresidentialairconditionersandelectricwaterheaters.Ineachscenario,PNMevaluatedtheresultingimprovementinvoltagelevelsoneachdistributiontransformerduringtheperiodoflowvoltage(primarily,lateafternoonandearlyevening).WhileneitherDRalonenorasolararrayalonecouldmitigatealllow-voltageissues,thecombinationofamid-sizedsolararrayandsimpleDRcontrolstrategiesonthermalstorageeliminatedallinstancesoflowvoltage.ThemodelingapproachusedheremaybeextendedandappliedinotherstudiesatPNMorotherutilities,inevaluatingnovelcombinationsofrenewablesandloadflexibilitytoaddressdistributionissues.

1
Introduction
PNMisNewMexico’slargestelectricutility,servingover525,000customersinastatewithrelativelylowpopulationandalargeamountofnaturalresources.Giventhenaturalresourcesinthestate,itisnotsurprisingthatPNM’scustomershaveahighinterestinrenewableenergy.Infact,AlbuquerquewasnotedinarecentU.S.DepartmentofEnergySunShotSolarIndustryUpdateasbeinginthetop5citiesinthenationintermsofpercapitaPVinstalled.1Inaproactiveprojectthatbeganin2010andwascompletedin2011,PNMwasaveryearlypioneerinstudyinghowenergystoragemaybeabletoworktogetherwithdistributedrenewablestohelpimprovetheirvalue.Thateffort,calledtheProsperityEnergyStorageproject,hasbeendevelopedaspartoftheU.S.DepartmentofEnergy(U.S.DOE)SmartGridDemonstrationGrantsintheEnergyStorageProgram.
TheProsperityprojectwasdesignedandbuiltasa500-kW/1MWhutility-scalebatterystoragesystemthatinteracteddirectlywithaco-located500kWPVsolararray.Inthisproject,PNMresearcherslookedatmultiplevaluestreams.Onesuchvaluestreamisrelatedtosmoothingpoweroutput,inresponsetochangesinPVsystemoutpute.g.,fromintermittentcloudcover;ThesystemalsohasthecapabilityofstoringPVsystemoutputathighsolarproductiontimesforuseattimesthataremorealignedwithutilitysystempeakusagetimes.
Whilebatteryenergystorageisanextremelyflexibleresource,inmanymarketsitisstillacostlysolution.Thus,PNM’sexperiencewithProsperitypromptedaninvestigationintootherresourcesthatcouldcombinewithPVtoprovidesimilarbenefitsatalowercost.Inparticular,mighttherebealternativeresourcesforbalancingshortertermfluctuations,allowingthebatterysystemtofocusonitsenergyapplications,andhowsuchalternativeresourcescouldhelpmitigatesomeofthelocationalissuesthatarisewithdistributedgeneration.Aspartofthisinvestigation,PNMmodeledsomescenariosutilizingacommunity-scalesolar(CS)projectcoupledwithdemand-response(DR)resources.Thescenariocouldbeextendedtoimplementationthroughamodelthatpromotescommunitysolarwithcompanionmeasures(utility-sidestorageplusDR);however,thismodelingexercisewasfocusedonlyontechnicalimpacts.
PNMhadidentifiedafeederinitsserviceterritorythatalreadywasdisplayingvoltagesatcertaintimesofthedaythatwerebelowPNM’sdesigncriteria(ANSIRange-AVoltageLimits).Thelowvoltageswereidentifiedduringroutineplanningevaluationandtraditionalsystemimprovementapproacheswereimplementedtomitigatethelowvoltages.However,thegoalofthisanalysiswastoinvestigatethepossibilityofusingDRandCSresources,asopposedtothetraditionalapproachestomitigatelowvoltagesthatoccurasaresultofnormalloadgrowth.2TheanalysispresentedinthisreportassumesallavailableDRresourcesparticipatedintheprogram.TwoDRresourceswereevaluatedin1RobertMargolis,DavidFeldman,DanielBoff,“Q42016/Q12017SolarIndustryUpdate”,page33,U.S.DepartmentofEnergySunShot,April25,20172TheanalysisandconclusionshighlightedinthisreportwerenotfullyvettedthroughPNM’sDistributionPlanningDepartment.ThefindingsandconclusionsinthisreportarethoseoftheauthorsanddonotrepresenttheofficialpositionofPNM.

2
thisanalysis,controlledHVACunits(residentialairconditioning)andcontrolledelectrichotwaterheaters(EHWH).Thecircuitmodeledisprimarilyresidential,buttheseCSandDRmeasuresmayalsobetargetedtoacommercialmarket.
Asindicatedbelow,thescenarioutilizedforthisstudyrepresentsafirst-stepinthetechnicalassessmentofpossibleCSgridbenefits.Theresearchquestionsaresimplythese:
1)Wouldadistributioncircuitthatisexperiencinglowvoltagebeacandidateforasolar-plus-DR(withthermalstorage)strategy?
2)Ifasolar-plus-DRstrategyweresuggestedforacircuitexperiencingperiodiclow-voltagecharacteristics,isthereanidealconfiguration,intermsofsolar-projectscale?
3)Whatarethelikelysynergisticeffectsinthesituationdescribed,ofaddingoneormoreDRmeasures,plusthermalstorage,alongwiththeadditionofdistribution-scalesolargeneration?
Inpreparingthisanalysis,theauthorsworkedwiththeCommunitySolarValueProject(CSVP),whichisaU.S.DOESunShotawardee.CSVPhasworkedwithutilitiesonarangeofDRandstorageoptionsthatcouldbeusedascompanionmeasureswithcommunity-scalesolar,primarilyintherangeof500-kWto10MW.SomeoftheapproachesdiscussedinthisanalysisweredevelopedbasedinpartonCSVP’sworkwithotherutilities,andtheauthorshopetheseresultswillbeofusetoutilitiesconsideringsimilaroptions.Asnotedbelow,CSVPhasidentifiednumerousDRtechnologiesandcustomer-sidestorageoptionsthatarereadilyavailableandhavevarious,flexiblecontrolcharacteristics,aswellascustomer-appeals.CSVPalsohasrecommendedfullyutilizinginvertertechnologyandaddingstrategicsolar-designimprovements.Notalloftheseavailablehigh-valueoptionsaremodeledforthisstudy.Ineffect,thisstudyrepresentsa“firstgate”inthepathtoestablishingacommunity-scalesolar-plusstrategy
Thefollowingcasesweremodeled:
• BaseCaseo Demandresponseandcommunitysolarresourcesnotevaluated
• CommunitySolarOnlyo Onlycommunitysolarresourcesevaluated.o ThesizeofthePVgeneratorwasincreasedfrom1MW-9MWat1MW
increments.o Thelocationofthecommunitysolarsitewasstatic.
• DemandResponseOnlyo Onlydemandresponseresourcesevaluated.o OperationoftheHVACunitswereadvancedordeferredinaneffortto
mitigatevoltageissues.o TheoperationsoftheEHWHunitswereshiftedoutsidepeakloadingperiods.
• CommunitySolarplusDemandResponse
3
o Demandresponseresourcesevaluatedinconjunctionwithcommunitysolarresources
o TheoperationoftheHVACunitswereadvancedordeferredinanefforttomitigatelowvoltageissues.
o TheoperationsoftheEHWHweredeferredbetweenpeakloadingperiods.
DemandResponseResources
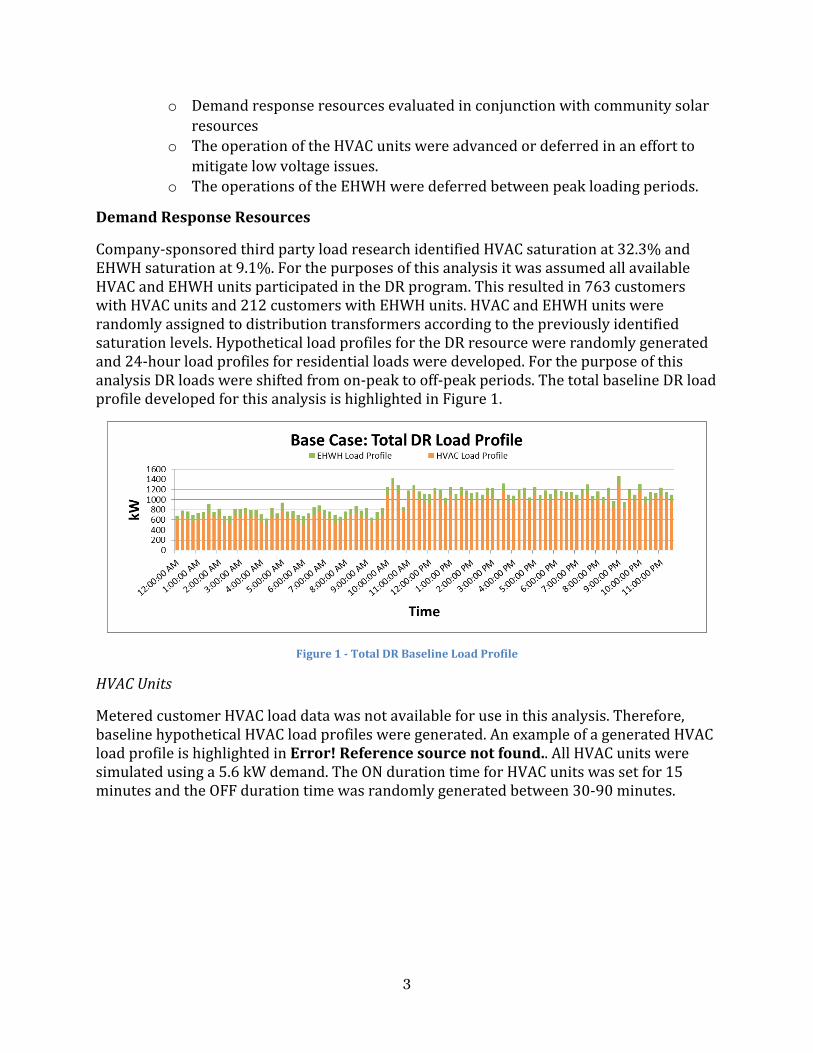
Company-sponsoredthirdpartyloadresearchidentifiedHVACsaturationat32.3%andEHWHsaturationat9.1%.ForthepurposesofthisanalysisitwasassumedallavailableHVACandEHWHunitsparticipatedintheDRprogram.Thisresultedin763customerswithHVACunitsand212customerswithEHWHunits.HVACandEHWHunitswererandomlyassignedtodistributiontransformersaccordingtothepreviouslyidentifiedsaturationlevels.HypotheticalloadprofilesfortheDRresourcewererandomlygeneratedand24-hourloadprofilesforresidentialloadsweredeveloped.ForthepurposeofthisanalysisDRloadswereshiftedfromon-peaktooff-peakperiods.ThetotalbaselineDRloadprofiledevelopedforthisanalysisishighlightedinFigure1.
Figure1-TotalDRBaselineLoadProfile
HVACUnits
MeteredcustomerHVACloaddatawasnotavailableforuseinthisanalysis.Therefore,baselinehypotheticalHVACloadprofilesweregenerated.AnexampleofageneratedHVACloadprofileishighlightedinError!Referencesourcenotfound..AllHVACunitsweresimulatedusinga5.6kWdemand.TheONdurationtimeforHVACunitswassetfor15minutesandtheOFFdurationtimewasrandomlygeneratedbetween30-90minutes.

4
Figure2-GeneratedHVACBaseline15MinuteLoadProfile
HVACloadswerecontrolledinoneoftwoways:(1)forthetimeintervalbetween12:00PM-6:30PMindividualHVACloadswereadvanced15minutescomparedtothebaselineprofile,ensuringdistributionvoltagesremainwithintheplanningcriteria,(2)fortimeintervalsbetween6:30PM-12AMindividualHVACloadsweredelayed15minutes,ensuringdistributionvoltagesremainwithintheplanningcriteria.Forexample,forthebaselineHVACloaddepictedinFigure2thecorrespondingcontrolledHVACloadprofileisidentifiedinFigure3.
Figure3-ControlledHVACLoadProfileExample
EHWHUnits
MeteredcustomerEHWHloaddatawerenotavailableforuseinthisanalysis.Therefore,baselinehypotheticalEHWHloadprofilesweregenerated.AnexampleofageneratedEHWHloadprofileishighlightedinFigure4.TheEHWHloadsweregeneratedusingademandof3.9kW.TheONdurationtimefortheEHWHwassetfor15minutesandtheOFFdurationtimewassetfor75minutes.TheinitialONoperationfortheEHWHwererandomlygenerated.FortheDRcontrolledcasesevaluatedinthisanalysisEHWHloads

5
werecompletelycurtailedbetweenthehoursof5:00PM–10PM.Forexample,forthebaselineEHWEloaddepictedinFigure4thecorrespondingcontrolledEHWHloadprofileisidentifiedinFigure5.
Notethattoday’sgrid-interactiveelectricwaterheatertechnologiescansupportamoreflexible,load-responsivecontrolscenariothanthosemodeledhere.Asafirst-stepanalysis,thisstudyreliedonbasictime-of-daytypecontrolstrategiesandassumedonlyexistingwaterheaters,retrofittedwithcontrolsthatdonotrequirecustomerstohaveadvancedelectronicmeters.Similarly,theHVACcontrolstrategyselectedforthismodelingeffortwasintendedtobereadilyachievable,usingexistingtechnologiesandsimplechangestoexistingprotocols.(SeeadditionalCSVPresourcesformoreonDRandcustomer-sidestorageoptions.)
Figure4-BaselineEHWHLoadProfile
Figure5-ControlledEHWHLoadProfileExample
FeederDistributionVoltage
Thecompany-acceptedcriteriaforappropriatedistributionvoltageistheAmericanNationalStandardInstitute(ANSI)StandardC84.1.Thestandardspecifiesvoltageranges

6
fornormal(Range-A)andemergency(RangeB)conditions.Range-Adefinestheservicevoltageasaminimumof114voltsandamaximumof126volts.
Amaximumvoltagedropof4%isthecompanydesignlimitfromthedistributiontransformerprimarytothecustomerservicemeter.Furthermore,PNMtypicallysetssubstationtransformersecondaryvoltagesat2.0%-2.5%above120voltsnominal.ApplyingthecompanyvoltagedropdesignlimitstotheANSIC84.1Range-Alimitsresultsinaminimumvoltagerequirementof118.7voltsattheprimarydistributiontransformerhighsidetoensureautilizationvoltageof114voltsatthecustomermeter.Furthermore,PNMgenerallydoesnotmodeldistributiontransformersandcustomerservicedrops.Forthepurposeofthisanalysis,distributiontransformersprimaryvoltagesbelow118.7voltsandabove126voltsareconsideredoutsideRange-A.
FeederModel
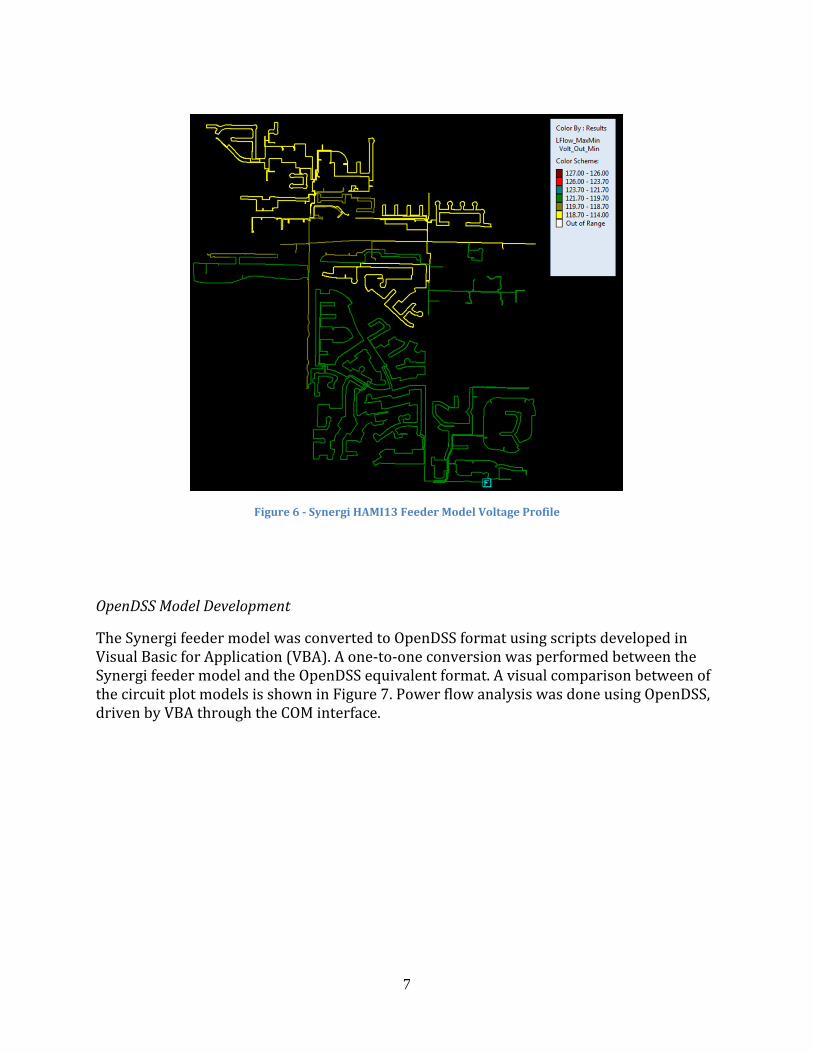
ThefeederusedinthisanalysisisidentifiedasHAMI13.Duringroutineplanningevaluation,theSynergifeedermodelidentifiedlowvoltagesbelowtheANSIC84.1Range-Alowerlimitduringpeakloadingconditions.ThelowvoltageswereconcentratedtoA-phaseandB-phaselateralslocatedattheendofthefeeder.TheSynergivoltageheatmapisidentifiedinFigure6.Mitigatingthelowvoltagesrequiredthefollowingsystemimprovements:
• Relocatinganoverhead1200kVARfixedcapacitor• Installinganewpad-mounted1800kVARswitchedcapacitorbank• TransferringasinglephaseloopfromtheB-phasetotheA-phase.
7
Figure6-SynergiHAMI13FeederModelVoltageProfile
OpenDSSModelDevelopment
TheSynergifeedermodelwasconvertedtoOpenDSSformatusingscriptsdevelopedinVisualBasicforApplication(VBA).Aone-to-oneconversionwasperformedbetweentheSynergifeedermodelandtheOpenDSSequivalentformat.AvisualcomparisonbetweenofthecircuitplotmodelsisshowninFigure7.PowerflowanalysiswasdoneusingOpenDSS,drivenbyVBAthroughtheCOMinterface.

8
Figure7-OpenDSSandSynergiFeederCircuitPlots
OpenDSSBaseModel
SupervisoryControlandDataAcquisition(SCADA)feederloaddatacorrespondingtothepeakloadingdaywasusedtodevelopresidentialloadprofiles.TheresidentialtransformerloadprofilesweredevelopedbytreatingtheEHWHandHVACunitsasspotloadsandallocatingSCADA15minutefeederloaddataaccordingtoconnectedKVA.ModelingtheDRloadasspotloadsensuredthatonlynon-deferrableloadswerecapturedintheallocationfactors.TheresultingOpenDSSmodelfeederloadprofile,withDRresourcesandnon-deferrableloadsidentifiedisshowninFigure8.
Figure8-OpenDSSFeederLoadProfile
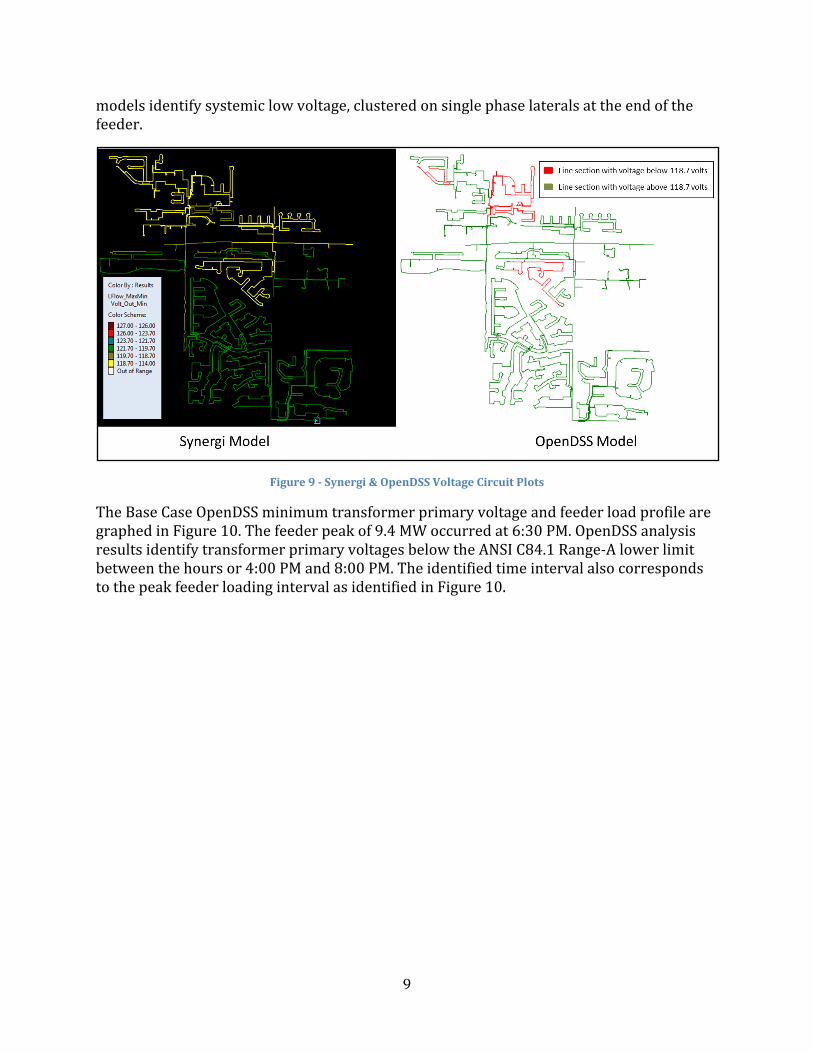
ThebasecaseOpenDSSfeedermodeldevelopedforthisanalysisidentifiedmultiplesingle-phaselateralswithprimarydistributionvoltagesbelowtheANSIC84.1Range-Alimit.TheSynergiandOpenDSSdistributionvoltageprofileresultsareidentifiedinFigure9.Both
9
modelsidentifysystemiclowvoltage,clusteredonsinglephaselateralsattheendofthefeeder.
Figure9-Synergi&OpenDSSVoltageCircuitPlots
TheBaseCaseOpenDSSminimumtransformerprimaryvoltageandfeederloadprofilearegraphedinFigure10.Thefeederpeakof9.4MWoccurredat6:30PM.OpenDSSanalysisresultsidentifytransformerprimaryvoltagesbelowtheANSIC84.1Range-Alowerlimitbetweenthehoursor4:00PMand8:00PM.TheidentifiedtimeintervalalsocorrespondstothepeakfeederloadingintervalasidentifiedinFigure10.

10
Figure10-OpenDSSFeedLoadingandMinimumTransformerPrimaryVoltages
ThetotalnumberoftransformerswithprimaryvoltagesbelowtheANSIC84.1Range-Alowerlimitof118.7voltsishighlightedinFigure11.ThenumberoftransformerswithprimaryvoltagesbelowtheANSIC84.1Range-Alowerlimitspeaksat6:45PMwith58transformers.Themajorityoflowvoltagesoccurbetween5:15PM-7:30PM.ThelocationoftransformerswithvoltagesbelowRange-AareidentifiedinFigure12.Thetransformersarelocatedattheendofthefeederonsinglephaselaterals.
Figure11-BaseCase:TransformerswithPrimaryVoltagebelow118.7volts

11
Figure12-BaseCase:LocationofTransformerswithLowVoltages
Analysis
DemandResponseOnly
ControllingDRresourcesmarginallydecreasesthenumberoftransformerswithprimaryvoltagesbelowtheANSIC84.1Range-Alowerlimitof118.7volts.AcomparisonbetweenthenumbersoftransformerswithvoltagesbelowthedesigncriteriaforboththeDRcontrolledcaseandtheBaseCasesarehighlightedinFigure13.ControllingDRresourcesresultsinvoltagesabovethedesigncriteriaforinstancesbefore4:00PMandafter7:15PM.
Figure13-DRControlledCase:TransformerswithVoltagesbelow118.7Volts
12
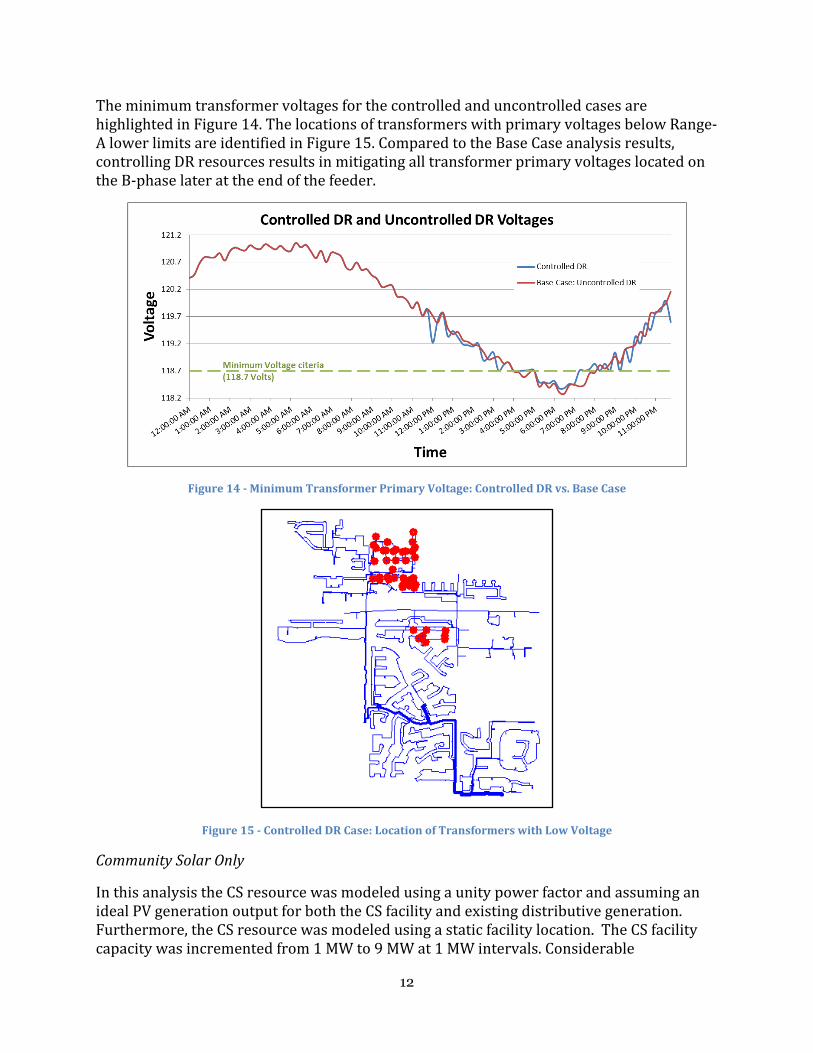
TheminimumtransformervoltagesforthecontrolledanduncontrolledcasesarehighlightedinFigure14.ThelocationsoftransformerswithprimaryvoltagesbelowRange-AlowerlimitsareidentifiedinFigure15.ComparedtotheBaseCaseanalysisresults,controllingDRresourcesresultsinmitigatingalltransformerprimaryvoltageslocatedontheB-phaselaterattheendofthefeeder.
Figure14-MinimumTransformerPrimaryVoltage:ControlledDRvs.BaseCase
Figure15-ControlledDRCase:LocationofTransformerswithLowVoltage
CommunitySolarOnly
InthisanalysistheCSresourcewasmodeledusingaunitypowerfactorandassuminganidealPVgenerationoutputforboththeCSfacilityandexistingdistributivegeneration.Furthermore,theCSresourcewasmodeledusingastaticfacilitylocation.TheCSfacilitycapacitywasincrementedfrom1MWto9MWat1MWintervals.Considerable

13
improvementintransformerprimaryvoltagesresultinCSoutputsof3-6MW.However,transformerprimaryvoltagesremainbelowtheANSIC84.1Range-Alowerlimit.TheminimumtransformerprimaryvoltagesresultingfromvariousCSfacilityoutputsaregraphedinFigure16.
Figure16-CSOnlyCase:MinimumTransformerPrimaryVoltage
PeakCSoutputandpeakfeederloadingareoffsetby5hourswithpeakCSoutputoccurringat1:30PMandpeakloadingoccurringat6:30PM.ACSoutputof9MWresultsinthemajorityoftransformerprimaryvoltageswithintheANSIC84.1Range-Alowerlimits.However,theoutputofa9MWCSfacilityprovidesinsufficientvoltagesupporttomitigatelowvoltagesbetween7:00PM-8:00PM.Forvisualizationthe9MWCSoutput,feederloadprofileandremainingnumberoftransformerswithvoltagesbelowtheANSIC84.1Range-Avoltagelimitof118.7voltsaregraphedinFigure17andthelocationofthosetransformersareidentifiedonFigure18.Theremaininglowvoltagesareclusteredattheendofthefeeder.
Figure17-BaseCaseFeederProfilewith9MWCSOutput&AssociatedXFMRSbelowRange-A

14
Figure18-9MWCSCase:LocationofTransformerswithVoltagesbelow118.7volts
CommunitySolar&DemandResponse
AcombinationofCSandcontrolledDRresourcessignificantlyimprovedprimarytransformervoltages.TransformerprimaryvoltagesforvariouscasesofCSoutputsareshowninFigure19.UtilizingaCSoutputof4.5MWincombinationwithcontrollingDRresourcesensuredalltransformerprimaryvoltagesarewithintheANSIC84.1Range-Avoltagelimitrequirements.
Figure19-DR&CSCase:MinimumPrimaryTransformerVoltageProfile
15
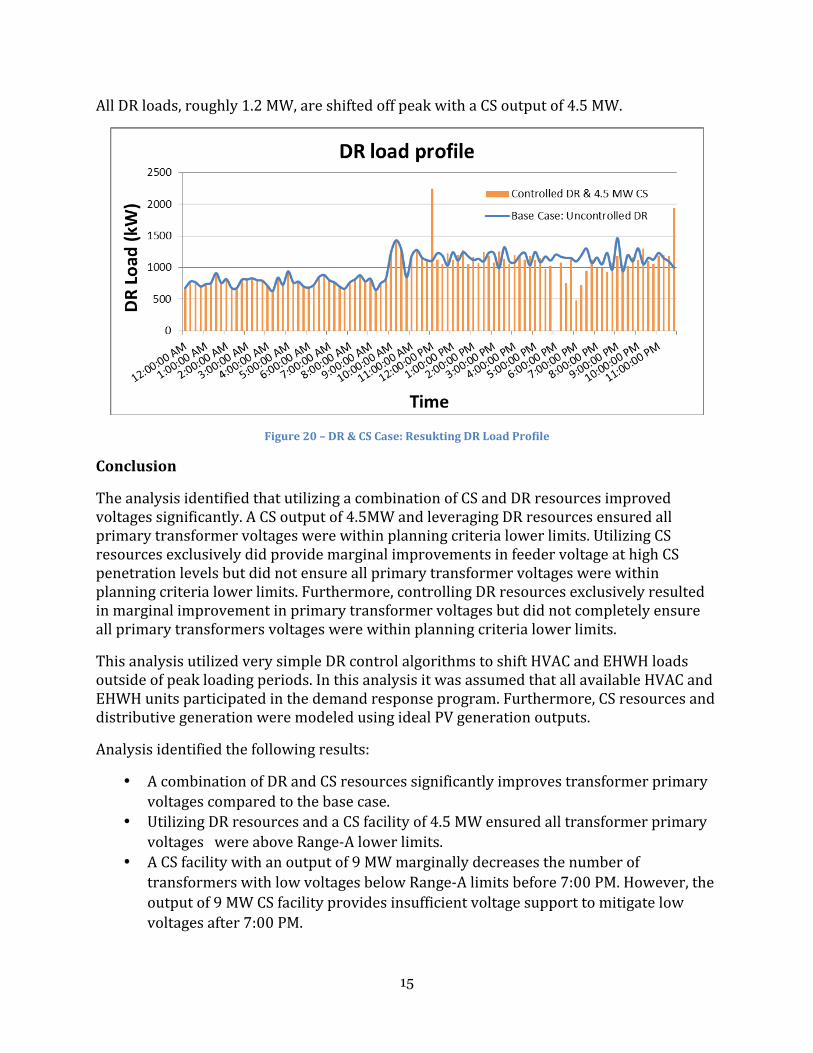
AllDRloads,roughly1.2MW,areshiftedoffpeakwithaCSoutputof4.5MW.
Figure20–DR&CSCase:ResuktingDRLoadProfile
Conclusion
TheanalysisidentifiedthatutilizingacombinationofCSandDRresourcesimprovedvoltagessignificantly.ACSoutputof4.5MWandleveragingDRresourcesensuredallprimarytransformervoltageswerewithinplanningcriterialowerlimits.UtilizingCSresourcesexclusivelydidprovidemarginalimprovementsinfeedervoltageathighCSpenetrationlevelsbutdidnotensureallprimarytransformervoltageswerewithinplanningcriterialowerlimits.Furthermore,controllingDRresourcesexclusivelyresultedinmarginalimprovementinprimarytransformervoltagesbutdidnotcompletelyensureallprimarytransformersvoltageswerewithinplanningcriterialowerlimits.
ThisanalysisutilizedverysimpleDRcontrolalgorithmstoshiftHVACandEHWHloadsoutsideofpeakloadingperiods.InthisanalysisitwasassumedthatallavailableHVACandEHWHunitsparticipatedinthedemandresponseprogram.Furthermore,CSresourcesanddistributivegenerationweremodeledusingidealPVgenerationoutputs.
Analysisidentifiedthefollowingresults:
• AcombinationofDRandCSresourcessignificantlyimprovestransformerprimaryvoltagescomparedtothebasecase.
• UtilizingDRresourcesandaCSfacilityof4.5MWensuredalltransformerprimaryvoltageswereaboveRange-Alowerlimits.
• ACSfacilitywithanoutputof9MWmarginallydecreasesthenumberoftransformerswithlowvoltagesbelowRange-Alimitsbefore7:00PM.However,theoutputof9MWCSfacilityprovidesinsufficientvoltagesupporttomitigatelowvoltagesafter7:00PM.

16
• ControllingDRresourcesmarginallydecreasesthenumberoftransformerswithprimaryvoltagesbelowtheRange-Alowerlimit.ControllingDRresourcesresultsinvoltagesabovethedesigncriteriaforinstancesbefore4:00PMandafter7:15PM.
Thesimplicityofthecontrolalgorithmsusedinthemodelingisencouragingandmayindicatethatmoreautomatedandcoordinatedcontrolstrategiesusingintra-dayfeedbackcouldyieldimprovedresults,comparedtothedeterministictime-of-daycontrolstrategiesmodeledinthispaper.Thistypeofscenariosuggestsananalysisforfutureinvestigation.
WhiletheanalysisdidprovidesomeveryinterestingresultsregardingthecombinationofcommunitysolarplusDR,andtheircapabilitytoworkinconcerttomitigatefeederissues,thereisstilladoseofrealitythatmustbeconsidered.SomehypothesesaroundPVinstallationsbelievethatsolaralonecouldbeapossibleresourcetopossiblydeferfeederupgrades.Inthismodel,thesolarinstallationdidmitigatesomelowvoltageissues,butfellshortasthesunwassettingwhenwebegantoagainseethevoltageissuesweweretryingtomitigate.Alsodemandresponse,traditionallyusedasapeakingresourceforthebulkelectricsystem,onlydidamarginaljobonmitigatingvoltageissuesonthedistributionfeederitself.Additionalengineeringandsolar-plusmeasurescouldachieveagriddeferralinsomecases,butasthisanalysissuggests,thatwouldnotbeasimpleundertaking,atbest.
ThepurposeofthisstudywastoinvestigatethefeasibilityofutilizingCSandDRresourcestomitigatelowvoltagesresultingfromnormaldistributionfeederloadgrowth.Forthecircuitthatprovidedthebasisforthisstudy,actualmeasuretakentomitigatevoltageissuesincluded:
• Relocatinganexistingoverhead1200kVARcapacitorbank• Installinganewpad-mounted1800kVARcapacitorbank• Transferringasingle-phasefromtheB-phasetotheC-phase.
Asidefromtheinstallationofthe1800kVARvoltagecontrolledcapacitor,theidentifiedsystemimprovementsrepresentmarginable,inexpensivesolutions.Itwouldbehighlyunrealistictousethisproblemaloneasanargumenttoinstallamulti-milliondollarcommunitysolararrayandimplementacustomer-facingDRprogramwithtechnologyandprogramadministrationassociatedcosts.Additionally,whilethe4.5-MWarrayseemsidealforthisapplication,thereareseveralotherconsiderationsprerequisitetoanyconstructiondecision.Forexample,thesizeofthearraymight,fromatechnicalstandpoint,alsobedependentonthefeedertowhichitisinterconnected,andpossiblyevenonthehostingcapacityofthatfeeder.Landuseandbusinessfactors,marketing,andprogramdesignconsiderationsalsowouldcomeintoplaypriortoanysolardevelopmentdecision.
WouldaddingalargesolararrayandDRprogrambeacosteffectivesolutionforthevoltageimbalancesonthiscircuit?Inaword,no.However,theevidenceisclearthatasolar-plusstrategywouldnot,inthiscase,beatechnicalimpediment.Rather,itcouldsupporttheutility’scommitmenttosystemreliability.Itisimportanttolookatprogramssuchascommunitysolar,DRandenergyefficiencyholistically,andoutsidethetraditionaloperationalandplanningsilosthatexistatmanyutilities.

17
Relevantquestionsforfurtherconsiderationinclude:
! Doestheutilitydesiremorecommunity-scalesolar,inthe500-kW-to10-MWrange?
! Wouldacommunitysolarimplementationmodelhelpmovemorecustomersolarfromtherooftop(whereitisgenerallyinvisibleandnon-strategic)totheutility’spreferredscaleandlocations?
! Doestheutilityhaveenergyefficiencyorloadmanagementdesiresorrequirements?
! ArethereprogramobjectivesthatneedtobemetforStaterequirements?
! Doestheutilityhaveacleanelectrificationinitiative?TheintroductionofDRandstoragemeasures,suchasgrid-interactiveelectricwaterheaters,controlledHVAC,icestorage,andstrategicelectricvehicle(EV)programscouldsupportgreateruseofelectricity,inanageofrisingrenewable-energypenetration.
! Doestheutilityforeseehavingagreenhousegasmitigationplan?
! DoestheutilityIntegratedResourcePlan(IRP)callformoreDRorrenewableresources?
Alltheseareimportantconsiderationsinlookingforopportunitiestoimplementnewdistributedresourceprojectsandprograms,whilemaintainingreliabilityandoptimizationoftheutility’sdistributionsystem,toensurequalityservicetoallcustomers.

18
About the Authors Santiago Sena is a distribution system engineer with PNM in Albuquerque, NM. Jon Hawkins is manager of advanced technology and strategy for PNM Resources, and has participated with the Community Solar Value Project (CSVP) as a member of its Utility Forum, leading the exploration of opportunities to create greater net benefits from solar-plus storage and demand response measures. Jill Cliburn is the Principal Investigator of the CSVP. John Powers is the Project Officer of the CSVP. About the Community Solar Value Project The Community Solar Value Project aims to increase the scale, reach, and value of utility-based community solar programs by using strategic solar technologies, siting, and design, improving procurement strategies, target marketing, and integrating suitable companion measures, such as demand-response and storage into broad program designs. The project is led by the San Francisco-area energy consulting and analytics firm Extensible Energy, LLC, with support from Cliburn and Associates, LLC, Olivine, Inc., and Navigant Consulting. Utility participants include the Sacramento (California) Municipal Utility District (SMUD), Public Service of New Mexico, and other utilities nationwide. The project is powered by SunShot, under the Solar Market Pathways program of the U.S. Department of Energy. Contact: http://www.communitysolarvalueproject.com; [email protected] Acknowledgment The information, data, or work presented herein was funded in part by the Office of Energy Efficiency and Renewable Energy (EERE), U.S. Department of Energy, under Award Number DE-EE0006905. Disclaimer This modeling project report a product of the Community Solar Value Project. As such, it is intended for review by project stakeholders and as a means to further the development of the technical and market strategies proposed herein. This work is not expressly endorsed or accepted by PNM. The information, data, or work presented herein was funded in part by an agency of the United States Government. Neither the United States Government nor any agency thereof, nor any of their employees, makes any warranty, express or implied, or assumes any legal liability or responsibility for the accuracy, completeness, or usefulness of any information, apparatus, product, or process disclosed, or represents that its use would not infringe privately owned rights. Reference herein to any specific commercial product, process, or service by trade name, trademark, manufacturer, or otherwise does not necessarily constitute or imply its endorsement, recommendation, or favoring by the United States Government or any agency thereof. The views and opinions of authors expressed herein do not necessarily state or reflect those of the United States Government or any agency thereof.