community profiles for west coast and north pacific ... profiles for west coast and north pacific...
TRANSCRIPT

Community Profiles for West Coast and North Pacific Fisheries - Washington, Oregon, California, and other U.S.
States Karma Norman, Jennifer Sepez, Heather Lazrus, Nicole Milne, Christina Package,
Suzanne Russell, Kevin Grant, Robin Petersen, John Primo, Megan Styles, Bryan Tilt, Ismael Vaccaro
Socioeconomics Program Northwest Fisheries Science Center
Economics and Social Sciences Research Program Alaska Fisheries Science Center
For additional copies or other information, contact
Karma Norman Socioeconomics Program
Northwest Fisheries Science Center NOAA fisheries/ National Marine Fisheries Service
2725 Montlake Blvd. East Seattle, WA 98112-2097
(206) 302-2418
Jennifer Sepez and Christina Package Economic and Social Sciences Research Program
Alaska Fisheries Science Center NOAA Fisheries/National Marine Fisheries Service
7600 Sand Point Way NE Seattle, WA 98115
(206) 526-6546 (206) 526-4221
Community Profiles for West Coast and North Pacific Fisheries - Washington, Oregon, California, and other U.S. States Karma Norman, Jennifer Sepez, Heather Lazrus, Nicole Milne, Christina Package, Suzanne Russell, Kevin Grant, Robin Petersen, John Primo, Megan Styles, Bryan Tilt, Ismael Vaccaro Socioeconomics Program Northwest Fisheries Science Center Economics and Social Sciences Research Program Alaska Fisheries Science Center Abstract:
This document profiles 125 fishing communities in Washington, Oregon, California, and other U.S. states, with basic information on social and economic characteristics. Various federal statutes, including the Magnuson-Stevens Fishery Conservation and Management Act and the National Environmental Policy Act, among others, require federal agencies to examine the social and economic impacts of policies and regulations. These profiles can serve as a consolidated source of baseline information for assessing community impacts in these states.
The profiles are given in a narrative format that includes four sections: People and Place, Infrastructure, Involvement in West Coast Fisheries, and Involvement in North Pacific Fisheries. People and Place includes information on location, demographics (including age and gender structure of the population, racial and ethnic make up), education, housing, and local history. Infrastructure covers current economic activity, governance (including city classification, taxation, and proximity to fisheries management and immigration offices) and facilities (transportation options and connectivity, water, waste, electricity, schools, police, public accommodations, and ports). Involvement in West Coast Fisheries and Involvement in North Pacific Fisheries detail community activities in commercial fishing (processing, permit holdings, and aid receipts), recreational fishing, and subsistence fishing. To define communities, we relied on Census place-level geographies where possible, yielding 125 individual profiles.
The communities were selected by a process that assessed involvement in commercial fisheries using quantitative data from the year 2000, in order to coordinate with 2000 U.S. Census data. The quantitative indicators looked at communities that have commercial fisheries landings (indicators: weight and value of landings, number of unique vessels delivering fish to a community) and communities that are home to documented participants in the fisheries (indicators: state and federal permit holders and vessel owners). Indicators were assessed in two ways, once as a ratio to the community’s population, and in another approach, as a ratio of involvement within a particular fishery. The ranked lists generated by these two processes were combined and communities with scores one standard deviation above the mean were selected for profiling.
The communities selected and profiled in this document are, in Washington: Aberdeen, Anacortes, Bay Center, Bellingham, Blaine, Bothell, Cathlamet, Chinook, Edmonds, Everett, Ferndale, Fox Island, Friday Harbor, Gig Harbor, Grayland, Ilwaco, La Conner, La Push, Lakewood, Long Beach, Lopez, Mount Vernon, Naselle, Neah Bay, Olympia, Port Angeles, Port Townsend, Raymond, Seattle, Seaview, Sedro-Woolley, Sequim, Shelton, Silvana, South Bend, Stanwood, Tacoma, Tokeland, Westport, and Woodinville; in Oregon: Astoria, Bandon, Beaver, Brookings, Charleston, Clatskanie, Cloverdale, Coos Bay, Depoe Bay, Florence, Garibaldi, Gold Beach, Hammond, Harbor, Logsdon, Monument, Newport, North Bend, Pacific City, Port Orford, Reedsport, Rockaway Beach, Roseburg, Seaside, Siletz, Sisters, South Beach, Tillamook, Toledo, Warrenton, and Winchester Bay; and in California: Albion, Arroyo Grande, Atascadero, Avila Beach, Bodega Bay, Corte Madera, Costa Mesa, Crescent City, Culver City, Dana Point, Dillon Beach, El Granada, El Sobrante, Eureka, Fields Landing, Fort Bragg, Half Moon Bay, Kneeland, Lafayette, Long Beach, Los Angeles, Los Osos, Marina, McKinleyville, Monterey, Morro Bay, Moss Landing, Novato, Oxnard, Pebble Beach, Point Arena, Port Hueneme, Princeton, San Diego, San Francisco, San Jose, San Pedro, Santa Ana, Santa Barbara, Santa Cruz, Santa Rosa, Sausalito, Seaside, Sebastopol, Sunset Beach, Tarzana, Terminal Island, Torrance, Trinidad, Ukiah, Valley Ford, and Ventura. Two selected communities were located in other states: Pleasantville, New Jersey, and Seaford, Virginia.


Community Profiles for West Coast Fisheries -
Washington, Oregon, California, and other U.S. States Karma Norman, Jennifer Sepez, Heather Lazrus, Nicole Milne, Christina Package,
Suzanne Russell, Kevin Grant, Robin Petersen, John Primo, Megan Styles, Bryan Tilt, Ismael Vaccaro
Socioeconomics Program Northwest Fisheries Science Center
Economics and Social Sciences Research Program Alaska Fisheries Science Center
CONTENTS 0.0 Abstract 1.0 INTRODUCTION
1.1 Overview 1.2 Related Projects 1.3 Acknowledgements
2.0 METHODS 2.1 Determining Fishing Dependence and Engagement 2.2 Selection of Communities for Profiling 2.3 Indicators, Data Envelopment Analysis (DEA), and the Community Selection Process
2.3.1 DEA Results 2.4 Site Visits 2.5 Profile Structure and Sources 2.6 Figures and Graphs 2.7 Community Comments
3.0 PROFILES 3.1 Washington
Aberdeen Anacortes Bay Center Bellingham
Blaine Bothell Cathlamet Chinook Edmonds Everett Ferndale Fox Island Friday Harbor Gig Harbor Grayland Ilwaco La Conner La Push Lakewood Long Beach

Lopez Mount Vernon Naselle Neah Bay Olympia Port Angeles Port Townsend Raymond Seattle Seaview Sedro-Woolley Sequim Shelton Silvana South Bend Stanwood Tacoma Tokeland Westport Woodinville
3.2 Oregon Astoria Bandon Beaver Brookings Charleston Clatskanie Cloverdale Coos Bay Depoe Bay Florence Garibaldi Gold Beach Hammond Harbor Logsdon Monument Newport North Bend Pacific City Port Orford Reedsport Rockaway Beach Roseburg Seaside Siletz Sisters South Beach Tillamook Toledo Warrenton Winchester Bay
3.3 California Albion Arroyo Grande
Atascadero Avila Beach Bodega Bay Corte Madera Costa Mesa Crescent City Culver City Dana Point Dillon Beach El Granada El Sobrante Eureka Fields Landing Fort Bragg Half Moon Bay Kneeland Lafayette Long Beach Los Angeles (including San Pedro and Terminal Island) Los Osos Marina McKinleyville Monterey Morro Bay Moss Landing Novato Oxnard Pebble Beach Point Arena Port Hueneme Princeton San Diego San Francisco San Jose Santa Ana Santa Barbara Santa Cruz Santa Rosa Sausalito Seaside Sebastopol Sunset Beach Tarzana Torrance Trinidad Ukiah Valley Ford Ventura
3.4 Other States Pleasantville, New Jersey Seaford, Virginia
4.0 REFERENCES 5.0 APPENDICES 5.1 Appendix A: Invalid Communities due to DEA Non-Convergence
5.2 Appendix B: Place-Based Communities

5.3 Appendix C: Authors 5.4 Appendix D: Glossary of Abbreviations 6.0 INDEX OF COMMUNITIES LIST OF TABLES AND FIGURES
1.0 INTRODUCTION 1.1 Overview
This document profiles 125 communities that are significantly involved in commercial fisheries in the marine environs of Alaska, Washington, Oregon, and California, including state- and federally-managed waters along the coastlines of these states. For the purposes of this project, these latter areas are collectively referred to as the West Coast, indicative of the Pacific coastlines of Washington, Oregon, and California. We refer to the marine environs surrounding Alaska as the North Pacific. In terms of fisheries management, the West Coast fisheries areas to which we refer are under the purview of the Pacific Fishery Management Council (PFMC). Management of the North Pacific areas in which we are interested is handled by the North Pacific Fishery Management Council (NPFMC).
To distinguish the marine fishing areas of the West Coast from the terrestrial coastal and inland areas in which the communities are actually situated, we refer to these inland areas as the Western States. Many residents of Western State communities profiled here participate in the fisheries of both the West Coast and the North Pacific (namely, the Bering Sea and Aleutian Islands [BSAI], and the Gulf of Alaska [GOA]). This reality is reflected in the community profiles contained within this document. This volume is preceded by a document (Sepez et al., 2005) that profiles Alaska communities that are involved in North Pacific fisheries. Fishing Communities in Law and Policy
A variety of federal laws make clear the imperative for the National Marine Fisheries Service (NMFS) to consider the human communities that are involved in fisheries.
National Standard 8 of the Magnuson-Stevens Fishery Conservation and
Management Act (MSFCMA) states: Conservation and management measures shall, consistent with the conservation requirements of this Act (including the prevention of overfishing and rebuilding of overfished stocks), take into account the importance of fishery resources to fishing communities in order to (A) provide for the sustained participation of such communities, and (B) to the extent practicable, minimize adverse economic impacts on such communities.
In addition, the National Environmental Policy Act (NEPA) requires that agencies assess the impacts of major federal actions on the environment, including the human environment. Typically, an Environmental Impact Statement (EIS) will include a description of the social environment, and an assessment of the impacts of alternative policy choices on that environment.
Other laws and policies mandating attention to impacts on human communities include Executive Order 12898 on Environmental Justice, which directs agencies to assess impacts that may disproportionately affect low income and minority populations; Executive Order 12866 on Regulatory Planning and Review, which requires agencies to assess the costs and benefits of proposed regulations and alternatives; and the Regulatory

Flexibility Act (RFA), which requires agencies to assess impacts of proposed policies on regulated small entities, meaning small businesses, organizations, and governmental jurisdictions as defined in the RFA and the Small Business Act.1
In order to facilitate implementation of these laws, and improve available information on affected communities, the National Marine Fisheries Service (NMFS) is currently engaged in a nation-wide effort to profile fishing communities. Analyses of social impacts often use a geographic scale larger than the community, such as county or region, to analyze the data. These decisions are generally due to the greater availability of data at these geographic levels, and because the resources are not available to conduct analyses with finer geographical resolutions. Detailed analysis at the community level usually focuses on those communities that are most likely to experience the most significant impacts -- an approach that is entirely appropriate given the limited time allotted to most impact assessments. Thus, there are dozens of communities that may be impacted by policy matters that cannot be analyzed on an individual basis.
For the North Pacific, in addition to regional economic profiles (Northern Economics, Inc., and EDAW, Inc. 2002) and detailed profiles of a subset of communities most heavily involved in federal fisheries2, one hundred and thirty-six Alaska communities involved in North Pacific fisheries have been described at the community level (Sepez et al., 2005). For Western states communities involved in fisheries, only county-level profiles are available (Langdon-Pollock 2004) and only West Coast (non-North Pacific) fishing is documented in those profiles. The profiles given here may be particularly useful in providing basic information on some of the fishing communities not included in existing reports.
Fishing Community Profiles
The profiles of Western states fishing communities in this document are part of the aforementioned national endeavor, and form the first phase of the Northwest Fisheries Science Center’s (NWFSC) efforts and the Alaska Fisheries Science Center’s (AFSC) continuing efforts. The AFSC has already compiled 130 profiles including 136 Alaskan fishing communities. Selected information from these profiles will be entered into the national database, along with information from communities across the nation profiled by other Fisheries Science Centers, which will be updated on a regular basis.
The fisheries considered in these profiles include both state and federal fisheries in the commercial, recreational, and subsistence sectors. This is, in part, because from the 1 “’Small businesses’ are defined in section 3 of the Small Business Act, 15 U.S.C. 632, and in the SBA's regulations at 13 C.F.R. 121.201 (2002). 5 U.S.C. 601(3). ‘Small organizations’ are any not-for-profit enterprises that are independently owned and operated and not dominant in their fields (for example, private hospitals and educational institutions). 5 U.S.C. 601(4). ‘Small governmental jurisdictions’ are governments of cities, counties, towns, townships, villages, school districts, or special districts with a population of less than 50,000. The size standard used by the Small Business Administration to define small businesses varies by industry; however, the SBA uses the ‘fewer than 500 employees’ cut off when making an across-the-board classification.” Quoted from the U.S. Equal Employment Opportunity Commission Regulatory Flexibility Act Procedures posted at http://www.eeoc.gov/policy/regflexibilityact.html. 2 Community-level profiles are included in the Social Impact Assessment sections of various NMFS Environmental Impact Statements. See the NMFS Alaska Groundfish Fisheries Revised DRAFT Programmatic Supplemental Environmental Impact Statement (September 2003) at http://www.fakr.noaa.gov/sustainablefisheries/seis/intro.htm for an example profile.
perspective of a community dependent on or engaged in fishing, whether a particular fishery is under state or federal jurisdiction is of less importance to the health and resilience of the community than the strength and sustainability of the fishery itself. Furthermore, it can sometimes be challenging to utilize available databases to identify whether a documented fish delivery was taken under a state or federal fishery. This occurs particularly where there are parallel seasons for the same species and gear types, and much of the available information concerning involvement in fisheries is not fishery-specific. This combined state and federal approach is the recommended method for the national profiling project. The NWFSC and AFSC profiles will be compliant with the larger effort.
The communities profiled in the document were selected by a quantitative assessment method described in detail below. This method was based entirely on commercial fisheries data because this is what was available in a usable and relatively consistent form. However, recognizing that in the life of a community, recreational and subsistence fishing may be of great importance socially, culturally, and economically, these community profiles include information on recreational and subsistence fishing activities as part of the narrative. In future efforts, indicators of recreational and subsistence fisheries will be quantified and included in the selection process as practicable, as well as maintained in the narrative. Sportfishing selection criteria may include the number of sportfish charter boats operating or making landings in a community, and the number of sportfishing licenses sold in the community or held by residents. Subsistence fishing selection criteria may include the percentage of local households participating in subsistence fishing, making subsistence fishery landings, or using subsistence fishery resources.
Joint AFSC/NWFSC Community Profiles Justification
This document represents the outcome of a joint project between the NWFSC and the AFSC. All 125 communities profiled in this document are involved in either West Coast or North Pacific fisheries. Several are involved in both. Because many communities involved in fisheries in the North Pacific are not located in Alaska, they were not included in the AFSC’s earlier initiative to profile 136 Alaska fishing communities.
Similarly, a document entitled Faces of the Fisheries, produced in 1994 by the North Pacific Fishery Management Council, profiled communities in Alaska, Washington, and Oregon and characterized singularly their involvement in North Pacific commercial fisheries. The Faces of the Fisheries document did not characterize the involvement of these communities, notably those in the Western states of Oregon and Washington, in the adjacent marine fisheries of the West Coast.
Therefore, this document includes communities outside of Alaska, which were involved in the West Coast and North Pacific fisheries, and represents communities in Washington (40 communities), Oregon (31 communities), California (52 communities), New Jersey (1 community), and Virginia (1 community).
Taken together, the AFSC’s Community Profiles for North Pacific Fisheries – Alaska (Sepez et al., 2005) and this document present what may be considered an enhanced update of the Faces of the Fisheries. The two documents describe the linkages
between Alaskan communities and North Pacific fisheries, as well as Western states communities and their involvement in both North Pacific and West Coast fisheries.
Because the selection and analysis of communities relies on population data from the U.S. Census, it is proposed that the narrative portion of this document be updated again when new population and demographic information becomes available following the 2010 U.S. Census. Fisheries information that is available and updated annually is being maintained in a separate database currently in preparation. 1.2 Related projects Other Regional Offices and Science Centers are also in the process of profiling communities involved in commercial fisheries, including, notably, the companion document and template for this effort, the Community Profiles for North Pacific Fisheries-Alaska (Sepez et al., 2005). Nationally, NMFS has begun an effort to develop a model or set of statistical methodologies that will aid in analyzing community data for profiling in all fisheries regions. The profiling of communities involved in fishing is related to, but is not necessarily the same as, the designation of Fishing Communities according to the definitions of the MSFCMA. The process for designating MSFCMA Fishing Communities is at present being drafted by NMFS social science staff. It will likely bear similarities to the process used in this project to decide which communities to profile, but it will also have significant differences. The results of the MSFCMA Fishing Communities designation process may have an effect on which communities are selected for profiling when this document is updated. Finally, there are a number of projects that have been undertaken by management Councils, Commissions, and other fisheries management and information groups that involve narrative profiling of fishing communities. These include the 2004 West Coast Marine Fishing Communities, completed at the county-level by Jennifer Langdon-Pollock of the Pacific States Marine Fisheries Commission (funded by NMFS and the Pacific Fisheries Management Council); the 2001 New England’s Fishing Communities by Madeleine Hall-Arber et al. at the MIT Sea Grant Program, funded by the Marine Fisheries Initiative (MARFIN) of the National Marine Fisheries Service; the 2004 Mid-Atlantic Fishing Communities by Bonnie McCay et al.; the Faces of the Fisheries produced by the North Pacific Fishery Management Council; and 2005’s Comprehensive Baseline Commercial Fishing Community Profiles: Unalaska, Akutan, King Cove and Kodiak, Alaska, authored by EDAW and Northern Economics, Inc. 1.3 Acknowledgements This project could not have been completed without the generous assistance of a number of people and institutions. The NWFSC, AFSC, and Southwest Fisheries Science Center (SWFSC) provided funding, staff time, and support services for this project. Pacific States Marine Fisheries Commission provided personnel and administrative support under a cooperative agreement with AFSC. The NOAA Fisheries/National Marine Fisheries Service (NMFS) Northwest Regional Office, NOAA Alaska Region RAM Division (Restricted Access Management), and Pacific Coast Fisheries Information

Network (PacFIN) provided data and advice. The Washington Department of Fish and Wildlife (WDFW), the Oregon Department of Fish and Wildlife (ODFW), the California Department of Fish and Game (CDF&G), the Alaska Department of Fish and Game (ADF&G), and the Alaska Commercial Fisheries Entry Commission (CFEC) provided an extensive amount of data through both online sources and by filling special requests. These institutions also provided advice and clarification with regard to their data when needed. Terry Hiatt and Patrick Marchman were instrumental in examining and organizing the data for our analytical needs, and Ron Felthoven spearheaded the Data Envelopment Analysis (DEA) we ultimately used in our community selection process. The University of Washington’s (UW) program in Environmental Anthropology and its School of Marine Affairs provided personnel, and access to UW resources. Additional personnel joined the project from Anthropology departments at the University of Georgia and the Oregon State University.
In addition, the team wishes to acknowledge the following people who provided advice or assistance to the project: Susan Abbott-Jamieson, Mark Blaisdell, Merrick Burden, Courtney Carothers, Dave Colpo, William Daspit, Jane DiCosimo, Toni Fratzke, Peter Fricke, James Hastie, Nicole Kimball, Kevin Kinnan, Steve Koplin, Jennifer Langdon-Pollock, Peggy Murphy, Joe Terry, and Sherrie Wennberg. These individuals helped inform and improve this work, but the authors alone are responsible for any errors contained herein.

2.0 METHODS
The task of compiling a document about the communities involved in West Coast and North Pacific fisheries, an area of vast scale and diversity, presented several methodological challenges. The complexity of describing communities that may be active in these two regions, as well as in both state- and federally-managed fisheries, is reflected in the research methods we used. In compiling profiles of communities, our goal has been to bring together data from disparate sources in order to produce a document that can serve as a baseline of data for policy analysts, stakeholders, and decision-makers, and a starting point for social scientists conducting more complex analytical research. In this section, the research methods, including the community selection process, data sources, and how the data was treated, are explained in detail. In many cases, online data sources that are available to any researcher were used, and these are cited in this section as footnotes or in the profiles themselves. In other cases, specific data requests were made to management agencies in order to obtain the necessary information. Unless otherwise stated, all data pertains to the year 2000, which is also the year for which socioeconomic information is available from U.S. Census. This section also discusses some of the methodological challenges our team confronted during the course of the project, and explains how they were resolved. 2.1 Determining Fishing Dependence and Engagement
The joint Northwest Fisheries Science Center and Alaska Fisheries Science Center project is an effort to profile communities that are significantly involved in commercial fisheries in the marine environs of Alaska, Washington, Oregon, and California, including state- and federally-managed waters along the coastlines of these states.
As well as being selected on the basis of involvement in two different management regions, communities were selected by two different measurements of fishery participation. These measurements are indicative of 1) the community’s dependence on fishing and 2) the community’s engagement in a specific fishery. The selection process represents both the Alaska Fisheries Science Center and the Northwest Fisheries Science Center’s experimental approach towards quantifying fishing involvement. However, it is not the only way of estimating participation nor is it the singular approach sanctioned by NOAA Fisheries. In effect, the project described here presents a novel and defensible means of quantifying the legal language spelled out in the MSFCMA:
The term "fishing community" means a community which is substantially dependent on or substantially engaged in the harvest or processing of fishery resources to meet social and economic needs, and includes fishing vessel owners, operators, and crew and United States fish processors that are based in such community. 16 U.S.C. 1802 §3 (16). In this project, the terms dependence and engagement are quantitatively defined,
and then used in the community selection process for profile production. A community’s dependence on fishing is:
a measure of the level of participation in a fishery relative to other community activities, and relative to all other communities linked to fishing in some way.
A community’s engagement in fishing is: a measure of the level of participation relative to the overall level of participation
in a fishery.
We used two approaches to measure levels of involvement in the region: dependence on commercial fisheries and engagement in commercial fisheries. To this end, we formally presented our definitional and methodological approach to “dependence” and “engagement” with social scientists at other National Marine Fisheries Service Science Centers. In this study, dependence has been determined through a comparison of community involvement in fishing to community population. Engagement is determined by comparing indicators that measure a community’s participation in a fishery or fisheries relative to the aggregate participation in a fishery or fisheries. Engagement refers to community participation by specific fishery, which required us to separate data by fishery for each data element (e.g., weight or value of landings). In this case, all landings made in a community are broken down by fishery, and the community’s relative involvement in a specific fishery is measured.
The specific fisheries used to indicate engagement are different for the North Pacific and West Coast fisheries, reflecting the diversity of the regions. For the North Pacific, these categories represent the major fisheries management plan (FMP) categories of the North Pacific Fishery Management Council (crab, BSAI groundfish, GOA groundfish, scallops), other major fisheries in Alaska (halibut, herring, salmon), and all remaining fisheries in Alaska divided between finfish and shellfish (other finish, other shellfish). For the West Coast we followed the convention used by the database maintained by the Pacific Fisheries Information Network (PacFIN), our primary data source for commercial fishing data. PacFIN uses Federal Management Groups to categorize species together under eight species rubrics: coastal pelagic, crab, groundfish, highly migratory species, salmon, shellfish, shrimp, and other species. These categories are further broken down by state to specify state management of each species. Data related to the federally managed groundfish fishery was included as a separate category as well.
Determining fishing dependence and engagement involves considering multiple dimensions of fishing history, infrastructure, specialization, social institutions, and gentrification trends in addition to economic characteristics. Due to the limitations of available data, our quantitative measurements of dependence and engagement have been based only on data about commercial fish landings, permit holdings, and vessel ownership for the West Coast and North Pacific fisheries. However, in recognition that such indicators only provide a partial picture of fishing involvement, we have included historical, demographic, and other qualitative information in the narrative profiles. Importantly, while each community profile is intended to stand alone, fishing communities are not economic or social isolates but contributing partners to regional (and often international) networks of labor pools, marine services, fisheries knowledge, and other socioeconomic phenomena (Sepez et al., 2006).
2.2 Selection of Communities for Profiling Hundreds of communities located in the Western states of the U.S. and other areas are involved in commercial fishing off the coasts of Washington, Oregon, California, and Alaska, and would therefore be worthy of profiles reflecting their involvement in West Coast and North Pacific commercial fisheries. Nevertheless, in any large scale analysis, time and budgets are always constrained. The profiles presented here required a defensible methodological approach to limiting their numbers.
Using a quantitative selection process we reduced the number of communities to be profiled to a more manageable quantity. The list of profiled communities consists of those which demonstrated the highest involvement in commercial fisheries, relative to the others. An array of quantitative indicators based on permit and landings data from the year 2000 were used to measure a variety of types of involvement in West Coast and North Pacific fisheries. According to the MSFCMA, a fishing community is a place-based community that is "…substantially dependent on or substantially engaged in the harvest or processing of fishery resources to meet social and economic needs, and includes fishing vessel owners, operators, and crew and United States fish processors…”3 While this definition includes commercial, recreational, and subsistence fishing, data on recreational and subsistence fishing were not consistently available for all states and therefore could not be incorporated in the selection process for communities to be profiled in this project. The profiled communities were selected on the basis of their involvement with commercial fishing only. Information on recreational and subsistence fisheries was added to the community narratives wherever possible given the availability of relevant data. In the selection process, however, our indicators referred entirely to dependence and engagement in commercial fishing.
Up to ninety-two quantitative indicators of commercial fishing involvement in the West Coast and the North Pacific were used in the community selection process. The 92 indicators include information specific to state- and federally-managed commercial fisheries, across various species and different types of involvement in those fisheries, for Alaska, Washington, Oregon, and California. These indicators showed communities that have landings in different commercial fisheries and communities that are home to vessel owners as well as both state and federal permit holders. Additional data, which we were unable to include in the selection process for a variety of reasons, was included in the community profiles themselves (detailed below in Section 2.4)
Datasets were selected on the basis of availability and informational value. The community selection process used particular indicators chosen from all the available datasets to best indicate a high level of involvement in commercial fisheries. One of the difficult aspects of interpreting the plethora of data that were obtained was analyzing all of the indicator values simultaneously. It is easy to rank the communities’ involvement when analyzing one indicator at a time; greater values imply greater involvement. However, when one considers multiple indicators, one must determine how to weight and aggregate the level of involvement across all such indicators to gauge total involvement. Although this is a daunting and complex task, we felt it was important to consider the full range of involvement in fisheries simultaneously. By doing so we would avoid 3 16 U.S.C. 1802 §3 (16), from the Federal Register
overlooking communities that do not stand out in any one particular area (indicator value), but are actively engaged in a broad range of fishing activities.
For this reason, we developed a quantitative selection process based on Data Envelopment Analysis (DEA). DEA is a mathematical programming technique that allows one to compare multivariate data from several entities (here, communities) and rank each entity relative to one another according. In our context, this ranking was based on involvement in fisheries, which was represented by the various indicators we had compiled. We constructed two separate DEA models to rank communities according to two different set of indicators; the first model ranked communities according to dependence, and the second model generated rankings based on engagement (as explained in more detail below in Section 2.3).
The results of each model included a score for each community in the analysis.4 These scores ranged between zero and one, with one being the highest possible score (indicating higher dependency on or engagement in fishing), and zero being the lowest possible score (indicating lower dependency on or engagement in fishing). The communities were then ranked in descending order to generate a list of communities that were dependent or engaged in commercial fishing to varying degrees.
The second step in the selection process was to determine the break point for the most dependent or engaged communities, which would subsequently be profiled. To do this we first computed the mean and standard deviation (SD) for each set of model results (scores). All communities whose score was one SD or more above the mean were selected for profiling. This threshold was selected not for theoretical reasons, but for practical purposes. It produced a list of communities of manageable size, which given the time and budget limitations of the project had been estimated to be between 100 and 150 communities.
We identified 125 communities outside of Alaska through this process. Alaska communities were not considered because they had already been selected and profiled by the Alaska Fisheries Science Center (Sepez et al., 2005). The policy needs of the Southwest Fisheries Science Center (SWFSC) dictated that certain centers of fisheries landings be included in the West Coast analysis. These communities were: in Washington – Chinook, Ilwaco, and Westport; in California – Monterey, Moss Landing, Port Hueneme, San Pedro, Santa Barbara, Terminal Island, and Ventura; and in Oregon – Astoria. Nevertheless, all community profiles specifically requested by the SWFSC appeared in the DEA model, and had scores equal to or greater than one standard deviation above the mean. This meant that the specifically identified communities would have occurred anyway, given the approach to analysis that we ultimately used. Census Place-Level Communities and Non-Census Place Level Communities
The place-based, community-level focus of this project makes it unique among comprehensive documents on fishing participation along the West Coast. However, it is 4 We were unable to compute a score for some communities in each of the two models. In some cases this occurred because we had no data for the specific indicators used in the DEA model (although the community may have been involved in fisheries in other ways). In other instances we had the necessary data, but ran into computational issues related to the particular indicator mix and the scale of the different indicators relative to other communities. These communities were removed from the analysis after analyzing each in a more qualitative manner. For a list of the communities that were removed and the reason for their removal see Appendix A: Communities Removed due to DEA Non-Convergence.
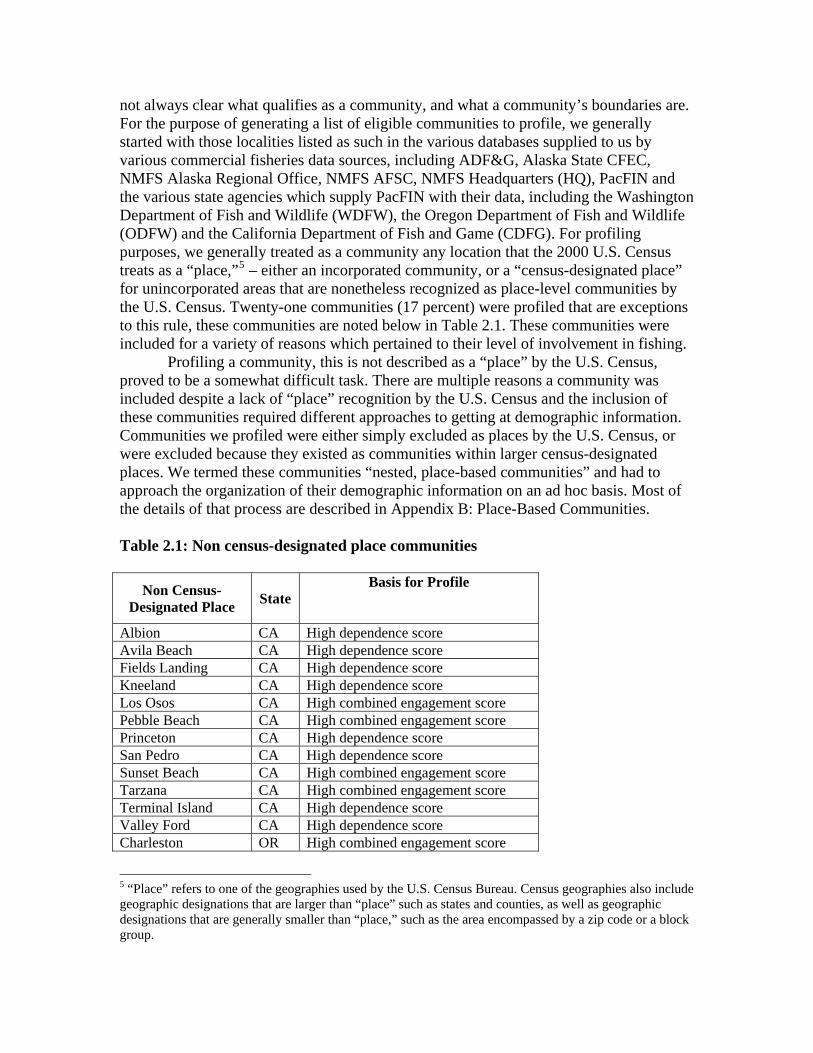
not always clear what qualifies as a community, and what a community’s boundaries are. For the purpose of generating a list of eligible communities to profile, we generally started with those localities listed as such in the various databases supplied to us by various commercial fisheries data sources, including ADF&G, Alaska State CFEC, NMFS Alaska Regional Office, NMFS AFSC, NMFS Headquarters (HQ), PacFIN and the various state agencies which supply PacFIN with their data, including the Washington Department of Fish and Wildlife (WDFW), the Oregon Department of Fish and Wildlife (ODFW) and the California Department of Fish and Game (CDFG). For profiling purposes, we generally treated as a community any location that the 2000 U.S. Census treats as a “place,”5 – either an incorporated community, or a “census-designated place” for unincorporated areas that are nonetheless recognized as place-level communities by the U.S. Census. Twenty-one communities (17 percent) were profiled that are exceptions to this rule, these communities are noted below in Table 2.1. These communities were included for a variety of reasons which pertained to their level of involvement in fishing.
Profiling a community, this is not described as a “place” by the U.S. Census, proved to be a somewhat difficult task. There are multiple reasons a community was included despite a lack of “place” recognition by the U.S. Census and the inclusion of these communities required different approaches to getting at demographic information. Communities we profiled were either simply excluded as places by the U.S. Census, or were excluded because they existed as communities within larger census-designated places. We termed these communities “nested, place-based communities” and had to approach the organization of their demographic information on an ad hoc basis. Most of the details of that process are described in Appendix B: Place-Based Communities.
Table 2.1: Non census-designated place communities
Non Census-Designated Place State
Basis for Profile
Albion CA High dependence score Avila Beach CA High dependence score Fields Landing CA High dependence score Kneeland CA High dependence score Los Osos CA High combined engagement score Pebble Beach CA High combined engagement score Princeton CA High dependence score San Pedro CA High dependence score Sunset Beach CA High combined engagement score Tarzana CA High combined engagement score Terminal Island CA High dependence score Valley Ford CA High dependence score Charleston OR High combined engagement score
5 “Place” refers to one of the geographies used by the U.S. Census Bureau. Census geographies also include geographic designations that are larger than “place” such as states and counties, as well as geographic designations that are generally smaller than “place,” such as the area encompassed by a zip code or a block group.
Hammond OR High dependence score Logsden OR High dependence score La Push WA High dependence score Lopez WA High combined engagement score Seaview WA High dependence score Sedro-Woolley WA High combined engagement score South Bend WA High combined engagement score Seaford VA High combined engagement score Port Group Communities
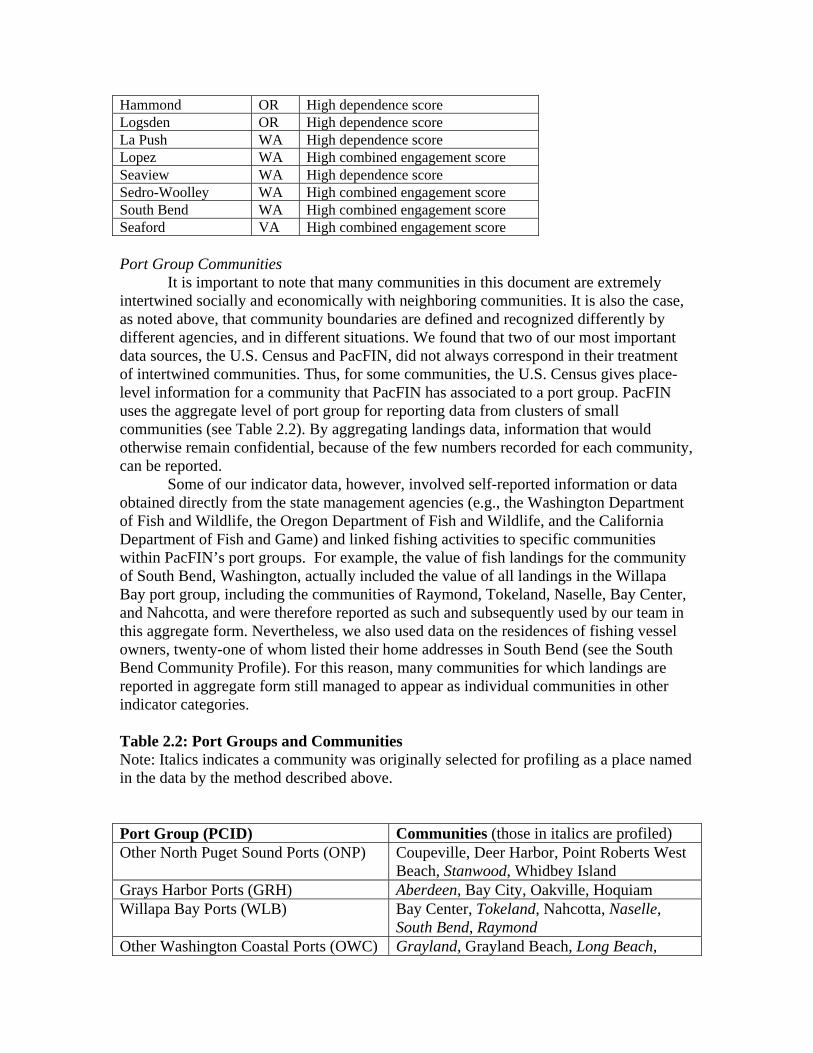
It is important to note that many communities in this document are extremely intertwined socially and economically with neighboring communities. It is also the case, as noted above, that community boundaries are defined and recognized differently by different agencies, and in different situations. We found that two of our most important data sources, the U.S. Census and PacFIN, did not always correspond in their treatment of intertwined communities. Thus, for some communities, the U.S. Census gives place-level information for a community that PacFIN has associated to a port group. PacFIN uses the aggregate level of port group for reporting data from clusters of small communities (see Table 2.2). By aggregating landings data, information that would otherwise remain confidential, because of the few numbers recorded for each community, can be reported.
Some of our indicator data, however, involved self-reported information or data obtained directly from the state management agencies (e.g., the Washington Department of Fish and Wildlife, the Oregon Department of Fish and Wildlife, and the California Department of Fish and Game) and linked fishing activities to specific communities within PacFIN’s port groups. For example, the value of fish landings for the community of South Bend, Washington, actually included the value of all landings in the Willapa Bay port group, including the communities of Raymond, Tokeland, Naselle, Bay Center, and Nahcotta, and were therefore reported as such and subsequently used by our team in this aggregate form. Nevertheless, we also used data on the residences of fishing vessel owners, twenty-one of whom listed their home addresses in South Bend (see the South Bend Community Profile). For this reason, many communities for which landings are reported in aggregate form still managed to appear as individual communities in other indicator categories.
Table 2.2: Port Groups and Communities Note: Italics indicates a community was originally selected for profiling as a place named in the data by the method described above. Port Group (PCID) Communities (those in italics are profiled) Other North Puget Sound Ports (ONP) Coupeville, Deer Harbor, Point Roberts West
Beach, Stanwood, Whidbey Island Grays Harbor Ports (GRH) Aberdeen, Bay City, Oakville, Hoquiam Willapa Bay Ports (WLB) Bay Center, Tokeland, Nahcotta, Naselle,
South Bend, Raymond Other Washington Coastal Ports (OWC) Grayland, Grayland Beach, Long Beach,

Quillayute, Taholah, Queets, Moclips, Hoh, Kalaloch
Ilwaco/Chinook (LWC) Chinook, Skamokawa, Ilwaco Other Columbia River Ports (OCR) Altoona, Brookfield, Camas, Carrolls,
Kalama, Longview, Pillar Rock, Skamania, Woody Island, Washougal, Vancouver, Stella, Ridgefield, Puget Island, Pacific County, Megler, Kelso, Gray’s Bay, Frankfort, Cathlamet, The Dalles
Tillamook/Garibaldi (TLL) Garibaldi, Tillamook Charleston/Coos Bay (COS) Charleston, Coos Bay Other Humboldt County Ports (OHB) Orick, Arcata, Ferndale, Fortuna, Honeydew,
Carlotta, King Salmon, Petrolia, Weott, Moonstone Beach, McKinleyville, Miranda, Garberville, Ruth, Loleta, Humboldt, Scotia, Shelter Cove, Blue Lake, Crannel
Other Mendicino County Ports (OMD) Elk, Almanor, Willits, Anchor Bay, Ukiah, Westport, Medocino, Caspa, Little River
Other Sonoma and Marin County Outer Coast Ports(OSM)
San Rafael, Inverness, Bolinas, Jenner, Sebastopol, Windsor, Marshall, Petaluma, Novato, Stewarts Point, Dillon Beach, Drakes Bay, Healdsburg, Kentfield, Muir Beach, Guerneville, Sonoma, Nicasio, Greenbrae, Forest Knolls, Occidental, Cloverdale, San Quentin, Rohnert Park, Corte Madera, Mill Valley, Tiburon, Stinson Beach, Hamlet, Marconi, Millerton, Santa Rosa
Other San Francisco Bay and San Mateo County Ports (OSF)
San Mateo, South San Francisco, Pigeon Point, Point Montara, Pescadero, Point San Pedro, Albany, Pleasanton, Pleasant Hill, Danville, Fairfield, Vacaville, Concord, San Bruno, Rockaway Beach Palo Alto, Los Gatos, Alamo, Fremont, San Francisco area, Oakley, Port Costa, Antioch Bridge, Crockett, Antioch, Rio Vista, Martinez, Pittsburg, Collinsville, Benicia, Bird Landing, Suisun City, Brentwood, Walnut Creek, Pinole, Alviso, Daly City, Campbell, martins Beach, San Carlos, Moss Beach, Redwood City, Emeryville, McNears Point, San Jose, China Camp, Vallejo, Rodeo, El Sobrante, Newark, Yountville, Livermore, Glen Cove, Los Altos, Burlingame, Foster City, Pacifica, Sunnyvale, Hayward, Mountain View, Lafayette, San Leandro, Napa, El Cerrito, Farallone Island
Princeton/Half Moon Bay (PRN) Princeton, Half Moon Bay
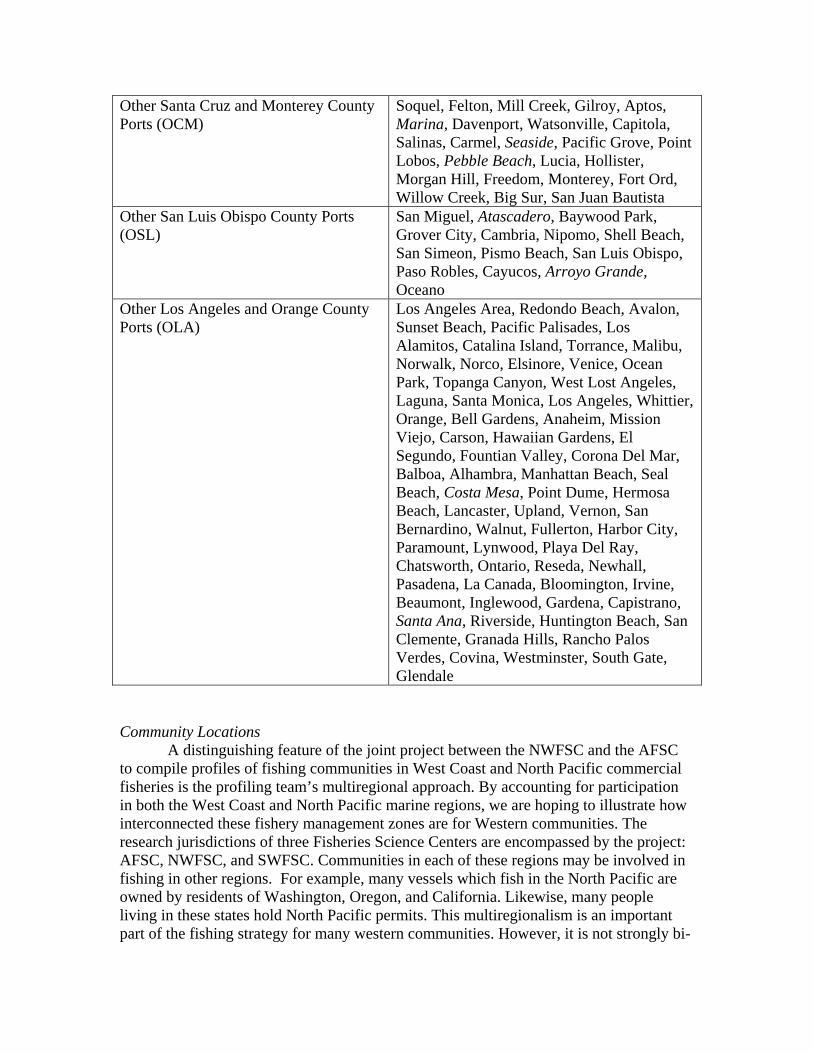
Other Santa Cruz and Monterey County Ports (OCM)
Soquel, Felton, Mill Creek, Gilroy, Aptos, Marina, Davenport, Watsonville, Capitola, Salinas, Carmel, Seaside, Pacific Grove, Point Lobos, Pebble Beach, Lucia, Hollister, Morgan Hill, Freedom, Monterey, Fort Ord, Willow Creek, Big Sur, San Juan Bautista
Other San Luis Obispo County Ports (OSL)
San Miguel, Atascadero, Baywood Park, Grover City, Cambria, Nipomo, Shell Beach, San Simeon, Pismo Beach, San Luis Obispo, Paso Robles, Cayucos, Arroyo Grande, Oceano
Other Los Angeles and Orange County Ports (OLA)
Los Angeles Area, Redondo Beach, Avalon, Sunset Beach, Pacific Palisades, Los Alamitos, Catalina Island, Torrance, Malibu, Norwalk, Norco, Elsinore, Venice, Ocean Park, Topanga Canyon, West Lost Angeles, Laguna, Santa Monica, Los Angeles, Whittier, Orange, Bell Gardens, Anaheim, Mission Viejo, Carson, Hawaiian Gardens, El Segundo, Fountian Valley, Corona Del Mar, Balboa, Alhambra, Manhattan Beach, Seal Beach, Costa Mesa, Point Dume, Hermosa Beach, Lancaster, Upland, Vernon, San Bernardino, Walnut, Fullerton, Harbor City, Paramount, Lynwood, Playa Del Ray, Chatsworth, Ontario, Reseda, Newhall, Pasadena, La Canada, Bloomington, Irvine, Beaumont, Inglewood, Gardena, Capistrano, Santa Ana, Riverside, Huntington Beach, San Clemente, Granada Hills, Rancho Palos Verdes, Covina, Westminster, South Gate, Glendale
Community Locations A distinguishing feature of the joint project between the NWFSC and the AFSC to compile profiles of fishing communities in West Coast and North Pacific commercial fisheries is the profiling team’s multiregional approach. By accounting for participation in both the West Coast and North Pacific marine regions, we are hoping to illustrate how interconnected these fishery management zones are for Western communities. The research jurisdictions of three Fisheries Science Centers are encompassed by the project: AFSC, NWFSC, and SWFSC. Communities in each of these regions may be involved in fishing in other regions. For example, many vessels which fish in the North Pacific are owned by residents of Washington, Oregon, and California. Likewise, many people living in these states hold North Pacific permits. This multiregionalism is an important part of the fishing strategy for many western communities. However, it is not strongly bi-

directional. In other words, while residents of many Western communities fish both the West Coast and North Pacific, few residents of Alaska communities fish the West Coast.
The vast majority of fishing communities involved in the commercial fisheries of the West Coast and North Pacific are located in the coastal states contiguous to the waters that support the fisheries. However, residents of non-Western, non-Alaskan communities also participate in West Coast and North Pacific fisheries, and these communities were considered in our selection analysis. For two of these communities, Seaford, Virginia, and Pleasantville, New Jersey, their engagement in a particular fishery was significant enough to trigger their selection through the DEA model. 2.3 Indicators, Data Envelopment Analysis (DEA), and the Community Selection Process
The first step in our effort to profile communities described hereafter was to assemble a comprehensive list of communities which were, via indicator data, linked in some way to the commercial fisheries of the North Pacific and the West Coast. A community could be home, for example, to even one individual who held a West Coast salmon permit during the year 2000, and the community would therefore appear in our initial analysis. Since communities located in Alaska had previously been analyzed and profiled by the AFSC document, we limited ourselves to beginning work from a large list of non-Alaskan communities. Thus, after the removal of communities located in Alaska, our initial analysis produced a list of a total of 1560 communities.
Once the community list was assembled, we selected an appropriate methodology that would allow for the rank ordering of our list of 1560 communities, based on a level of involvement in West Coast and North Pacific fisheries. One important consideration in model selection was our desire to simultaneously consider a wide range of indictors of fishery participation. These indicators had been selected on the basis of availability, informational value, and consistency across all states6. In the end we had a total of 92 different indicators of participation in commercial West Coast and North Pacific fisheries for the communities under consideration. One framework that would accommodate a large number of variables and generate the rank-ordering results we desired was DEA. DEA is an established analytical method that easily handles a broad range of variables simultaneously.
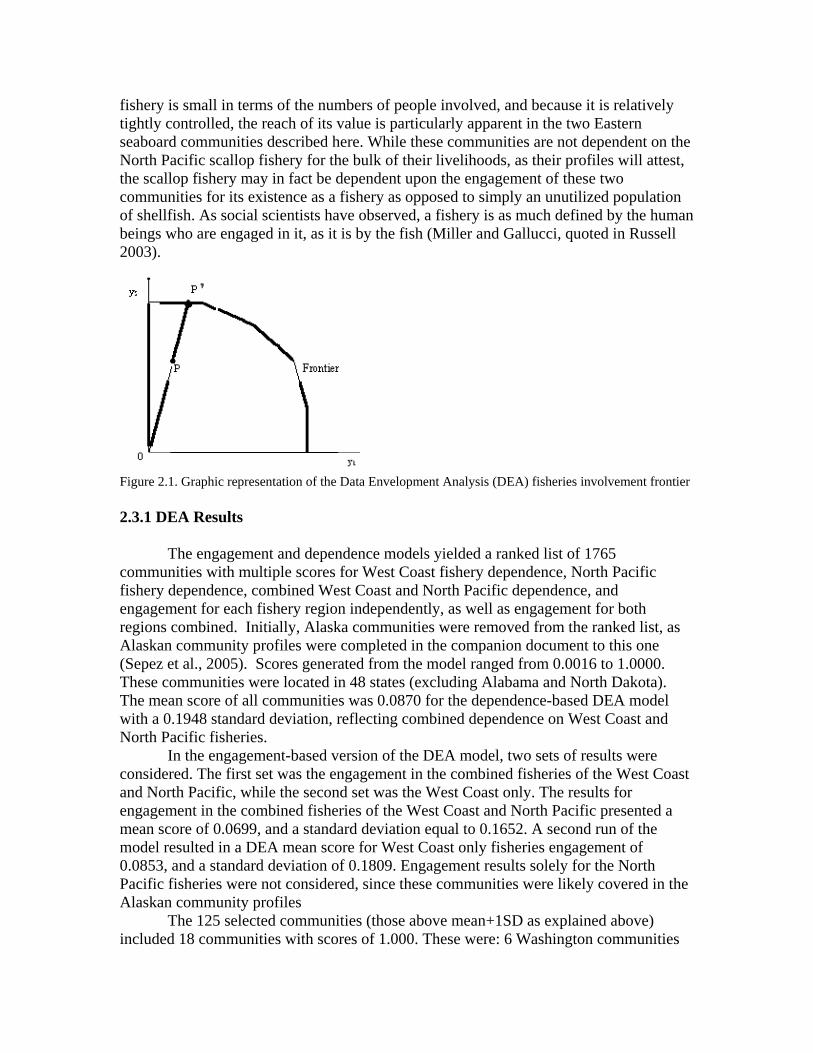
At its most basic, DEA is a non-parametric approach used to compare entities in various ways (here we were comparing them in their level of fishery participation). Those entities being compared are assumed to use “inputs” (in our application, the population of a community) to create “outputs” (fishery involvement). Fortunately this method does not require one to specify the nature of the structural relationship between inputs and outputs, which allows for flexibility in the estimation of a “frontier” of fisheries participation. This frontier represents the greatest level of outputs (highest levels of the fishing involvement) from the set of communities.
That is, DEA produces an efficient frontier based on multiple quantitative indicators, and proximity to that frontier presents a means of comparing each community 6 The lack of similar data in one or more states would allow for a state-based bias to develop, reflecting a preponderance of communities from data-rich states, and so we therefore disqualified such indicators.
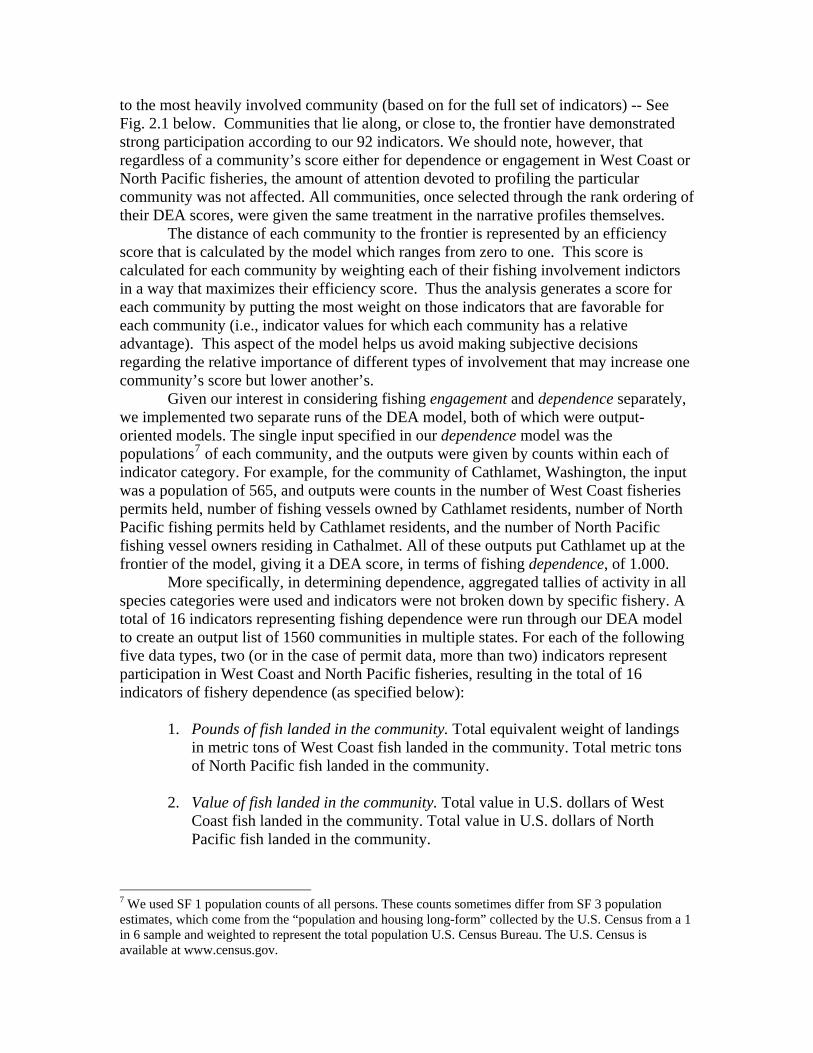
to the most heavily involved community (based on for the full set of indicators) -- See Fig. 2.1 below. Communities that lie along, or close to, the frontier have demonstrated strong participation according to our 92 indicators. We should note, however, that regardless of a community’s score either for dependence or engagement in West Coast or North Pacific fisheries, the amount of attention devoted to profiling the particular community was not affected. All communities, once selected through the rank ordering of their DEA scores, were given the same treatment in the narrative profiles themselves.
The distance of each community to the frontier is represented by an efficiency score that is calculated by the model which ranges from zero to one. This score is calculated for each community by weighting each of their fishing involvement indictors in a way that maximizes their efficiency score. Thus the analysis generates a score for each community by putting the most weight on those indicators that are favorable for each community (i.e., indicator values for which each community has a relative advantage). This aspect of the model helps us avoid making subjective decisions regarding the relative importance of different types of involvement that may increase one community’s score but lower another’s. Given our interest in considering fishing engagement and dependence separately, we implemented two separate runs of the DEA model, both of which were output-oriented models. The single input specified in our dependence model was the populations7 of each community, and the outputs were given by counts within each of indicator category. For example, for the community of Cathlamet, Washington, the input was a population of 565, and outputs were counts in the number of West Coast fisheries permits held, number of fishing vessels owned by Cathlamet residents, number of North Pacific fishing permits held by Cathlamet residents, and the number of North Pacific fishing vessel owners residing in Cathalmet. All of these outputs put Cathlamet up at the frontier of the model, giving it a DEA score, in terms of fishing dependence, of 1.000.
More specifically, in determining dependence, aggregated tallies of activity in all species categories were used and indicators were not broken down by specific fishery. A total of 16 indicators representing fishing dependence were run through our DEA model to create an output list of 1560 communities in multiple states. For each of the following five data types, two (or in the case of permit data, more than two) indicators represent participation in West Coast and North Pacific fisheries, resulting in the total of 16 indicators of fishery dependence (as specified below):
1. Pounds of fish landed in the community. Total equivalent weight of landings
in metric tons of West Coast fish landed in the community. Total metric tons of North Pacific fish landed in the community.
2. Value of fish landed in the community. Total value in U.S. dollars of West
Coast fish landed in the community. Total value in U.S. dollars of North Pacific fish landed in the community.
7 We used SF 1 population counts of all persons. These counts sometimes differ from SF 3 population estimates, which come from the “population and housing long-form” collected by the U.S. Census from a 1 in 6 sample and weighted to represent the total population U.S. Census Bureau. The U.S. Census is available at www.census.gov.
3. Vessels delivering to the community. Total number of unique vessels that made deliveries to the community as their primary port for landings and which were involved in West Coast fisheries. Total number of unique vessels that made deliveries to the community as their primary port for landings and which were involved in North Pacific fisheries.
4. Permits by community. Total number of permits for West Coast fisheries
registered to individuals residing in the community. Total number of permits for North Pacific fisheries registered to individuals residing in the community. Total number of individuals that hold federal permits for West Coast fisheries. Total number of individuals that hold federal permits for North Pacific fisheries. Total number of North Pacific halibut individual fishing quotas (IFQs) registered to individuals residing in the community. Total number of North Pacific sablefish IFQs registered to individuals residing in the community. Total number of individuals that hold state permits for West Coast fisheries. Total number of individuals that hold state permits for North Pacific fisheries.
5. Number of fishing vessels owned by residents of the community. Total number
of vessels owned by individuals residing in the community that were involved in West Coast fisheries. Total number of vessels owned by individuals residing in the community that were involved in North Pacific fisheries.
In the engagement model we no longer wanted to make per-capita comparisons
and so all of the input values for each community were normalized to one. In addition, rather than specifying the participation of communities in various categories in counts, we looked at each community’s share of each indicator value (e.g., the share of landings in the salmon fisheries comprised by residents of a given community) using catch and permit data for the West Coast and North Pacific fisheries.
Specifically, each data element was broken down by specific fishery to illustrate how important a particular community’s participation is in that fishery relative to the participation of other communities. A total of 92 indicators representing fishing engagement were run through our DEA model to create an output list of 1764 communities in multiple states. For each of the following three data types, several indicators from the West Coast and North Pacific represent participation in the regions’ fisheries resulting in the total of 92 indicators of fishery engagement (as specified below):
1. Total value of fish landed in the community by fishery. West Coast fisheries:
coastal pelagic, crab, groundfish, highly migratory, salmon, shellfish, shrimp, and other species. North Pacific fisheries: crab, BSAI groundfish, GOA groundfish, halibut, herring, salmon, shellfish, and other finfish.
2. Permits by fishery. Number of permits held for West Coast fisheries by
community and fishery: federal groundfish, Oregon coastal pelagic, Oregon crab, Oregon groundfish, Oregon highly migratory species, Oregon salmon, Oregon shellfish, Oregon shrimp, Oregon other species, Washington coastal
pelagic, Washington crab, Washington groundfish, Washington salmon, Washington shellfish, Washington shrimp, Washington other species, California coastal pelagic, California crab, California groundfish, California highly migratory, California salmon, California shrimp, and California other species.
Number of permits or quota shares held for North Pacific fisheries by community and fishery: American Fisheries Act (AFA) catcher/processor permits, AFA catcher vessel permits, high-seas fishing compliance act permits, crab License Limitation Program (LLP) permits, federal fisheries permits (FFPs), groundfish LLP permits, scallop LLP permits, halibut IFQ quota shares, sablefish IFQ quota shares, Commercial Fisheries Entry Commission (CFEC) crab permits, CFEC other finfish permits, CFEC GOA groundfish permits, CFEC BSAI groundfish permits, CFEC halibut permits, CFEC herring permits, CFEC salmon permits, CFEC scallop permits, and CFEC shellfish permits.
Number of individuals holding North Pacific permits or quota shares by community and fishery: number of owners of North Pacific AFA catcher/processor permits who reside in the community, number of owners of North Pacific AFA catcher vessel permits who reside in the community, number of holders of North Pacific high-seas fishing compliance act permits who reside in the community, number of holders of North Pacific FFPs or crab or groundfish LLPs who reside in the community, number of holders of North Pacific halibut IFQ quota shares who reside in the community, number of holders of North Pacific sablefish IFQ quota shares who reside in the community, number of holders of North Pacific scallop LLPs who reside in the community.
3. Total number of fishing vessels owned by community and fishery. Vessels
participating in West Coast fisheries by vessel owner residence and fishery: federal groundfish, Oregon coastal pelagic, Oregon crab, Oregon groundfish, Oregon highly migratory species, Oregon other species, Oregon salmon, Oregon shellfish, Oregon shrimp, Washington coastal pelagic, Washington crab, Washington groundfish, Washington other species, Washington salmon, California coastal pelagic California crab, California other species, California salmon, and California shrimp. Vessels participating in North Pacific fisheries by vessel owner residence and fishery: crab, BSAI groundfish, finfish, GOA groundfish, halibut, herring, salmon, shellfish, and scallops.
Perhaps the most striking examples to emerge from this model were the
communities of Seaford, Virginia, and Pleasantville, New Jersey. While it may be surprising for some to consider East Coast coastal communities as worthy of profiles in a document aimed at the fisheries of the North Pacific and West Coast, these communities appear due to the means by which we methodologically conceptualized engagement in Pacific fisheries. In terms of linkages to the North Pacific and West Coast fisheries, these communities are exclusively linked to the North Pacific scallop fishery. Because this
fishery is small in terms of the numbers of people involved, and because it is relatively tightly controlled, the reach of its value is particularly apparent in the two Eastern seaboard communities described here. While these communities are not dependent on the North Pacific scallop fishery for the bulk of their livelihoods, as their profiles will attest, the scallop fishery may in fact be dependent upon the engagement of these two communities for its existence as a fishery as opposed to simply an unutilized population of shellfish. As social scientists have observed, a fishery is as much defined by the human beings who are engaged in it, as it is by the fish (Miller and Gallucci, quoted in Russell 2003).
Figure 2.1. Graphic representation of the Data Envelopment Analysis (DEA) fisheries involvement frontier
2.3.1 DEA Results
The engagement and dependence models yielded a ranked list of 1765 communities with multiple scores for West Coast fishery dependence, North Pacific fishery dependence, combined West Coast and North Pacific dependence, and engagement for each fishery region independently, as well as engagement for both regions combined. Initially, Alaska communities were removed from the ranked list, as Alaskan community profiles were completed in the companion document to this one (Sepez et al., 2005). Scores generated from the model ranged from 0.0016 to 1.0000. These communities were located in 48 states (excluding Alabama and North Dakota). The mean score of all communities was 0.0870 for the dependence-based DEA model with a 0.1948 standard deviation, reflecting combined dependence on West Coast and North Pacific fisheries.
In the engagement-based version of the DEA model, two sets of results were considered. The first set was the engagement in the combined fisheries of the West Coast and North Pacific, while the second set was the West Coast only. The results for engagement in the combined fisheries of the West Coast and North Pacific presented a mean score of 0.0699, and a standard deviation equal to 0.1652. A second run of the model resulted in a DEA mean score for West Coast only fisheries engagement of 0.0853, and a standard deviation of 0.1809. Engagement results solely for the North Pacific fisheries were not considered, since these communities were likely covered in the Alaskan community profiles
The 125 selected communities (those above mean+1SD as explained above) included 18 communities with scores of 1.000. These were: 6 Washington communities

(Bellingham, Blaine, Cathlamet, Seattle, Tokeland, and Westport), 3 Oregon communities (Astoria, Newport, and Port Orford) and 9 California communities (Bodega Bay, Crescent City, Fields Landing, Fort Bragg, Moss Landing, San Diego, San Pedro, Santa Barbara, and Terminal Island). The median score of selected communities was 0.4065, and the lowest of the selected was 0.2353. The mean was 0.5442. 2.4 Site Visits
The predecessor and template for this document is the AFSC document entitled Community Profiles for North Pacific Fisheries – Alaska (Sepez et al., 2005). In both the Alaskan and Western states profiling process, small and large communities were selected for short-term research site visits by members of the research team. In selecting these communities, the joint AFSC/NWFSC research team used the state boundaries themselves as regional partitions. Site visit selections were made based upon regional and community size considerations, and in an effort to represent as much diversity among visited communities as possible. Additional selection parameters included fisheries involvement, accessibility, and size diversity (Sepez et al., 2006). Communities from each of the three major West Coast states – California, Oregon, and Washington – were selected for site visits. These were: in Washington (Chinook, Friday Harbor, Ilwaco, and Seattle); in Oregon (Astoria, Coos Bay, Moss Landing, Port Orford, and Warrenton); and in California (San Diego and San Pedro).
The regional approach employed in both site visits for Alaskan communities and in Western state communities, is beneficial in that it divides both broader study areas into “manageable pieces” (Sepez et al., 2006). Selected communities, however, are not intended to be representative of other, neighboring communities. As is noted in a discussion of site selection in Human Organization, “such case studies are thus limited to being an example rather than being exemplary of other communities in the state or region” (Sepez et al., 2006). In future efforts to research the communities profiled herein, established methodologies could be employed in selecting representative communities for more intensive field visits (Sepez et al., 2006). 2.5 Profile Structure and Sources
Each community profile contains four sections: People and Place, Infrastructure,
Involvement in West Coast Fisheries, and Involvement in North Pacific Fisheries. In general, People and Place describes the location, history, and basic demographic structure of the community. Infrastructure offers a picture of the current economic situation, the structure of governance, and the facilities of the community. The fishing sections, Involvement in West Coast Fisheries and Involvement in North Pacific Fisheries, detail the nature and level of community involvement in commercial and sportfishing for both regions separately. Subsistence fishing information for a community, where available, is described in the Involvement in West Coast Fisheries section.
Below we describe how we compiled and used the data to assemble narrative socio-economic profiles for the 125 selected fishing communities. Several of the data elements pertaining to fisheries which were common to all communities involved in West
Coast and North Pacific fisheries were used as fishing indicators in the quantitative community selection process, as described above. Fishing data and other information was sourced from state agencies (Alaska, Washington, Oregon, and California), the PacFIN, NMFS, other agencies and organizations, and from site visits made to a limited number of communities. For each data element used to describe community involvement in West Coast and North Pacific fisheries, the following list provides a definition, a description of the data availability and sources, and an explanation of the purpose and usefulness. We also discuss some of the methodological challenges we encountered along the way, and how we sought to resolve them. People and Place. It was our intention to situate each community in time and space by providing information not only on the current condition of the community but also on its historical development. Each community is first described in terms of geographic location8 and demographics, followed by a brief account of local history. We used data from the U.S. Census Bureau9 and official City websites, as well as scholarly and popular works, to provide a rounded picture of each community. The depth of information available at the community level was highly variable from place to place. A wealth of information is available, for example, about urban centers and most towns, while information about smaller and more remote communities is less readily available. This is reflected in the level of detail with which we were able to portray the history and development of each community. To provide insight into the demographic composition of the communities, all profiles report the number of inhabitants, a short demographic evolution when possible, the gender structure, median age, educational attainment, racial and ethnic composition, and an indication of how many community members were born outside of the U.S. In addition, some profiles report further information if it helped to illustrate the character of the community, such as age structure, percentage of individuals living in family households,10 and ancestry. To compile brief accounts of local history, historical information was gleaned from various relevant websites and print material, and was cross-checked for verification between multiple sources. Where available, full accounts of the development and evolution of the local fishing industry is supplied, and regional characteristics are noted. Where we encountered a lack of historical information, we give the best possible illustration of a community’s origins but likely do not adequately portray its past. In a few cases community history has been reported at the county level because we were unable to discover more detailed information.
8 Latitude and longitude provided by USGS National Mapping Information website for “populated place”: http:geonames.usgs.gov/pls/gns/web_uery.gns_web_query_form; distance to major cities determined by MapQwest city-to-city: http://www.mapquest.com/directions/main.adap?bCTsettings =1. 9 We used U.S. Census data for the year 2000 available at the U.S. Census Bureau’s American FactFinder website, http://factfinder.census.gov/home/saff/main.html. 10 The U.S. Census Bureau provides this definition of household: “A household includes all of the people who occupy a housing unit. A housing unit is a house, an apartment, a mobile home, a group of rooms, or a single room occupied (or if vacant, intended for occupancy) as separate living quarters. Separate living quarters are those in which the occupants live separately from any other people in the building and that have direct access from the outside of the building or through a common hall. The occupants may be a single family, one person living alone, two or more families living together, or any other group of related or unrelated people who share living quarters.”

Infrastructure. The infrastructure section is an overview of the economic, governmental, and physical infrastructures that support the community. The description of the current economy is useful for understanding where fishing stands in relation to other economic opportunities in a community, and predicting how a community might be affected when faced with a change in fishing patterns. Physical infrastructure – as the foundation of a logistical basis for supporting both economic and social activities – is also indicative of how a community may respond to economic, regulatory, or environmental change. Economic information includes major businesses and employers in the community, the employment structure, any available information about community members’ reliance on subsistence, per capita income, median household income, percent of the population below poverty level, number of housing units9 and the percentage of these which are unoccupied for various reasons as well as which are owner- versus renter-occupied. For data on the current economic conditions in each community we consulted the U.S. Census Bureau, as well as other publicly available resources. We included several dimensions of community employment structure: employment status, employment in agriculture, fishing and hunting, and employment with government affiliation. Employment status is illustrated by three different values: unemployed community residents, percentage employed, and percentage not in the labor force.11 It should be noted here that our calculation of unemployment has been calculated to report community residents who are in the labor force but are unemployed. This is in an attempt to differentiate it from the indicator with residents who are not in the labor force. However, the graphical representations of employment structure do not make this distinction in order to have all three measures as proportions of the total community population 16 years and above. The number reported for a community’s employment in fishing is most likely an underestimate of the total number of fishermen in the community. The U.S. Census may not accurately capture this demographic as many fishermen are “self employed,” an undistinguished category on the U.S. Census forms.
There is some variation between governance structures throughout Washington, Oregon, and California. For an explanation of place classification in the three states see Figure 2.2. In all three states, nested fishing communities (those which fall within a greater town municipality)
9 The U.S. Census Bureau provides this definition of housing unit: “A house, an apartment, a mobile home or trailer, a group of rooms, or a single room occupied as separate living quarters, or if vacant, intended for occupancy as separate living quarters. Separate living quarters are those in which the occupants live separately from any other individuals in the building and which have direct access from outside the building or through a common hall. For vacant units, the criteria of separateness and direct access are applied to the intended occupants whenever possible.” 11 This information was sourced form the 2000 U.S. Census, and has been calculated as follows: 1) unemployed residents = total unemployed/total in labor force; 2) percent employed = (total civilian employed + total armed forces)/ total community population 16 years and above; 3) percent not in labor force = total not in labor force/ total community population 16 years and above.
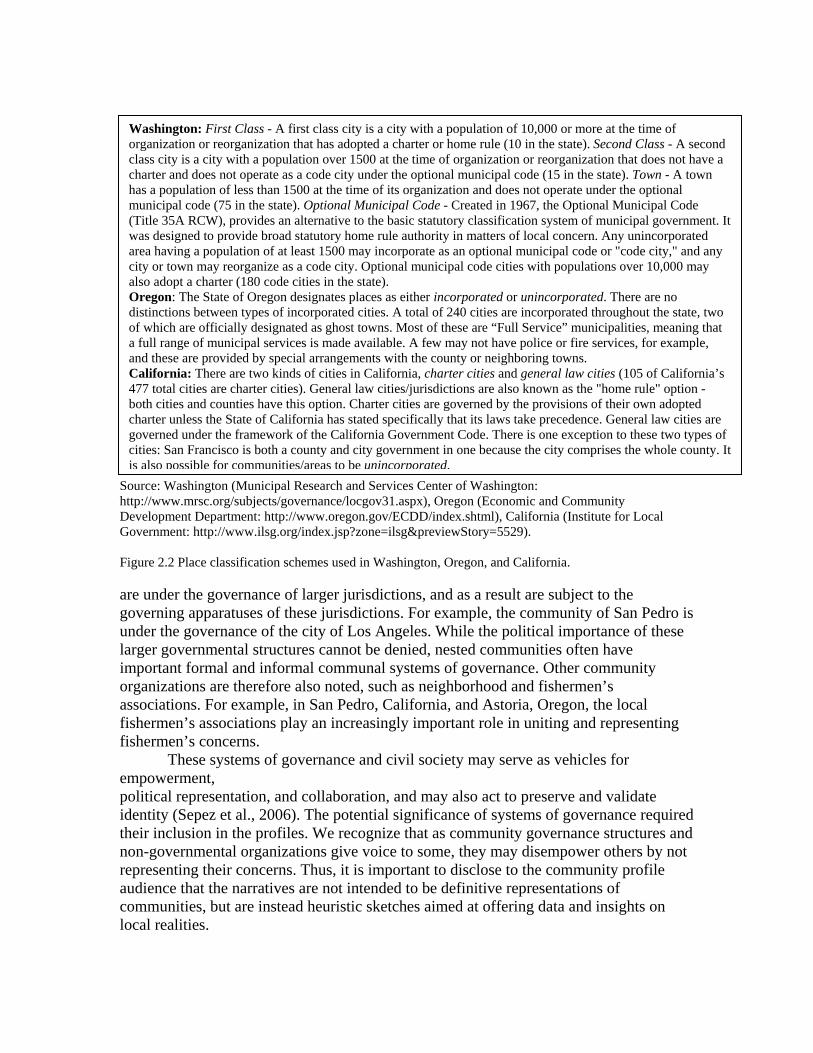
Washington: First Class - A first class city is a city with a population of 10,000 or more at the time of organization or reorganization that has adopted a charter or home rule (10 in the state). Second Class - A second class city is a city with a population over 1500 at the time of organization or reorganization that does not have a charter and does not operate as a code city under the optional municipal code (15 in the state). Town - A town has a population of less than 1500 at the time of its organization and does not operate under the optional municipal code (75 in the state). Optional Municipal Code - Created in 1967, the Optional Municipal Code (Title 35A RCW), provides an alternative to the basic statutory classification system of municipal government. It was designed to provide broad statutory home rule authority in matters of local concern. Any unincorporated area having a population of at least 1500 may incorporate as an optional municipal code or "code city," and any city or town may reorganize as a code city. Optional municipal code cities with populations over 10,000 may also adopt a charter (180 code cities in the state). Oregon: The State of Oregon designates places as either incorporated or unincorporated. There are no distinctions between types of incorporated cities. A total of 240 cities are incorporated throughout the state, two of which are officially designated as ghost towns. Most of these are “Full Service” municipalities, meaning that a full range of municipal services is made available. A few may not have police or fire services, for example, and these are provided by special arrangements with the county or neighboring towns. California: There are two kinds of cities in California, charter cities and general law cities (105 of California’s 477 total cities are charter cities). General law cities/jurisdictions are also known as the "home rule" option - both cities and counties have this option. Charter cities are governed by the provisions of their own adopted charter unless the State of California has stated specifically that its laws take precedence. General law cities are governed under the framework of the California Government Code. There is one exception to these two types of cities: San Francisco is both a county and city government in one because the city comprises the whole county. It is also possible for communities/areas to be unincorporated.
Source: Washington (Municipal Research and Services Center of Washington: http://www.mrsc.org/subjects/governance/locgov31.aspx), Oregon (Economic and Community Development Department: http://www.oregon.gov/ECDD/index.shtml), California (Institute for Local Government: http://www.ilsg.org/index.jsp?zone=ilsg&previewStory=5529). Figure 2.2 Place classification schemes used in Washington, Oregon, and California. are under the governance of larger jurisdictions, and as a result are subject to the governing apparatuses of these jurisdictions. For example, the community of San Pedro is under the governance of the city of Los Angeles. While the political importance of these larger governmental structures cannot be denied, nested communities often have important formal and informal communal systems of governance. Other community organizations are therefore also noted, such as neighborhood and fishermen’s associations. For example, in San Pedro, California, and Astoria, Oregon, the local fishermen’s associations play an increasingly important role in uniting and representing fishermen’s concerns.
These systems of governance and civil society may serve as vehicles for empowerment, political representation, and collaboration, and may also act to preserve and validate identity (Sepez et al., 2006). The potential significance of systems of governance required their inclusion in the profiles. We recognize that as community governance structures and non-governmental organizations give voice to some, they may disempower others by not representing their concerns. Thus, it is important to disclose to the community profile audience that the narratives are not intended to be definitive representations of communities, but are instead heuristic sketches aimed at offering data and insights on local realities.
Descriptions of physical and even social infrastructure may have a tendency to treat communities in isolation. However, the ways in which a community is connected to other places is a critical element of how it functions. Connectivity or isolation can affect language, culture, trade, tourism, health, opportunity, and quality of life – though it is not always possible to say in what manner, as individuals differ in what they consider desirable. Connectivity or isolation can also be difficult to measure, as actual travel is always more than a matter of mere distances. Cost, for example, may be more prohibitive of travel than distance. Weather patterns and landing or docking facilities may also affect connectivity and isolation. If a community’s airstrip is inaccessible due to visibility or storm conditions for days at a time, price and distance may have less effect on participation in out-of-town business than weather windows.
In many cases, the primary rationale for offering descriptions of facilities is to reveal the accessibility of the outside world to community members, particularly with regard to communication and travel. This is especially significant given the emphasis on stakeholder participation in fisheries management, wherein frequent Fishery Management Council meetings are held in differing locations in each management region. Facilities descriptions also offer insight into a community’s investment and dependence in the industry and the relative importance of particular assets. A community, for example, with one fish processing plant may be especially vulnerable to any fish allocation decisions in its associated region. In addition, information about schools, healthcare, utilities, and public safety facilities are important because such amenities may factor into people’s decisions about where to live. Marine facilities are described to give an illustration of the physical infrastructure serving the local fishing industry in its commercial as well as recreational dimensions. This information has been primarily sourced from the websites of harbors and marinas, and when possible or necessary, content has been supplemented by telephone communications with harbor staff.
Extensive information about taxes on fisheries-related activities that is particular to each state has been included in the profiles as an indication of the economic importance of fisheries to the municipality and other tax-funded services.12 Tax types include those levied on personal property (including commercial fishing vessels, charter boats, and oceanographic research vessels), fish landings (based on weight and species), ballast water management and other marine services, commercial fish licenses and permits, and fuel. The State of Washington has additional enhanced food, fish, and shellfish taxes paid by the commercial processor of food fish and shellfish at different rates assigned to various species. In 1950 Washington State’s Federal Aid in Sport Fish Restoration Act, commonly known as the Dingell-Johnson Act, created a program to assist in the management, conservation, and restoration of fishery resources. The Sport Fish Restoration program is funded through a 10 percent excise tax on fishing equipment, a three percent tax on electric motors and sonar fish finders, taxes on motorboat and small engine fuels, and import duties on fishing tackle and pleasure boats.13 The Wallop-
12 As tax information was retrieved from different sources for each state, the information is cited in individual profiles. 13 For more information see the U.S. Fish and Wildlife Service’s Federal Aid in Sport Fish Restoration website at: http://federalaid.fws.gov/sfr/fasfr.html.
Breaux Amendment in 1984 added new provisions to the Act by extending the excise tax to previously untaxed sport fishing equipment.14
In addition to distance and travel information to larger cities, we provide the location of the nearest offices of several governmental organizations important to the fishing industry: NOAA Fisheries (National Marine Fisheries Service),15 the relevant state agency in charge of managing fish and wildlife,16 the U.S. Bureau of Citizenship and Immigration Services (USBCIS),17 formerly known as Immigration and Naturalization Services (INS), and the location of the nearest possible Fishery Management Council meeting venue. As the key bodies regulating fisheries, access to NOAA and state departments can help with the flow and clarification of information (from research reports to grounds closures), as well as influencing a community’s enfranchisement in a regulatory system. In addition, the location of U.S. Bureau of Citizenship and Immigration Services can affect the labor practices of industry, particularly the seafood processing sector, through level and intensity of monitoring, and may also affect use of local services by undocumented residents.
Involvement in West Coast Fisheries. The section on fishing involvement in West Coast Fisheries contains information on dependence and engagement in the fisheries and in most cases is the most in-depth and detailed section of the community profiles. In the fishing sections, we aim to provide the most comprehensive picture of commercial, recreational, and subsistence fishing practice and patterns given available data. Characterization of fisheries is both in terms of the nature and degree of involvement. The commercial fishing section contains information on landings (weight, value, and vessels making deliveries), permits (number of permits held by residents of a community and number of residents holding permits), and vessel owners, as well as information on participatory groups and processing activities. Much of this information was received from PacFIN, as well as from various state management agencies. Each data element is discussed below, including its availability, how it was treated, and any associated caveats. Some landings data, permit information, and details about vessel owners were also used in the community selection process described above (see Section 2.3), and are more thoroughly explained here.
I. Commercial fishing 1. Landings data. All data associated with commercial fish landings in
Washington, Oregon, and California were provided by PacFIN and pertain to the year 2000. Data elements which were extracted from this dataset include weight and value of landings, number of vessels delivering, and vessels by
14 For more information see the Environment, Energy, and Transportation Program’s website at: http://www.ncsl.org/programs/esnr/FISHHUNTWILD.htm. 15 The NOAA Fisheries’ Contacts page, available at http://www.nmfs.noaa.gov/contact.htm, provides a list of all branch offices in the country. 16 The Alaska Department of Fish and Game (www.adfg.state.ak.us), the Washington Department of Fish and Wildlife (http://wdfw.wa.gov/), the Oregon Department of Fish and Wildlife (www.dfw.state.or.us), the California Department of Fish and Game (www.dfg.ca.gov/). 17 For more information on the U.S. Bureau of Citizenship and Immigration Services, formerly Immigration and Naturalization Services, see their website at http://uscis.gov/graphics/aboutus/thisisimm/index.htm.

participatory group. To provide fishery-specific information, we used the federally specified management groups (coastal pelagic, crab, groundfish, highly migratory species, salmon, shellfish, shrimp, and other species18). Landings data are associated to the principle port community for the vessel making the landings. Landings data provide information about community members’ involvement in commercial fisheries, and is comparable between different communities.
PacFIN provides the following information about the data they collect, manage, and supply to researchers and policy-makers. Landings are reported in pounds of round (live) weight for all species or groups except univalve and bivalve mollusks, such as clams, mussels, oysters and scallops, which are reported as pounds of meats (excludes shell weight). The dollar values of landings are reported as nominal (current at the time of reporting) values. Users can use the Consumer Price Index (CPI) or the Producer Price Index (PPI) to convert these nominal landing values into real (deflated) values. In our reporting of PacFIN data, we rounded all figures to whole numbers, unless that meant a figure was rounded to zero in which case two decimal places were reported. The data supplied by PacFIN has been obtained from fish tickets and information reported to PacFIN by other agencies including state fisheries management offices and the U.S. Coast Guard.
Federal statutes prohibit public disclosure of landings (or other information) that would allow identification of the data contributors and possibly put them at a competitive disadvantage. To comply with confidentiality measures we substitute compromising figures with the word “confidential” in the narrative descriptions of fishing involvement.
a. Landings by weight. Landings are reported for each commercial West
Coast fishery in equivalent round weight of landings in metric tons. b. Landings by value. Landings are reported for each commercial
West Coast fishery in U.S. dollars. c. Number of vessels. Number of unique vessels delivering landings in
each commercial West Coast fishery. d. Vessel participatory group. PacFIN data identifies vessels
participating in tribal commercial, commercial, personal use, or aquaculture groups. The number of vessels participating in each is reported. For aquaculture, its presence in the community is noted only for reasons of confidentiality.
18 In order to separate fishing participation into specific fisheries, the research team used federally specified management groups, however, state agencies do not necessarily collect and manage data according to the same system. The open access sectors increased the imprecision of this approach, but in the absence of a more exact system it was followed consistently throughout the project. The largest problem we encountered in this respect was in matching vessels to fisheries via permit information. Where we had complete vessel lists, this was more accurate. However, California has fisheries that limited the accuracy of this approach, such as open access, state-managed prawn trawl, and cucumber trawl.
2. Groundfish Vessel Buyback Program. The number of vessels that were part of the voluntary groundfish fishing capacity reduction program is reported. This program involved the federal buyback of vessels participating in the groundfish fishery and was implemented in 2003 by the National Marine Fisheries Service. The stated purpose of the program was to reduce the number of vessels and permits endorsed for the operation of groundfish trawl gear in order to increase productivity in the groundfish fishery, help financially stabilize the fishery, and conserve and manage fish. The program also involved fishing capacity reduction in the California, Oregon, and Washington fisheries for Dungeness crab and pink shrimp.19
3. Total number of fishing vessels owned by community residents, by fishery. Unique vessel identifiers were matched to permit data to determine participation in specific fisheries, and vessel owner residence was used to link vessels to a community. Vessel and permit data were supplied by Washington Department of Fish and Wildlife, Oregon Department of Fish and Wildlife, California Department of Fish and Game, and PacFIN.
Some problems were encountered in processing this data element. Two California fisheries, groundfish and highly migratory species, were partially or completely open access fisheries in 2000, and therefore no permit data exists to indicate participation in these efforts. To overcome this problem to the best of our ability, vessels were matched to landings data as well as permit data to match them to a fishery. Additionally, our data did not provide any matches between permits and vessels for the California shellfish and Washington shellfish and shrimp fisheries. Discrepancies and data problems occurred due to the open access nature of some fisheries in 2000, or because fisheries were too small to be adequately represented in the data. The research team dealt with these problems by denoting these fisheries with a “NA” to reflect that data was not available for the listed reasons. The “NA” notation signifies that there may have been participation in the fishery, but it is undocumented in our data sources. Where other supplementary information on these and other fisheries could be found through background research, that information was included in the narrative profiles.
4. Permit data. Permit data was supplied by the Washington Department of Fish and Wildlife (data for Washington fisheries), Oregon Department of Fish and Wildlife (data for Oregon fisheries), and PacFIN (data for California and the federally managed groundfish fisheries), and pertains to the year 2000. Some fisheries which were open access, such as albacore in Oregon and several California fisheries are not illustrated by our permit data. In such cases, the research team attempted to include information from other sources on these fisheries, such as qualitative or anecdotal information from a wide variety of sources. As occurred in our application of permit data to determine
19 For more information on the Groundfish Vessel Buyback Program visit the Pacific Fisheries Management Council online at http://www.pcouncil.org/groundfish/gfbuy.html.
participation of vessels in specific fisheries, the permit data did not yield information pertaining to the California shellfish fishery.
Records for the year 2000 for two other California fisheries also caused discrepancies in our data. These are the groundfish fishery and the highly migratory species (HMSP) fishery that were largely unpermitted at the time. This means that our permit data do not accurately reflect the level of participation in these two significant fisheries. Groundfish was an open access fishery in 2000. HMSP fishers would have had high seas permits if they fished at certain offshore depths, but these are not associated with the actual species. Only the drift gillnet fishery for target species of swordfish and thresher shark would actually have been permitted in 2000. In terms of the California HMSP fishery, 99% of the target species in 2000 would have been: 1. tuna, 2. swordfish, and 3. shark (thresher and mako). However, by 2005, significant measures are in place to have all the HMSP fisheries permitted.20
a. Total number of state and federal permits held by community residents, by fishery. The data describes how many permits are held by community members, but does not specify how permits are distributed among individuals, for example, one person could hold five permits associated to a community, or each one of five permits could be held by a unique individual.
b. Total number of community residents holding state and federal permits, by fishery. The data describes how many community members held permits.
5. Fish processing data. Baseline information about the number of processors operating in a community (the company itself may be based elsewhere), the average number of employees, and the species the facility processed, all for the year 2000, was obtained from the Processed Products Survey.21 The Survey also detailed the weight and value of fish processed by the facilities in 2000. This level of detail was reported in the narrative profiles only when confidentially stipulations allowed. Further information was gleaned form online resources and site visits and was included in the narrative profiles where it added relevant material.
6. Tribal commercial data. Tribal participation in commercial fisheries is a significant aspect of several West Cost fisheries. Where possible, we included information on any such involvement; however, data pertaining to tribal participation in commercial fisheries at the community level is difficult to obtain in some cases. For this reason, relevant information was gleaned from
20 See the Pacific Fishery Management Council website for more information on highly migratory species: http://www.pcouncil.org/hms/hmsback.html. 21 Response to the 2000 Fishery Products Report: U.S. Processors - Annual Survey, which is mailed out on an annual basis, is voluntary. There are many different ways of defining processors and the output products. In this dataset the definitions are based on the actual transformation of the product. For instance, a processor is a company where fish is canned, cured, cut, or reduced for meal oil etc., not simply frozen. Similarly, a processed product has been canned, cured, cut, reduced etc., not simply frozen.

online sources and site visits and included in the profiles where possible depending on data reliability and availability of such data.
II. Sportfishing
Information about community involvement in sportfishing reflects another form of participation in fisheries not captured when commercial information alone is reported. At the time of compiling the community profiles, sportfishing data was not readily or consistently available for all states. For this reason, we used relevant data wherever possible, and sometimes reported data for years other than 2000 in an effort to include useful information rather than excluding data that did not fit our predetermined timeframe. When data was not available from the year 2000, data from the most recent year available was selected.
1. Number of sportfishing operators (charter businesses) in community. Information about sportfishing charter businesses was supplied by Washington Department of Fish and Wildlife, Oregon Department of Fish and Wildlife, and California Department of Fish and Game. Unless otherwise stated, by listing the charter businesses in a community profile, we are indicating the location of the business office. We also include information about where charter vessels are homeported, and make distinctions between the business owner’s city of residence versus the city of operation when these are different and the data is available. Where the data distinguishes between business operator licenses for salmon (which additionally includes sturgeon and bottomfish species) and non-salmon (all other species) species, we report the distinction.
2. Number of sportfish license vendors in the community. Information about sportfishing license vendors was supplied by Washington Department of Fish and Wildlife, Oregon Department of Fish and Wildlife, and California Department of Fish and Game, where available, and gleaned from online resources. The figures reported here represent active sportfishing license agents.
3. Number and value of sportfishing licenses sold in the community. Information about sportfishing licenses was supplied by Washington Department of Fish and Wildlife22, Oregon Department of Fish and Wildlife, and California Department of Fish and Game, where available, and gleaned from online resources managed by these state agencies.
4. Sportfish landings and species fished. Information about sportfishing landings was supplied by Washington Department of Fish and Wildlife, Oregon Department of Fish and Wildlife, and California Department of Fish and Game, where available, and gleaned from online resources. In almost all
22 For more information on sportfishing license vendors see the Washington Department of Fish and Wildlife’s Licensing Sales Reporting System’s website at http://wdfg.wa.gov/lic/vendors/vendors.htm.

cases, this data has been recorded and reported at aggregate levels, and often corresponds to beach or management areas which are not directly associated with specific communities. Where possible, we mention this in the profiles and note that recreational landings data are for contiguous areas.
Involvement in North Pacific Fisheries. The section on fishing involvement in the North Pacific contains information on dependence and engagement in the fisheries off the coast of Alaska. All data is for the year 2000. Characterization of fisheries is both in terms of the nature and degree of involvement. The commercial fishing section contains information on landings (weight, value, and vessels owned by community members making deliveries), permits (number of permits held by residents of a community and number of residents holding permits), Individual Fishing Quota (IFQ) shares (number of halibut and sablefish IFQ shares held by residents of the community), vessel owners (number of vessel owners in the community that fish North Pacific fisheries), and crew members (number of State of Alaska commercial fishing crew member licenses held by community members). The Sportfishing section includes sportfishing businesses (number of sportfishing businesses in the community which are involved in fishing Alaskan waters) and sportfishing licenses (number of State of Alaska sportfishing licenses sold in the community to residents and individuals from out of the area).
The data sources for the elements included in the section Involvement in the North Pacific Fisheries include: the Alaska Department of Fish and Game (ADF&G), Alaska State Commercial Fisheries Entry Commission (CFEC), NMFS Alaska Regional Office (AKRO), NMFS Alaska Fisheries Science Center (AFSC), and NMFS Headquarters (HQ). Each data element is discussed below. Some landings data, permit and IFQ information, and details about vessel owners were also used in the community selection process described above (see Section 2.3), and are more thoroughly explained here.
I. Commercial Fishing
1. Number of vessels owned by community members. Data on vessels that fish in the North Pacific was extracted from Alaska State CFEC Commercial Vessel License lists and NMFS AKRO: FFP lists.
2. Weight and value of landings and the number of vessels making those landings by vessels owned by community members. North Pacific landings data is included for the following fisheries: crab, other finfish, Gulf of Alaska (GOA) groundfish, Bering Sea and Aleutian Islands (BSAI) groundfish, halibut, herring, salmon, scallop, and shellfish. The data shown in the profiles represents: landings in metric tons/value of said landings/number of vessels landing.
The count of vessels owned by residents by fishery data was extracted from NMFS AKRO: blend catch estimates and FFP lists, Alaska State CFEC fish tickets, and Commercial Vessel License lists. The landings in tons and dollars by owner residence by fishery was extracted from NMFS AKRO:
blend catch estimates and FFP lists, NMFS AFSC: ex-vessel prices from Table 18 of the SAFE Economic Status Report23, ADF&G fish tickets, and Alaska State CFEC Commercial Vessel License lists. The fisheries were defined by the landed species.
3. Crewmember Data. The number of community members that held crewmember licenses, for commercially fishing in the North Pacific, issued by the ADF&G. Data provided by ADF&G and totals by community were tabulated.
4. Permit Data.
a. Total number of state and federal permits. Data includes State of Alaska and federal North Pacific fishery permits registered to community members summed. The data was extracted from NMFS AKRO: Restricted Access Management Division License Limitation Program permit lists, American Fisheries Act permit lists, and Federal Fisheries Permit (FFP) lists; NMFS HQ: High Seas Fisheries Compliance Act permit lists and Alaska State CFEC Commercial Fishing Permit lists.
b. Individuals holding federal permits. Data includes the total number of individuals in the community that held federal permits to fish the North Pacific. The data was extracted from NMFS AKRO: Restricted Access Management Division License Limitation Programs permit lists, Federal Fisheries Permits lists, American Fisheries Act permit lists, Individual Fishery Quota share lists, and from NMFS HQ: High Seas Fisheries Compliance Act lists.
c. Individuals holding state permits. Data includes the total number of individuals in the community that held state permits to fish in Alaska. The data was extracted from Alaska State CFEC Commercial Fishing Permit lists.
5. Number of permits held by community residents by type and fishery. Data includes the total number of permits registered to community residents for North Pacific fisheries by type and fishery.
23 Hiatt, T., R. Felthoven, and J. Terry. National Marine Fisheries Service. Alaska Fisheries Science Center.
November 15, 2001. Stock Assessment and Fishery Evaluation Report for the Groundfish Fisheries of the Gulf of Alaska and Bering Sea/Aleutian Island Area: Economic Status of the Groundfish Fisheries off Alaska, 2000. p. 48.
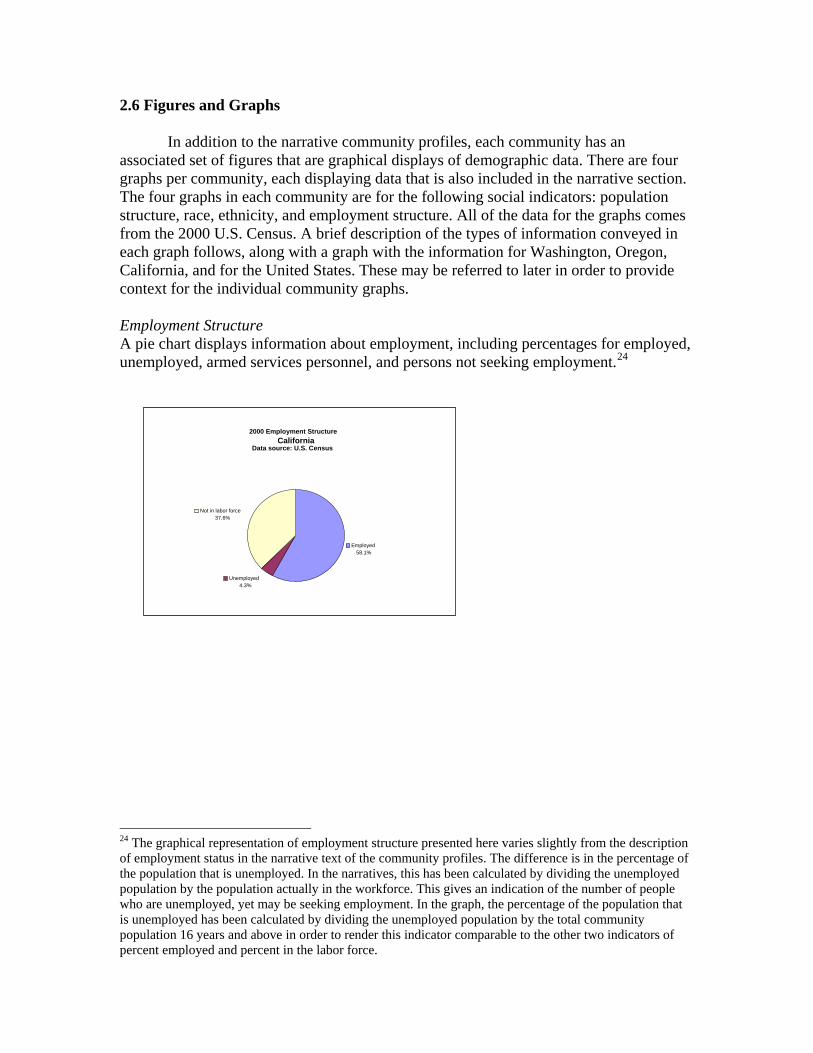
2.6 Figures and Graphs In addition to the narrative community profiles, each community has an associated set of figures that are graphical displays of demographic data. There are four graphs per community, each displaying data that is also included in the narrative section. The four graphs in each community are for the following social indicators: population structure, race, ethnicity, and employment structure. All of the data for the graphs comes from the 2000 U.S. Census. A brief description of the types of information conveyed in each graph follows, along with a graph with the information for Washington, Oregon, California, and for the United States. These may be referred to later in order to provide context for the individual community graphs. Employment Structure A pie chart displays information about employment, including percentages for employed, unemployed, armed services personnel, and persons not seeking employment.24
2000 Employment Structure California
Data source: U.S. Census
Unemployed 4.3%
Not in labor force 37.6%
Employed58.1%
24 The graphical representation of employment structure presented here varies slightly from the description of employment status in the narrative text of the community profiles. The difference is in the percentage of the population that is unemployed. In the narratives, this has been calculated by dividing the unemployed population by the population actually in the workforce. This gives an indication of the number of people who are unemployed, yet may be seeking employment. In the graph, the percentage of the population that is unemployed has been calculated by dividing the unemployed population by the total community population 16 years and above in order to render this indicator comparable to the other two indicators of percent employed and percent in the labor force.

2000 Employment Structure Oregon
Data source: U.S. Census
Employed61.0%
Unemployed 4.2%
Not in labor force 34.8%
2000 Employment Structure Washington
Data source: U.S. Census
Employed62.4%
Unemployed 4.1%
Not in labor force 33.5%
2000 Employment Structure United States
Data source: U.S. Census
Employed60%
Unemployed 4%
Not in labor force 36%

Population Structure Resize and uniform all graphs. A “population pyramid” is a bi-directional bar chart that indicates both age (in ten year intervals) and gender (male = left bars, female = right bars) of the population. Many of the population pyramids in fishing communities show a distinct bulge of working-age males that is unusual when compared to more typical population pyramids. For comparison of general shapes, the population pyramids for California, Oregon, Washington, and the United States are reproduced below. World population is included because it best exemplifies the theoretical population structure against which other structures can be compared. The State and national structures are included because they provide relevant geographical units against which a particular community may be compared. We used 10-year intervals to create smoother diagrams for the each community; however the diagrams below show five-year intervals for the sake of detail.
3000000 2000000 1000000 0 1000000 2000000 3000000
Number of Individuals
0 to 9 10 to 19 20 to 29 30 to 39 40 to 49 50 to 59 60 to 69 70 to 79
80 and over
Age
2000 Population Structure California
Data source: U.S. Census
MaleFemale
300000 200000 100000 0 100000 200000 300000Number of Individuals
0 to 9 10 to 19 20 to 29 30 to 39 40 to 49 50 to 59 60 to 69 70 to 79
80 and over
Age
2000 Population Structure Oregon
Data source: U.S. Census
MaleFemale
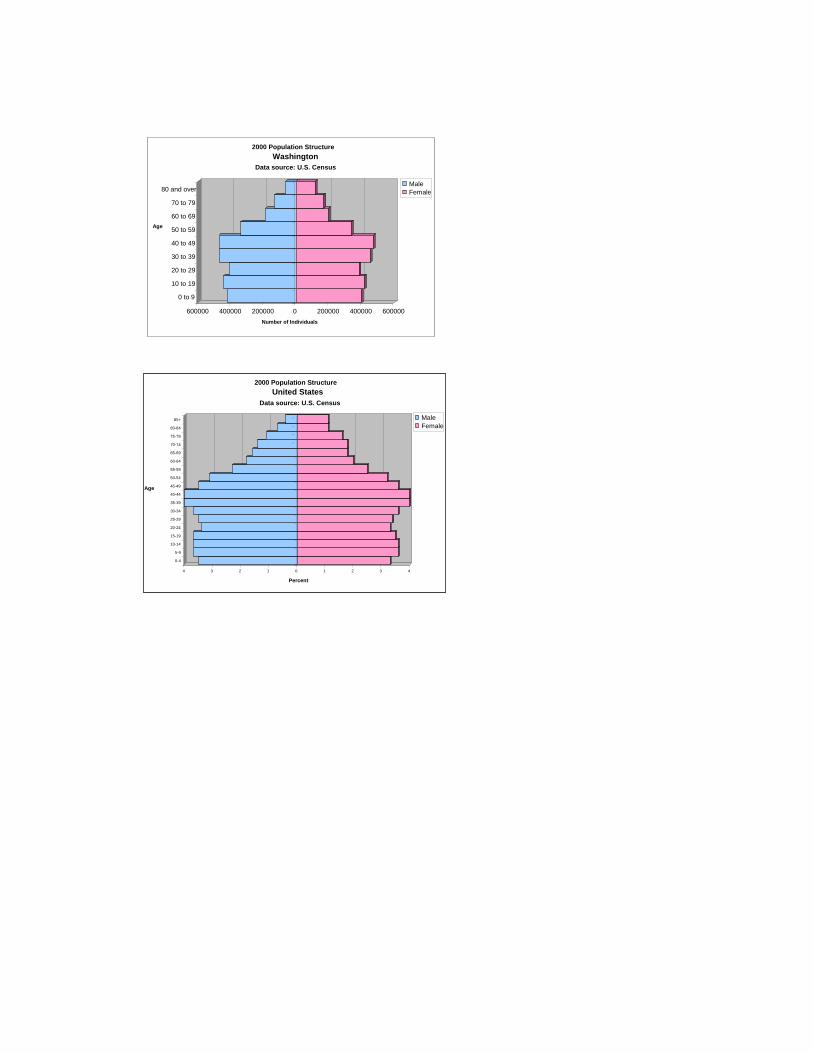
600000 400000 200000 0 200000 400000 600000Number of Individuals
0 to 9 10 to 19 20 to 29 30 to 39 40 to 49 50 to 59 60 to 69 70 to 79
80 and over
Age
2000 Population Structure Washington
Data source: U.S. Census
MaleFemale
4 3 2 1 0 1 2 3 4
Percent
0-4 5-9 10-14 15-19 20-24 25-29 30-34 35-39 40-44 45-49 50-54 55-59 60-64 65-69 70-74 75-79 80-84 85+
Age
2000 Population Structure
Data source: U.S. Census
United States
MaleFemale

Race Graphed data is taken from U.S. Census, using their mandated minimum five categories: American Indian or Alaska Native, Asian, Black or African American, Native Hawaiian or Other Pacific Islander, and White. For space reasons in the graphs, we shorten three of the terms as follows: Native (for American Indian or Alaska Native), Black (for Black or African American), and Pacific Islander (for Hawaiian or Other Pacific Islander). Graphs are produced for Washington, Oregon, California, and the United States.
2000 Racial Structure California
Data source: U.S. Census
White59.5%
Black 6.7%
Native 1.0%
Asian 10.9%
Pacific Islander 0.3%
Other 16.8%
Two or more races 4.7%
2000 Racial Structure Oregon
Data source: U.S. Census
White86.6%
Asian 3.0%
Other 4.2%
Pacific Islander 0.2%
Native 1.3%
Black 1.6%
Two or more races3.1%
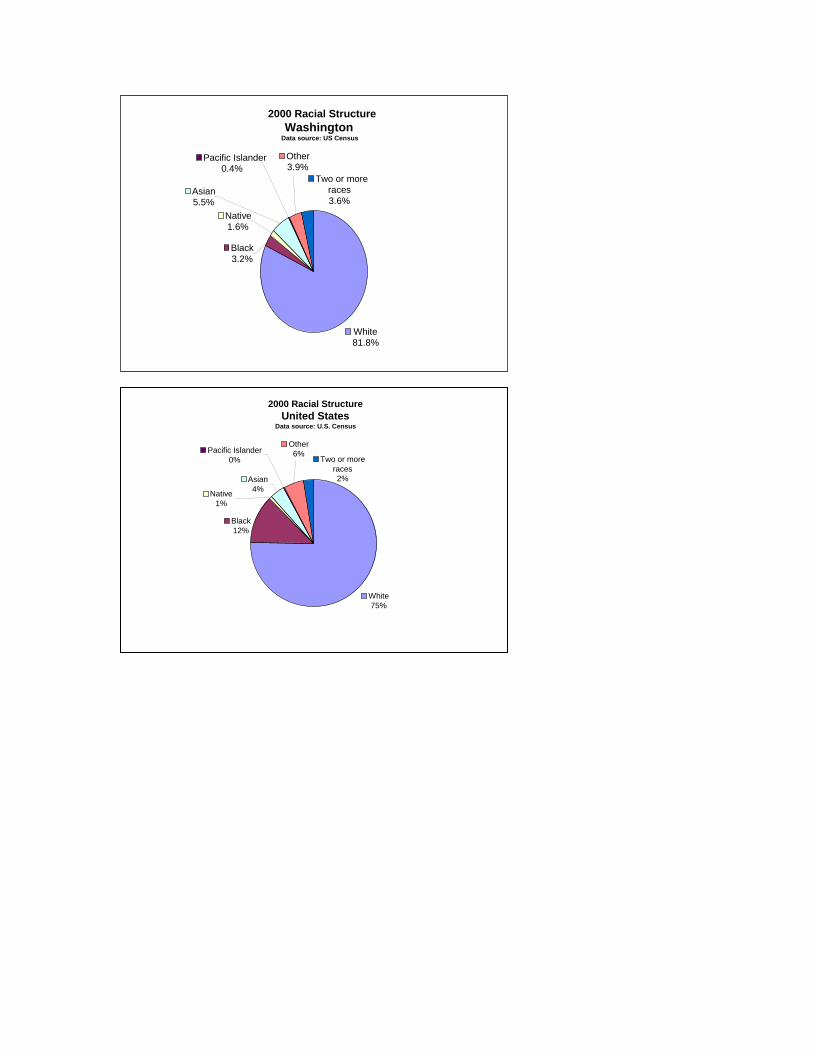
2000 Racial Structure Washington
Data source: US Census
White81.8%
Asian 5.5%
Pacific Islander 0.4%
Other 3.9%
Two or more races3.6%
Black 3.2%
Native 1.6%
2000 Racial Structure United States
Data source: U.S. Census
White75%
Pacific Islander 0%
Asian 4% Native
1% Black 12%
Other 6%
Two or more races2%
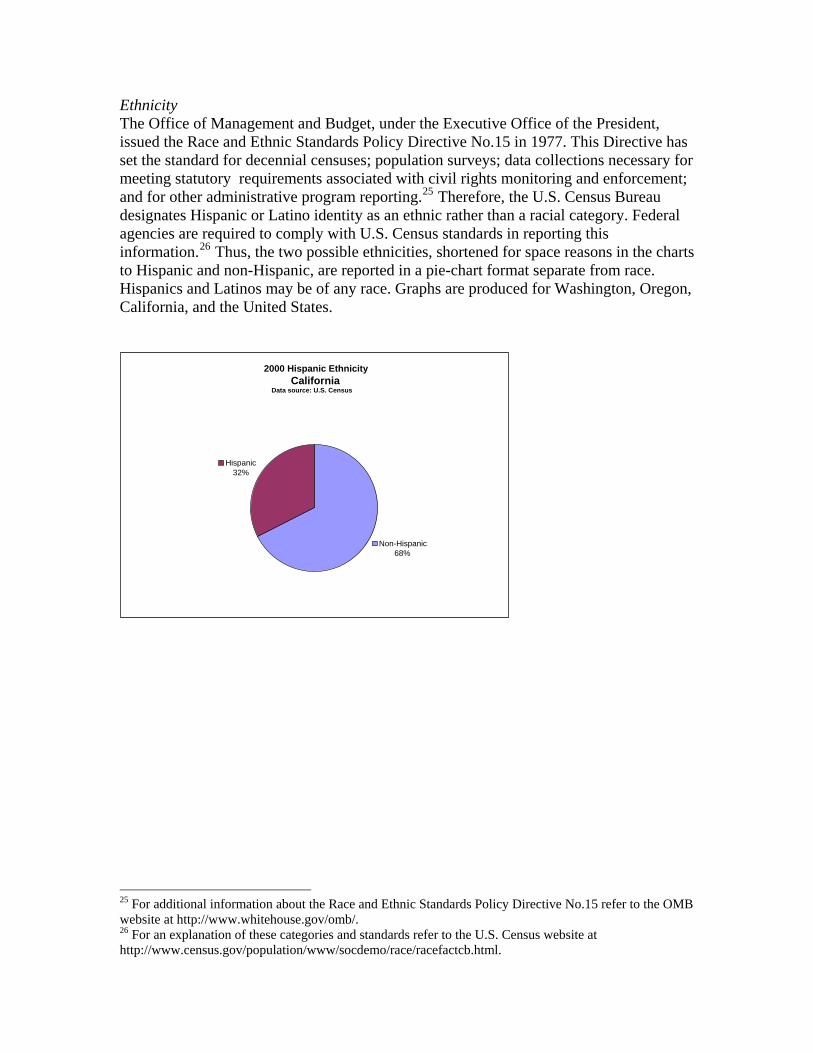
Ethnicity The Office of Management and Budget, under the Executive Office of the President, issued the Race and Ethnic Standards Policy Directive No.15 in 1977. This Directive has set the standard for decennial censuses; population surveys; data collections necessary for meeting statutory requirements associated with civil rights monitoring and enforcement; and for other administrative program reporting.25 Therefore, the U.S. Census Bureau designates Hispanic or Latino identity as an ethnic rather than a racial category. Federal agencies are required to comply with U.S. Census standards in reporting this information.26 Thus, the two possible ethnicities, shortened for space reasons in the charts to Hispanic and non-Hispanic, are reported in a pie-chart format separate from race. Hispanics and Latinos may be of any race. Graphs are produced for Washington, Oregon, California, and the United States.
2000 Hispanic Ethnicity California
Data source: U.S. Census
Non-Hispanic68%
Hispanic 32%
25 For additional information about the Race and Ethnic Standards Policy Directive No.15 refer to the OMB website at http://www.whitehouse.gov/omb/. 26 For an explanation of these categories and standards refer to the U.S. Census website at http://www.census.gov/population/www/socdemo/race/racefactcb.html.
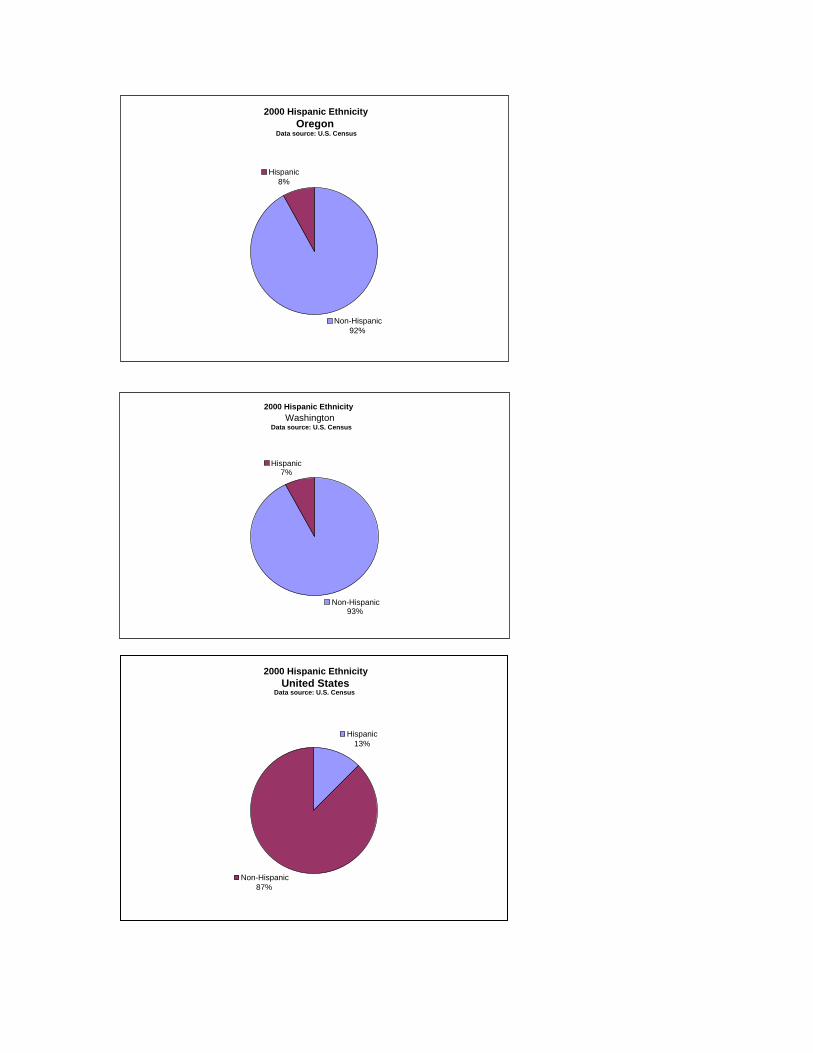
2000 Hispanic Ethnicity Oregon
Data source: U.S. Census
Non-Hispanic92%
Hispanic 8%
2000 Hispanic Ethnicity Washington
Data source: U.S. Census
Non-Hispanic93%
Hispanic 7%
2000 Hispanic Ethnicity United States
Data source: U.S. Census
Hispanic13%
Non-Hispanic 87%
2.7 Community Comments Include information on the community vetting process. 4.0 References Langdon-Pollock, J. (2004). West Coast Marine Fishing Community Descriptions. Pacific States Marine Fisheries Commission. North Pacific Fishery Management Council. (1994). Faces of the Fisheries. North Pacific Fishery Management Council, Anchorage, Alaska. Northern Economics, Inc., and EDAW, Inc. (2002). Sector and regional profiles of the North Pacific groundfish fisheries – 2001. North Pacific Fishery Management Council, Anchorage, Alaska, from http://www.fakr.noaa.gov/npfmc/misc_pub/NorthernEconomics/RegionalProfile.pdf. Russell, Suzanne. 2003. An Inquiry into the Use of Social Science in the Federal Management of U.S. Marine Fisheries. A Thesis submitted to the School of Marine Affairs, University of Washington, Seattle, Washington. Sepez, J.A., B.D. Tilt, C.L. Package, H.M. Lazrus, and I. Vaccaro. (2005). Community profiles for North Pacific fisheries - Alaska, Dept. Commer. NOAA Tech. Memo. NMFS-AFSC-160. 552 p. Sepez, J., K. Norman, A. Poole, B. Tilt. (2006). Fish Scales: Scale and Method in Social Science for North Pacific and West Coast Fishing Communities. Human Organization, Autumn.
5.0 Appendices 5.1 Appendix A: Invalid Communities due to DEA Non-Convergence
Non-convergence in the DEA model occurred for various reasons, including the
particular indicator mix or the scale of the different indicators relative to other communities. The following communities showed non-convergence and many were removed after consideration.
Two Alaska communities’ scores did not converge for the WC and NP Combined Dependence score and 23 did not converge for the WC and NP Combined Engagement score. These communities were omitted from the analysis because they are situated in Alaska and were profiled previously by Sepez et al. (2005).
West Coast and North Pacific Combined Engagement scores did not converge for a total of 68 communities in seven states: Alaska (23), California (29), Florida (1), Idaho (1), Nebraska (1), Oregon (7), and Washington (6). For a total of 34 communities in three states, California (29), Oregon (4), and Washington (1), WC Only Engagement scores did not converge. Although the communities listed below failed to converge, many of these communities were profiled due to their high WC Dependence and WC and NP Combined Dependence scores. The communities for which profiles were produced are italicized below. WC and NP Combined Dependence Score Alaska: Port Alexander and Whittier. WC and NP Combined Engagement Score
Alaska: Ambler, Anchorage, Angoon, Chefornak, Copper Center, Cordova, Craig, Edna Bay, Ekwok, Elim, Goodnews Bay, Haines, Homer, Igiugig, Kake, Ketchikan, Klawock, Kongiganak, Metlakatla, Ninilchik, Platinum, Skagway, and Toksook Bay.
California: Alpine, Bodega Bay, Carlsbad, Cazadero, Concord, Fairfield, Gardena, Livermore,
Lomita, Monterey, Moss Landing, Napa, Oxnard, Perris, Petaluma, Princeton, Rancho Palos Verdes, Rodeo, Sacramento, Salinas, San Anselmo, San Bruno, San Francisco, San Jose, Santa Clara, Santa Cruz, Stockton, Thousand Oaks, and Woodland.
Florida: Dade City. Idaho: Bayview. Nebraska: Grand Island. Oregon: Astoria, Brookings, Coos Bay, Lincoln City, Portland, Toledo, and Vernonia.
Washington: Bellingham, Gig Harbor, Ilwaco, Kalama, Renton, and Seabeck.
WC Only Engagement Score
California: Carlsbad, Concord, El Granada, El Sobrante, Fairfield, Fremont, Garden Grove, Livermore, Marina, Monterey, Morro Bay, Moss Landing, Oroville, Princeton, Petaluma, Ranchos Palos Verdes, Redwood City, Redwood Valley, Rodeo, Sacramento, Salinas, San Francisco, San Lorenzo, San Pedro, Santa Clara, Santa Cruz, Stockton, Westminster, and Woodland.

Oregon: Astoria, Brookings, Coos Bay, and Portland.
Washington: Ilwaco.
5.2 Appendix B: Place-Based Communities
The demographic characteristics of many U.S. communities are readily available via the U.S. Census Website, or other data formats produced by the U.S. Census Bureau. Unfortunately, this is not always the case for what we may refer to as “nested, place-based communities.” Large urban areas, such as Seattle, Los Angeles, and San Francisco, encompass numerous smaller communities or sub-communities. These sub-communities may be defined by affiliation, interest or place. Some smaller communities, such as New York’s “Little Italy,” may fit the criteria for several of these community definitions. In the fishing community profiling research, the research team was required, by the nature of the project, to investigate nested, place-based communities.
Nested fishing communities fall geographically within larger communities, often in the form of major U.S. cities. Some of these larger communities, the City of Los Angeles for example, also participate in the fishing industry but generally to a more diffuse and less intensive degree. Within a coastal city such as Seattle or Los Angeles, one may be able to geographically pinpoint a nested community that is substantially linked to fishing activities (IAI 2004). In such a nested community, the level of involvement in fishing would be more significant per capita than in the larger urban area, where economic diversification provides for multiple livelihoods. There are at least two scenarios that may arise in which a community’s demographic characteristics are not readily available via the more user-friendly U.S. Census formats. In some instances a community may not be a census-designated place (CDP). In these cases the U.S. Census offers zip code or block level data for these localities but does not offer integrated demographic characteristics for the locality as a whole. A second scenario occurs when there are discrepancies between a community’s boundaries as defined and applied by the U.S. Census, and the community’s boundaries as identified or determined by a particular research endeavor.
We encountered both of the above scenarios while researching the nested communities of Terminal Island and San Pedro, both of which are within the larger community of Los Angeles, California. Although Northwest Fisheries Science Center policy interests and field research had identified these as unique communities, the U.S. Census had defined these areas differently. In other words, the community profiling research team identified Terminal Island as a distinct community worthy of profiling despite the fact that the U.S. Census does not recognize Terminal Island as a distinct place. The boundaries used by the U.S. Census split Terminal Island into a northern portion and a southern portion. According to the U.S. Census, the northern half of Terminal Island rests within the nested community of San Pedro, while the southern portion of Terminal Island lies within the boundaries of the Port of Long Beach.
Although the U.S. Census provided demographic data for the community of San Pedro via Zip Code Tabulation Areas (ZCTAs), these data were premised on geographical boundaries that were incongruent with the boundaries identified for the NOAA social science research. Again, based on the U.S. Census circumscription, a portion of Terminal Island and several indiscriminate contiguous areas are encompassed within the boundaries of San Pedro, a nested community that required separate consideration in our analysis. As a result of the lack of ready data for the communities of Terminal Island and San Pedro, the research team needed to identify an appropriate
method for obtaining demographic characteristics for these two localities. The solution to this challenge was to attain the data from another source. This required the identification of organizations that have conducted demographic studies of the area and the research team ultimately sourced demographic characteristics for San Pedro and Terminal Island from the City of Los Angeles Planning Department and the Los Angeles Almanac respectively. The decision to acquire the data from an external source was premised on efficiency, as the calculation of the community data from Census Block and Tract level data would have entailed a much greater expenditure of resources. A third source that was useful to clearly delineate the boundaries of communities that were not CDPs came from the U.S. Environment Protection Agency (EPA).27 This web-based community demographic analysis integrates Geographic Information System (GIS) tools with U.S. Census-derived demographic information. For example, the community of Terminal Island, nested within the City of Los Angeles, is not a CDP. Using the EPA’s web tool, team members could draw a polygon around Terminal Island and thereby obtain the necessary demographic information for this community based on the articulation of its boundaries.
Some population centers feature inherent difficulties in fishing community profiling efforts. Rapid growth, suburban sprawl, and local political issues will occasionally result in the U.S. Census not designating some communities, despite their substantial size and importance in a fisheries-oriented framework, as CDPs. Several communities without the U.S. Census designation nevertheless appeared in a list of communities deserving of a detailed NOAA Fisheries profile. These places are often listed in databases of fisheries information that rely on self-reporting of fisheries participants. In 2000 the U.S. Census Bureau dropped, for the first time, the minimum population size required for “place” designation. Nevertheless, some large areas and historically recognized communities escaped designation. The aforementioned nested communities, because of their placement within larger CDPs, are also not designated as CDPs. When a community is not a CDP, it makes the reporting of demographic information more difficult. For example, in the case of Tarzana, California, and other West Coast communities, the U.S. Census data had to be assembled from a grouping of ZCTAs. There are problems associated with ZCTAs, though they are not insurmountable.
The two inherent problems in using ZCTAs are that they may 1) cross county boundaries and; 2) may be demographically inaccurate for that reason. The U.S. Census Bureau’s CDP is the most defensible and efficient means of getting at demographic information, but the NWFSC project required more communities than were included in the U.S. Census’ list of CDPs. Nevertheless, in many instances, an assemblage of ZCTAs linked to a particular place name was used in developing demographic profiles of the communities. The ZCTAs were useful in effect because only 27% of them feature community boundary overlap, and they present a means of assembling U.S. Census-based demographic data when no others exist. 27 For more information please refer to the EPA’s website at http://www.epa.gov/enviro/ej/.

5.3 Appendix C: Authors Include a one paragraph biosketch on each author. Karma Norman Jennifer Sepez Heather Lazrus Nicole Milne Christina Package Suzanne Russell Kevin Grant Robin Petersen John Primo Megan Styles Bryan Tilt Ismael Vaccaro Authors by Profile Although the profiling was a collaborative effort, individual team members are largely responsible for the first draft of each profile. Subsequent revisions and edits were made by other members of the team, plus the NWFSC publications staff. Introduction and Methods – Heather Lazrus, Karma Norman, and Jennifer Sepez Washington Aberdeen – Bryan Tilt Anacortes – Heather Lazrus Bay Center – Megan Styles Bellingham – Nicole Milne Blaine – Heather Lazrus and Nicole Milne Bothell – Christina Package Cathlamet – Megan Styles Chinook – Megan Styles Edmonds – Christina Package Everett – Nicole Milne Ferndale – Jennifer Sepez Fox Island – Christina Package Friday Harbor – Heather Lazrus Gig Harbor – Kevin Grant and Heather Lazrus Grayland – Heather Lazrus and Bryan Tilt Ilwaco – Suzanne Russell La Conner – Nicole Milne La Push – Christina Package Lakewood – Christina Package Long Beach – Suzanne Russell Lopez – Heather Lazrus Mount Vernon – Nicole Milne Naselle – Megan Styles Neah Bay – Christina Package and Jennifer Sepez Olympia – Kevin Grant Port Angeles –Nicole Milne Port Townsend – Heather Lazrus and Nicole Milne

Raymond – Megan Styles Seattle – Christina Package Seaview – Megan Styles Sedro-Woolley – Christina Package Sequim – Nicole Milne Shelton – Kevin Grant Silvana – Nicole Milne South Bend – Megan Styles Stanwood – Nicole Milne Tacoma – Kevin Grant Tokeland – John Primo Westport – Nicole Milne Woodinville – Christina Package
Oregon Astoria – Heather Lazrus Bandon – Robin Petersen and Suzanne Russell Beaver – Kevin Grant and Heather Lazrus Brookings – Heather Lazrus and Robin Peterson Charleston – Suzanne Russell Clatskanie – Bryan Tilt Cloverdale – Kevin Grant and Heather Lazrus Coos Bay – Suzanne Russell Depoe Bay – Nicole Milne Florence – Kevin Grant and Karma Norman Garibaldi – John Primo Gold Beach – Robin Peterson and Christina Package Hammond – Bryan Tilt Harbor – Heather Lazrus and Robin Petersen Logsdon – John Primo Monument – Bryan Tilt Newport – Heather Lazrus and Robin Petersen North Bend – Suzanne Russell Pacific City – Heather Lazrus Port Orford – Karma Norman Reedsport – Suzanne Russell Rockaway Beach – John Primo Roseburg – Bryan Tilt Seaside – Nicole Milne Siletz – John Primo Sisters – Robin Petersen South Beach – John Primo Tillamook – Kevin Grant and Heather Lazrus Toledo – John Primo Warrenton – Heather Lazrus Winchester Bay – Suzanne Russell California Albion – Bryan Tilt Arroyo Grande – Kevin Grant and Heather Lazrus Atascadero – Kevin Grant and Heather Lazrus Avila Beach – Kevin Grant and Heather Lazrus Bodega Bay – John Primo Corte Madera – Nicole Milne Costa Mesa – Kevin Grant and Heather Lazrus

Crescent City – Robin Peterson and Suzanne Russell Culver City – Megan Styles Dana Point – Bryan Tilt Dillon Beach – Kevin Grant and Nicole Milne El Granada – Nicole Milne El Sobrante – Nicole Milne Eureka – Heather Lazrus and Robin Petersen Fields Landing – Heather Lazrus and Robin Petersen Fort Bragg – Megan Styles Half Moon Bay – Nicole Milne Kneeland – Megan Styles Lafayette – Nicole Milne Long Beach – Kevin Grant and Heather Lazrus Los Angeles (including San Pedro and Terminal Island) – Kevin Grant and John Primo Los Osos – Kevin Grant and Heather Lazrus Marina – Megan Styles McKinlyville – Megan Styles and Christina Package Monterey – Kevin Grant Morro Bay – Kevin Grant Moss Landing – Heather Lazrus and Robin Petersen Novato – Nicole Milne Oxnard – Nicole Milne Pebble Beach – Megan Styles Point Arena – Bryan Tilt Port Hueneme – Nicole Milne Princeton – Nicole Milne San Diego – Nicole Milne and John Primo San Francisco – Nicole Milne San Jose – Nicole Milne Santa Ana – Bryan Tilt Santa Barbara – Christina Package Santa Cruz – John Primo Santa Rosa – Bryan Tilt Sausalito – Nicole Milne Seaside – Nicole Milne Sebastopol – Megan Styles Sunset Beach – Bryan Tilt Tarzana – Megan Styles Torrance – Megan Styles Trinidad – Heather Lazrus and Robin Petersen Ukiah – Megan Styles Valley Ford – Heather Lazrus Ventura – John Primo Other States Pleasantville, New Jersey – Megan Styles Seaford, Virginia – Megan Styles
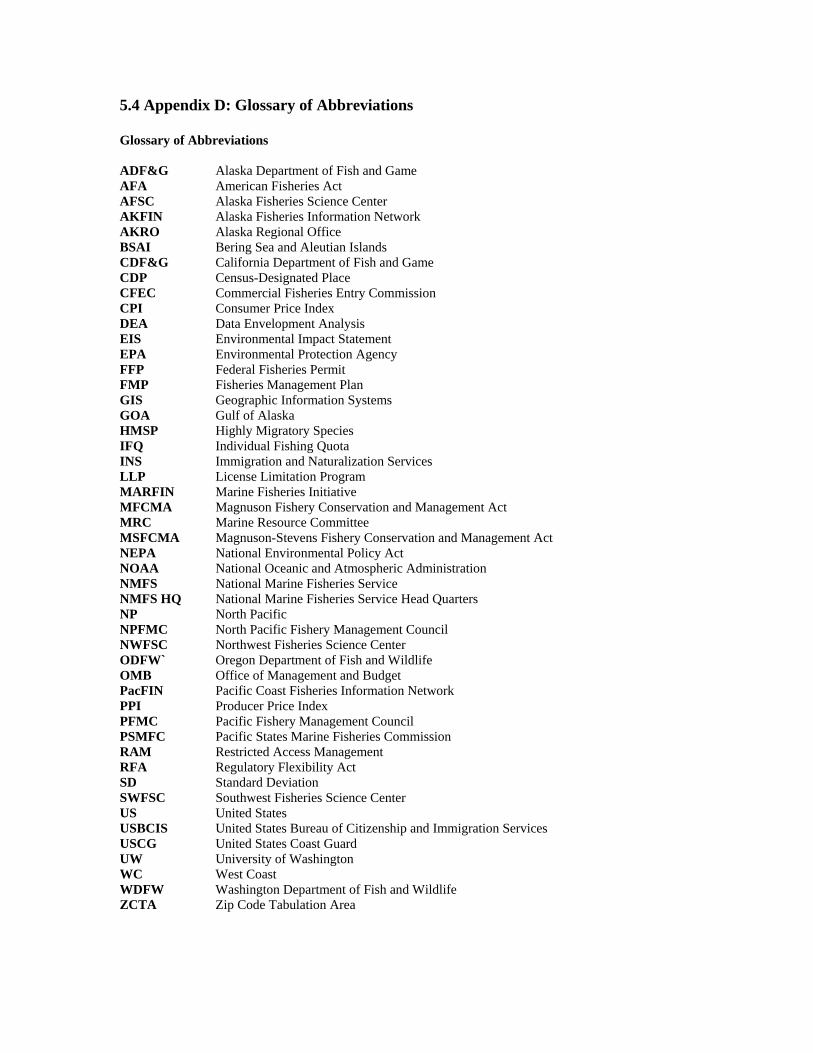
5.4 Appendix D: Glossary of Abbreviations Glossary of Abbreviations ADF&G Alaska Department of Fish and Game AFA American Fisheries Act AFSC Alaska Fisheries Science Center AKFIN Alaska Fisheries Information Network AKRO Alaska Regional Office BSAI Bering Sea and Aleutian Islands CDF&G California Department of Fish and Game CDP Census-Designated Place CFEC Commercial Fisheries Entry Commission CPI Consumer Price Index DEA Data Envelopment Analysis EIS Environmental Impact Statement EPA Environmental Protection Agency FFP Federal Fisheries Permit FMP Fisheries Management Plan GIS Geographic Information Systems GOA Gulf of Alaska HMSP Highly Migratory Species IFQ Individual Fishing Quota INS Immigration and Naturalization Services LLP License Limitation Program MARFIN Marine Fisheries Initiative MFCMA Magnuson Fishery Conservation and Management Act MRC Marine Resource Committee MSFCMA Magnuson-Stevens Fishery Conservation and Management Act NEPA National Environmental Policy Act NOAA National Oceanic and Atmospheric Administration NMFS National Marine Fisheries Service NMFS HQ National Marine Fisheries Service Head Quarters NP North Pacific NPFMC North Pacific Fishery Management Council NWFSC Northwest Fisheries Science Center ODFW` Oregon Department of Fish and Wildlife OMB Office of Management and Budget PacFIN Pacific Coast Fisheries Information Network PPI Producer Price Index PFMC Pacific Fishery Management Council PSMFC Pacific States Marine Fisheries Commission RAM Restricted Access Management RFA Regulatory Flexibility Act SD Standard Deviation SWFSC Southwest Fisheries Science Center US United States USBCIS United States Bureau of Citizenship and Immigration Services USCG United States Coast Guard UW University of Washington WC West Coast WDFW Washington Department of Fish and Wildlife ZCTA Zip Code Tabulation Area
6.0 Index of Communities Include page numbers Washington Aberdeen Anacortes Bay Center Bellingham Blaine Bothell Cathlamet Chinook Edmonds Everett Ferndale Fox Island Friday Harbor Gig Harbor Grayland Ilwaco La Conner La Push Lakewood Long Beach Lopez Mount Vernon Naselle Neah Bay Olympia Port Angeles Port Townsend Raymond Seattle Seaview Sedro-Woolley Sequim Shelton Silvana South Bend Stanwood Tacoma Tokeland Westport Woodinville Oregon Astoria Bandon Beaver Brookings Charleston Clatskanie Cloverdale Coos Bay Depoe Bay Florence
Garibaldi Gold Beach Hammond Harbor Logsdon Monument Newport North Bend Pacific City Port Orford Reedsport Rockaway Beach Roseburg Seaside Siletz Sisters South Beach Tillamook Toledo Warrenton Winchester Bay California Albion Arroyo Grande Atascadero Avila Beach Bodega Bay Corte Madera Costa Mesa Crescent City Culver City Dana Point Dillon Beach El Granada El Sobrante Eureka Fields Landing Fort Bragg Half Moon Bay Kneeland Lafayette Long Beach Los Angeles (including San Pedro and Terminal Island) Los Osos Marina McKinleyville Monterey Morro Bay Moss Landing Novato Oxnard Pebble Beach Point Arena Port Hueneme Princeton

San Diego San Francisco San Jose Santa Ana Santa Barbara Santa Cruz Santa Rosa Sausalito Seaside Sebastopol Sunset Beach Tarzana Torrance Trinidad Ukiah Valley Ford Ventura