community life survey 2016-2017 · chapter 1: introduction the community life survey ... 5 only...
TRANSCRIPT

Community Life Survey 2016-2017
Headline Findings:
In 2016-17, around a fifth (22%) of adults said they had taken part in formal volunteering at least once a month. When looking at all volunteering (formal and informal), nearly two thirds of adults (63%) had engaged at least once a year.
Three quarters (75%) of adults said they had given to charity in the four weeks prior to completing the survey. The average amount given was £22.
In 2016-17, 85% of respondents felt that they belonged very or fairly strongly to Britain compared to 62% who felt they belonged to their neighbourhood.
Figure 1: Proportion belonging to Britain and their neighbourhood, 2013-14 to 2016-17
Levels of community cohesion remained consistent with previous years, with four out of five respondents (81%) agreeing that their local area is a place where people from different backgrounds get on well together.
0
20
40
60
80
100
2013-14 2014-15 2015-16 2016-17
% Belong strongly to their neighbourhood Belong strongly to Britain
The Community Life Survey is a survey of adults (16+) in England that explores levels of community cohesion and engagement.
This report summarises the results from the 2016-17 survey, which was run from August 2016 to March 2017. This is the first year that the annual results have been based on data collected using a self-completion online/paper questionnaire rather than via a face to face interview. Responsible statistician:
Olivia Christophersen
Statistical enquiries:
@DCMSInsight
General enquiries:
0207 211 6200
Media enquiries:
020 7211 2210
Date: 25 July 2017
Contents
Chapter 1: Introduction 2
Chapter 2: Volunteering 3
Chapter 3: Charitable Giving 5
Chapter 4: Civic Engagement and Social Action 6
Chapter 5: Community Decisions 8
Chapter 6: Neighbourhood and Community 10
Chapter 7: Well-being 14
Annex A: Methodology 16
We welcome feedback on the Community Life Survey and we are keen to identify our user base so we can ensure these statistics meet users’ needs. Please contact us at [email protected] if you would like to be kept up to date with developments to the survey or if you have any comments or suggestions on this release.
2
Chapter 1: Introduction
The Community Life Survey (CLS) is a survey of adults (16+) in England. It tracks trends across areas that are key to encouraging social action and empowering communities, such as:
Volunteering and charitable giving;
Neighbourhood (views about the local area, community cohesion and belonging);
Civic engagement and social action, and
Well-being. This nationally representative survey provides data on behaviours and attitudes to inform policy and action in these areas. The survey provides data of value to a range of users, including government departments, public bodies, external stakeholders and the public. These findings are Official Statistics and fall under the remit of the Code of Practice for Official Statistics. More information can be found at: http://www.statisticsauthority.gov.uk/assessment/code-ofpractice/code-of-practice-for-official-statistics.pdf Survey Design The CLS is a household survey that has been carried out each year since 2012-13. Some measures from the Citizenship Survey, which was run by the Department for Communities and Local Government from 2001 to 2010-11, were incorporated into the CLS to continue trend data on these issues. Up to 2015-16, the survey used a face-to-face methodology. An online/paper survey methodology has been investigated in recent years to reduce costs. Following thorough testing, the CLS moved to an online and paper mixed method approach from 2016-17 onwards, with an end to the current face-to-face method. This change enables a larger sample to be collected and does not require the sample to be clustered by area to reduce interviewer costs. Therefore, it should improve the quality of the estimates. However, it does represent a break in time series as the face-to-face estimates are not directly comparable with the self-completion estimates. There are noticeable differences observed between the two modes of data collection in the results for some questions. Substantial testing took place before this change in mode, which included collecting online/paper data for the years from 2013-14 to 2015-16 alongside the main face-to-face data. In order to enable time series exploration, we have published the 2016-17 self-completion estimates alongside this methodological back series, providing 4 years’ worth of comparable data. More information on this change can be found in the Online/Postal Estimates Technical Note. This bulletin focuses on the data collected between 2013-14 and 2016-17 via self-completion online/paper questionnaire. While the text only covers this period, charts have been provided that show the self-completion data alongside the face-to-face estimates, which for some variables go back to 2001 as part of the Citizenship Survey. This allows users to visualise the impact of the change on methodology for different questions. All data in this bulletin, as well as the full face-to-face and online/paper time series and further breakdowns can be found in the reference tables. Only those differences deemed as statistically significant (at the P<0.05 level) are mentioned in the text. This means that the probability of any observed change happening by chance is low (1 in 20). Further details regarding the survey methodology can be found in Annex A. A full technical report will be released in Autumn 2017.

3
Chapter 2: Volunteering
Respondents were asked whether they had participated in formal volunteering, defined as providing unpaid help through groups, clubs or organisations. They were also asked about informal volunteering, defined as providing unpaid help as an individual to people who are not a relative. A respondent is considered to have undertaken ‘any volunteering’ if they have done any formal and/or informal volunteering.
In 2016-17, 63% of respondents in England had taken part in any volunteering1 during the previous 12 months, while 39% had participated at least once a month.
For annual volunteering rates, respondents are more likely to take part in informal2 volunteering (52%) than formal3 volunteering (37%). A less pronounced pattern can be seen in the monthly volunteering rate (27% and 22% respectively).
Figure 2: Formal, informal and any volunteering, at least once a year; face-to-face and online/paper estimates, 2001 to 2016-17
Figure 3: Formal, informal and any volunteering, at least once a month; face-to-face and online/paper estimates, 2001 to 2016-17
1 Any volunteering: both formal and informal volunteering 2 Informal volunteering: unpaid help as an individual to people who are not a relative 3 Formal volunteering: providing unpaid help through groups, clubs or organisations
0
20
40
60
80
100
2001 2003 2005 2007-08 2008-09 2009-10 2010-11 2011-12 2012-13 2013-14 2014-15 2015-16 2016-17
%
Any Volunteering Informal Volunteering Formal Volunteering
0
20
40
60
80
100
2001 2003 2005 2007-08 2008-09 2009-10 2010-11 2011-12 2012-13 2013-14 2014-15 2015-16 2016-17
%
Any Volunteering Informal Volunteering Formal Volunteering
4 Levels of volunteering have decreased between 2013-14 and 2016-17, with the proportion of adults who had engaged in any volunteering in the last 12 months falling from 70% to 63% and the proportion who had engaged once a month falling from 44% to 39% in this period. However, the proportion of adults who had engaged in formal volunteering, both annually and monthly, levelled off in 2016-17. Volunteering has fallen in most age groups since 2013-14 but different measures showed different patterns in some cases. For example, among 16-25 year olds, the proportion engaged in formal volunteering at least once a month fell from 29% in 2013-14 to 20% in 2016-17 while the proportion engaged in regular informal volunteering remained flat at 29% over this period. The fall in any volunteering at least once a year was most noticeable in the 25 to 34 and 50 to 64 age groups, with both groups seeing a drop of 10 percentage points to 57% and 62% respectively between 2013-14 and 2016-17. Regionally, the proportion of adults who had done any volunteering in the last year ranged from 50% in the North East of England to 70% in the South West. Women were more likely to have done any volunteering in the last 12 months than men (66% and 60% respectively). This pattern has continued since 2013-14 when 72% of women volunteered in the last year compared to 68% of men. Those who were economically inactive4 were more likely to have engaged in formal volunteering at least once a month at 29%, compared to those in employment (22%) in 2016-17. The most common reason respondents selected for volunteering in 2016-17 was “to improve things/help people” with 49%5 of volunteers giving this reason. This was followed by “the cause was really important to me” and “I had spare time to do it” with 32% and 28% of respondents giving these as a reason respectively6.
4 People not in employment who have not been seeking work within the last 4 weeks and/or are unable to start work within the next 2 weeks. 5 Only those who stated they have volunteered provided answers to this question. 6 Respondents were able to select all those answers that were relevant.

5
Chapter 3: Charitable Giving
In 2016-17, 75% of respondents in England had given money to charity in the four weeks prior to completing their survey. This is similar to the previous year (76% in 2015-16) but a decrease from 2013-14 when 82% reported they had given to charity in the last four weeks. Figure 4: Proportion who gave to charity 4-weeks prior to their survey; face-to-face and online/paper, 2005 to 2016-17
The average amount given to charity in the four weeks prior to completing the survey in 2016-17 was £22, the same as the previous year. When looking at those who had given to charity in the previous four weeks, the proportion of adults giving certain amounts also remained consistent with the previous year with 13% giving over £50 and 25% giving between £20 and £49 in both 2015-16 and 2016-17. Figure 5: Proportion giving to charity in previous four weeks by age group; online/paper, 2016-17
The older age groups and women were more likely to give to charity. In 2016-17, 85% of those aged 65 to 74 and of those aged 75+ had given to charity in the four weeks prior to completing their survey. In the same year, 57% of those aged 16-24 had given money, down from 74% among this age group in 2013-14. 80% of women had given to charity compared to 70% of men.
0
20
40
60
80
100
2005 2007-08 2008-09 2009-10 2010-11 2011-12 2012-13 2013-14 2014-15 2015-16 2016-17
% Online/Postal Estimates
0
20
40
60
80
100
16 to 24 25 to 34 35 to 49 50 to 64 65 to 74 75 andover
All
%

6
Chapter 4: Civic Engagement and Social Action
The Community Life Survey collects information on social action and on three types of civic engagement: participation, consultation and activism.
In 2016-17, the most common form of civic engagement was ‘civic participation’, with 41% saying they had undertaken some form of participation in the last year and 5% saying they had participated at least once a month. 18% said they had engaged in civic consultation in the last year and 8% had engaged in civic activism. Figure 6: Civic participation, consultation and activism in the last year1; face-to-face and online/paper, 2001 to 2016-17
1. The questions used to measure civic engagement were updated in 2012-13 to include online participation and so the trend data is not directly comparable
Annual levels of civic participation and civic consultation have increased from 33% to 41% and 16% to 18% respectively between 2015-16 and 2016-17. In 2016-17, 60% of adults had engaged in some form of civic engagement (participation, consultation, or activism) and/or formal volunteering, an increase from 2015-16 (55%). Respondents were asked about both their awareness of and involvement in social action in the last year in their local area7. 38% of adults were aware of others getting involved in social action, but significantly fewer adults were actually involved in social action themselves at 16% in 2016-17. This pattern has been present since 2013-14.
7 An area within a 15-20 minute walk from your home
0
20
40
60
80
100
2001 2003 2005 2007-08 2008-09 2009-10 2010-11 2011-12 2012-13 2013-14 2014-15 2015-16 2016-17
%
Civic participation Civic consultation Civic activism
Civic participation – engagement in democratic processes, both in person and online, including signing a petition or attending a public rally (does not include voting). Civic consultation – taking part in consultations about local service, both in person and online. Civic activism – involvement in decision-making about local services, both in person and online. Social action – people getting together to support a community project in their local area.

7 Figure 7: Involvement in or awareness1 of social action in their local area at least once in the past year; face-to-face and online/paper, 2013-14 to 2016-17
1. ‘Awareness of social action in local area at least once in last year’ is not included on the paper survey. Therefore the ‘online/paper’ estimates only included those who answered via web.
50% of those adults aged 75 and over were aware of social action in their local area in last year compared to 27% of those aged 16-24. This same disparity between the age groups can be seen in those involved in social action at 20% of those aged 75 and over, compared to 11% of those aged between 16 and 24.
0
20
40
60
80
100
2013-14 2014-15 2015-16 2016-17
%
Awareness Involvement

8
Chapter 5: Community Decisions
In 2016-17, 27% of respondents agreed they could personally influence decisions affecting their local area. This has remained fairly consistent since 2013-14 when 26% agreed with this statement. While only 27% of adults agreed they could personally influence decisions, 58% stated that it was important to be able to influence decisions and 51% said they would like to be more involved in decisions made by their local council. Figure 8: Adults agreeing they can personally influence decisions and that it is important to be able to influence decisions affecting their local area; online/paper, 2007-08 to 2016-17
Figure 9: Whether adults would like to be more involved in decisions made by their local council1; face-to-face and online/paper, 2007-08 to 2016-17
1. ‘Whether adults would like to be more involved in decisions made by their local council’ is not included on the paper survey. Therefore the Online/paper estimates only included those who answered via web.
0
20
40
60
80
100
2007-08 2008-09 2009-10 2010-11 2011-12 2012-13 2013-14 2014-15 2015-16 2016-17
%
Agreeing it is important to be able to influence decisions Agreeing they can influence decisions
0
20
40
60
80
100
2007-08 2008-09 2009-10 2010-11 2011-12 2012-13 2013-14 2014-15 2015-16 2013-14 2014-15 2015-16 2016-17
Face-to-Face Estimates Online/Postal Estimates
%
Yes Depends on the issue No
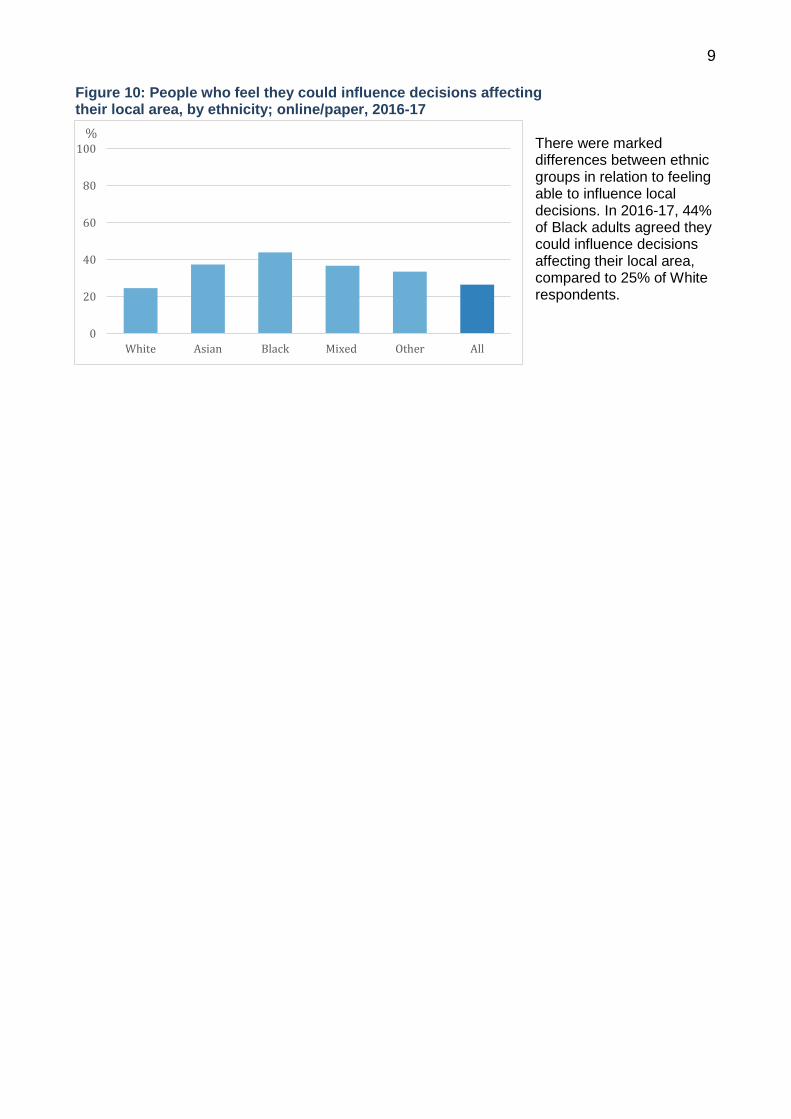
9 Figure 10: People who feel they could influence decisions affecting their local area, by ethnicity; online/paper, 2016-17
There were marked differences between ethnic groups in relation to feeling able to influence local decisions. In 2016-17, 44% of Black adults agreed they could influence decisions affecting their local area, compared to 25% of White respondents.
0
20
40
60
80
100
White Asian Black Mixed Other All
%

10
Chapter 6: Neighbourhood and Community
In 2016-17, over half (57%) of respondents agreed that people in their neighbourhood pulled together to improve the neighbourhood. This has fallen since the previous year (63%), but remains consistent with the proportion in 2014-15 (57%). 39% agreed that they borrow and exchange favours with their neighbours. This is also lower than the proportion in 2015-16 (43%) but similar to 2014-15 (41%). Figure 11: Adults who agree they chat to their neighbours at least once a month; people pull together to improve their neighbourhood and they can borrow or exchange favours with their neighbours1; face-to-face and online/paper, 2003 to 2016-17
1. ‘Agree that they borrow and exchange favours with neighbours’ is not included on the paper survey. Therefore the Online/paper estimates only included those who answered via web.
In 2016-17, 73% of adults reported that they chatted to their neighbour at least once a month, more than just to say hello. Figure 12: Adults who agree they chat to their neighbour at least once a month; online/paper, 2016-17
Those aged 16-24 were least likely to talk to their neighbours with 46% saying this was the case compared to 87% among those aged 65-74 and 88% of respondents aged 75+. Results for this question were similar for men (72% agreed) and women (73%).
0
20
40
60
80
100
2003 2005 2007-08 2008-09 2009-10 2010-11 2011-12 2012-13 2013-14 2014-15 2015-16 2016-17
%
Chat to their neighbours at least once a month
Neighbourhood pull together to improve the neighbourhood
Borrow and exchange favours with their neighbours
0
20
40
60
80
100
16 to 24 25 to 34 35 to 49 50 to 64 65 to 74 75 andover
All
%
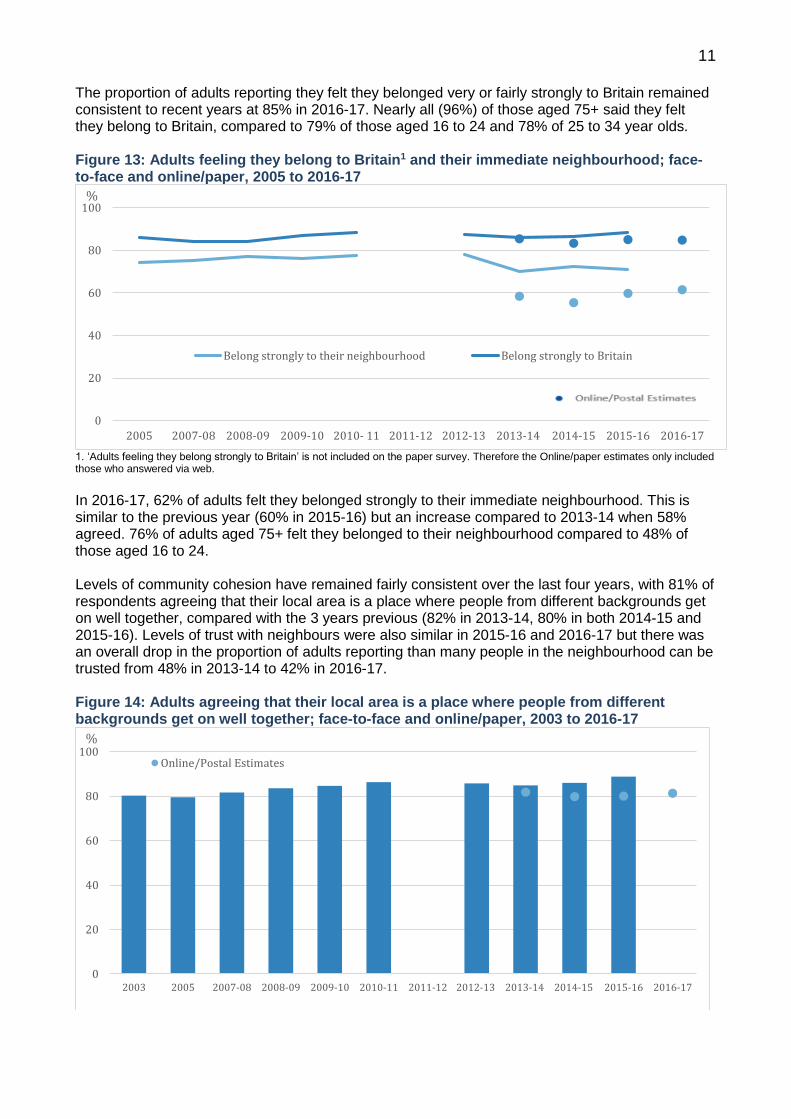
11 The proportion of adults reporting they felt they belonged very or fairly strongly to Britain remained consistent to recent years at 85% in 2016-17. Nearly all (96%) of those aged 75+ said they felt they belong to Britain, compared to 79% of those aged 16 to 24 and 78% of 25 to 34 year olds. Figure 13: Adults feeling they belong to Britain1 and their immediate neighbourhood; face-to-face and online/paper, 2005 to 2016-17
1. ‘Adults feeling they belong strongly to Britain’ is not included on the paper survey. Therefore the Online/paper estimates only included those who answered via web.
In 2016-17, 62% of adults felt they belonged strongly to their immediate neighbourhood. This is similar to the previous year (60% in 2015-16) but an increase compared to 2013-14 when 58% agreed. 76% of adults aged 75+ felt they belonged to their neighbourhood compared to 48% of those aged 16 to 24. Levels of community cohesion have remained fairly consistent over the last four years, with 81% of respondents agreeing that their local area is a place where people from different backgrounds get on well together, compared with the 3 years previous (82% in 2013-14, 80% in both 2014-15 and 2015-16). Levels of trust with neighbours were also similar in 2015-16 and 2016-17 but there was an overall drop in the proportion of adults reporting than many people in the neighbourhood can be trusted from 48% in 2013-14 to 42% in 2016-17. Figure 14: Adults agreeing that their local area is a place where people from different backgrounds get on well together; face-to-face and online/paper, 2003 to 2016-17
0
20
40
60
80
100
2005 2007-08 2008-09 2009-10 2010- 11 2011-12 2012-13 2013-14 2014-15 2015-16 2016-17
%
Belong strongly to their neighbourhood Belong strongly to Britain
0
20
40
60
80
100
2003 2005 2007-08 2008-09 2009-10 2010-11 2011-12 2012-13 2013-14 2014-15 2015-16 2016-17
%
Online/Postal Estimates

12 Respondents were asked questions to find out about the extent to which adults mix with people with similar characteristics to themselves in terms of ethnicity, religion, age and level of education.
Figure 15: Diversity of friendship group1; online estimates, 2016-17
42% of adults in 2016-17 reported that all of their friends were the same ethnic group as them, 28% said they were all from the same religious group and 19% said they had the same level of education as all their friends. 15% of respondents stated that all of their friends were the same age group as them and a further 51% said more than half were from the same age group.
1. ‘What proportion of your friends are of the same ethnic group/religious group/age group/have a similar level of education as you’ is not included on the paper survey. Therefore the Online/paper estimates only included those who answered via web.
Figure 16: How ethnically diverse is your friendship group, by ethnicity of respondent1; online estimates, 2016-17
In 2016-17, 46% of White adults stated that all of their friends were the same ethnic group as them compared to 16% of Asians, and 9% of Black, Mixed or Other ethnic groups.
1. ‘What proportion of your friends are of the same ethnic group as you’ is not included on the paper survey. Therefore the Online/paper estimates only included those who answered via web.
In 2016-17, 78% of adults stated they were satisfied with their local area8. This has remained constant with previous years, with 80% agree they were very/fairly satisfied with their local area in 2013-14 and 2015-16. Levels of those who are ‘very dissatisfied’ in 2016-17 remain at only 2%, consistent with other survey years.
8 An area within a 15-20 minute walk from your home.
4228
15 19
43
4151 46
8
16 23 24
715 10 11
0
20
40
60
80
100
Ethnic Group Religious Group Age Group Level of education
%
All thesame asme
More thana half
About ahalf
Less thana half
0
20
40
60
80
100
White Asian Black Mixed Other
%
All thesame asme
Morethan ahalf
About ahalf
Less thana half
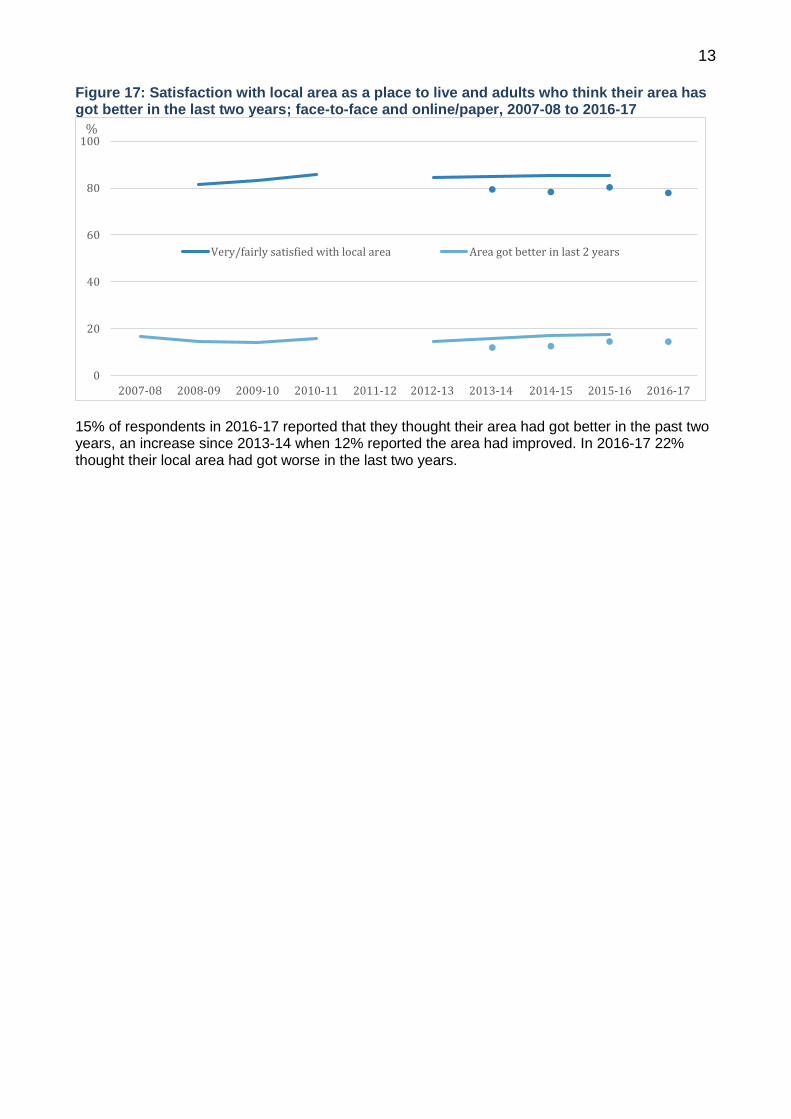
13 Figure 17: Satisfaction with local area as a place to live and adults who think their area has got better in the last two years; face-to-face and online/paper, 2007-08 to 2016-17
15% of respondents in 2016-17 reported that they thought their area had got better in the past two years, an increase since 2013-14 when 12% reported the area had improved. In 2016-17 22% thought their local area had got worse in the last two years.
0
20
40
60
80
100
2007-08 2008-09 2009-10 2010-11 2011-12 2012-13 2013-14 2014-15 2015-16 2016-17
%
Very/fairly satisfied with local area Area got better in last 2 years

14
Chapter 7: Well-being
Average ratings across the 4 measures of personal well-being in 2016-17 were: 7.1 out of 10 for life satisfaction 7.1 out of 10 for happiness yesterday 3.5 out of 10 for anxiety yesterday 7.3 out of 10 for feeling that what you do in life is worthwhile There was no overall change in the average ratings of life satisfaction9, happiness10, worthwhile11 and anxiety between 2015-16 and 2016-17. Figure 18: Average rating of wellbeing; face-to-face and online/paper, 2012-13 to 2016-17
9 Question: Overall, how satisfied are you with your life nowadays? 10 Question: Overall, how happy did you feel yesterday? 11 Question: Overall, to what extent do you feel the things you do in your life are worthwhile?
0
2
4
6
8
10
2012-13 2013-14 2014-15 2015-16 2016-17
Satisfaction
0
2
4
6
8
10
2012-13 2013-14 2014-15 2015-16 2016-17
Happiness
0
2
4
6
8
10
2012-13 2013-14 2014-15 2015-16 2016-17
Anxiety
0
2
4
6
8
10
2012-13 2013-14 2014-15 2015-16 2016-17
Worthwhile

15 Figure 19: Proportion of adults who felt lonely by age group; online/paper, 2016-17
The proportion of adults reporting they felt lonely often/always has remained unchanged since collection began in 2013-14 at 5%. In 2016-17 over half (54%) stated they felt lonely hardly ever or never.
Those aged 16 to 24 are significantly more likely to feel lonely often/always than the other age groups, at 10% compared to 6% of those aged 25 to 34, 5% of those aged 35 to 64, and 3% of those aged 65 and over.
0
20
40
60
80
100
16 to 24 25 to 34 35 to 49 50 to 64 65 to 74 75 andover
All
%Never
Hardly ever
Occasionally
Some of the time
Often/always
16
Annex A: Methodology
This Statistical Release sets out the key headlines from the Community Life Survey topic areas. Additional measures that are not included within this report will be available within the archived dataset, due to be published on the University of Essex data archive (www.data-archive.ac.uk) in Autumn 2017.
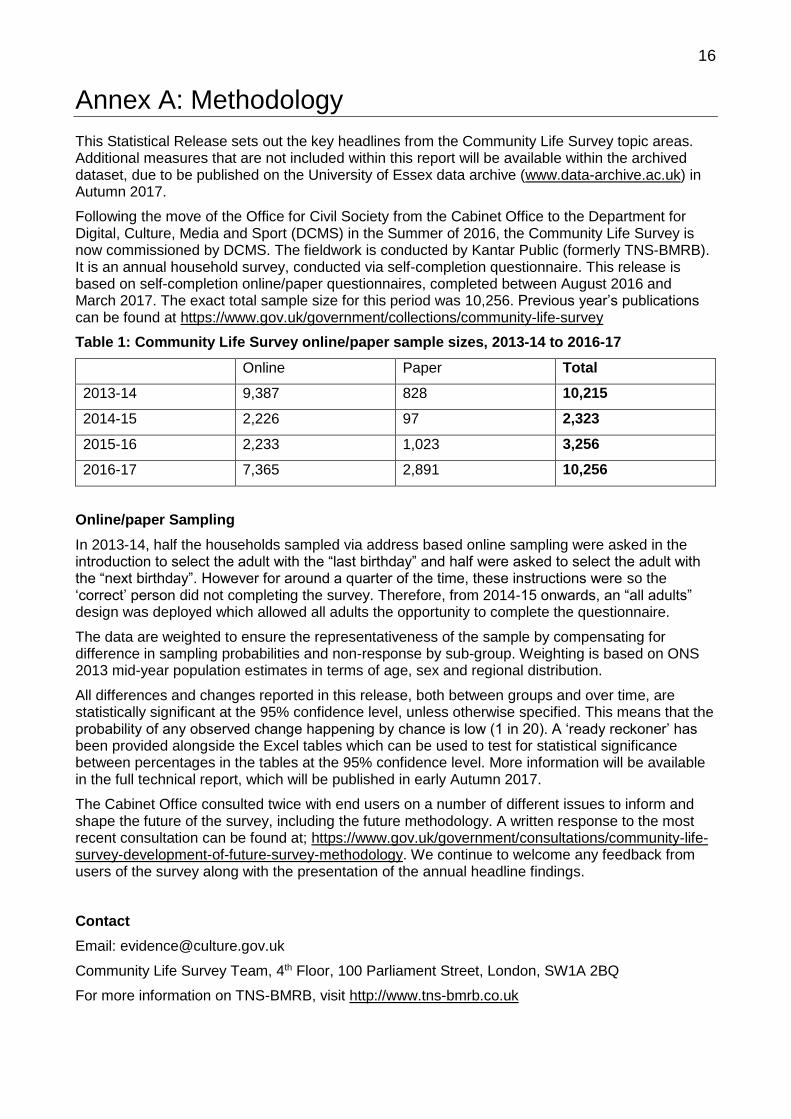
Following the move of the Office for Civil Society from the Cabinet Office to the Department for Digital, Culture, Media and Sport (DCMS) in the Summer of 2016, the Community Life Survey is now commissioned by DCMS. The fieldwork is conducted by Kantar Public (formerly TNS-BMRB). It is an annual household survey, conducted via self-completion questionnaire. This release is based on self-completion online/paper questionnaires, completed between August 2016 and March 2017. The exact total sample size for this period was 10,256. Previous year’s publications can be found at https://www.gov.uk/government/collections/community-life-survey
Table 1: Community Life Survey online/paper sample sizes, 2013-14 to 2016-17
Online Paper Total
2013-14 9,387 828 10,215
2014-15 2,226 97 2,323
2015-16 2,233 1,023 3,256
2016-17 7,365 2,891 10,256
Online/paper Sampling
In 2013-14, half the households sampled via address based online sampling were asked in the introduction to select the adult with the “last birthday” and half were asked to select the adult with the “next birthday”. However for around a quarter of the time, these instructions were so the ‘correct’ person did not completing the survey. Therefore, from 2014-15 onwards, an “all adults” design was deployed which allowed all adults the opportunity to complete the questionnaire.
The data are weighted to ensure the representativeness of the sample by compensating for difference in sampling probabilities and non-response by sub-group. Weighting is based on ONS 2013 mid-year population estimates in terms of age, sex and regional distribution.
All differences and changes reported in this release, both between groups and over time, are statistically significant at the 95% confidence level, unless otherwise specified. This means that the probability of any observed change happening by chance is low (1 in 20). A ‘ready reckoner’ has been provided alongside the Excel tables which can be used to test for statistical significance between percentages in the tables at the 95% confidence level. More information will be available in the full technical report, which will be published in early Autumn 2017.
The Cabinet Office consulted twice with end users on a number of different issues to inform and shape the future of the survey, including the future methodology. A written response to the most recent consultation can be found at; https://www.gov.uk/government/consultations/community-life-survey-development-of-future-survey-methodology. We continue to welcome any feedback from users of the survey along with the presentation of the annual headline findings.
Contact
Email: [email protected]
Community Life Survey Team, 4th Floor, 100 Parliament Street, London, SW1A 2BQ
For more information on TNS-BMRB, visit http://www.tns-bmrb.co.uk

17
4th Floor 100 Parliament Street London SW1A 2BQ
© Crown copyright 2017
You may re-use this information (not including logos) free of charge in any format or medium, under the terms of the Open Government Licence. To view this licence, visit www.nationalarchives.gov.uk/doc/open-government-licence/ or write to the Information Policy Team, The National Archives, Kew, London TW9 4DU, or email: [email protected]