community infrastructure levy economic viability...
TRANSCRIPT

Project Ref: 27169
October 2012
Stratford-on-Avon District Council
Stratford-on-Avon CIL
Community Infrastructure Levy Economic Viability Study
Stratford-on-Avon CIL
Community Infrastructure Levy Economic Viability Study
ii
We print on 100% recycled paper from sustainable suppliers accredited to ISO 14001.
Stratford-on-Avon CIL
Community Infrastructure Levy Economic Viability Study
iii
Document Control Sheet
Project Name: Stratford-on-Avon CIL
Project Ref: 27169
Report Title: Community Infrastructure Levy Economic Viability Study
Doc Ref: Final report/rev04
Date: October 2012
Name Position Signature Date
Prepared by: Mark Felgate Associate MF/NC
30/10/2012
Reviewed by: Nigel Clark
Development Director
NC/MF 30/10/2012
Approved by: J Baker Partner JB
30/10/2012
For and on behalf of Peter Brett Associates LLP
Revision Date Description Prepared Reviewed Approved
000 03/08/2012 Draft Report MF NC JB
02 09/08/2012 Final Draft MF NC JB
03 08/10/12 Final Report MF/NC MF/NC JB
04 30/10/12 Final Report (amended) MF JB
Peter Brett Associates LLP disclaims any responsibility to the Client and others in respect of any matters outside the scope of this report. This report has been prepared with reasonable skill, care and diligence within the terms of the Contract with the Client and generally in accordance with the appropriate ACE Agreement and taking account of the manpower, resources, investigations and testing devoted to it by agreement with the Client. This report is confidential to the Client and Peter Brett Associates LLP accepts no responsibility of whatsoever nature to third parties to whom this report or any part thereof is made known. Any such party relies upon the report at their own risk.
© Peter Brett Associates LLP 2012

Stratford-on-Avon CIL
Community Infrastructure Levy Economic Viability Study
iv
Stratford-on-Avon CIL
Community Infrastructure Levy Economic Viability Study
v
Contents
1 Introduction ............................................................................................................................... 7 1.1 Background .................................................................................................................... 7 1.2 Community Infrastructure Levy (CIL) ............................................................................. 8 1.3 Approach to Governance ............................................................................................. 10
2 Development Typologies ....................................................................................................... 12 2.2 Residential ................................................................................................................... 12 2.3 Non Residential ............................................................................................................ 12
3 Viability Assumptions ............................................................................................................ 17 3.1 Reviewing the Existing Viability Evidence (Value and Costs) ..................................... 17 3.2 Consultation with the Development Industry ............................................................... 18 3.3 Our Approach ............................................................................................................... 21
4 Residential Viability Assessments ....................................................................................... 24 4.1 Assumptions ................................................................................................................ 24 4.2 Dwelling Mix ................................................................................................................. 24 4.3 Coverage, or Saleable Floorspace .............................................................................. 25 4.4 Sales Value for Open Market Housing ........................................................................ 25 4.5 Sales Value for Affordable Housing ............................................................................. 27 4.6 Build Costs ................................................................................................................... 29 4.7 The Code for Sustainable Homes ................................................................................ 30 4.8 Developer’s Profit and Professional Fees and Financing ............................................ 31 4.9 Additional or ‘Abnormal’ Development Costs .............................................................. 31 4.10 CIL and Community Gain Package ............................................................................. 32 4.11 Generic Residential Viability Appraisals ...................................................................... 32 4.12 Sensitivity Testing ........................................................................................................ 33 4.13 Summary of Findings from Residential Analyses and Recommended CIL Approaches 36 4.14 Affordable Housing ...................................................................................................... 38 4.15 Design Costs ................................................................................................................ 38
5 Non-Residential Assessments .............................................................................................. 40 5.1 Non-Residential Assumptions ...................................................................................... 40 5.2 Approach ...................................................................................................................... 40 5.3 Establishing Gross Development Value (GDV) ........................................................... 40 5.4 Costs ............................................................................................................................ 41 5.5 Site Coverage .............................................................................................................. 41 5.6 Developer Profit ........................................................................................................... 41 5.7 Build Costs ................................................................................................................... 42 5.8 Professional Fees, Overheads .................................................................................... 42 5.9 Development Contributions Other than CIL ................................................................. 42 5.10 Finance ........................................................................................................................ 43 5.11 Marketing Fees ............................................................................................................ 43 5.12 Acquisition Fees and Land Tax ................................................................................... 43 5.13 Land for Non-residential Uses ..................................................................................... 43 5.14 Non Residential Development Analysis ....................................................................... 44 5.15 B-class Uses ................................................................................................................ 44 5.16 Retail Uses ................................................................................................................... 45 5.17 Leisure Development ................................................................................................... 46 5.18 Care Homes and Extra Care Living ............................................................................. 47 5.19 Other Non-residential Development ............................................................................ 47 5.20 Summary and Sensitivity Testing on Non-residential Development ............................ 48
6 Conclusion .............................................................................................................................. 51

Stratford-on-Avon CIL
Community Infrastructure Levy Economic Viability Study
vi
Tables
Table 2.1: Residential Notional Sites for Viability Testing ..................................................................... 12 Table 4.1: Typical Floorspace by Dwelling Type ................................................................................... 24 Table 4.2: Current Market Schemes ..................................................................................................... 26 Table 4.3: Market Summary .................................................................................................................. 27 Table 4.4: Residential Viability Findings ................................................................................................ 33 Table 4.5: Sensitivity Testing to Achieve Viability ................................................................................. 34 Table 4.6: Sensitivity Testing to maximise % of affordable housing with varying levels of CIL ............ 34 Table 4.7: Approach 1 ........................................................................................................................... 37 Table 4.8: Approach 2 ........................................................................................................................... 37 Table 5.1: Non Residential Uses – Rent and Yields ............................................................................. 40 Table 5.2: Non Residential Uses – Site Coverage Ratios ..................................................................... 41 Table 5.3: Non Residential Uses – Build Costs..................................................................................... 42 Table 5.4: B-class Development ........................................................................................................... 44 Table 5.5: Out of town centre retail uses ............................................................................................... 45 Table 5.6: Town Centre Residual Analysis ........................................................................................... 46 Table 5.7: Hotel Viability Levy ............................................................................................................... 46 Table 5.8: Mixed Leisure CIL Charge .................................................................................................... 47 Table 5.9: Care Homes Viability ............................................................................................................ 47
Figures
Figure 1.1: Evidence to Inform CIL Charging Schedule .......................................................................... 9 Figure 5.1 Scope for CIL ....................................................................................................................... 48 Figure 5.2 Sensitivity analysis – minus 10% on values ......................................................................... 49 Figure 5.3 Sensitivity analysis – plus 10% on values ............................................................................ 50
Appendices
Appendix 1: Residential Viability Appraisals Appendix 2: Non-Residential Viability Appraisals Appendix 3: Glossary
CIL Economic Stratford-on-Avon CIL
7
1 Introduction
1.1 Background
1.1.1 Peter Brett Associates were commissioned to undertake an Economic Viability Assessment
of the proposed Community Infrastructure Levy by Stratford-on-Avon District Council. This
report is a viability assessment which seeks to set out the implications of differing levels of
viability for a variety of types of residential and non-residential developments, and how this
might support a Community Infrastructure Levy.
1.1.2 It should be noted that this report is not an independent scheme valuation for sites in
Stratford-on-Avon. No responsibility whatsoever is accepted to any third party who may seek
to rely on the content of the report for such purposes.
1.1.3 Government planning policy on viability and the deliverability of development is set out in the
National Planning Policy Framework (NPPF). It addresses the importance of ensuring
deliverability in paragraph 173:
“To ensure viability, the costs of any requirements likely to be applied to development, such
as requirements for affordable housing, local standards, infrastructure contributions or other
requirements should, when taking account of the normal cost of development and on-site
mitigation, provide acceptable returns to a willing land owner and a willing developer to
enable the development to be deliverable.”
1.1.4 The importance of delivery cannot be underestimated. To ensure robust and sound
development plan documents, local authorities must ensure that Local Plans are deliverable.
This effectively means that the infrastructure plans must be an integral part of spatial
planning and therefore funding issues are becoming increasingly important. This section
considers the opportunities for funding from developer contributions arising from the viability
of developments, both residential and commercial.
1.1.5 The main driver of development viability is the change in residual land value. If the residual
land value created by the proposed development is not substantially in excess of the existing
use value, then the development will not be considered viable by the market.
1.1.6 The basis of viability testing in this Report is through a series of generic site appraisals,
using the residual value (RV) approach. This needs to take account of a wide variety of
inter-related factors which are explored below, which include various items of planning
obligations and community gain expected to be delivered through the operation of the
planning system.
1.1.7 The key question is whether a suggested level of CIL, combined with other planning
obligations, including affordable housing will inhibit development generally, and conversely,
what level of CIL, and continuing contributions through S.106 Agreements, can be delivered
whilst maintaining economic viability?
CIL Economic Stratford-on-Avon CIL
8
1.1.8 CIL is a new levy that local authorities in England and Wales can choose to charge on new
developments in their area. The introduction of CIL corresponds to changes in the way that
Section 106 obligations can work and it is likely that most Local Authorities in England will
choose to use CIL in order to continue using some of the value created by development to
fund the infrastructure required. In large schemes, typical infrastructure provision might
include new secondary schools, and green infrastructure.
1.1.9 It should be noted that not only should evidence of viability be presented, but as the Appeal
Court judgement in the case of Blyth Valley has made clear, viability assessments must be
founded on robust evidence and it is insufficient to rely on ‘custom and practice’ or ‘going
rates’.
1.1.10 One of the most significant items of community gain sought from residential development
sites is affordable housing, not currently sought through CIL, but secured through S.106
agreements. This reflects both the affordable housing need in the District, but also the
increasing role that planning contributions have taken in delivering new affordable housing
stock. As the importance of planning contributions in funding infrastructure increases, the
cumulative effect of the planning contributions can lead, in some circumstances, to the
economic viability of a site being called into question. Although the cost of contributions is
normally factored into site financial appraisals by developers when land purchase is
contemplated, the development industry needs to demonstrate a profit, since no business
exists without a profit motive.
1.1.11 It is increasingly important therefore that policy relating to planning obligations is realistic and
credible, taking into account the local housing market, the economics of development,
including price, supply, demand, need, and profit issues.
1.1.12 It is clear that the main issues relate to the viability of residential development. In our
experience, there are relatively few locations where ‘B’ class uses are able to support CIL,
although some forms of retail are clearly viable and able to bear a levy without compromising
viability (particularly large format convenience retail). It is necessary to understand the
viability of non-residential development, if only to underpin a decision to charge a £0 rate.
The council may want to review CIL when economic conditions are more favourable,
although it must be emphasised that there is currently a very significant viability gap.
1.2 Community Infrastructure Levy (CIL)
1.2.1 The Planning Act 2008 introduced the power to charge a Community Infrastructure Levy
(CIL) and the details of setting the charge are set out in the CIL Regulations and Guidance.
CIL is a new levy that local authorities in England and Wales can choose to charge on new
developments in their area.
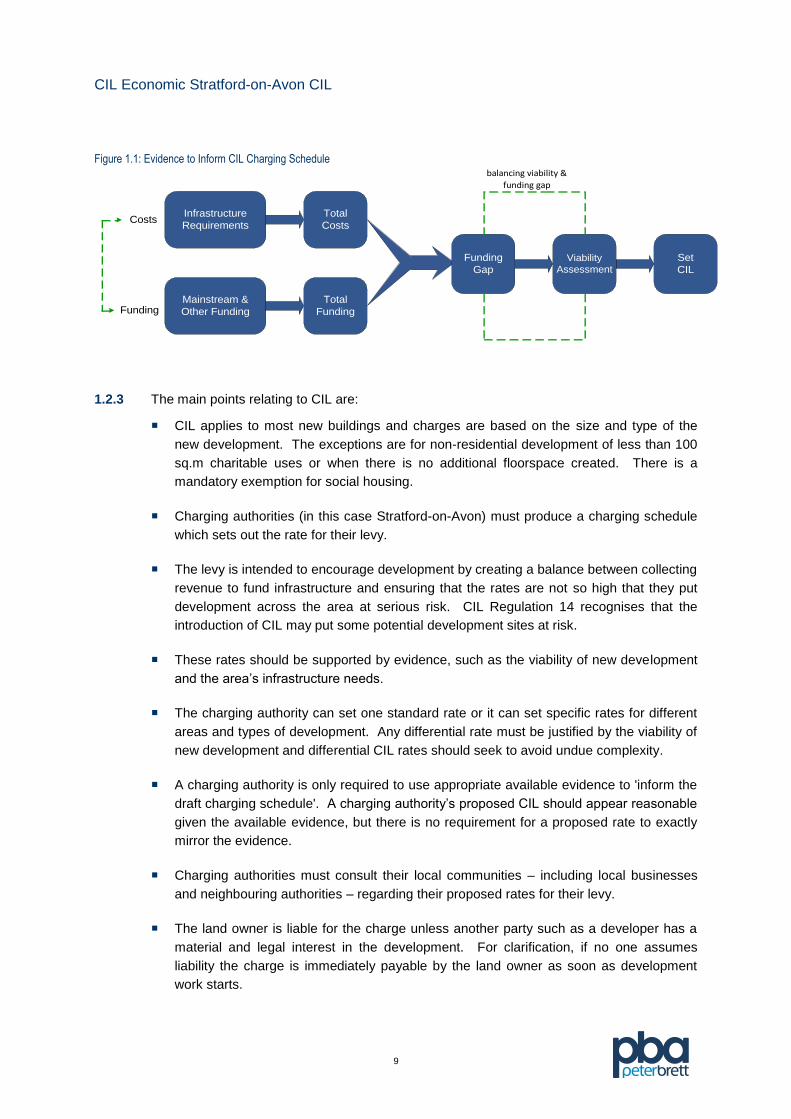
1.2.2 Before a charging authority can apply a CIL, it has to produce a CIL charging schedule. This
charging schedule has to be informed by relevant infrastructure funding gap and viability
evidence. The process of developing a CIL charging schedule is illustrated in Figure 1.1
below.
CIL Economic Stratford-on-Avon CIL
9
Figure 1.1: Evidence to Inform CIL Charging Schedule
1.2.3 The main points relating to CIL are:
CIL applies to most new buildings and charges are based on the size and type of the
new development. The exceptions are for non-residential development of less than 100
sq.m charitable uses or when there is no additional floorspace created. There is a
mandatory exemption for social housing.
Charging authorities (in this case Stratford-on-Avon) must produce a charging schedule
which sets out the rate for their levy.
The levy is intended to encourage development by creating a balance between collecting
revenue to fund infrastructure and ensuring that the rates are not so high that they put
development across the area at serious risk. CIL Regulation 14 recognises that the
introduction of CIL may put some potential development sites at risk.
These rates should be supported by evidence, such as the viability of new development
and the area’s infrastructure needs.
The charging authority can set one standard rate or it can set specific rates for different
areas and types of development. Any differential rate must be justified by the viability of
new development and differential CIL rates should seek to avoid undue complexity.
A charging authority is only required to use appropriate available evidence to 'inform the
draft charging schedule'. A charging authority’s proposed CIL should appear reasonable
given the available evidence, but there is no requirement for a proposed rate to exactly
mirror the evidence.
Charging authorities must consult their local communities – including local businesses
and neighbouring authorities – regarding their proposed rates for their levy.
The land owner is liable for the charge unless another party such as a developer has a
material and legal interest in the development. For clarification, if no one assumes
liability the charge is immediately payable by the land owner as soon as development
work starts.
Mainstream &
Other Funding
Infrastructure
Requirements
Total
Funding
Total
Costs
Funding
GapViability
Assessment
Set
CIL
Funding
Costs
balancing viability &
funding gap
CIL Economic Stratford-on-Avon CIL
10
If the charging authority chooses it can adopt an exceptional circumstances policy to
allow relief from the Levy. However, there are state aid considerations that may arise
from exemptions.
While the charge becomes due at commencement, the charging authority can choose to
adopt a payment phasing policy.
The charging authority can use up to 5% of CIL receipts to finance administrative
expenses in connection with the Levy. It should be noted that on-going CIL
consultations suggests there should be no cap to administrative expense fee financed
from CIL receipts.
1.2.4 Our approach has been guided by the Planning Act 2008, the CIL Regulations (2010 and
2011) and the March 2010 Charge Setting and Charging Procedures statutory guidance
document. The fundamental premise is that the CIL is intended to enable the delivery of
growth and it must be set at a level that does not put at risk the overall level of development
in the area.
1.3 Approach to Governance
1.3.1 Although not part of this commission the council should start to think about the governance
of CIL. It could be considered that setting the CIL is the easy part: the hard part will be
thinking about deciding which infrastructure providers and projects get CIL funding.
1.3.2 There are tensions pulling CIL funding three ways. Local neighbourhoods are expected by
the Government to get a “meaningful proportion” of CIL funding to spend at local level; and
for Stratford-on-Avon there will be competing priorities between the district and county (let
alone the competition between departments within the authority). Then there are a range of
other stakeholders – from PCTs, Highways Agency and emergency services, all of whom will
want their slice of funding.
1.3.3 CIL Regulation 123 requires LPAs to specify a list of infrastructure projects intended to be
funded from CIL. It restricts the use of planning obligations for infrastructure that will be
funded in whole or in part by the CIL, to ensure no duplication between the two types of
developer contributions.
1.3.4 Although Charging Authorities will not be examined on these issues, it would be a very good
idea for stakeholders to agree a common protocol about how these issues be dealt with
once the CIL money starts flowing in. Although strictly speaking not within the remit of the
examination, the examination at Newark and Sherwood saw a two-hour debate about how
CIL funding would be shared out. The examiner’s report devotes a number of pages to the
issue that are worth reviewing. By contrast, Shropshire has taken a “place plan” approach
which sticks closely to very local priorities. Spending profiles are reviewed annually, and
these choices provide a basis for an annual revision of the Regulation 123 list.
1.3.5 It is clear that there will be a number of different approaches to the governance of CIL
funding as rates emerge around the country. Early discussions on principles will be valuable
before the money arrives. That way, discussions can be usefully kept quite abstract, rather
CIL Economic Stratford-on-Avon CIL
11
than turning into a zero-sum argument about which agency gets the limited funding
available.
1.3.6 The NPPF stresses the need to ensure that the cumulative policies and standards set out in
a Local Plan do not render so much development unviable that the plan’s housing and other
development requirements cannot be delivered. Whilst the viability of a plan should not be
an overriding factor in the setting of plan policy, plans that do not take account of this are at
risk of failing to be found sound when examined.
1.3.7 The objectives of this report are to use the available evidence to assess the ability of
different types of development to support a CIL. The stages of the study are to:
Review the types of development likely to come forward during the plan period, use this
as a basis to generate some hypothetical development typologies;
Consider the evidence relating to the costs and values of different residential and non-
residential development in Stratford-on-Avon and establish assumptions to inform both
residential and non-residential viability appraisals; and
Undertake a series of viability tests on the hypothetical development typologies and
consider whether there is sufficient value to support a CIL.
CIL Economic Stratford-on-Avon CIL
12
2 Development Typologies
2.1.1 We have identified a set of development typologies for Stratford-on-Avon District. These are
standard generic models, which have been informed by real situations, but are not intended
to represent any actual future developments. The selected typologies are purely for
modelling viability, and for the avoidance of doubt, are not policy options being considered
by the council.
2.2 Residential
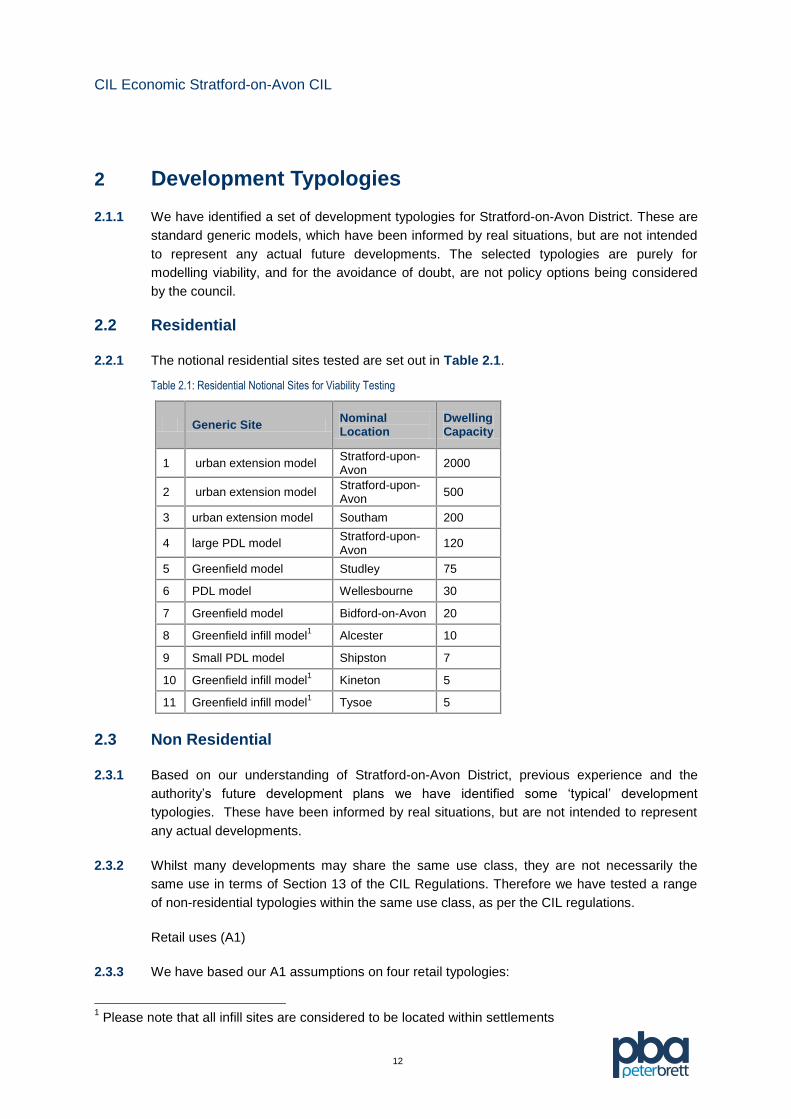
2.2.1 The notional residential sites tested are set out in Table 2.1.
Table 2.1: Residential Notional Sites for Viability Testing
Generic Site Nominal Location
Dwelling Capacity
1 urban extension model Stratford-upon-Avon
2000
2 urban extension model Stratford-upon-Avon
500
3 urban extension model Southam 200
4 large PDL model Stratford-upon-Avon
120
5 Greenfield model Studley 75
6 PDL model Wellesbourne 30
7 Greenfield model Bidford-on-Avon 20
8 Greenfield infill model1 Alcester 10
9 Small PDL model Shipston 7
10 Greenfield infill model1 Kineton 5
11 Greenfield infill model1 Tysoe 5
2.3 Non Residential
2.3.1 Based on our understanding of Stratford-on-Avon District, previous experience and the
authority’s future development plans we have identified some ‘typical’ development
typologies. These have been informed by real situations, but are not intended to represent
any actual developments.
2.3.2 Whilst many developments may share the same use class, they are not necessarily the
same use in terms of Section 13 of the CIL Regulations. Therefore we have tested a range
of non-residential typologies within the same use class, as per the CIL regulations.
Retail uses (A1)
2.3.3 We have based our A1 assumptions on four retail typologies:
1 Please note that all infill sites are considered to be located within settlements

CIL Economic Stratford-on-Avon CIL
13
Superstore and supermarkets – out of town centre/urban extension development of
gross 3,500 sq.m with a site coverage of 40%;
Retail warehouses – out of town centre development of six retail warehouses totalling
10,000 sq.m gross with a site coverage of 40%;
Town centre retail in Stratford-upon-Avon – Stratford-on-Avon’s Local Plan sets out the
town centre boundary which represents a reasonable delineation between in and out of
centre areas in functional terms. As the highest value area, it is considered that if town
centre development in this location is not viable then it won’t be viable in other centres;
and
Local convenience retail – all locations, size of 280 sq.m with site coverage of 80%.
2.3.4 In determining these convenience orientated typologies it is understood that the council has
not planned for any in centre supermarkets or superstores and therefore we have not
specifically tested this use – however it is understood that there is ongoing interest in out of
town centre locations and therefore we have tested these locations. If an in centre
convenience development does occur then the charge will be on the basis of the in town
centre appraised scheme.
Other Retail ‘A’ uses (A2 – A5)
2.3.5 Whilst other ‘A’ uses are differentiated in terms of the use class order it is considered for the
purposes of this work that as town centre uses they will generally compete for similar space
as retail units and therefore occupy the same sorts of premises. On that basis it is not
necessary to consider these individually for testing purposes as a reasonable approach
needs to be taken. Therefore any recommendations relating to town centre retail will also
apply to all these types of uses as well.
2.3.6 It should also be noted that many of these uses are unlikely to exceed 100 sq.m flooorspace
and therefore would not be eligible for a CIL charge.
B1 Business Offices
2.3.7 We have used two B1 Office typologies:
In town – 800 sq.m with building foot print site coverage of 90% (development over 5
floors); and
Edge of town development of gross 2,000 sq.m building foot print site coverage of 40%
(development over two floors).
2.3.8 The non-office B1 uses are covered by the B2/B8 uses discussed below.
B2 General Industrial
2.3.9 We have used two B2 general industrial typologies:

CIL Economic Stratford-on-Avon CIL
14
Edge of town industrial units of gross 1,500 sq.m with site coverage of 40%. May
include subdivisions into smaller workshop units; and
Edge of town industrial unit of gross 5,000 sq.m with site coverage of 40%.
B8 Storage/Distribution
2.3.10 As per B2 General Industrial, in practice the activity will have the same types of premises
and similar values as the larger B2 typology; i.e. warehouse of gross 5,000 sq.m with site
coverage of 40%.
C1 Hotels
2.3.11 60 bedroom hotel of gross 2,000 sq.m on two floors on an edge of town site with 80% site
coverage.
Care Homes and Extra Care Living
2.3.12 In addition to residential development it is appropriate in Stratford-on-Avon to also test
different types of specific accommodation for the older population. To this end two models
have been tested – Care Homes and extra care living accommodation.
2.3.13 The former provides a residential setting where a number of older people live, usually in
single rooms, and have access to on-site care services – they will offer different levels of
care from basic personal care assistance to fully qualified nursing medical care. We have
tested a 40 unit scheme.
2.3.14 Our second model is extra care living, whereby you live independently in your own home, but
it is located within the grounds of a communal facility which again can provide a range of
services from personal care to medical care. We have tested a 50 unit scheme. It is
considered that for the purposes of testing at a strategic level the scheme to be tested will be
the basic facility which includes the individual units and basic communal facilities such as a
common room. It is noted that varying degrees of medical and restaurant facilities can also
form part of these schemes, however for the purposes of this study it is considered that
these are cost neutral and that if they are provided then they are effectively paid for by the
future residents on top of the basic purchase.
2.3.15 We have tested three different sites, edge of town centre, greenfield and greenfield with a
policy target of 35% affordable housing. Clearly if an affordable housing requirement is
added it will impact on the viability of the scheme to contribute to other S106 costs and CIL.
For the purpose of this study we have used the same blended proportion for affordable
housing as used in the residential appraisals.
D1 Non Residential Institutions
2.3.16 Non residential institutions will vary from public sector or charitable institutions such as
health centres, Children’s Centres, libraries and museums through to commercial uses such
as private sector child care facilities. Many of these will be charitable or public sector uses
CIL Economic Stratford-on-Avon CIL
15
which are not viable in any commercial sense and we have not sought to test these. We
propose that the majority of other development falling into this category will be similar to
town centre shops – in that they are ‘selling’ services such as childcare.
D2 Assembly and Leisure
2.3.17 Assembly and leisure also varies considerably but with common factors. We have tested
two types of development which may come forward:
A mixed leisure scheme to include facilities such as cinema, bowling, health and leisure
complex, gambling and associated eating and drinking establishments; and
A stand-alone commercial health and leisure facility.
Sui Generis
2.3.18 Sui Generis uses include theatres; hostels providing no significant element of care; scrap
yards; petrol filling stations; shops selling and/or displaying motor vehicles; retail warehouse
clubs; nightclubs; launderettes; taxi businesses; amusement centres; and casinos. The
types of premises, value of uses and development costs for premises accommodating these
types of activity will vary considerably; and this means that Sui Generis uses cannot be
treated in the same way as the other use classes.
2.3.19 Our approach to this issue has been to consider the types of premises and locations that
may be used for Sui Generis and assess whether the costs and value implications may have
similarities with other uses. We have also considered the likely developments within the plan
period as a guide to whether more detailed work might be useful.
Theatres – very few new theatres are being developed in the UK and the exceptions –
such as Chester – are in locations with large catchments, an existing foundation of
extensive artistic activity and a local authority with the means and inclination to pay.
Hostels providing no significant element of care – these are likely to be either charitable
or public sector uses such as probation hostels, half-way houses, refuges, etc., or low
cost visitor accommodation such as Youth Hostels. Our view is that the charitable uses
are dependent upon public subsidy for development and operation, and therefore not
viable in any commercial sense. Youth Hostels are operated on a social enterprise basis
with small financial returns. Neither of these scenarios offers significant commercial
viability.
Scrapyards – there may be new scrapyard/recycling uses in Stratford-on-Avon in the
future, particularly if the prices of metals and other materials rise. Subject to consent
these are likely to occupy the same sorts of premises as many B2 uses and therefore
the viability will be covered by the assessment of the viability of B2 uses.
Petrol filling stations – we are aware that the recent new filling stations have generally
been as part of larger supermarket developments, with independent filling stations
closing. It seems unlikely that there will be significant new stand-alone filling station
development.
CIL Economic Stratford-on-Avon CIL
16
Selling and/or displaying motor vehicles - sales of vehicles are likely to occupy the same
sorts of premises and locations as many B2 uses and therefore the viability will be
covered by the assessment of the viability of B2 uses.
Retail warehouse clubs – these retail uses are likely to be in the same type of premises
as the out of town A1 retail uses and covering the same purchase or rental costs.
Therefore they are covered by this viability assessment.
Nightclubs/Laundrettes/Taxi businesses/Amusement centres – these uses are likely to
be in the same type of premises as A1 town centre retail uses and covering the same
purchase or rental costs. Therefore they are covered by this viability assessment.
Casinos – The Casino Advisory Panel has advised the Government where the one
regional, eight large and eight small casinos should be located and the locations have
not included Stratford-on-Avon District. While an existing hotel may add a small casino
to its existing operation this will be part of the overall hotel viability.
CIL Economic Stratford-on-Avon CIL
17
3 Viability Assumptions
3.1 Reviewing the Existing Viability Evidence (Value and Costs)
3.1.1 Obtaining the data – we use a range of information sources in setting benchmark land values and
getting intelligent inputs to our residual value modelling. The regulations require Charging
Authorities to use “appropriate available evidence” in setting their CIL Charge. The sources we
used are as follows.
Internet sources. In order to keep costs down, we take advantage of free sources such as
Estates Gazette, or Davis Langdon cost levels – which have the great advantage of showing
the typical buildings used for the calculation. We also use management consultants’ studies,
quality press reports (FT.com is an excellent source) and industry sector specialist studies.
We use existing information available to the council, such as SHLAA evidence and the
Employment Land Review. There are good reasons to use this already existing information. It
has great advantages of ensuring that there is no contradiction between different studies that
could be used against the CIL charge at examination.
BCIS and Spons cost sources are available to us.
We source residential revenues and other viability variables from a range of sources, including
generic websites, such as the Right Move, and Zoopla, in addition to the Land Registry,
together with direct research with developers, (including Registered Providers of affordable
housing), and agents operating in the area. Revenues have been checked against market
research in the emerging SHMA 2012 Update, which corroborates our findings that revenues
have increased 5% between 2007 and 2010, and 7.5% over the past year to March 2012.
3.1.2 Information on land and property values has been taken from industry standard sources including
the EGi, CoStar (Focus) and Property Week databases.
3.1.3 To estimate construction costs, as well as standard sources such as BCIS, we use data from cost
consultants Davis Langdon. These figures allow for increasingly stringent Building Regulations,
which add to construction costs. For costs such as external works, fees, finance and developers’
margins, we used high-level approximations. We also make separate estimates for S106 and other
site-specific planning contributions. These represent the average over a range of scheme types.
Where relevant, we also distinguish between different parts of the District, to ensure that we have
the right evidence to inform any proposal for geographic differentials in the levy rate.
3.1.4 Our view on this issue is that a simple Charging Schedule with few variations is preferable for
examination and implementation. We need to distinguish circumstances where particular types of
site are prone to different economic circumstances that affect viability. This includes, for instance,
the additional costs associated with large greenfield urban extensions, where the site specific
infrastructure costs required to open up the site for development are significantly greater than for
smaller, brownfield sites. On the other hand, brownfield sites tend to have a much higher existing
use value, based on commercial values as opposed to agricultural value. This can mean that large
greenfield urban extensions, and in some circumstances, brownfield sites, may be unable to
support the same affordable housing and/or CIL rate as other locations.
CIL Economic Stratford-on-Avon CIL
18
3.2 Consultation with the Development Industry
3.2.1 In our experience, local agents and developers are always happy to explain where the
market is at, what is going on, and why.
3.2.2 The consultation with the development industry has helped to make our assumptions more
robust, and these discussions also help us see where potential objections to the CIL might
come from, so that the council can be better prepared to address objections at examination.
3.2.3 We have also carried out discussions with local registered affordable housing providers
based on their current experience of rent and sale revenues in order to provide a suitable set
of affordable housing values to include in the viability calculations.
3.2.4 The key data includes:
Estimated market values of completed development (per sq m);
Existing use and open market land values;
Basic build cost (per sq m);
External works (% of build cost);
Contingencies;
Professional fees (% of build cost);
Marketing & sales costs (% of development value);
Typical S106 costs;
Finance costs (typical prevailing rates);
Developer’s margin (% of revenue);
The net developable area (site area less land needed for open space or major site
infrastructure); large urban extensions normally have a gross to net ratio of between
50% and 70%, depending on size and physical circumstances, including drainage and
flood constraints; and
The density and mix of development.
3.2.5 To determine benchmark land values, we pull together the evidence gained in the stages
above, use market evidence of actual transactions, and filter these findings through our own
professional judgment and experience. All this information is used to inform the viability
modelling.
3.2.6 We worked with the council to set up a Stakeholder meeting for agents, developers and
affordable housing providers active in the District. All members of the Strategic Housing
CIL Economic Stratford-on-Avon CIL
19
Land Availability Assessment (SHLAA) Panel were invited. The meeting took place on 13th
July 2012, and in addition to the consultants and council officers, it was attended by the
following parties:
Andrew Murphy, Stansgate Planning;
Peter Clarke, Peter Clarke & Co;
Keith Greenall, Greenall Construction;
Mike Hill, Bromford Housing Association;
David Joseph, Bloors;
John Acres, Turleys;
Anne Smith, Taylor Wimpey; and
Simon Gibbs, Bigwoods.
3.2.7 There was a useful discussion on market factors that have fed into the viability assessments.
A number of interviews have taken place subsequently with developers and agents to inform
and corroborate the cost and value information.
3.2.8 At the meeting it was explained that we had agreed with the council that we would run over
20 viability assessment models to cover both residential and non-residential typologies.
These were tested to cover different locations across the district to reflect geographical
differences in revenues and costs. These notional sites are set out at the beginning of
Section 2.
3.2.9 These models have been completed using local values and costs to test what level of CIL
can be achieved without risking viability, as well as testing current affordable housing
requirements contained in the emerging Local Plan. These different applications have also
been used to assess different density and location factors.
3.2.10 We have allowed for a set of residential viability tests to cover notional developments of
different sizes, locations, densities and mixes, greenfield/brownfield as well affordable
housing and sustainable construction requirements. In order to provide a robust evidence
base it was important that we modelled this broad cross section of development types.
3.2.11 We have also allowed for a set of non-residential viability tests to cover different uses and
some different scenarios within some key uses. In particular we have developed a clear
process for considering retail, where large format out of centre convenience retail continues
to be one of the best-performing investment markets. The sector is characterised by strong
yields and high land values. Hence it should be able to support high levels of CIL. In
contrast, high street retail is generally much weaker with less potential to support CIL
charges. If all retail is merged into one category, total CIL receipts may be much less than
they could be. On the other hand, if retail is split into two categories for CIL purposes, we
need to ensure that the split is based on robust evidence; otherwise the split may be set
aside by the examiner, as happened recently in Newark and Sherwood.

CIL Economic Stratford-on-Avon CIL
20
3.2.12 The proportion and type of affordable housing is one of the key determinants of residential
viability. The dual effect of the imposition of both CIL and the affordable housing
requirement can render some models unviable, or if it is on the borderline of viability, we
refer to the concept of marginal viability. This happens when it is unclear as to whether an
owner would accept the uplift amount. In the event of marginal viability, we carry out
sensitivity testing, which tests what reduction in the level of different development
requirements and obligations is required to achieve viability. Typically, this is likely to involve
a reduction in the proportion of affordable housing sought and a consequential increase in
the proportion of private housing. This would have the effect of increasing the overall land
value until ‘viability’ has been reached. Alternatively, reducing the level of CIL may achieve
viability, and, in the event of marginal viability, it is a political decision as to whether to aim
for maximising either CIL or affordable housing.
What is Economic Viability?
3.2.13 Viability, or a lack of viability, is a concept frequently referred to by developers and
landowners in negotiating contributions towards the provision of community facilities. The
argument put forward is that the overall burden of community gain items can reduce the
actual value to the owner below that of its existing or alternative value, or to such a level as
to render it ‘unviable’, or simply not profitable enough to make a sale worthwhile to the
owner, taking account of taxation liability and relocation costs.
3.2.14 Viability has a central role in policy evolution and negotiations but there is little government
guidance as to how viability negotiations are to be conducted or how local authorities are to
make decisions based upon the outcome of a viability appraisal.
3.2.15 The NPPF provides clear guidance on viability, stressing in para. 173 that, in order to ensure
viability and deliverability:
The costs of any requirements likely to be applied to development, such as requirements for
affordable housing, standards, infrastructure contributions or other requirements should,
when taking account of the normal cost of development and mitigation, provide competitive
returns to a willing land owner and willing developer to enable the development to be
deliverable.
3.2.16 Further guidance is provided in ‘Viability Testing Local Plans’ (Local housing Delivery Group,
June 2012), which emphasises that:
An individual development can be said to be viable if, after taking account of all costs,
including central and local government policy and regulatory costs, and the cost and
availability of development finance, the scheme provides a competitive return to the
developer to ensure that development takes place, and generates a land value sufficient to
persuade the land owner to sell the land for the development proposed.
3.2.17 The Government’s established aim through planning is to ensure that enough land is
identified and brought forward for development, but it recognises that in order to do so,
residual land values must be high enough to encourage landowners to sell land. It therefore

CIL Economic Stratford-on-Avon CIL
21
requires local authorities not to impose a burden of planning gain and affordable housing that
is so great as to depress the land value below that which is sufficient to bring land forward.
3.3 Our Approach
3.3.1 The critical question is what is a ‘viable’ land value? What should be reasonably expected
by landowners as a residual value, once all costs have been deducted? The approach we
have taken to this concept is that it is rational to assume that if a residual value is arrived at
which is in reasonable excess of the current or alternative site value including its current or
potential income, taking account of all sale and related costs, the landowner be pursued by
developers, and the site be delivered through the operation of the market.
3.3.2 What is a ‘reasonable excess’ in practice? It must be a level sufficiently acceptable, given all
the planning circumstances, to persuade the landowner to dispose to a developer. This
must work both ways in a sale; for example, some landowners may be willing to sell at a
given price, but cannot attract a purchaser, in which case the price is too high.
3.3.3 The definition of ‘viability’ for the purposes of this assessment is the attainment of a site
value sufficiently in excess of the current site value that all stakeholders, including the
purchaser and landowner, all acting reasonably and rationally, would accept, thus securing
delivery of the proposed development.
3.3.4 Clearly, not all landowners adhere to the same concept of reasonableness and rationality in
defining viability. Studies of economic viability have taken two broad approaches. One
relates to the acceptability of development land prices to existing/alternative non-residential
use values (‘the economic approach’). The other relates acceptability to expectations based
on residential land prices currently being achieved (‘the psychological approach’).
3.3.5 Residential - We use three benchmarks to assess residential viability. The first is the simple
comparison of relative land values, comparing the value achieved on the assumption of a
planning consent with the existing use value (EUV), (the ‘economic’ approach). If a value
with consent is sufficiently in excess of the current site value, taking account of current and
potential incomes, then the site can be considered to be viable in principle. The difference in
values is measured by an uplift factor.
3.3.6 As an example, a typical small infill site of 0.2 ha suitable for about 8 dwellings, currently
comprising of unused incidental open space, with a nominal open market value (OMV) of
£10,000 without planning permission, might be worth say £250,000 with a residential
consent, having allowed for all development costs and contributions.
3.3.7 The significant increase in value of £240,000 represents an uplift factor of 24, and would
plainly demonstrate viability. The excess varies in different circumstances, reflecting current
use and taxation levels.
3.3.8 At the other end of the scale, the owner of a brownfield site with an existing use value of
£400,000 that could be worth £440,000 with a residential permission would consider that the
increase of £40,000 (or uplift factor of 1.1), insufficient to persuade the owner to sell,
particularly given taxation on capital gains, in addition to sale and possible relocation costs.
CIL Economic Stratford-on-Avon CIL
22
For most sites, an uplift factor of more than 1.4 will be required to enable viability, depending
on site characteristics and circumstances. An uplift of 1.4 would normally be considered to
be marginally viable.
3.3.9 In addition to achieving an acceptable uplift factor taking account of the existing use value,
all sites must exceed the opportunity cost of income that could be generated by an
alternative use. As an example a 1 ha brownfield site in an appropriate location (eg, close to
a town centre) could theoretically accommodate about 100 cars for parking at £5 per day for
say 40 weeks, or 200 days, which would generate an annual income of £100k.
3.3.10 At 50% capacity taking account of overall and fluctuating demand, as well as voids, 50 cars
would generate £50k per year. The uplift value should take account of potential for such
income, and the potential annual interest that would be generated by the sale which would
be forgone if the site remains a car park. The uplift should significantly exceed the potential
income of the alternative use.
3.3.11 A second benchmark test is against ‘hope value’. This applies to most land adjoining built-up
areas of settlements, and to sites within settlements in alternative lower value uses which
are perceived to have ‘hope’ of a change of use. The hope value of agricultural land is in the
region of £50k/ha, and for brownfield sites this needs to be considered on an individual
basis.
3.3.12 Greenfield urban extensions are often subject to option agreements, where the value is
calculated at the time planning permission is granted, and where there is frequently a
minimum value provision in the agreement. This is the third benchmark comparison, and
currently, the typical minimum land value is about £500k per net developable ha and
greenfield sites that achieve less than this are deemed not to be viable.
3.3.13 There may be occasions where minimum land values are not achieved but the landowner
and promoter are both keen to secure a deal, in which case a land value is negotiated. This
may be slightly above or below the minimum, but the standard used is the best against which
to benchmark achieved residual value (RLV).
3.3.14 Each of the residential generic site typologies is tested against all three benchmarks, where
appropriate, and the viability conclusion is based on these tests.
3.3.15 Non-residential – We take a similar approach to the residential testing in that we compare
the residual value with that of an existing use value plus uplift. As previously described, sites
in town centres will already have a high existing use value in comparison to say an
agricultural field. They are normally generating income and therefore a reasonable approach
needs to be taken in terms of both their existing value as often a going concern and the uplift
required incentivising redevelopment. For town centre sites we look at local market data
when property has exchanged and then apply an uplift factor of at least 1.4 to provide a
realistic incentive. Our view on uplift is also within the context of the type of use proposed,
high value uses such as supermarkets require a greater uplift as the landowner will know the
greater value of these uses and therefore expect a higher price. A similar approach is taken

CIL Economic Stratford-on-Avon CIL
23
to out of centre and edge or out of town sites, although clearly the existing use values will
change according to location.
CIL Economic Stratford-on-Avon CIL
24
4 Residential Viability Assessments
4.1 Assumptions
4.1.1 A number of assumptions need to be made as part of the viability appraisal process in order to
illustrate site value and its ability to meet community gain, and remain viable. A site can be
developed in a myriad of different ways, and the variables are so numerous that the permutations
are infinite. Each generic site Viability Appraisal considers the variables that affect the site value,
to enable a site’s market and physical characteristics, and costs, to be inputted into each appraisal
to reach viability conclusions.
4.1.2 Each Viability Appraisal in Appendix 1 summarises the development assumptions. This includes
the site area, the total number of dwellings, with details of mix and tenure, in order to arrive at
floorspace assumptions. Sales values and build costs are also summarised. A merged mix of
affordable and open market housing, based on 35% provision of affordable residential floorspace
has been used. Each generic site appraisal is summarised in Appendix 1, and clearly sets out the
development assumptions that underpin each viability appraisal. The principal variable factors are
explored below:
4.2 Dwelling Mix
4.2.1 The dwelling mix for each generic site is derived from information contained in the SHMA on
recommended dwelling mix for both affordable and open market housing.
4.2.2 This is modified to reflect the location and site characteristics of each generic site, and the housing
market in the nominal location. Town centre sites are more likely to accommodate town houses
with some flats, whilst greenfield urban extensions have a much higher proportion of family
dwellings, and reflect the entire range of market demand.
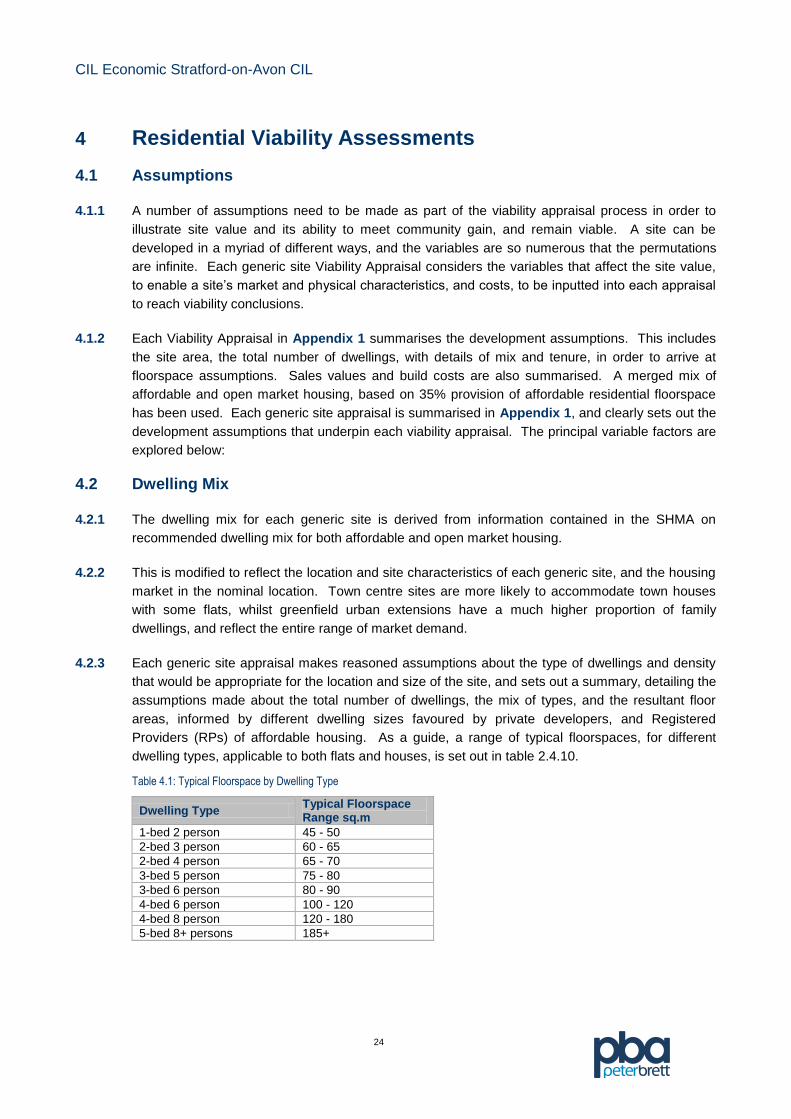
4.2.3 Each generic site appraisal makes reasoned assumptions about the type of dwellings and density
that would be appropriate for the location and size of the site, and sets out a summary, detailing the
assumptions made about the total number of dwellings, the mix of types, and the resultant floor
areas, informed by different dwelling sizes favoured by private developers, and Registered
Providers (RPs) of affordable housing. As a guide, a range of typical floorspaces, for different
dwelling types, applicable to both flats and houses, is set out in table 2.4.10.
Table 4.1: Typical Floorspace by Dwelling Type
Dwelling Type Typical Floorspace Range sq.m
1-bed 2 person 45 - 50
2-bed 3 person 60 - 65
2-bed 4 person 65 - 70
3-bed 5 person 75 - 80
3-bed 6 person 80 - 90
4-bed 6 person 100 - 120
4-bed 8 person 120 - 180
5-bed 8+ persons 185+
CIL Economic Stratford-on-Avon CIL
25
4.3 Coverage, or Saleable Floorspace
4.3.1 In order to establish housing land values, assumptions need to be made about the likely saleable
floorspace of the dwellings, in order to generate an overall sales turnover. Until the onset of the
recession, the vast majority of housing schemes ranged from around 4,000 sq.m/ha for
predominantly 2 - 2.5 storey development, and up to 4,600 - 5,500 sq.m/ha for 2.5 - 4 storey
scheme.
4.3.2 Since the recession, with market resistance to 3+ storey townhouses and flats, developers are
reducing coverage to an average ranging from 3,000-3,700 sq.m/ha. There is a diminishing return
on the third storey in townhouses, since lower sale prices per sq.m are achieved, and there comes
a point where a higher land value can be generated on traditional 2-storey dwellings.
4.3.3 Floorspace is also affected by the loss of land given over to other uses than residential. Housing
needs to be serviced by roads for instance, and, for larger developments, land is required for public
open space, strategic landscaping, community buildings, employment, and possibly schools.
4.3.4 The provision of such non-residential land uses have been taken into account in reaching net
residential areas, and have been considered in the generic site viability appraisals. Evidently, the
proportion of saleable floorspace per site has a major effect on sales turnover, and in turn, on land
value, which is a consequence of the relationship between sales turnover and development costs,
profit, and overhead. Total turnover is dramatically increased by greater coverage.
4.4 Sales Value for Open Market Housing
4.4.1 In order to arrive at a total sales turnover, assumptions need to be made about sales values.
These have been sourced from an assessment of the housing market based on discussions with
local developers and agents about their current experience, and generic websites such as the
Right Move and Zoopla. We use revenues for new properties because it is from these figures that
current and future land values are derived.
4.4.2 As a guide, open market sales prices per sq.m for new homes, allowing for a reduction between
asking price and achieved selling prices, vary from the lowest at around £2,300 in Studley, to
£2,600 - £2,800 in the eastern settlements of Southam, Kineton and Wellesbourne, to £3,000 in
Stratford-upon-Avon, with the highest prices being achieved in some of the Henley-in-Arden
(£3,300) and Welford (£3,800). This represents an increase of about 10% on selling prices in 2009
when the range was about £2,100 - £2,800, which is a commentary on the strength and resilience
of Stratford-on-Avon District’s housing market.
4.4.3 Sales values are also affected by the specification of the development. A high specification
scheme, usually in a high demand location, can lead to premium sale prices. Open market sales
values are also affected by the proportion of affordable housing on a site, as well as the
juxtaposition of open market housing with affordable housing, particularly social rented units.
4.4.4 Values are also affected by the size of the site, reflecting return on capital employed across a
period of time, the cost of financing a purchase compared with the time taken to receive all site
sales value.
CIL Economic Stratford-on-Avon CIL
26
4.4.5 The helpful discussions with the development industry at the meeting on 13th July provided
invaluable information about the various elements of the housing market, particularly about likely
sales revenues.
4.4.6 Sales rates also have a major effect on the overall financing, and most volume housebuilder
projects seek to achieve around 35-40 open market sales per year (down some 20% from 2007) in
order to justify the land economics upon which the land purchase is based. On larger sites (of, say,
4+ developers), and allowing for affordable housing, this would result in some 200+ dwellings per
annum being completed.
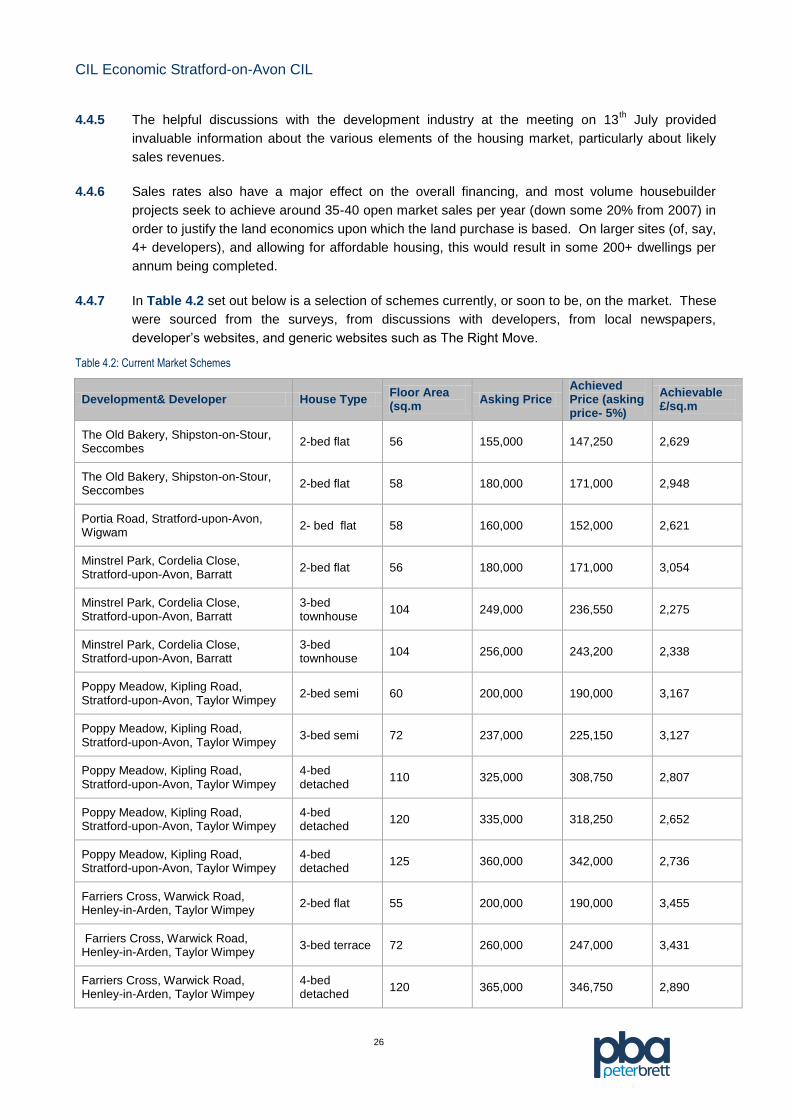
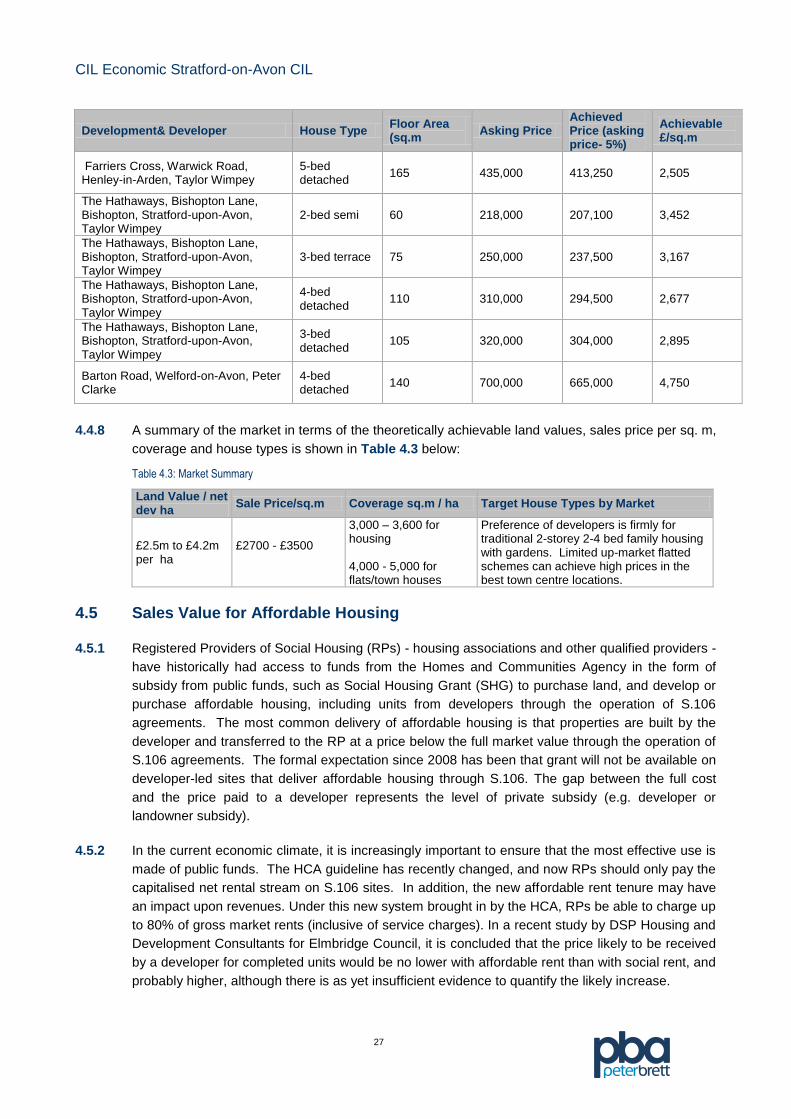
4.4.7 In Table 4.2 set out below is a selection of schemes currently, or soon to be, on the market. These
were sourced from the surveys, from discussions with developers, from local newspapers,
developer’s websites, and generic websites such as The Right Move.
Table 4.2: Current Market Schemes
Development& Developer House Type Floor Area (sq.m
Asking Price Achieved Price (asking price- 5%)
Achievable £/sq.m
The Old Bakery, Shipston-on-Stour, Seccombes
2-bed flat 56 155,000 147,250 2,629
The Old Bakery, Shipston-on-Stour, Seccombes
2-bed flat 58 180,000 171,000 2,948
Portia Road, Stratford-upon-Avon, Wigwam
2- bed flat 58 160,000 152,000 2,621
Minstrel Park, Cordelia Close, Stratford-upon-Avon, Barratt
2-bed flat 56 180,000 171,000 3,054
Minstrel Park, Cordelia Close, Stratford-upon-Avon, Barratt
3-bed townhouse
104 249,000 236,550 2,275
Minstrel Park, Cordelia Close, Stratford-upon-Avon, Barratt
3-bed townhouse
104 256,000 243,200 2,338
Poppy Meadow, Kipling Road, Stratford-upon-Avon, Taylor Wimpey
2-bed semi 60 200,000 190,000 3,167
Poppy Meadow, Kipling Road, Stratford-upon-Avon, Taylor Wimpey
3-bed semi 72 237,000 225,150 3,127
Poppy Meadow, Kipling Road, Stratford-upon-Avon, Taylor Wimpey
4-bed detached
110 325,000 308,750 2,807
Poppy Meadow, Kipling Road, Stratford-upon-Avon, Taylor Wimpey
4-bed detached
120 335,000 318,250 2,652
Poppy Meadow, Kipling Road, Stratford-upon-Avon, Taylor Wimpey
4-bed detached
125 360,000 342,000 2,736
Farriers Cross, Warwick Road, Henley-in-Arden, Taylor Wimpey
2-bed flat 55 200,000 190,000 3,455
Farriers Cross, Warwick Road, Henley-in-Arden, Taylor Wimpey
3-bed terrace 72 260,000 247,000 3,431
Farriers Cross, Warwick Road, Henley-in-Arden, Taylor Wimpey
4-bed detached
120 365,000 346,750 2,890
CIL Economic Stratford-on-Avon CIL
27
Development& Developer House Type Floor Area (sq.m
Asking Price Achieved Price (asking price- 5%)
Achievable £/sq.m
Farriers Cross, Warwick Road, Henley-in-Arden, Taylor Wimpey
5-bed detached
165 435,000 413,250 2,505
The Hathaways, Bishopton Lane, Bishopton, Stratford-upon-Avon, Taylor Wimpey
2-bed semi 60 218,000 207,100 3,452
The Hathaways, Bishopton Lane, Bishopton, Stratford-upon-Avon, Taylor Wimpey
3-bed terrace 75 250,000 237,500 3,167
The Hathaways, Bishopton Lane, Bishopton, Stratford-upon-Avon, Taylor Wimpey
4-bed detached
110 310,000 294,500 2,677
The Hathaways, Bishopton Lane, Bishopton, Stratford-upon-Avon, Taylor Wimpey
3-bed detached
105 320,000 304,000 2,895
Barton Road, Welford-on-Avon, Peter Clarke
4-bed detached
140 700,000 665,000 4,750
4.4.8 A summary of the market in terms of the theoretically achievable land values, sales price per sq. m,
coverage and house types is shown in Table 4.3 below:
Table 4.3: Market Summary
Land Value / net dev ha
Sale Price/sq.m Coverage sq.m / ha Target House Types by Market
£2.5m to £4.2m per ha
£2700 - £3500
3,000 – 3,600 for housing 4,000 - 5,000 for flats/town houses
Preference of developers is firmly for traditional 2-storey 2-4 bed family housing with gardens. Limited up-market flatted schemes can achieve high prices in the best town centre locations.
4.5 Sales Value for Affordable Housing
4.5.1 Registered Providers of Social Housing (RPs) - housing associations and other qualified providers -
have historically had access to funds from the Homes and Communities Agency in the form of
subsidy from public funds, such as Social Housing Grant (SHG) to purchase land, and develop or
purchase affordable housing, including units from developers through the operation of S.106
agreements. The most common delivery of affordable housing is that properties are built by the
developer and transferred to the RP at a price below the full market value through the operation of
S.106 agreements. The formal expectation since 2008 has been that grant will not be available on
developer-led sites that deliver affordable housing through S.106. The gap between the full cost
and the price paid to a developer represents the level of private subsidy (e.g. developer or
landowner subsidy).
4.5.2 In the current economic climate, it is increasingly important to ensure that the most effective use is
made of public funds. The HCA guideline has recently changed, and now RPs should only pay the
capitalised net rental stream on S.106 sites. In addition, the new affordable rent tenure may have
an impact upon revenues. Under this new system brought in by the HCA, RPs be able to charge up
to 80% of gross market rents (inclusive of service charges). In a recent study by DSP Housing and
Development Consultants for Elmbridge Council, it is concluded that the price likely to be received
by a developer for completed units would be no lower with affordable rent than with social rent, and
probably higher, although there is as yet insufficient evidence to quantify the likely increase.
CIL Economic Stratford-on-Avon CIL
28
4.5.3 The council is currently finalising a Strategic Housing Market Assessment Review (SHMA),
which considers housing market mix for both affordable and open market dwellings.
Consultant GL Hearne has carried out an assessment of typical housing mix of dwelling
types to reflect the needs of the population over the plan period. It considers the following
issues:
An overview of housing market conditions - before 2008 and after 2008;
A market appraisal - analysing house price & sale trends - housing stock and
understanding affordability;
Profiles of spatial variations and trends in house prices, market turnover and new build
sales in Stratford-upon-Avon, main rural centres and rural areas;
Housing market dynamics includes consulting estate agents and letting agents. including
buy to let/investment market, checking supply and demand trends; and
Assessing entry level housing costs between tenures and assessment of income, to
assess social rent, affordable rent, private rent and owner occupation.
4.5.4 Our discussions with developers and agents sought views on the state of the housing
market, land values in different parts of the district, sales vales, the types of development, or
dwelling mix, targeted by developers on different sites, and sales rates. These discussions
reveal the following open market housing mix that is generally sought by developers on new
sites:
1-bed 5%
2-bed 35%
3-bed 40%
4-bed 15%
5-bed 5%
4.5.5 These findings are broadly compatible with the housing mix recommendations of the GL
Hearne SHMA Update of June 2012. Whilst the draft SHMA update has been used to inform
preparation of this report, it has not been adopted as council policy, and its testing should not
be regarded as an endorsement. The SHMA update found the following future blended
dwelling mix requirements for both affordable and open market units in the period to 2028:
1-bed 8%
2-bed 34%
3-bed 40%
4+-bed 14%
4.5.6 In reaching conclusions for site assessment yields, we have used these proportions as a
guideline, but taken account of individual site characteristics, and rounded total proportions
up or down to suit these characteristics.
4.5.7 Following discussions with RPs, the generic viability appraisals use revenues that equate to
the level of capitalised rental and revenues for all affordable housing tenures, based on the
CIL Economic Stratford-on-Avon CIL
29
tenure split in the SHMA. Local RPs have estimated this to be about 48% to 52% of the
open market sales values, representing a rate that RPs can purchase from developers
without the use of grant subsidy. They also commented that our estimate of open market
sales was on the high side, and that there was no difference in blended affordable revenues
resulting from an alteration from the 75% - 25% social rent-shared ownership, to the 60%-
20%-20% proposed tenure split in the SHMA to include the new affordable rent product.
This is because the reduction in revenue from shared ownership and social rent is
compensated by an increased from affordable rent.
4.5.8 We have erred on the side of caution, and have assumed a 45% blended revenue from
affordable floorspace. It may be that the overall revenue from affordable housing will
consistently return above 45% of open market revenue, as a result of the new affordable rent
tenure, and this should be the subject of future monitoring by the council in discussion with
RPs.
4.5.9 Each site viability appraisal assumes that affordable housing will be provided on site at 35%
of the total residential floor area, and within this policy a tenure profile applies, with a
minimum requirement of 75% Social Rent and a maximum of 25% Shared Ownership. Any
alternative tenure profiles will require consultation and adoption as council policy, as
suggested in the SHMA Update.
4.5.10 There are an infinite number of possible ways to provide affordable accommodation, with or
without grant. We have assumed, in line with the latest HCA Guidance, that no social
housing grant be available to support the transfer and acquisition of affordable housing
through their delivery by S.106 agreements from the private housing developers to housing
associations.
4.6 Build Costs
4.6.1 The overall build costs, including on-site infrastructure, must be deducted from total turnover
to give an interim land value. After research of the BCIS sources and consultation with the
housebuilding industry operating locally, a range of all-in build costs including externals have
been used. The normal range used in the viability appraisals range from £950/sq.m up to
£1,000/sq.m, to include additional Code 3 build costs, discussed below.
4.6.2 Volume and regional housebuilders usually build at an average of about £800 - £950/sq.ft all
in, including normal infrastructure and externals, and the range reflects the ability of the
volume housebuilders to achieve significant economies of scale in the purchase of materials
and the use of labour. Many smaller developers are unable to attain these economies, so
their construction costs be higher; however, this can be compensated for by lower
overheads, and this often enables smaller developers to acquire sites in competition. We
have opted on the side of caution in our assumptions, with the addition of a 5% contingency.
4.6.3 Build costs for conversions are often as high as new build, particularly since they are in the
main carried out in small schemes by individual developers without economies of scale. In
addition, build costs for flats are generally higher than for traditional 2/3 storey
developments, due to higher costs associated with circulation space, multi-storey

CIL Economic Stratford-on-Avon CIL
30
construction, and extra facilities such as lifts. RPs also tend to specify higher build costs than
the volume housebuilders. This is because they frequently employ a contractor for the
construction of affordable dwellings, as opposed to developers who either employ
construction workers, or engage in direct sub-contracting. In this way, the volume builders
build at cost, whereas the Housing Associations will be paying a profit element on top of
build costs to the contractor.
4.6.4 Typically, a Housing Association might have build costs of about £1,000/sq.m. In order to
compensate for these higher build costs, an RP will not require the profit levels sought by the
private developers, typically 20% of gross turnover, and in addition, part of the building costs
fees may be absorbed in the contractor’s build cost. The generic site appraisals have
reflected the likely build costs of each individual site, depending on its scale and
characteristics. Much of the affordable housing delivered through S.106 agreements is
actually built by the volume developers at their lower rates, and a build profit on affordable
housing provision has been factored into the appraisals.
4.7 The Code for Sustainable Homes
4.7.1 The government has previously committed to ensuring that all new-build homes are zero
carbon from 2016. In the Budget ‘Plan for Growth’ of March 2011 the government has
updated the guidance on costs of implementing the code for sustainable homes in order to
ensure that it remains viable to build new homes in the context of the recession.
4.7.2 From 2016, the revised definition of Zero Carbon now only meets Code for Sustainable
Homes (CSH) Level 5, requiring that 100% of emissions from heating, lighting, and heating
hot water need to be reduced or generated on site. The consequence for construction costs
has yet to be fully assessed, but the new standards result in higher build costs, that could
affect viability. The possible increased costs for implementing the Code have been
estimated in a report by CLG “Code for Sustainable Homes, a Cost Review”, March 2010,
updated in August 2011.
4.7.3 The additional cost estimates for all the Code Levels vary depending on site type, location,
and size. The updated report suggests that Level 3 can be achieved for an average
additional cost of £1,000 per home, and the scenarios modelled for Level 5 show average
cost increases of £19,740. Strategic greenfield sites have higher costs at £1,400/unit for
level 3, and £20,000 for level 5.
4.7.4 It is important to reflect the circumstances applying both today for sites coming up for
development, and for sites that be developed post-2016, to reflect Code 5 requirements. We
have therefore allowed additional costs for the extra CSH costs - Code 3 at an average of
£1,000/unit (£1,400/unit for strategic greenfield sites), which are built into the base cost of
£950/sq.m, with an additional £20,000/unit for Code 5, where construction is anticipated to
be post 2016.
4.7.5 It should also be noted that whilst we have tested at a Level 5 equivalent and that there have
been indications in the past that the building regs would be changed to reflect this position, a
firm commitment has yet to be made regarding changing the building regs to reflect Level 5
CIL Economic Stratford-on-Avon CIL
31
by 2016. Therefore this is a cautionary approach and when revised building regs are
confirmed the council will need to consider the impact.
4.8 Developer’s Profit and Professional Fees and Financing
4.8.1 All developers have a slightly different approach to levels of profit and overhead. Profits are
derived from turnover across a number of sites, some of which may have been held long-
term in land banks, and others acquired as a result of option agreements where price is
established at a discount to Open Market Value (OMV). The most appropriate profit level is
that which most developers currently assume when appraising sites for purchase for
immediate development. This is an accurate reflection of the operation of the market for
land and new homes for a study that is reflecting conditions in 2011.
4.8.2 Our discussions with developers and agents reveal an acceptable profit margin of between
18% and 22% on turnover. In some cases, higher margins might be justified given the range
of contingencies and higher risks associated with some sites. For the purposes of the
generic viability assessments, we have used 20% as a reasonable mid-range. The views of
those attending the meeting on 13th July 2012 considered a 20% profit margin to be
reasonable.
4.8.3 Fees also need to be taken into account, including architects, engineers, planning, survey,
project manager and insurances, which amount to 12% of the gross construction cost. In
addition, allowances have been made for financing costs of construction, as well as land
purchase, allowing for annual interest costs to be included for large schemes, reflecting
phased purchase, completion rates, and sales revenues.
4.8.4 Allowances have also been made for Stamp Duty Land Tax, and legal costs, which have all
been factored into the generic viability assessments, in addition to allowances for marketing
fees.
4.9 Additional or ‘Abnormal’ Development Costs
4.9.1 The next stage in the consideration of land value and variables is an examination of
development costs, beyond those accounted for in the overall build costs. These include
physical items such as improvements to highway access, off-site highway improvements,
additional drainage requirements, strategic landscaping, tree retention, increased costs
associated with development on excessive gradients. On brownfield site in particular, there
are often increased costs associated with demolition, remediation of contamination, and
abnormal foundations.
4.9.2 There will be different levels of development costs according to the type and characteristics
of each site. The approach taken is to reflect in each generic appraisal an amount that
would typically be expected on the type of site being assessed, taking into account location,
size, character, and whether the site is PDL or greenfield. Abnormal development costs for
large urban extensions tend to be much higher than for small PDL sites. An allowance for
demolition and remediation costs is included where this is evident, such as on generic PDL
sites. The range for abnormal development costs vary from £300k/ha up to £800k/ha for
large urban extensions.
CIL Economic Stratford-on-Avon CIL
32
4.10 CIL and Community Gain Package
4.10.1 New development has a cumulative impact on infrastructure and often creates a need for
additional or improved community services and facilities without which the development
could have an adverse effect upon amenity, safety, or the environment. Planning
contributions are an important way of providing the physical, economic and social
infrastructure required to facilitate development and support the creation of sustainable
communities.
4.10.2 One of the most significant items of community gain sought from residential development
sites is affordable housing, discussed previously. Other planning obligations, such as
contributions towards education provision, and public open space, are part of the CIL
contribution initially tested at £100/sq.m. This level has been selected because it has been
found to be about the right, achievable, level of CIL elsewhere in the country with similar
revenue profiles. If a generic site is not viable with this level of CIL, the CIL is sensitivity
tested until viability is achieved. Alternatively, other cost elements are adjusted in sensitivity
testing, for example, lowering the proportion of affordable housing.
4.10.3 All of the value variables are addressed in the generic viability appraisals, which are set out
in Appendix 1. All the assumptions and variables that have been used in the generic site
viability testing have been subject to considerable research and testing against prevailing
market conditions, development costs, local and government policy. Accordingly, they are
considered to be achievable, but reasonable.
4.11 Generic Residential Viability Appraisals
4.11.1 Each generic site has been subjected to a detailed appraisal, and these appear in Appendix
1. Every generic site has an individual set of development and market assumptions,
providing floorspace, sales turnover, development and abnormal costs, fees allowance, all of
which lead to a land value. The floorspace assumptions are based from the dwelling mix,
and assumed floorspace. The critical element is the difference between sales revenue and
build cost.
4.11.2 A clear conclusion has been reached for each generic site about viability. In order to inform
these conclusions, a comparison has been made with the estimated current land value to
give a ‘value added’ figure, or uplift factor to justify to the conclusion. As discussed earlier,
an uplift factor of at about 1.4 is required to achieve viability, in particular for brownfield sites.
Viability is often determined in the eyes of the landowner; if (as in generic site 4), the
achieved uplift is only 1.32, with an uplift of £681k, the owner may choose to dispose,
despite the modest uplift, depending on personal circumstances. In cases like this, a site is
considered to be marginally viable. Of course, greenfield sites must achieve a much higher
uplift and be assessed against other benchmarks of deliverability such as ‘hope’ value, and
against the minimum land values typically found in option and promotion agreements.
4.11.3 In viability testing, there are an almost infinite number of variables that could be modelled.
The reduction of a particular cost will evidently increase profitably and viability. CIL has
been tested at £100/sq.m for residential schemes, and where found to be unviable, it has
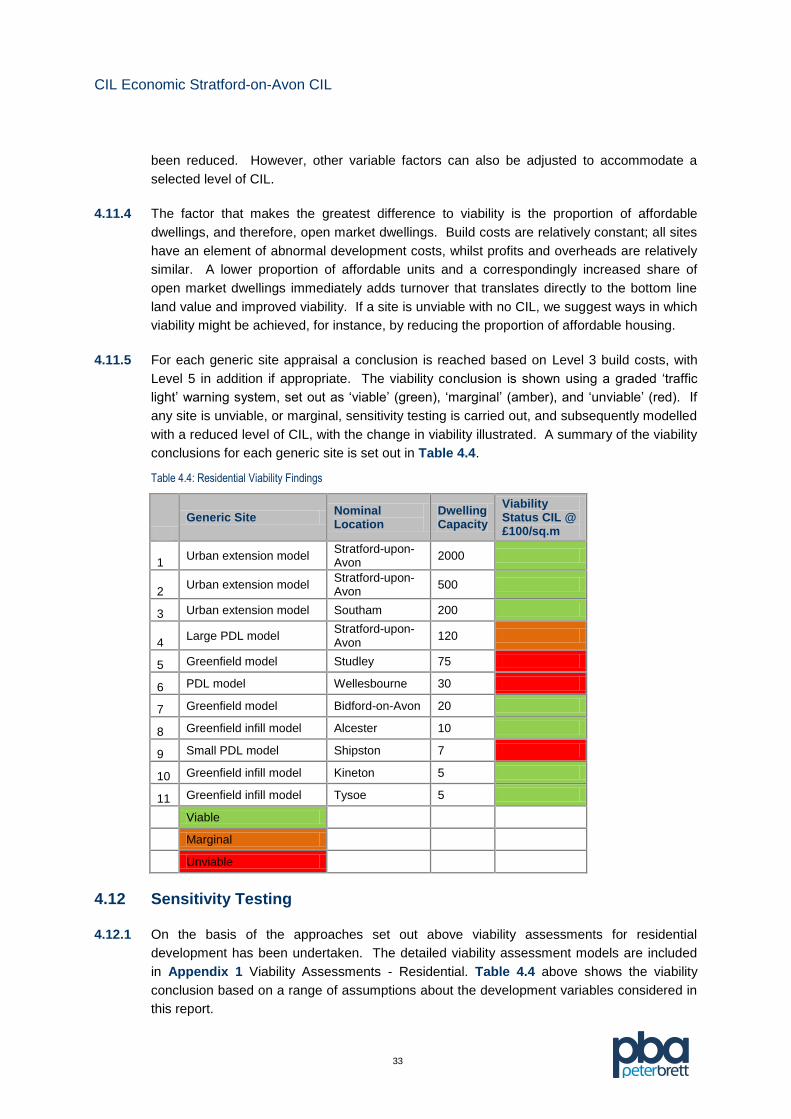
CIL Economic Stratford-on-Avon CIL
33
been reduced. However, other variable factors can also be adjusted to accommodate a
selected level of CIL.
4.11.4 The factor that makes the greatest difference to viability is the proportion of affordable
dwellings, and therefore, open market dwellings. Build costs are relatively constant; all sites
have an element of abnormal development costs, whilst profits and overheads are relatively
similar. A lower proportion of affordable units and a correspondingly increased share of
open market dwellings immediately adds turnover that translates directly to the bottom line
land value and improved viability. If a site is unviable with no CIL, we suggest ways in which
viability might be achieved, for instance, by reducing the proportion of affordable housing.
4.11.5 For each generic site appraisal a conclusion is reached based on Level 3 build costs, with
Level 5 in addition if appropriate. The viability conclusion is shown using a graded ‘traffic
light’ warning system, set out as ‘viable’ (green), ‘marginal’ (amber), and ‘unviable’ (red). If
any site is unviable, or marginal, sensitivity testing is carried out, and subsequently modelled
with a reduced level of CIL, with the change in viability illustrated. A summary of the viability
conclusions for each generic site is set out in Table 4.4.
Table 4.4: Residential Viability Findings
Generic Site Nominal Location
Dwelling Capacity
Viability Status CIL @ £100/sq.m
1 Urban extension model
Stratford-upon-Avon
2000
2 Urban extension model
Stratford-upon-Avon
500
3 Urban extension model Southam 200
4 Large PDL model
Stratford-upon-Avon
120
5 Greenfield model Studley 75
6 PDL model Wellesbourne 30
7 Greenfield model Bidford-on-Avon 20
8 Greenfield infill model Alcester 10
9 Small PDL model Shipston 7
10 Greenfield infill model Kineton 5
11 Greenfield infill model Tysoe 5
Viable
Marginal
Unviable
4.12 Sensitivity Testing
4.12.1 On the basis of the approaches set out above viability assessments for residential
development has been undertaken. The detailed viability assessment models are included
in Appendix 1 Viability Assessments - Residential. Table 4.4 above shows the viability
conclusion based on a range of assumptions about the development variables considered in
this report.

CIL Economic Stratford-on-Avon CIL
34
4.12.2 Seven of the 11 models are viable with CIL at £100/sq.m. For the three urban extension
models, the viability conclusions are that the development would be viable with CIL at
£100/sq.m, and with 35% affordable housing. The same conclusion is reached for the
generic examples at the relatively high value areas at Bidford, Alcester, Kineton, and Tysoe.
4.12.3 However, four of the 10 models are either unviable or marginally viable, and for these there
is a requirement to carry out sensitivity testing until viability can be demonstrated, by a
combination of adjusting the level of CIL, or reducing the proportion of affordable housing.
Table 4.5 shows the effects of firstly, reducing CIL to zero to determine whether this makes
the site viable, and if not, or as an alternative, illustrating the lower proportion of affordable
housing below the 35% normal that will achieve viability.
Table 4.5: Sensitivity Testing to Achieve Viability
Generic Site Nominal Location
Dwelling Capacity
Viability Status CIL @ £100/sq.m& 35% Affordable
CIL Reduced to
CIL Remains at £100/sq.m, Affordable % reduced to
4a Large PDL model Stratford-upon-Avon
120 £67/sq.m 32%
5a Greenfield model Studley 75 £0 23%
6a PDL model Wellesbourne 30 £0 17%
9a Small PDL model Shipston 7 £0 28%
Viable
Marginal
Unviable
4.12.4 As an alternative, on the four models that are either unviable or marginally viable, we have
sensitivity tested the maximum level of affordable housing that could be achieved assuming
no CIL contribution. This is set out in table 4.6 below:
Table 4.6: Sensitivity Testing to maximise % of affordable housing with varying levels of CIL
Generic site Nominal location
Dwelling capacity
CIL @ £100/sq.m, with affordable housing @:
CIL @ £0/sq.m with affordable housing @:
CIL @ £50/sq.m with affordable housing @:
4a Large PDL model Stratford-upon-Avon
120 32% 39% 36%
5a Greenfield model Studley 75 23% 33% 29%
6a PDL model Wellesbourne 30 17% 26% 22%
9a Small PDL model Shipston 7 28% 35% 32%
4.12.5 The sensitivity testing has been carried out on sites that were either unviable or marginally
viable. The reasons for the lack of viability caused by inter-related financial variables, in
particular relatively low sales revenues, and relatively high existing use values (EUV), arising
from being brownfield sites, or valuable garden land. The generic site examples are
discussed below:
CIL Economic Stratford-on-Avon CIL
35
4a – Large PDL Model – 120 Units
4.12.6 This is a large PDL employment site at Stratford-upon-Avon for 120 dwellings. The average
sales values are £2,900/sq.m, with slightly higher than average build costs of £1000/sq.m to
take account of a proportion of 1 and 2-bed flats as well as an additional £200k/ha costs for
demolition and remediation. The critical reason why the site is found to be only marginally
viable is because the EUV is based on employment use at £750k/ha, so the site value of
£2.8m is only 1.3 times higher than the EUV of £2.14m. In order to achieve viability, either
CIL needs to reduce to £67/sq.m, or with CIL remaining at £100/sq.m, the affordable
proportion needs to reduce to 32%. Alternatively, the council could propose zero CIL, and
increase the affordable housing proportion from 32% to 39%.
5a – Greenfield Model – 75 Dwellings
4.12.7 This model is a large greenfield site at Studley for 75 dwellings. The average sales value is
relatively low at £2,300/sq.m. The main reason why the site is found to be unviable is, whilst
the land value of £463k is significantly higher than EUV (agricultural), this is lower than the
typical minimum land values found in option agreements of about £500k/ha so the site will
not be viable for either promoter or landowner. In order to achieve viability, the affordable
proportion needs to reduce to 23%, because even reducing CIL to zero will not make the site
viable on its own. This is mainly because of the relatively low sales value at £2,300/sq.m.
Alternatively, the council could propose zero CIL, and increase the affordable housing
proportion from 23% to 33%.
6a – Smaller Brownfield Model – 30 Units
4.12.8 This is a smaller PDL site at Wellesbourne for 30 dwellings. The average sales value is
2,600/sq.m. The critical reason why the site is found to be unviable is because the EUV is
based on employment use at £600k/ha, so the site value of £322k is less than the EUV of
£450k. In order to achieve viability, the affordable proportion needs to reduce to 17%,
because even reducing CIL to zero will not make the site viable on its own. This is mainly
because of the relatively high EUV of £450k. Alternatively, the council could propose zero
CIL, and increase the affordable housing proportion from 17% to 26%.
9a – Small PDL Model – 7 Dwellings
4.12.9 This is a small PDL site at Shipston for 7 dwellings. The average sales values is
£2,900/sq.m. The main reason why the site is found to be unviable is because the EUV is
based on employment use at £600k/ha, so the site value of £138k only marginally higher
than the EUV of £120k. In order to achieve viability, the CIL needs to reduce to zero, if
affordable housing is to remain at 35%. The alternative is to retain CIL at £100/sq.m, and
reduce the affordable proportion to 28%. This is mainly because of the relatively high EUV
of £120k.
CIL Economic Stratford-on-Avon CIL
36
4.13 Summary of Findings from Residential Analyses and Recommended CIL Approaches
4.13.1 As stated in para 4.12.2, seven of the 11 residential models are viable with CIL at £100/sq.m
and affordable housing at 35% of floorspace. These are the three urban extension models
and the examples at the relatively high value areas at Bidford, Alcester, Kineton and Tysoe.
4.13.2 The findings show that the four development examples that are either marginally viable or
unviable become viable through sensitivity testing, by adjusting either the affordable housing
proportion, or the CIL charge. In two cases (4a, large PDL model in Stratford and 9a, PDL
model in Wellesbourne), viability is achieved by reducing CIL to £67/sq.m, and £0
respectively, whilst maintaining affordable housing at 35%. In the two other examples (5a,
Greenfield model Studley and 6a, small PDL model in Shipston), both in lower value areas,
viability is not achieved even with no CIL charge, if affordable is maintained at 35%. In order
to achieve viability on these two sites, the affordable proportion must reduce to 23% and
17% respectively, if CIL remains at £100/sq.m.
4.13.3 An alternative would be to set CIL at £50/sq.m for sites within settlements, targeting
brownfield sites with an inherently higher EUV than greenfield sites, in which case affordable
can increase from 17% to 22% for site 6a at Wellesbourne. The other alternative is to set
zero CIL in some or all parts of the district, and to instead maximise the proportion of
affordable housing, as illustrated in the 4 examples in Table 4.6. This will be a decision for
the council in setting policy imperatives. Since CIL is a statutory requirement, once set, it
has to be levied, and accordingly the council should give very careful consideration to its
objectives and affordable housing targets.
4.13.4 At Studley we would recommend having no CIL because of lower sales values. We have,
however, tested a £50 rate (on a Greenfield site on the edge of Studley) and this would be
viable but would only yield around 29% AH. As shown in Table 4.6, this rises to 33% with
zero CIL.
4.13.5 The critical point to take into account is the spatial circumstances in which CIL becomes
unviable, which is on brownfield sites with a relatively high EUV, as well as in lower value
areas like Studley with a sales value of £2,300/sq.m or less. On that basis we would
recommend one of the following approaches:
4.13.6 Approach 1 – maximise CIL adjacent to Stratford-upon-Avon and Main Rural Centres
(MRCs) except Studley, no CIL within Stratford-upon-Avon or any of the MRCs and maintain
affordable housing at 35% on most sites:
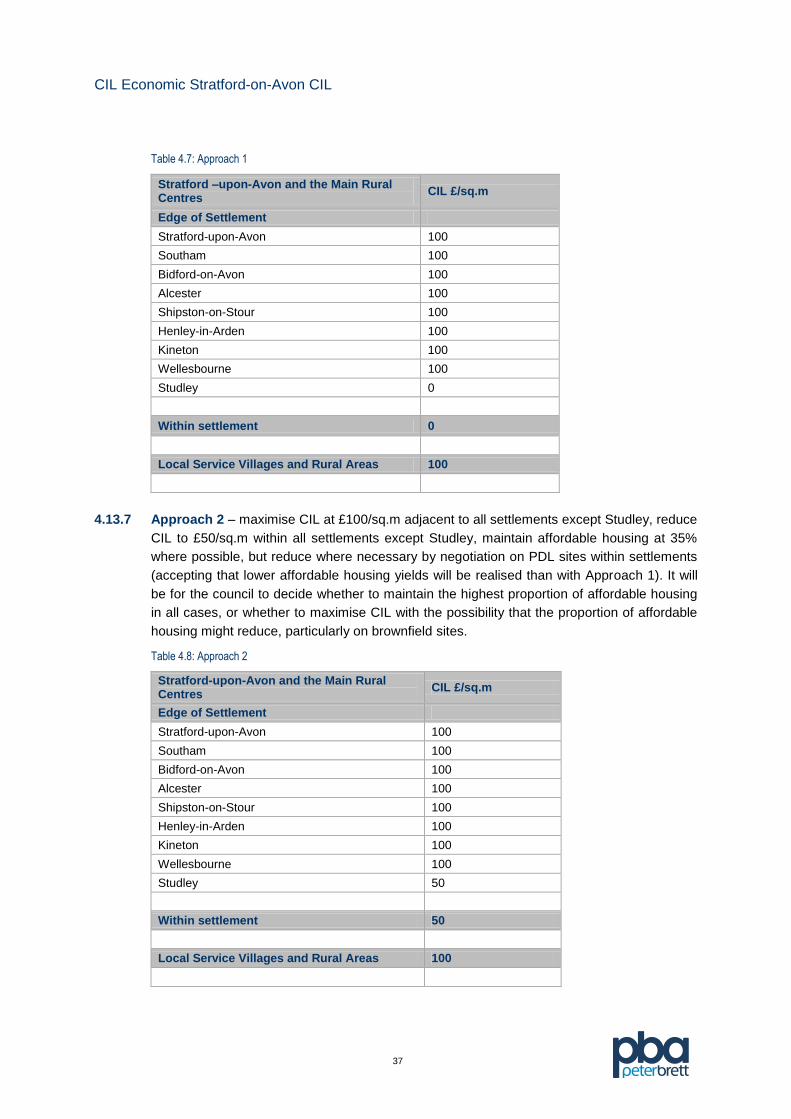
CIL Economic Stratford-on-Avon CIL
37
Table 4.7: Approach 1
Stratford –upon-Avon and the Main Rural Centres
CIL £/sq.m
Edge of Settlement
Stratford-upon-Avon 100
Southam 100
Bidford-on-Avon 100
Alcester 100
Shipston-on-Stour 100
Henley-in-Arden 100
Kineton 100
Wellesbourne 100
Studley 0
Within settlement 0
Local Service Villages and Rural Areas 100
4.13.7 Approach 2 – maximise CIL at £100/sq.m adjacent to all settlements except Studley, reduce
CIL to £50/sq.m within all settlements except Studley, maintain affordable housing at 35%
where possible, but reduce where necessary by negotiation on PDL sites within settlements
(accepting that lower affordable housing yields will be realised than with Approach 1). It will
be for the council to decide whether to maintain the highest proportion of affordable housing
in all cases, or whether to maximise CIL with the possibility that the proportion of affordable
housing might reduce, particularly on brownfield sites.
Table 4.8: Approach 2
Stratford-upon-Avon and the Main Rural Centres
CIL £/sq.m
Edge of Settlement
Stratford-upon-Avon 100
Southam 100
Bidford-on-Avon 100
Alcester 100
Shipston-on-Stour 100
Henley-in-Arden 100
Kineton 100
Wellesbourne 100
Studley 50
Within settlement 50
Local Service Villages and Rural Areas 100
CIL Economic Stratford-on-Avon CIL
38
4.14 Affordable Housing
4.14.1 These viability appraisals have tested the Council’s affordable housing target of 35% of
floorspace in the Draft Core Strategy. In the majority of cases this level of provision has
been found to be viable in combination with a CIL charge of 100 /sq.m.
4.14.2 Difficulties have arisen, however, in securing this level of contribution (35% affordable
housing and a CIL of £100 /sq.m) in areas of lower residential values (post development)
and in areas where the existing use value of the land is high (i.e. pre-development). In these
cases the uplift in value brought about by the development is insufficient to support these
levels of contribution. In these areas the Council must therefore decide between the
following:
Charge £100 /sq.m CIL and be prepared to negotiate a figure below the 35% target for
affordable housing;
Reduce the CIL from £100 to £50 or even £0 and achieve 35% affordable housing in
some instances, accepting that in other cases negotiation down from 35% may still be
required; or
Reduce the affordable housing target (either overall or in some areas).
4.14.3 A key difference between the level of CIL and the affordable housing yield is that the former
is a fixed fee, (from which full exemption is permitted but only in exceptional circumstances)
and the latter is a target to be achieved where possible, with acceptance that some sites will
yield less. The developer can present a site development viability appraisal as a basis for
negotiation to a lower level of affordable housing provision that can be supported by the
development. This is usually part of the discussions around the planning application but can
also be done after the grant of planning permission if market conditions have changed and
the negotiated level of affordable housing provision is preventing the development from
being realised. This has been the subject of recent pronouncements by government.
4.14.4 It should not be confused with setting a lower overall target in Local Plans, though the target
should be realistic in most circumstances.
4.14.5 The evidence shows that 35% affordable housing is viable in most circumstances where a
CIL of £100 /sq.m is suggested. It is also shows that within settlements (Stratford-upon-
Avon and the Main Rural Centres) where CIL is recommended to be reduced to £50 (except
Studley) or even £0, an affordable housing yield of 35% is still a realistic target.
4.15 Design Costs
4.15.1 There is uncertainty as to whether all residential development post 2016 will need to reach
CSH Level 5. If in place this is currently estimated to add around £200 /sq.m to the cost of
residential development.
4.15.2 To reflect our cautionary approach this has been tested in one of the hypothetical residential
development scenarios, that of a 2000 dwelling extension to Stratford-upon-Avon. A large

CIL Economic Stratford-on-Avon CIL
39
development such as this would not be completed prior to 2016 and therefore if new
regulations were brought in much of the development would have to comply with the new
regulation.
4.15.3 The analysis shows that even with these costs post 2016, such a development would be
able to afford a CIL of £100 /sq.m, an affordable housing yield of 35% of floorspace and CSH
Level 5.
4.15.4 Whilst this particular scenario will support policy and CIL aspirations, it is not anticipated that
all scenarios tested would be able to support such additional costs were they to remain at
this level. However, it is apparent that there is uncertainty as to whether the requirements
will be brought in by 2016 and it is expected that over the next few years new technologies
will be introduced to reduce the costs of achieving CSH Level 5. Rather than try to estimate
the implications for development post 2016, the council is advised to re-test the viability of
development and reconsider the CIL charge in 2015 to reflect changes in the market over
the next 3 years, the experience of achieving the affordable housing target under the CIL
regime and the revised cost of achieving CSH Level 5, if new regulations are in place.
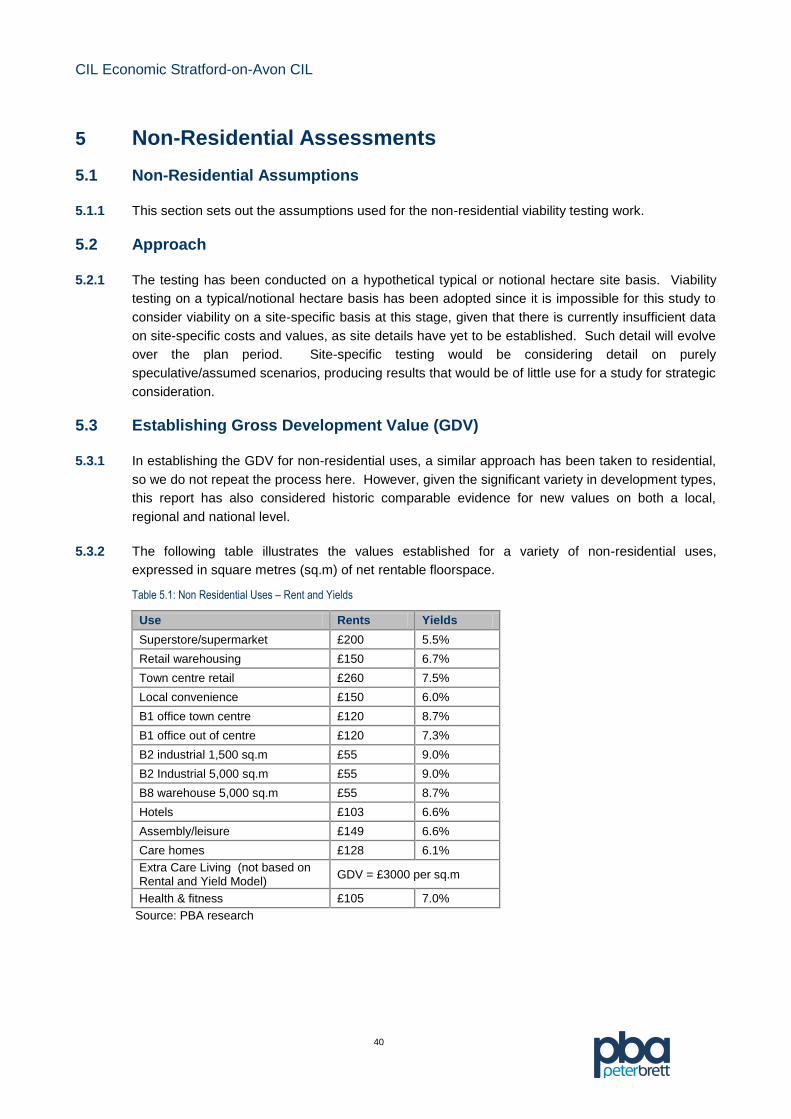
CIL Economic Stratford-on-Avon CIL
40
5 Non-Residential Assessments
5.1 Non-Residential Assumptions
5.1.1 This section sets out the assumptions used for the non-residential viability testing work.
5.2 Approach
5.2.1 The testing has been conducted on a hypothetical typical or notional hectare site basis. Viability
testing on a typical/notional hectare basis has been adopted since it is impossible for this study to
consider viability on a site-specific basis at this stage, given that there is currently insufficient data
on site-specific costs and values, as site details have yet to be established. Such detail will evolve
over the plan period. Site-specific testing would be considering detail on purely
speculative/assumed scenarios, producing results that would be of little use for a study for strategic
consideration.
5.3 Establishing Gross Development Value (GDV)
5.3.1 In establishing the GDV for non-residential uses, a similar approach has been taken to residential,
so we do not repeat the process here. However, given the significant variety in development types,
this report has also considered historic comparable evidence for new values on both a local,
regional and national level.
5.3.2 The following table illustrates the values established for a variety of non-residential uses,
expressed in square metres (sq.m) of net rentable floorspace.
Table 5.1: Non Residential Uses – Rent and Yields
Use Rents Yields
Superstore/supermarket £200 5.5%
Retail warehousing £150 6.7%
Town centre retail £260 7.5%
Local convenience £150 6.0%
B1 office town centre £120 8.7%
B1 office out of centre £120 7.3%
B2 industrial 1,500 sq.m £55 9.0%
B2 Industrial 5,000 sq.m £55 9.0%
B8 warehouse 5,000 sq.m £55 8.7%
Hotels £103 6.6%
Assembly/leisure £149 6.6%
Care homes £128 6.1%
Extra Care Living (not based on Rental and Yield Model)
GDV = £3000 per sq.m
Health & fitness £105 7.0%
Source: PBA research
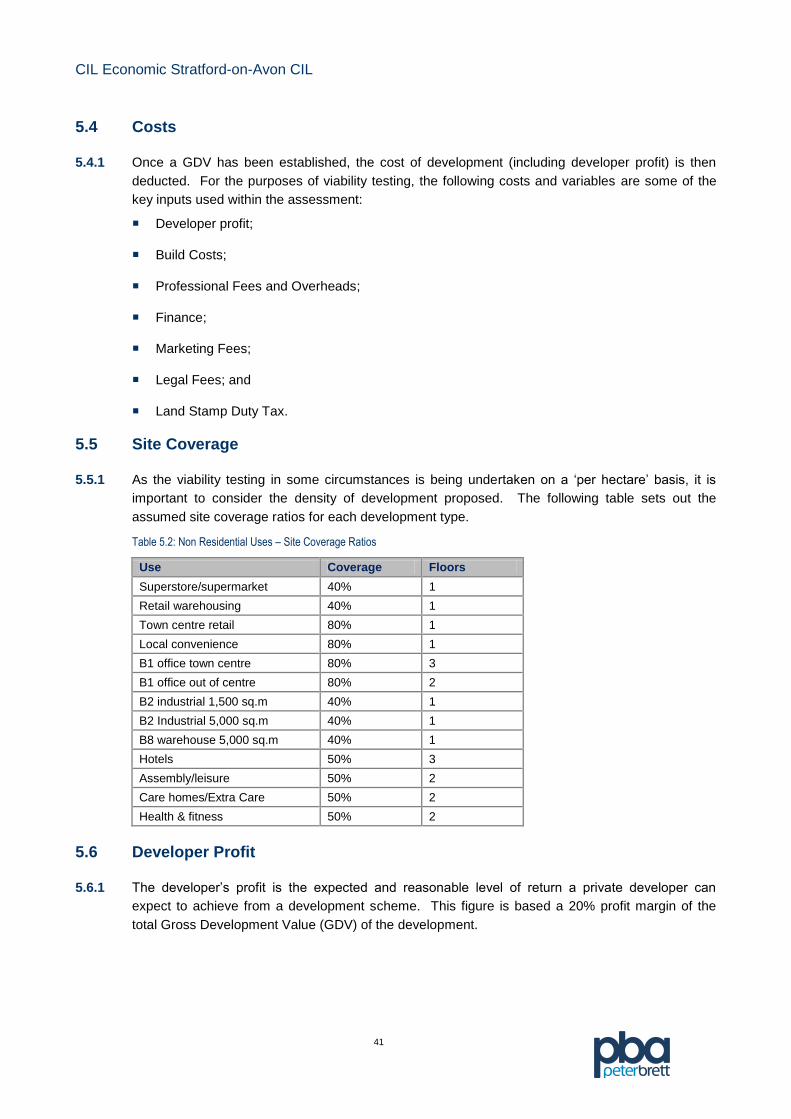
CIL Economic Stratford-on-Avon CIL
41
5.4 Costs
5.4.1 Once a GDV has been established, the cost of development (including developer profit) is then
deducted. For the purposes of viability testing, the following costs and variables are some of the
key inputs used within the assessment:
Developer profit;
Build Costs;
Professional Fees and Overheads;
Finance;
Marketing Fees;
Legal Fees; and
Land Stamp Duty Tax.
5.5 Site Coverage
5.5.1 As the viability testing in some circumstances is being undertaken on a ‘per hectare’ basis, it is
important to consider the density of development proposed. The following table sets out the
assumed site coverage ratios for each development type.
Table 5.2: Non Residential Uses – Site Coverage Ratios
Use Coverage Floors
Superstore/supermarket 40% 1
Retail warehousing 40% 1
Town centre retail 80% 1
Local convenience 80% 1
B1 office town centre 80% 3
B1 office out of centre 80% 2
B2 industrial 1,500 sq.m 40% 1
B2 Industrial 5,000 sq.m 40% 1
B8 warehouse 5,000 sq.m 40% 1
Hotels 50% 3
Assembly/leisure 50% 2
Care homes/Extra Care 50% 2
Health & fitness 50% 2
5.6 Developer Profit
5.6.1 The developer’s profit is the expected and reasonable level of return a private developer can
expect to achieve from a development scheme. This figure is based a 20% profit margin of the
total Gross Development Value (GDV) of the development.

CIL Economic Stratford-on-Avon CIL
42
5.7 Build Costs
5.7.1 Build cost inputs have been established from the RICS Build Cost Information Service
(BCIS) at values set at the time of this study (current build cost values). The build costs are
entered at a pound per square metre rate at the following values shown in the following
table. The build costs adopted are based on the BCIS mean values, indexed separately to
Stratford-on-Avon prices; and then amended following the development industry feedback at
the meeting on 13th July 2012 and subsequent discussion. Also included is an allowance for
external works.
Table 5.3: Non Residential Uses – Build Costs
Use Coverage
Superstore/supermarket £1,100
Retail warehousing £625
Town centre retail £1,200
Local convenience £1,000
B1 office town centre £1,200
B1 office out of centre £1,200
B2 industrial 1,500 sq.m £740
B2 Industrial 5,000 sq.m £560
B8 warehouse 5,000 sq.m £580
Hotels £1,080
Assembly/leisure £1,400
Care homes £1,100
Extra Care Living £1,000
Health & fitness £1,150
Sourced: Spons Architects’ and Builders’ Price Book 2009 and BCIS
5.8 Professional Fees, Overheads
5.8.1 This input incorporates all professional fees associated with the build, including: architect
fees, planner fees, surveyor fees, project manager fees. The professional fees variable is
set at a rate of 12% of build cost.
5.8.2 This variable has been applied to the appraisal as a percentage of the total construction
cost. This figure is established from discussions with both regional and national developers
as well as in house knowledge and experience of industry standards.
5.9 Development Contributions Other than CIL
5.9.1 We have assumed for the purposes of testing that most development will still be expected to
make s106 etc contributions to mitigate direct impacts of the development. These will often
centre on highways improvements but could also relate to design and access. We have used
a combination of looking at past agreements made with the council and utilising our
knowledge of undertaking similar studies elsewhere. Clearly as these types of agreement
are specific to individual developments we have had to take a pragmatic approach in our
generic appraisals. We have basically assumed that higher impact and trip generating uses

CIL Economic Stratford-on-Avon CIL
43
such as supermarkets will generally be expected to contribute the highest amounts, which is
borne out when analysing past agreements. Smaller amounts have been attributed to the
other uses as impact is often less significant and ability to pay i.e. viability often limits the
level sought.
5.10 Finance
5.10.1 A finance rate has been incorporated into the viability testing to reflect the value of money
and the cost of reasonable developer borrowing for the delivery of development. This is
applied to the appraisal as a percentage of the build cost at the rate of 7.5% of total
development costs (inc build costs, external works, professional fees, sales and marketing)
5.11 Marketing Fees
5.11.1 This variable is based on the average cost of marketing for a major new build development
site, incorporating agent fees, ‘on site’ sales costs and general marketing/advertising costs.
The rate of 4% of GDV is applied to the appraisal as a percentage of the GDV and is
established from discussions with developers and agents.
5.12 Acquisition Fees and Land Tax
5.12.1 This input represents the legal costs to a developer in the acquisition of land and the
development process itself. The input is incorporated into the residual value as a
percentage of the residual land value at the rate of 10% of RLV.
5.12.2 A Stamp Duty Land Tax is payable by a developer when acquiring development land. This
factor has been recognised and applied to the residual value as percentage cost against the
residual land value at a rate of 4% (highest rate applicable is used for testing purposes).
5.13 Land for Non-residential Uses
5.13.1 After systematically removing the various costs and variables detailed above, the result is
the residual land value. In order to ascertain the level of likelihood towards delivery and the
level of risk associated with development viability, the resulting residual land values are
measured against a benchmark value which reflects a value range that a landowner would
reasonably be expected to sell/release their land for development.
5.13.2 Establishing the existing use value (EUV) of land and in setting a benchmark at which a
landowner is prepared to sell to enable a consideration of viability can be a complex process.
There are a wide range of site specific variables which effect land sales (e.g. position of the
landowner – are they requiring a quick sale or is it a long term land investment). However,
for a strategic study, where the land values on future individual sites are unknown, a
pragmatic approach is required.
5.13.3 From discussions with agents active in the commercial sector, we have concluded that there
have been very few sales of commercial or employment land in the district over the past 5
years, largely arising from the moribund state of the commercial market caused by the
recession. Land values established before 2007 provide evidence of a range of land values
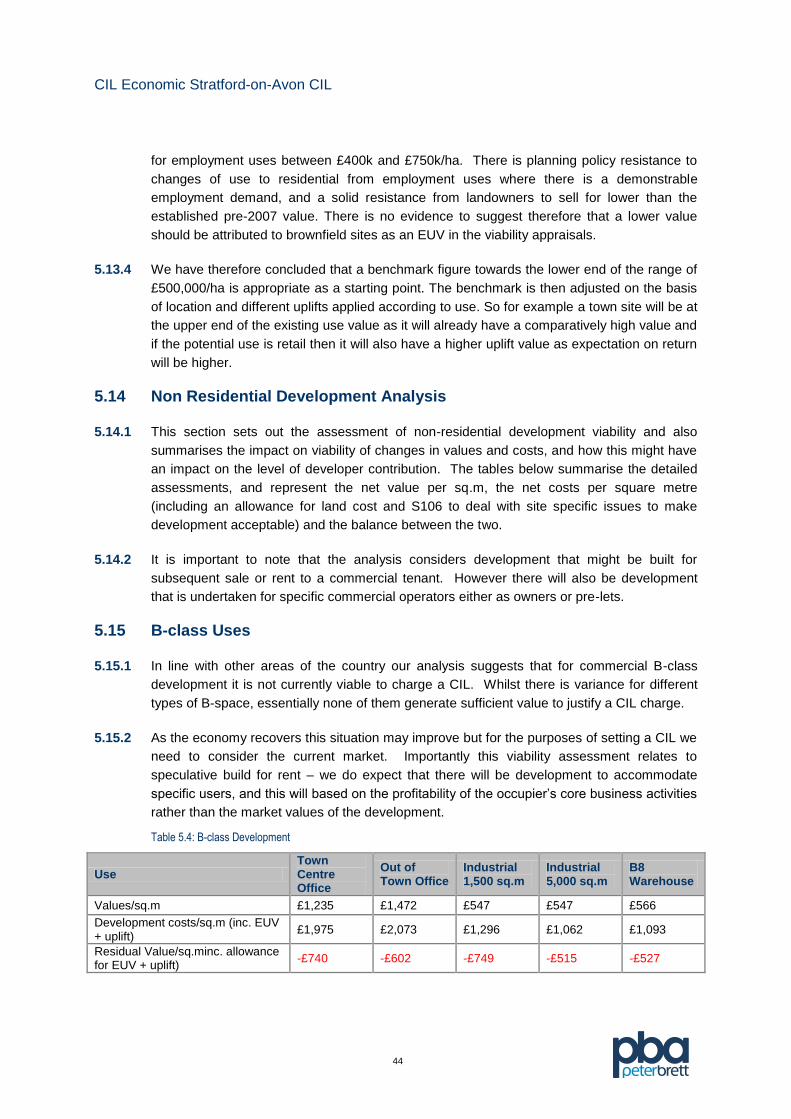
CIL Economic Stratford-on-Avon CIL
44
for employment uses between £400k and £750k/ha. There is planning policy resistance to
changes of use to residential from employment uses where there is a demonstrable
employment demand, and a solid resistance from landowners to sell for lower than the
established pre-2007 value. There is no evidence to suggest therefore that a lower value
should be attributed to brownfield sites as an EUV in the viability appraisals.
5.13.4 We have therefore concluded that a benchmark figure towards the lower end of the range of
£500,000/ha is appropriate as a starting point. The benchmark is then adjusted on the basis
of location and different uplifts applied according to use. So for example a town site will be at
the upper end of the existing use value as it will already have a comparatively high value and
if the potential use is retail then it will also have a higher uplift value as expectation on return
will be higher.
5.14 Non Residential Development Analysis
5.14.1 This section sets out the assessment of non-residential development viability and also
summarises the impact on viability of changes in values and costs, and how this might have
an impact on the level of developer contribution. The tables below summarise the detailed
assessments, and represent the net value per sq.m, the net costs per square metre
(including an allowance for land cost and S106 to deal with site specific issues to make
development acceptable) and the balance between the two.
5.14.2 It is important to note that the analysis considers development that might be built for
subsequent sale or rent to a commercial tenant. However there will also be development
that is undertaken for specific commercial operators either as owners or pre-lets.
5.15 B-class Uses
5.15.1 In line with other areas of the country our analysis suggests that for commercial B-class
development it is not currently viable to charge a CIL. Whilst there is variance for different
types of B-space, essentially none of them generate sufficient value to justify a CIL charge.
5.15.2 As the economy recovers this situation may improve but for the purposes of setting a CIL we
need to consider the current market. Importantly this viability assessment relates to
speculative build for rent – we do expect that there will be development to accommodate
specific users, and this will based on the profitability of the occupier’s core business activities
rather than the market values of the development.
Table 5.4: B-class Development
Use Town Centre Office
Out of Town Office
Industrial 1,500 sq.m
Industrial 5,000 sq.m
B8 Warehouse
Values/sq.m £1,235 £1,472 £547 £547 £566
Development costs/sq.m (inc. EUV + uplift)
£1,975 £2,073 £1,296 £1,062 £1,093
Residual Value/sq.minc. allowance for EUV + uplift)
-£740 -£602 -£749 -£515 -£527
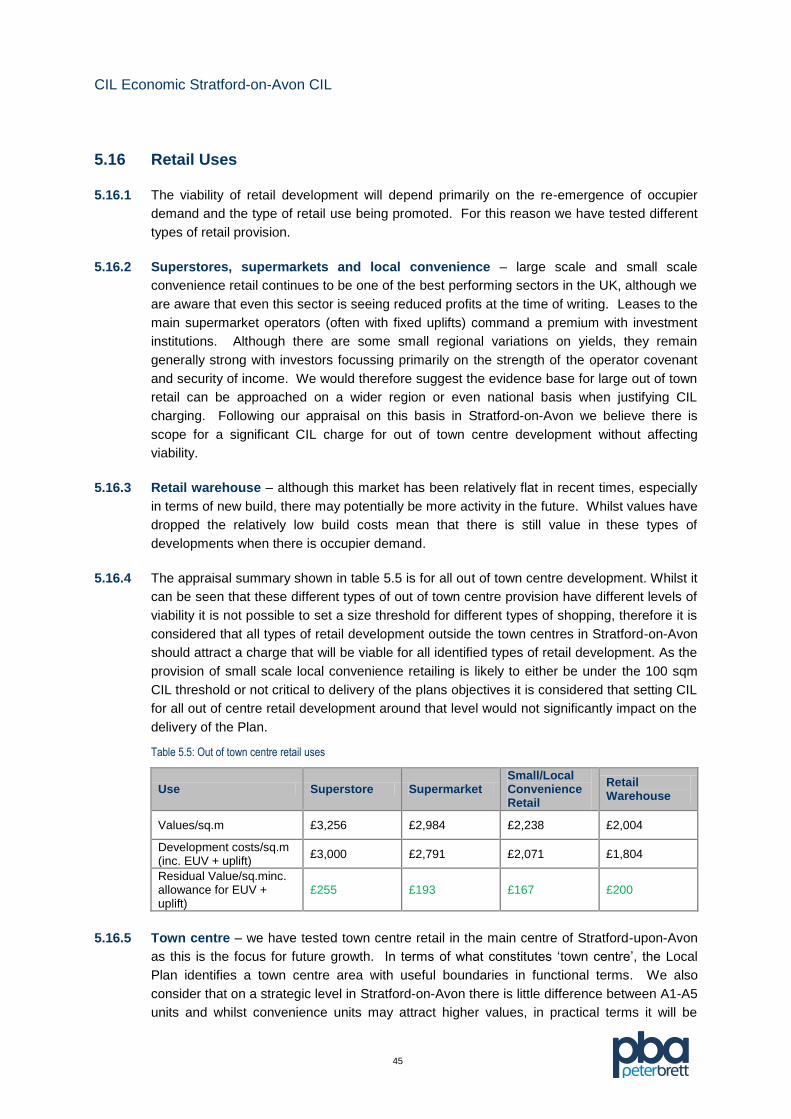
CIL Economic Stratford-on-Avon CIL
45
5.16 Retail Uses
5.16.1 The viability of retail development will depend primarily on the re-emergence of occupier
demand and the type of retail use being promoted. For this reason we have tested different
types of retail provision.
5.16.2 Superstores, supermarkets and local convenience – large scale and small scale
convenience retail continues to be one of the best performing sectors in the UK, although we
are aware that even this sector is seeing reduced profits at the time of writing. Leases to the
main supermarket operators (often with fixed uplifts) command a premium with investment
institutions. Although there are some small regional variations on yields, they remain
generally strong with investors focussing primarily on the strength of the operator covenant
and security of income. We would therefore suggest the evidence base for large out of town
retail can be approached on a wider region or even national basis when justifying CIL
charging. Following our appraisal on this basis in Stratford-on-Avon we believe there is
scope for a significant CIL charge for out of town centre development without affecting
viability.
5.16.3 Retail warehouse – although this market has been relatively flat in recent times, especially
in terms of new build, there may potentially be more activity in the future. Whilst values have
dropped the relatively low build costs mean that there is still value in these types of
developments when there is occupier demand.
5.16.4 The appraisal summary shown in table 5.5 is for all out of town centre development. Whilst it
can be seen that these different types of out of town centre provision have different levels of
viability it is not possible to set a size threshold for different types of shopping, therefore it is
considered that all types of retail development outside the town centres in Stratford-on-Avon
should attract a charge that will be viable for all identified types of retail development. As the
provision of small scale local convenience retailing is likely to either be under the 100 sqm
CIL threshold or not critical to delivery of the plans objectives it is considered that setting CIL
for all out of centre retail development around that level would not significantly impact on the
delivery of the Plan.
Table 5.5: Out of town centre retail uses
Use Superstore Supermarket Small/Local Convenience Retail
Retail Warehouse
Values/sq.m £3,256 £2,984 £2,238 £2,004
Development costs/sq.m (inc. EUV + uplift)
£3,000 £2,791 £2,071 £1,804
Residual Value/sq.minc. allowance for EUV + uplift)
£255 £193 £167 £200
5.16.5 Town centre – we have tested town centre retail in the main centre of Stratford-upon-Avon
as this is the focus for future growth. In terms of what constitutes ‘town centre’, the Local
Plan identifies a town centre area with useful boundaries in functional terms. We also
consider that on a strategic level in Stratford-on-Avon there is little difference between A1-A5
units and whilst convenience units may attract higher values, in practical terms it will be
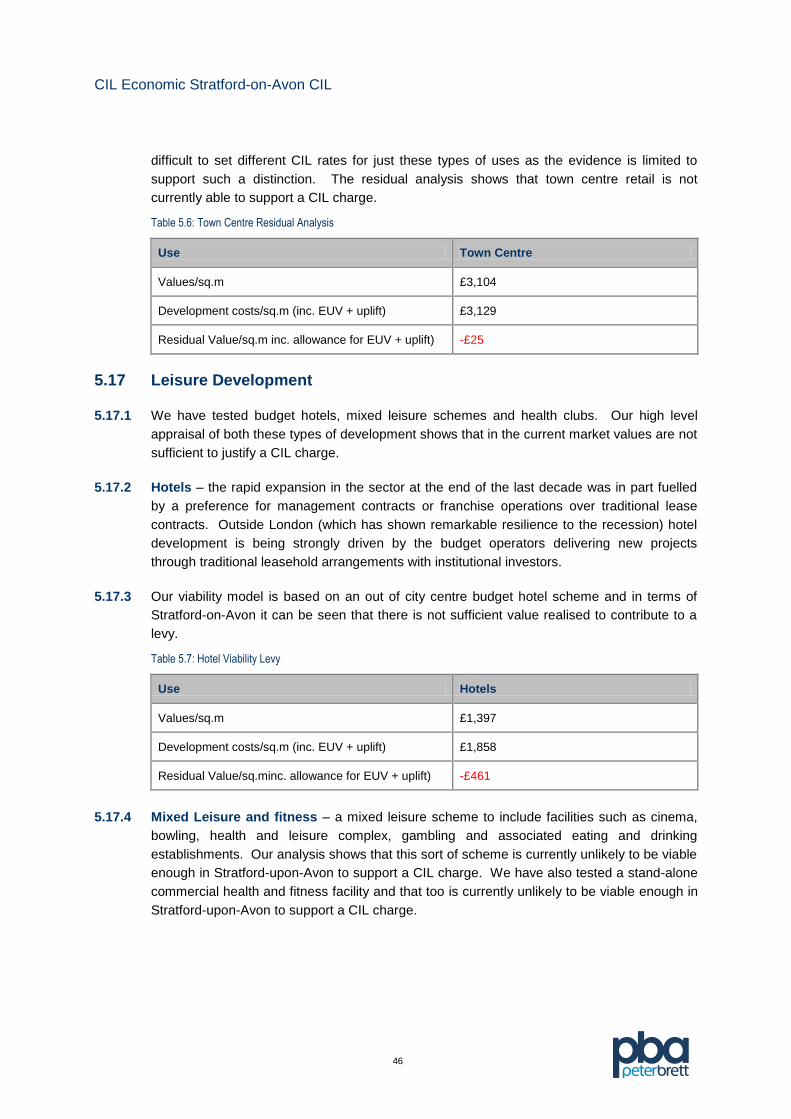
CIL Economic Stratford-on-Avon CIL
46
difficult to set different CIL rates for just these types of uses as the evidence is limited to
support such a distinction. The residual analysis shows that town centre retail is not
currently able to support a CIL charge.
Table 5.6: Town Centre Residual Analysis
Use Town Centre
Values/sq.m £3,104
Development costs/sq.m (inc. EUV + uplift) £3,129
Residual Value/sq.m inc. allowance for EUV + uplift) -£25
5.17 Leisure Development
5.17.1 We have tested budget hotels, mixed leisure schemes and health clubs. Our high level
appraisal of both these types of development shows that in the current market values are not
sufficient to justify a CIL charge.
5.17.2 Hotels – the rapid expansion in the sector at the end of the last decade was in part fuelled
by a preference for management contracts or franchise operations over traditional lease
contracts. Outside London (which has shown remarkable resilience to the recession) hotel
development is being strongly driven by the budget operators delivering new projects
through traditional leasehold arrangements with institutional investors.
5.17.3 Our viability model is based on an out of city centre budget hotel scheme and in terms of
Stratford-on-Avon it can be seen that there is not sufficient value realised to contribute to a
levy.
Table 5.7: Hotel Viability Levy
Use Hotels
Values/sq.m £1,397
Development costs/sq.m (inc. EUV + uplift) £1,858
Residual Value/sq.minc. allowance for EUV + uplift) -£461
5.17.4 Mixed Leisure and fitness – a mixed leisure scheme to include facilities such as cinema,
bowling, health and leisure complex, gambling and associated eating and drinking
establishments. Our analysis shows that this sort of scheme is currently unlikely to be viable
enough in Stratford-upon-Avon to support a CIL charge. We have also tested a stand-alone
commercial health and fitness facility and that too is currently unlikely to be viable enough in
Stratford-upon-Avon to support a CIL charge.
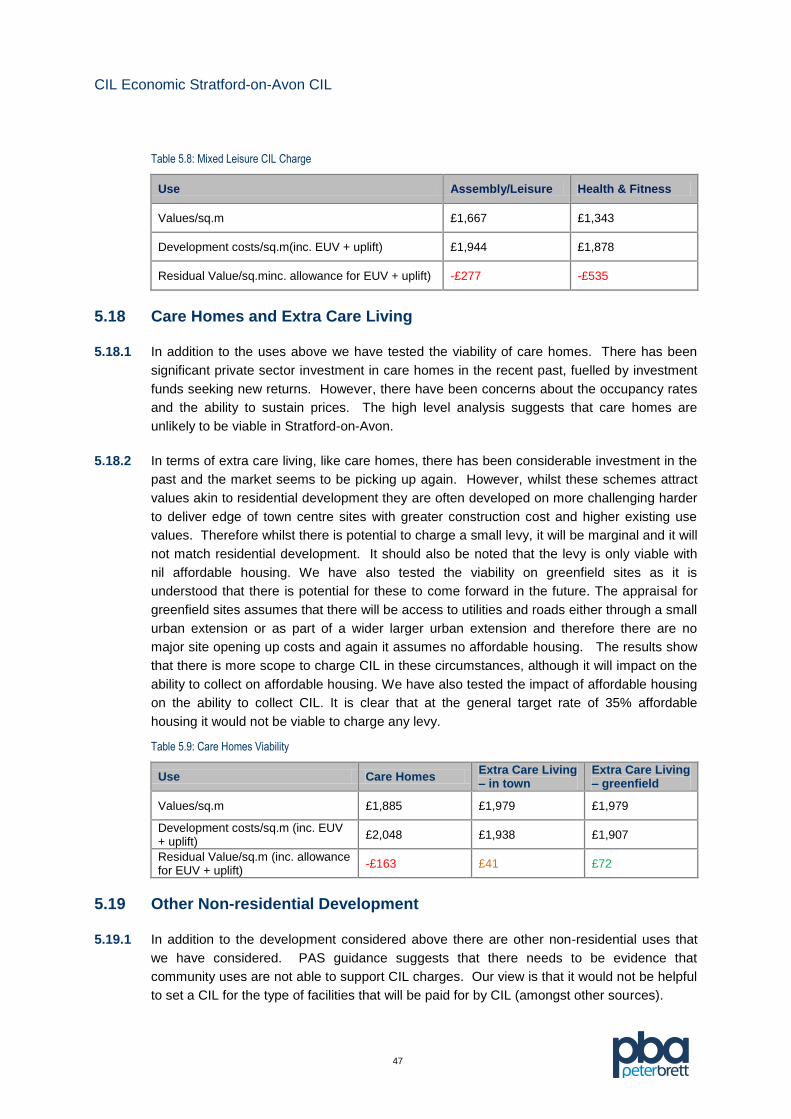
CIL Economic Stratford-on-Avon CIL
47
Table 5.8: Mixed Leisure CIL Charge
Use Assembly/Leisure Health & Fitness
Values/sq.m £1,667 £1,343
Development costs/sq.m(inc. EUV + uplift) £1,944 £1,878
Residual Value/sq.minc. allowance for EUV + uplift) -£277 -£535
5.18 Care Homes and Extra Care Living
5.18.1 In addition to the uses above we have tested the viability of care homes. There has been
significant private sector investment in care homes in the recent past, fuelled by investment
funds seeking new returns. However, there have been concerns about the occupancy rates
and the ability to sustain prices. The high level analysis suggests that care homes are
unlikely to be viable in Stratford-on-Avon.
5.18.2 In terms of extra care living, like care homes, there has been considerable investment in the
past and the market seems to be picking up again. However, whilst these schemes attract
values akin to residential development they are often developed on more challenging harder
to deliver edge of town centre sites with greater construction cost and higher existing use
values. Therefore whilst there is potential to charge a small levy, it will be marginal and it will
not match residential development. It should also be noted that the levy is only viable with
nil affordable housing. We have also tested the viability on greenfield sites as it is
understood that there is potential for these to come forward in the future. The appraisal for
greenfield sites assumes that there will be access to utilities and roads either through a small
urban extension or as part of a wider larger urban extension and therefore there are no
major site opening up costs and again it assumes no affordable housing. The results show
that there is more scope to charge CIL in these circumstances, although it will impact on the
ability to collect on affordable housing. We have also tested the impact of affordable housing
on the ability to collect CIL. It is clear that at the general target rate of 35% affordable
housing it would not be viable to charge any levy.
Table 5.9: Care Homes Viability
Use Care Homes Extra Care Living – in town
Extra Care Living – greenfield
Values/sq.m £1,885 £1,979 £1,979
Development costs/sq.m (inc. EUV + uplift)
£2,048 £1,938 £1,907
Residual Value/sq.m (inc. allowance for EUV + uplift)
-£163 £41 £72
5.19 Other Non-residential Development
5.19.1 In addition to the development considered above there are other non-residential uses that
we have considered. PAS guidance suggests that there needs to be evidence that
community uses are not able to support CIL charges. Our view is that it would not be helpful
to set a CIL for the type of facilities that will be paid for by CIL (amongst other sources).
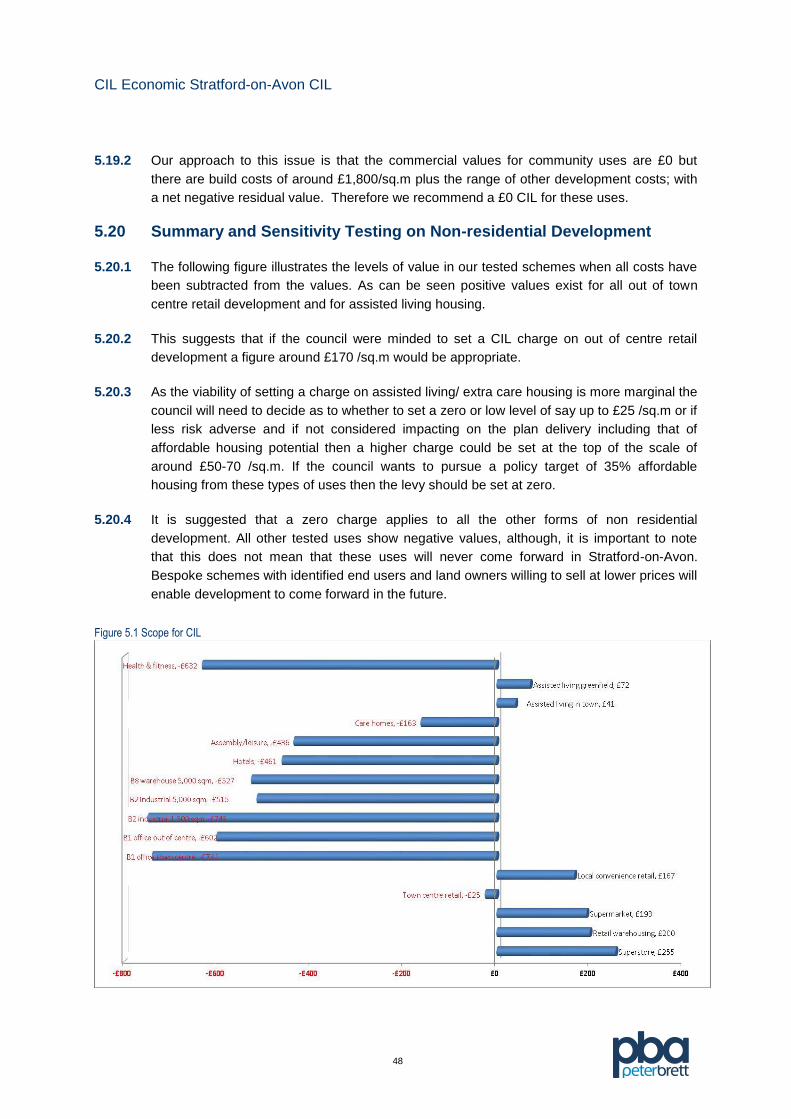
CIL Economic Stratford-on-Avon CIL
48
5.19.2 Our approach to this issue is that the commercial values for community uses are £0 but
there are build costs of around £1,800/sq.m plus the range of other development costs; with
a net negative residual value. Therefore we recommend a £0 CIL for these uses.
5.20 Summary and Sensitivity Testing on Non-residential Development
5.20.1 The following figure illustrates the levels of value in our tested schemes when all costs have
been subtracted from the values. As can be seen positive values exist for all out of town
centre retail development and for assisted living housing.
5.20.2 This suggests that if the council were minded to set a CIL charge on out of centre retail
development a figure around £170 /sq.m would be appropriate.
5.20.3 As the viability of setting a charge on assisted living/ extra care housing is more marginal the
council will need to decide as to whether to set a zero or low level of say up to £25 /sq.m or if
less risk adverse and if not considered impacting on the plan delivery including that of
affordable housing potential then a higher charge could be set at the top of the scale of
around £50-70 /sq.m. If the council wants to pursue a policy target of 35% affordable
housing from these types of uses then the levy should be set at zero.
5.20.4 It is suggested that a zero charge applies to all the other forms of non residential
development. All other tested uses show negative values, although, it is important to note
that this does not mean that these uses will never come forward in Stratford-on-Avon.
Bespoke schemes with identified end users and land owners willing to sell at lower prices will
enable development to come forward in the future.
Figure 5.1 Scope for CIL
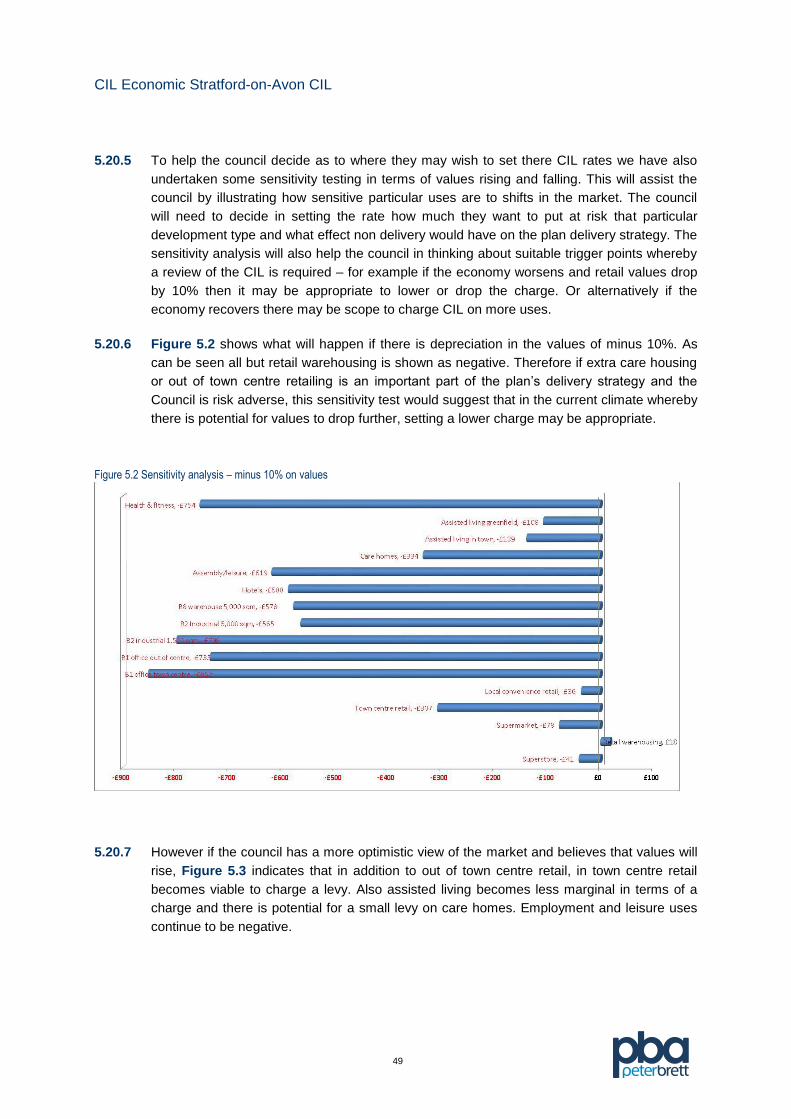
CIL Economic Stratford-on-Avon CIL
49
5.20.5 To help the council decide as to where they may wish to set there CIL rates we have also
undertaken some sensitivity testing in terms of values rising and falling. This will assist the
council by illustrating how sensitive particular uses are to shifts in the market. The council
will need to decide in setting the rate how much they want to put at risk that particular
development type and what effect non delivery would have on the plan delivery strategy. The
sensitivity analysis will also help the council in thinking about suitable trigger points whereby
a review of the CIL is required – for example if the economy worsens and retail values drop
by 10% then it may be appropriate to lower or drop the charge. Or alternatively if the
economy recovers there may be scope to charge CIL on more uses.
5.20.6 Figure 5.2 shows what will happen if there is depreciation in the values of minus 10%. As
can be seen all but retail warehousing is shown as negative. Therefore if extra care housing
or out of town centre retailing is an important part of the plan’s delivery strategy and the
Council is risk adverse, this sensitivity test would suggest that in the current climate whereby
there is potential for values to drop further, setting a lower charge may be appropriate.
Figure 5.2 Sensitivity analysis – minus 10% on values
5.20.7 However if the council has a more optimistic view of the market and believes that values will
rise, Figure 5.3 indicates that in addition to out of town centre retail, in town centre retail
becomes viable to charge a levy. Also assisted living becomes less marginal in terms of a
charge and there is potential for a small levy on care homes. Employment and leisure uses
continue to be negative.
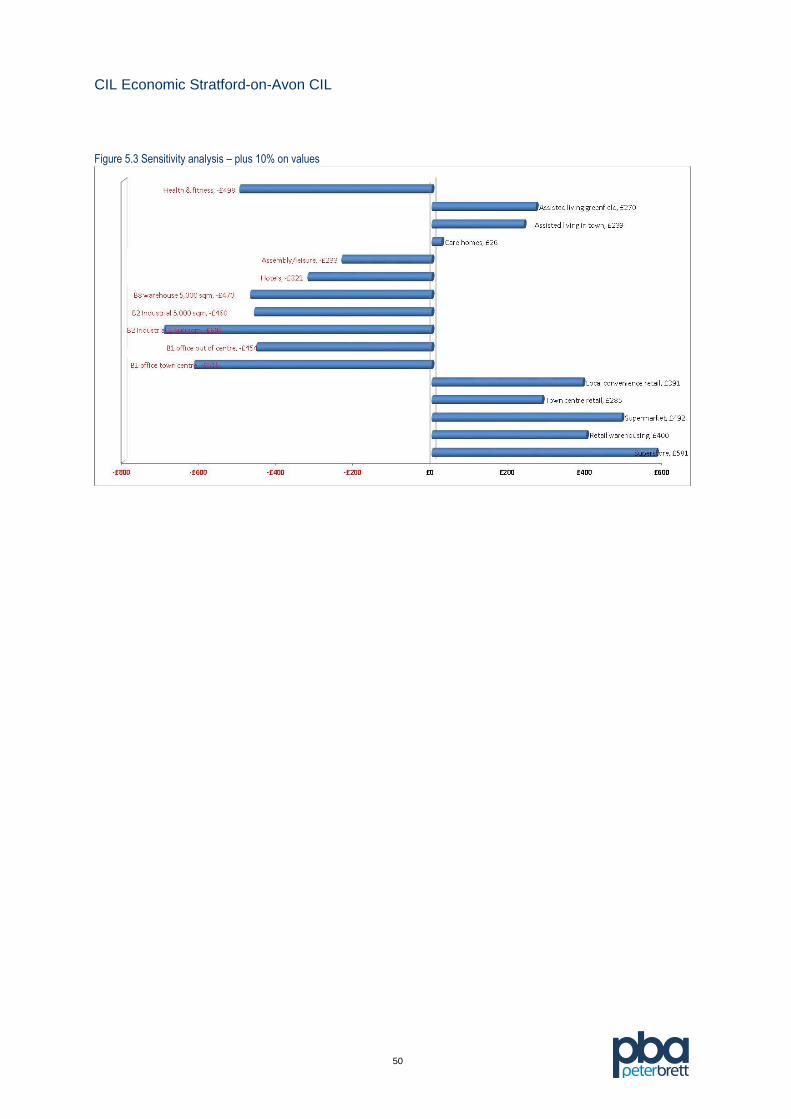
CIL Economic Stratford-on-Avon CIL
50
Figure 5.3 Sensitivity analysis – plus 10% on values

CIL Economic Stratford-on-Avon CIL
51
6 Conclusion
6.1.1 It is possible to set a standard CIL charge for residential development of £100/sq.m on the edge of
Stratford-upon-Avon and all the other settlements except Studley without affecting viability, whilst
maintaining the 35% affordable housing target.
6.1.2 However, if it is intended to maintain the affordable housing share at 35%, it will be necessary to
adopt Approach 1, and treat sites within settlements differently in order to take account of the
impact of higher existing use values have on viability, particularly on brownfield sites. This would
mean zero CIL from all sites within settlements.
6.1.3 The alternative would be to consider Approach 2, which maximises CIL within and adjacent to all
settlements except Studley, whilst maintaining affordable housing at 35% where possible, but being
prepared to reduce the affordable housing proportion where necessary by negotiation on PDL sites
within settlements.
6.1.4 We recognise that the council will need to balance a wide range of priorities. However, maintaining
the proportion of affordable housing in the urban extensions and maintaining the same CIL rate
within the urban areas would have the following benefits:
There be a simple and transparent Charging Schedule - as suggested by the guidance; and
It would help to maximise the amount of un-ring fenced funding available to the council for
infrastructure.
6.1.5 A degree of site by site negotiation on affordable housing will be maintained in a way that the
uniform CIL process does not allow. There is also scope for negotiating on other S106
contributions where appropriate, provided it is supported by development viability.
6.1.6 There is clear evidence to support a charge on out of town centre retail development. Whilst the
evidence suggests that this levy could be varied further to reflect the different types of retail uses, it
is not considered that there is sufficient information on transactions in Stratford-on-Avon to provide
clear evidence at this stage. Therefore a single charge for all out of town centre retail should be
set.
6.1.7 There is some scope to charge a levy for extra care living development. However, this will depend
on the council’s approach to affordable housing requirements from this type of development. If the
council pursues a target of 35% affordable housing from these types of use then the levy should be
set at zero.
6.1.8 For all other types of non-residential development we recommended that a zero charge is applied.
6.1.9 Finally it is important to note that this is a strategic study based on generic and typical sites that
could potentially come forward in Stratford-on-Avon District over the plan period. This study should
not be used as a basis for Section 106 or other such agreements as these should be negotiated on
a site by site basis, reflecting the mitigation of any direct planning impacts that the development
would incur if implemented. Therefore whilst our analysis may show that in broad strategic terms it
is not advised that CIL be charged for certain types of development this does not mean that the

CIL Economic Stratford-on-Avon CIL
52
council should not negotiate on site specific planning contributions, as each site will have unique
individual circumstances and requirements that may require a more detailed appraisal.

CIL Economic Stratford-on-Avon CIL
Appendix 1: Residential Viability Appraisals

% Model No. 1SCHEME LOCATION Stratford-upon-Avon
Local Authority Area
Nr of Beds Nr of Dwgs Flsp per Dwg (sqm)Flsp per Dwg (sq.ft)
8 1 160 50 538
34 2 680 63 677.88
40 3 800 85 914.6
14 4 280 130 1398.8
4 5 80 190 2044.4
100 Total Dwgs 2000 170,440 1,833,934
site area ha & acres 52.6 130
Dwellings per Hectare 38 15
Floorspace coverage sq.m/ha & sq.ft/acre 3240 14110
Net Site Area (Ha) 52.60
Type of Site Greenfield urban extension
Housing Market Share (%) GDV/sqm
Open Market 65% £3,000
Affordable Housing 35% 45%
Code For Sustainable Homes (Cfsh) Level: 3
RESIDUAL LAND VALUATION
Open Market Development Value
Floorspace 110,786 GFA sqm
OM Gross Development Value £3,000 GDV/sqm + 0.0% £332,358,000
Less buyers' sales costs £332,358,000 GDV @ -3.0% -£9,970,740
OM Net Turnover £322,387,260
Affordable Housing Development Value
Floorspace 59,654 GFA sqm
AH Net Receipts £1,350 GDV/sqm + 0.0% £80,532,900
1. Total Development Value £402,920,160
Development Costs
Building costs + externals @ Cfsh level 3 170,440 sqm + £950 per sqm £161,918,000
Contingency £161,918,000 Build cost 5% % £8,095,900
Extra-over CfSH costs 5 CfSH level @ £200 per sqm £34,088,000
Developers' profit (% of OM TO) £322,387,260 OM NR @ 20.0% £64,477,452
Developers' profit on AH Dwgs (8% of AH build cost) £56,671,300 OM NR @ 8.0% £4,533,704
Total Build Cost & Developers Profit £273,113,056
Development costs finance (1 year) £204,101,900 Build Cost @ 8.0% per year £16,328,152
Project/design team fees (% of all construction) £204,101,900 Build Cost @ 12.0% £24,492,228
Total Build Cost, Fees & Developers Profit £313,933,436
CIL on OM floorspace 110,786 sqm @ £100 per sqm £11,078,600
Developer contributions (non-CIL site-based strategic infrastructure - @ £800k/net ha, including S.106 costs - local highway improvements, PoS, etc)
52.60 ha @ £800,000 per ha £42,080,000
Extra over demolition/remediation
Total Additional Development Costs £53,158,600
2. Total Development Costs £367,092,036
Land Value
Interim land value realised at sale £402,920,160 TDV - £367,092,036 TDC £35,828,124
Estimated Purchase costs finance £35,828,124
Actual Purchase costs finance (avoiding circular calc) £30,880,000 Land Value @ 7.0% £2,161,600
Less acquisition fees £30,880,000 Land Value @ 2.0% £617,600
Less Stamp Duty land tax £30,880,000 @ 7.0% £2,161,600
3. Residual Land Value for Site £30,887,324
Residual Land Value per Hectare £587,211
Existing use value (EUV) for agric land £30,000 ha £1,578,000
Value added by consent £30,887,324 EUV - £1,578,000 £29,309,324
Uplift factor 19.57
Minimum Land Value 500,000 26,300,000
Viability Summary
Viability Conclusion
Land value of £30.8m (£587k/net ha), including CSH5 @ £200/sq.m. Viability test against 1) uplift of £29.3m, x 19 from agric value and 11.7 x hope value of £50k/ha. Against Option Agreement Minimum Land Values 52.6 ha x £500k/net ha = £26.3m. Achieved LV = £30.8m or £587k/net ha, therefore passes all 3 Viability Tests. Conclusion - viable, on the basis that site-based infrastructure is set at £800k/net ha, and with CIL at £100/sq.m.
Strategic site at Stratford. Proposal is for 2000 dwellings on 52.6 net ha (38 dph); Affordable 35% of total (700 units), new affordable rent product 20%, 20% intermediate, 60% social rent. Likely market mix to reflect both market for OM & AH (from SHMA) adjusted to tak account of location/type of site: 8% 1-bed, 34% 2-bed, 40% 3-bed, 14% 4-bed, 4% 5-bed. The market appraisal indicates that this mix produces a total of 170,440 sq.m of floorspace. Average sales values based on housing market analysis estimated at £3,000/sq.m. New Build all-in costs estimated at £950/sq.m all in, with additional 5% contingency, on-site infrastructure, plus Code 5 costs at £200/sq.m
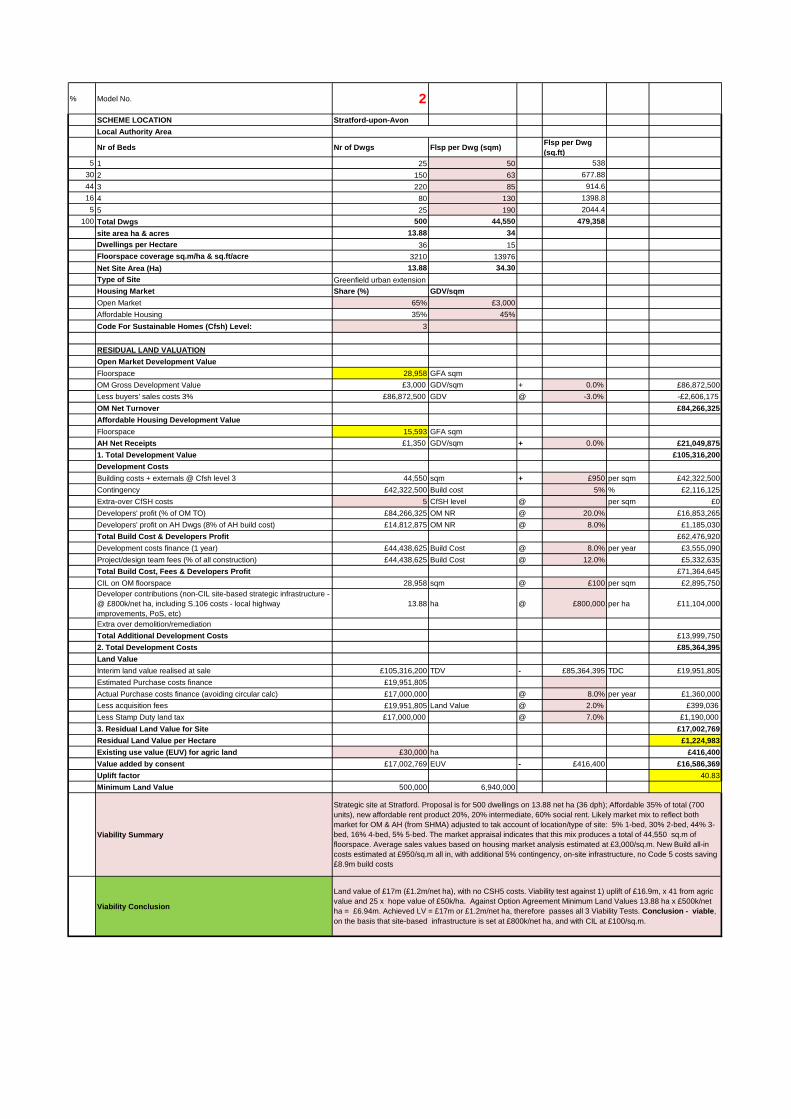
% Model No. 2SCHEME LOCATION Stratford-upon-Avon
Local Authority Area
Nr of Beds Nr of Dwgs Flsp per Dwg (sqm)Flsp per Dwg (sq.ft)
5 1 25 50 538
30 2 150 63 677.88
44 3 220 85 914.6
16 4 80 130 1398.8
5 5 25 190 2044.4
100 Total Dwgs 500 44,550 479,358
site area ha & acres 13.88 34
Dwellings per Hectare 36 15
Floorspace coverage sq.m/ha & sq.ft/acre 3210 13976
Net Site Area (Ha) 13.88 34.30
Type of Site Greenfield urban extension
Housing Market Share (%) GDV/sqm
Open Market 65% £3,000
Affordable Housing 35% 45%
Code For Sustainable Homes (Cfsh) Level: 3
RESIDUAL LAND VALUATION
Open Market Development Value
Floorspace 28,958 GFA sqm
OM Gross Development Value £3,000 GDV/sqm + 0.0% £86,872,500
Less buyers' sales costs 3% £86,872,500 GDV @ -3.0% -£2,606,175
OM Net Turnover £84,266,325
Affordable Housing Development Value
Floorspace 15,593 GFA sqm
AH Net Receipts £1,350 GDV/sqm + 0.0% £21,049,875
1. Total Development Value £105,316,200
Development Costs
Building costs + externals @ Cfsh level 3 44,550 sqm + £950 per sqm £42,322,500
Contingency £42,322,500 Build cost 5% % £2,116,125
Extra-over CfSH costs 5 CfSH level @ per sqm £0
Developers' profit (% of OM TO) £84,266,325 OM NR @ 20.0% £16,853,265
Developers' profit on AH Dwgs (8% of AH build cost) £14,812,875 OM NR @ 8.0% £1,185,030
Total Build Cost & Developers Profit £62,476,920
Development costs finance (1 year) £44,438,625 Build Cost @ 8.0% per year £3,555,090
Project/design team fees (% of all construction) £44,438,625 Build Cost @ 12.0% £5,332,635
Total Build Cost, Fees & Developers Profit £71,364,645
CIL on OM floorspace 28,958 sqm @ £100 per sqm £2,895,750Developer contributions (non-CIL site-based strategic infrastructure - @ £800k/net ha, including S.106 costs - local highway improvements, PoS, etc)
13.88 ha @ £800,000 per ha £11,104,000
Extra over demolition/remediation
Total Additional Development Costs £13,999,750
2. Total Development Costs £85,364,395
Land Value
Interim land value realised at sale £105,316,200 TDV - £85,364,395 TDC £19,951,805
Estimated Purchase costs finance £19,951,805
Actual Purchase costs finance (avoiding circular calc) £17,000,000 @ 8.0% per year £1,360,000
Less acquisition fees £19,951,805 Land Value @ 2.0% £399,036
Less Stamp Duty land tax £17,000,000 @ 7.0% £1,190,000
3. Residual Land Value for Site £17,002,769
Residual Land Value per Hectare £1,224,983
Existing use value (EUV) for agric land £30,000 ha £416,400
Value added by consent £17,002,769 EUV - £416,400 £16,586,369
Uplift factor 40.83
Minimum Land Value 500,000 6,940,000
Viability Summary
Viability Conclusion
Strategic site at Stratford. Proposal is for 500 dwellings on 13.88 net ha (36 dph); Affordable 35% of total (700 units), new affordable rent product 20%, 20% intermediate, 60% social rent. Likely market mix to reflect both market for OM & AH (from SHMA) adjusted to tak account of location/type of site: 5% 1-bed, 30% 2-bed, 44% 3-bed, 16% 4-bed, 5% 5-bed. The market appraisal indicates that this mix produces a total of 44,550 sq.m of floorspace. Average sales values based on housing market analysis estimated at £3,000/sq.m. New Build all-in costs estimated at £950/sq.m all in, with additional 5% contingency, on-site infrastructure, no Code 5 costs saving £8.9m build costs
Land value of £17m (£1.2m/net ha), with no CSH5 costs. Viability test against 1) uplift of £16.9m, x 41 from agric value and 25 x hope value of £50k/ha. Against Option Agreement Minimum Land Values 13.88 ha x £500k/net ha = £6.94m. Achieved LV = £17m or £1.2m/net ha, therefore passes all 3 Viability Tests. Conclusion - viable, on the basis that site-based infrastructure is set at £800k/net ha, and with CIL at £100/sq.m.
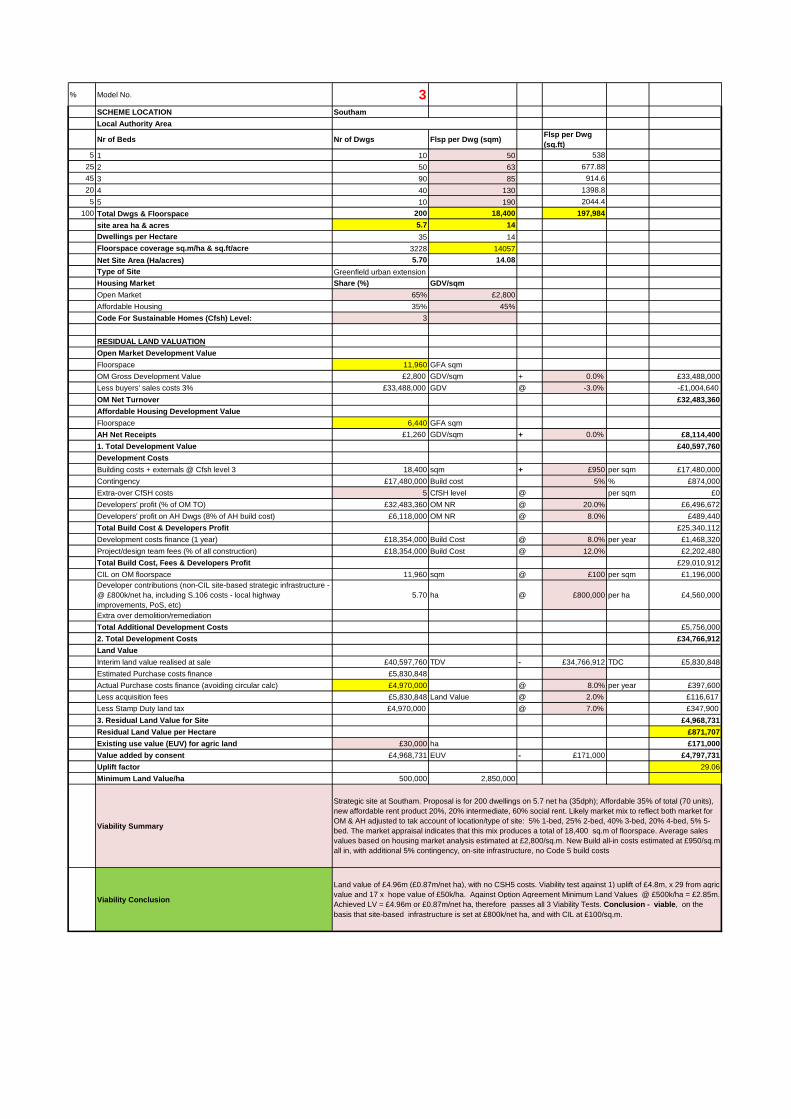
% Model No. 3SCHEME LOCATION Southam
Local Authority Area
Nr of Beds Nr of Dwgs Flsp per Dwg (sqm)Flsp per Dwg (sq.ft)
5 1 10 50 538
25 2 50 63 677.88
45 3 90 85 914.6
20 4 40 130 1398.8
5 5 10 190 2044.4
100 Total Dwgs & Floorspace 200 18,400 197,984
site area ha & acres 5.7 14
Dwellings per Hectare 35 14
Floorspace coverage sq.m/ha & sq.ft/acre 3228 14057
Net Site Area (Ha/acres) 5.70 14.08
Type of Site Greenfield urban extension
Housing Market Share (%) GDV/sqm
Open Market 65% £2,800
Affordable Housing 35% 45%
Code For Sustainable Homes (Cfsh) Level: 3
RESIDUAL LAND VALUATION
Open Market Development Value
Floorspace 11,960 GFA sqm
OM Gross Development Value £2,800 GDV/sqm + 0.0% £33,488,000
Less buyers' sales costs 3% £33,488,000 GDV @ -3.0% -£1,004,640
OM Net Turnover £32,483,360
Affordable Housing Development Value
Floorspace 6,440 GFA sqm
AH Net Receipts £1,260 GDV/sqm + 0.0% £8,114,400
1. Total Development Value £40,597,760
Development Costs
Building costs + externals @ Cfsh level 3 18,400 sqm + £950 per sqm £17,480,000
Contingency £17,480,000 Build cost 5% % £874,000
Extra-over CfSH costs 5 CfSH level @ per sqm £0
Developers' profit (% of OM TO) £32,483,360 OM NR @ 20.0% £6,496,672
Developers' profit on AH Dwgs (8% of AH build cost) £6,118,000 OM NR @ 8.0% £489,440
Total Build Cost & Developers Profit £25,340,112
Development costs finance (1 year) £18,354,000 Build Cost @ 8.0% per year £1,468,320
Project/design team fees (% of all construction) £18,354,000 Build Cost @ 12.0% £2,202,480
Total Build Cost, Fees & Developers Profit £29,010,912
CIL on OM floorspace 11,960 sqm @ £100 per sqm £1,196,000Developer contributions (non-CIL site-based strategic infrastructure - @ £800k/net ha, including S.106 costs - local highway improvements, PoS, etc)
5.70 ha @ £800,000 per ha £4,560,000
Extra over demolition/remediation
Total Additional Development Costs £5,756,000
2. Total Development Costs £34,766,912
Land Value
Interim land value realised at sale £40,597,760 TDV - £34,766,912 TDC £5,830,848
Estimated Purchase costs finance £5,830,848
Actual Purchase costs finance (avoiding circular calc) £4,970,000 @ 8.0% per year £397,600
Less acquisition fees £5,830,848 Land Value @ 2.0% £116,617
Less Stamp Duty land tax £4,970,000 @ 7.0% £347,900
3. Residual Land Value for Site £4,968,731
Residual Land Value per Hectare £871,707
Existing use value (EUV) for agric land £30,000 ha £171,000
Value added by consent £4,968,731 EUV - £171,000 £4,797,731
Uplift factor 29.06
Minimum Land Value/ha 500,000 2,850,000
Viability Summary
Viability Conclusion
Strategic site at Southam. Proposal is for 200 dwellings on 5.7 net ha (35dph); Affordable 35% of total (70 units), new affordable rent product 20%, 20% intermediate, 60% social rent. Likely market mix to reflect both market for OM & AH adjusted to tak account of location/type of site: 5% 1-bed, 25% 2-bed, 40% 3-bed, 20% 4-bed, 5% 5-bed. The market appraisal indicates that this mix produces a total of 18,400 sq.m of floorspace. Average sales values based on housing market analysis estimated at £2,800/sq.m. New Build all-in costs estimated at £950/sq.m all in, with additional 5% contingency, on-site infrastructure, no Code 5 build costs
Land value of £4.96m (£0.87m/net ha), with no CSH5 costs. Viability test against 1) uplift of £4.8m, x 29 from agric value and 17 x hope value of £50k/ha. Against Option Agreement Minimum Land Values @ £500k/ha = £2.85m. Achieved LV = £4.96m or £0.87m/net ha, therefore passes all 3 Viability Tests. Conclusion - viable, on the basis that site-based infrastructure is set at £800k/net ha, and with CIL at £100/sq.m.
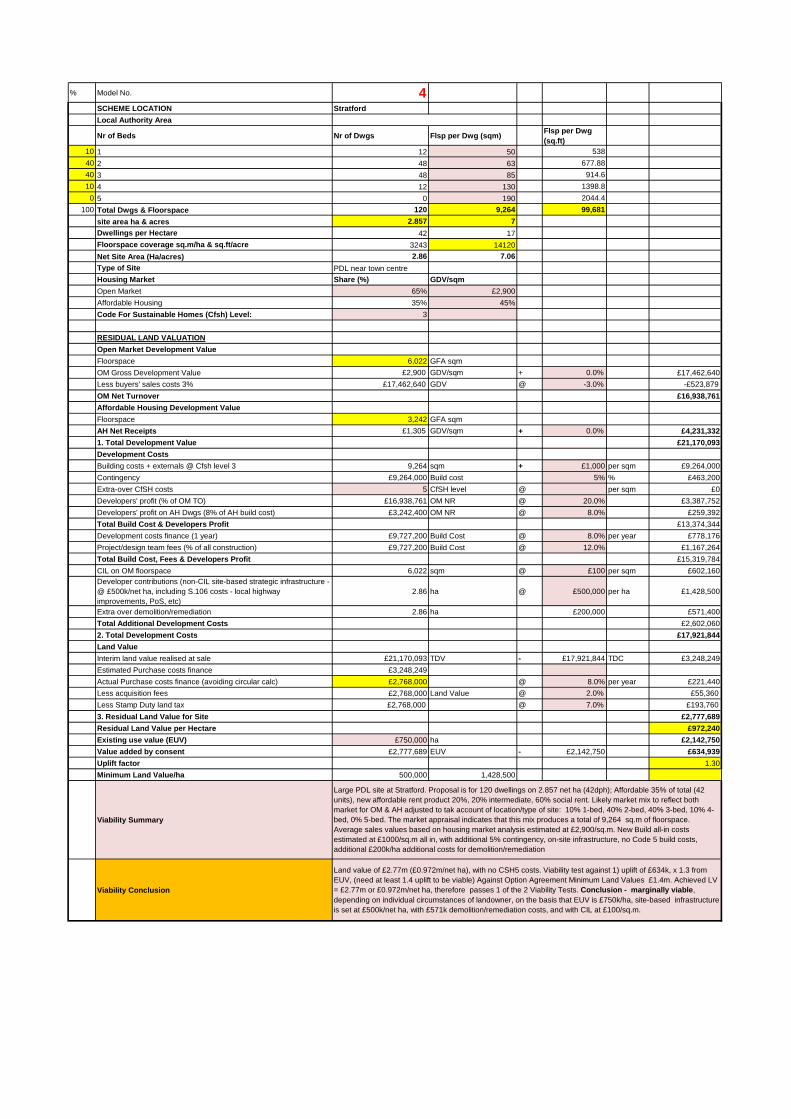
% Model No. 4SCHEME LOCATION Stratford
Local Authority Area
Nr of Beds Nr of Dwgs Flsp per Dwg (sqm)Flsp per Dwg (sq.ft)
10 1 12 50 538
40 2 48 63 677.88
40 3 48 85 914.6
10 4 12 130 1398.8
0 5 0 190 2044.4
100 Total Dwgs & Floorspace 120 9,264 99,681
site area ha & acres 2.857 7
Dwellings per Hectare 42 17
Floorspace coverage sq.m/ha & sq.ft/acre 3243 14120
Net Site Area (Ha/acres) 2.86 7.06
Type of Site PDL near town centre
Housing Market Share (%) GDV/sqm
Open Market 65% £2,900
Affordable Housing 35% 45%
Code For Sustainable Homes (Cfsh) Level: 3
RESIDUAL LAND VALUATION
Open Market Development Value
Floorspace 6,022 GFA sqm
OM Gross Development Value £2,900 GDV/sqm + 0.0% £17,462,640
Less buyers' sales costs 3% £17,462,640 GDV @ -3.0% -£523,879
OM Net Turnover £16,938,761
Affordable Housing Development Value
Floorspace 3,242 GFA sqm
AH Net Receipts £1,305 GDV/sqm + 0.0% £4,231,332
1. Total Development Value £21,170,093
Development Costs
Building costs + externals @ Cfsh level 3 9,264 sqm + £1,000 per sqm £9,264,000
Contingency £9,264,000 Build cost 5% % £463,200
Extra-over CfSH costs 5 CfSH level @ per sqm £0
Developers' profit (% of OM TO) £16,938,761 OM NR @ 20.0% £3,387,752
Developers' profit on AH Dwgs (8% of AH build cost) £3,242,400 OM NR @ 8.0% £259,392
Total Build Cost & Developers Profit £13,374,344
Development costs finance (1 year) £9,727,200 Build Cost @ 8.0% per year £778,176
Project/design team fees (% of all construction) £9,727,200 Build Cost @ 12.0% £1,167,264
Total Build Cost, Fees & Developers Profit £15,319,784
CIL on OM floorspace 6,022 sqm @ £100 per sqm £602,160Developer contributions (non-CIL site-based strategic infrastructure - @ £500k/net ha, including S.106 costs - local highway improvements, PoS, etc)
2.86 ha @ £500,000 per ha £1,428,500
Extra over demolition/remediation 2.86 ha £200,000 £571,400
Total Additional Development Costs £2,602,060
2. Total Development Costs £17,921,844
Land Value
Interim land value realised at sale £21,170,093 TDV - £17,921,844 TDC £3,248,249
Estimated Purchase costs finance £3,248,249
Actual Purchase costs finance (avoiding circular calc) £2,768,000 @ 8.0% per year £221,440
Less acquisition fees £2,768,000 Land Value @ 2.0% £55,360
Less Stamp Duty land tax £2,768,000 @ 7.0% £193,760
3. Residual Land Value for Site £2,777,689
Residual Land Value per Hectare £972,240
Existing use value (EUV) £750,000 ha £2,142,750
Value added by consent £2,777,689 EUV - £2,142,750 £634,939
Uplift factor 1.30
Minimum Land Value/ha 500,000 1,428,500
Viability Summary
Viability Conclusion
Large PDL site at Stratford. Proposal is for 120 dwellings on 2.857 net ha (42dph); Affordable 35% of total (42 units), new affordable rent product 20%, 20% intermediate, 60% social rent. Likely market mix to reflect both market for OM & AH adjusted to tak account of location/type of site: 10% 1-bed, 40% 2-bed, 40% 3-bed, 10% 4-bed, 0% 5-bed. The market appraisal indicates that this mix produces a total of 9,264 sq.m of floorspace. Average sales values based on housing market analysis estimated at £2,900/sq.m. New Build all-in costs estimated at £1000/sq.m all in, with additional 5% contingency, on-site infrastructure, no Code 5 build costs, additional £200k/ha additional costs for demolition/remediation
Land value of £2.77m (£0.972m/net ha), with no CSH5 costs. Viability test against 1) uplift of £634k, x 1.3 from EUV, (need at least 1.4 uplift to be viable) Against Option Agreement Minimum Land Values £1.4m. Achieved LV = £2.77m or £0.972m/net ha, therefore passes 1 of the 2 Viability Tests. Conclusion - marginally viable, depending on individual circumstances of landowner, on the basis that EUV is £750k/ha, site-based infrastructure is set at £500k/net ha, with £571k demolition/remediation costs, and with CIL at £100/sq.m.
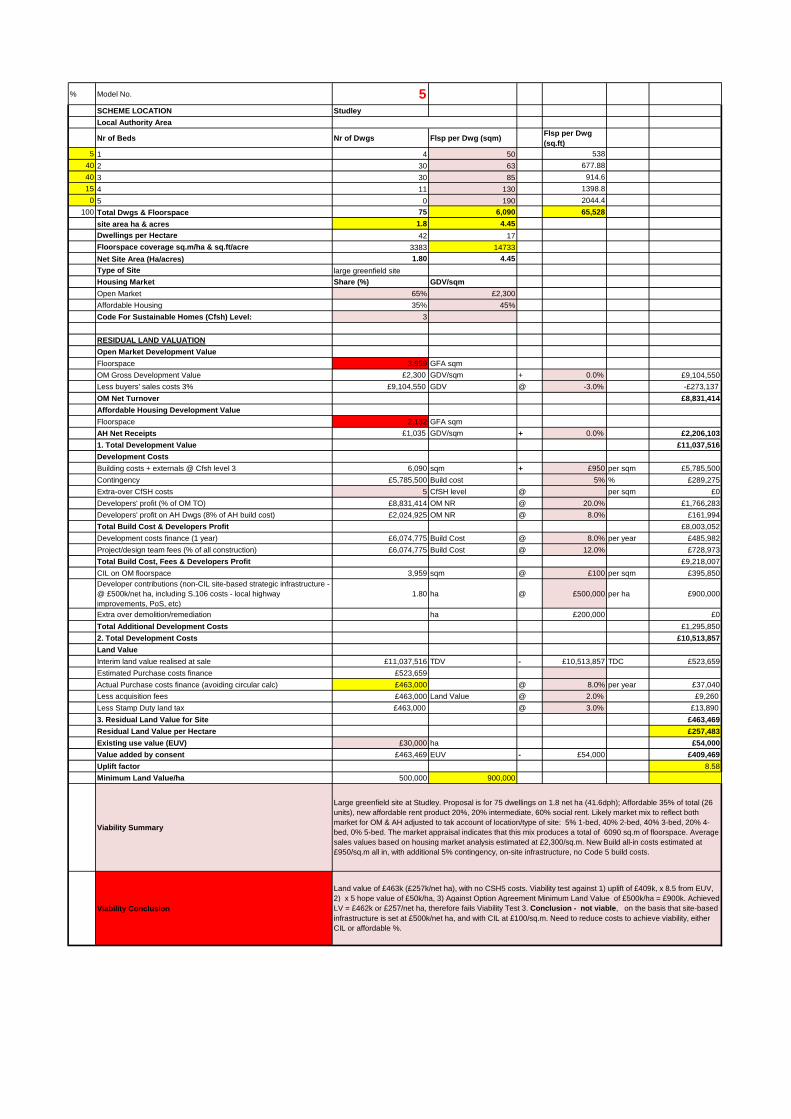
% Model No. 5SCHEME LOCATION Studley
Local Authority Area
Nr of Beds Nr of Dwgs Flsp per Dwg (sqm)Flsp per Dwg (sq.ft)
5 1 4 50 538
40 2 30 63 677.88
40 3 30 85 914.6
15 4 11 130 1398.8
0 5 0 190 2044.4
100 Total Dwgs & Floorspace 75 6,090 65,528
site area ha & acres 1.8 4.45
Dwellings per Hectare 42 17
Floorspace coverage sq.m/ha & sq.ft/acre 3383 14733
Net Site Area (Ha/acres) 1.80 4.45
Type of Site large greenfield site
Housing Market Share (%) GDV/sqm
Open Market 65% £2,300
Affordable Housing 35% 45%
Code For Sustainable Homes (Cfsh) Level: 3
RESIDUAL LAND VALUATION
Open Market Development Value
Floorspace 3,959 GFA sqm
OM Gross Development Value £2,300 GDV/sqm + 0.0% £9,104,550
Less buyers' sales costs 3% £9,104,550 GDV @ -3.0% -£273,137
OM Net Turnover £8,831,414
Affordable Housing Development Value
Floorspace 2,132 GFA sqm
AH Net Receipts £1,035 GDV/sqm + 0.0% £2,206,103
1. Total Development Value £11,037,516
Development Costs
Building costs + externals @ Cfsh level 3 6,090 sqm + £950 per sqm £5,785,500
Contingency £5,785,500 Build cost 5% % £289,275
Extra-over CfSH costs 5 CfSH level @ per sqm £0
Developers' profit (% of OM TO) £8,831,414 OM NR @ 20.0% £1,766,283
Developers' profit on AH Dwgs (8% of AH build cost) £2,024,925 OM NR @ 8.0% £161,994
Total Build Cost & Developers Profit £8,003,052
Development costs finance (1 year) £6,074,775 Build Cost @ 8.0% per year £485,982
Project/design team fees (% of all construction) £6,074,775 Build Cost @ 12.0% £728,973
Total Build Cost, Fees & Developers Profit £9,218,007
CIL on OM floorspace 3,959 sqm @ £100 per sqm £395,850Developer contributions (non-CIL site-based strategic infrastructure - @ £500k/net ha, including S.106 costs - local highway improvements, PoS, etc)
1.80 ha @ £500,000 per ha £900,000
Extra over demolition/remediation ha £200,000 £0
Total Additional Development Costs £1,295,850
2. Total Development Costs £10,513,857
Land Value
Interim land value realised at sale £11,037,516 TDV - £10,513,857 TDC £523,659
Estimated Purchase costs finance £523,659
Actual Purchase costs finance (avoiding circular calc) £463,000 @ 8.0% per year £37,040
Less acquisition fees £463,000 Land Value @ 2.0% £9,260
Less Stamp Duty land tax £463,000 @ 3.0% £13,890
3. Residual Land Value for Site £463,469
Residual Land Value per Hectare £257,483
Existing use value (EUV) £30,000 ha £54,000
Value added by consent £463,469 EUV - £54,000 £409,469
Uplift factor 8.58
Minimum Land Value/ha 500,000 900,000
Viability Summary
Viability Conclusion
Large greenfield site at Studley. Proposal is for 75 dwellings on 1.8 net ha (41.6dph); Affordable 35% of total (26 units), new affordable rent product 20%, 20% intermediate, 60% social rent. Likely market mix to reflect both market for OM & AH adjusted to tak account of location/type of site: 5% 1-bed, 40% 2-bed, 40% 3-bed, 20% 4-bed, 0% 5-bed. The market appraisal indicates that this mix produces a total of 6090 sq.m of floorspace. Average sales values based on housing market analysis estimated at £2,300/sq.m. New Build all-in costs estimated at £950/sq.m all in, with additional 5% contingency, on-site infrastructure, no Code 5 build costs.
Land value of £463k (£257k/net ha), with no CSH5 costs. Viability test against 1) uplift of £409k, x 8.5 from EUV, 2) x 5 hope value of £50k/ha, 3) Against Option Agreement Minimum Land Value of £500k/ha = £900k. Achieved LV = £462k or £257/net ha, therefore fails Viability Test 3. Conclusion - not viable, on the basis that site-based infrastructure is set at £500k/net ha, and with CIL at £100/sq.m. Need to reduce costs to achieve viability, either CIL or affordable %.

% Model No. 6SCHEME LOCATION Wellsbourne
Local Authority Area
Nr of Beds Nr of Dwgs Flsp per Dwg (sqm)Flsp per Dwg (sq.ft)
8 1 2 50 538
36 2 11 63 677.88
42 3 13 85 914.6
14 4 4 130 1398.8
0 5 0 190 2044.4
100 Total Dwgs & Floorspace 30 2,417 26,011
site area ha & acres 0.75 1.85
Dwellings per Hectare 40 16
Floorspace coverage sq.m/ha & sq.ft/acre 3223 14035
Net Site Area (Ha/acres) 0.75 1.85
Type of Site PDL
Housing Market Share (%) GDV/sqm
Open Market 65% £2,600
Affordable Housing 35% 45%
Code For Sustainable Homes (Cfsh) Level: 3
RESIDUAL LAND VALUATION
Open Market Development Value
Floorspace 1,571 GFA sqm
OM Gross Development Value £2,600 GDV/sqm + 0.0% £4,085,406
Less buyers' sales costs 3% £4,085,406 GDV @ -3.0% -£122,562
OM Net Turnover £3,962,844
Affordable Housing Development Value
Floorspace 846 GFA sqm
AH Net Receipts £1,170 GDV/sqm + 0.0% £989,925
1. Total Development Value £4,952,769
Development Costs
Building costs + externals @ Cfsh level 3 2,417 sqm + £1,000 per sqm £2,417,400
Contingency £2,417,400 Build cost 5% % £120,870
Extra-over CfSH costs 5 CfSH level @ per sqm £0
Developers' profit (% of OM TO) £3,962,844 OM NR @ 20.0% £792,569
Developers' profit on AH Dwgs (8% of AH build cost) £846,090 OM NR @ 8.0% £67,687
Total Build Cost & Developers Profit £3,398,526
Development costs finance (1 year) £2,538,270 Build Cost @ 8.0% per year £203,062
Project/design team fees (% of all construction) £2,538,270 Build Cost @ 12.0% £304,592
Total Build Cost, Fees & Developers Profit £3,906,180
CIL on OM floorspace 1,571 sqm @ £100 per sqm £157,131Developer contributions (non-CIL site-based strategic infrastructure - @ £500k/net ha, including S.106 costs - local highway improvements, PoS, etc)
0.75 ha @ £500,000 per ha £375,000
Extra over demolition/remediation 0.75 ha £200,000 £150,000
Total Additional Development Costs £682,131
2. Total Development Costs £4,588,311
Land Value
Interim land value realised at sale £4,952,769 TDV - £4,588,311 TDC £364,458
Estimated Purchase costs finance £364,458
Actual Purchase costs finance (avoiding circular calc) £322,000 @ 8.0% per year £25,760
Less acquisition fees £322,000 Land Value @ 2.0% £6,440
Less Stamp Duty land tax £322,000 @ 3.0% £9,660
3. Residual Land Value for Site £322,598
Residual Land Value per Hectare £430,131
Existing use value (EUV) £600,000 ha £450,000
Value added by consent £322,598 EUV - £450,000 -£127,402
Uplift factor 0.72
Minimum Land Value/ha 500,000 375,000
Viability Summary
Viability Conclusion
Small PDL site at Wellsbourne. Proposal is for 30 dwellings on 0.75 net ha (40dph); Affordable 35% of total (10 units), new affordable rent product 20%, 20% intermediate, 60% social rent. Likely market mix to reflect both market for OM & AH adjusted to tak account of location/type of site: 8% 1-bed, 36% 2-bed, 42% 3-bed, 14% 4-bed, 0% 5-bed. The market appraisal indicates that this mix produces a total of 6090 sq.m of floorspace. Average sales values based on housing market analysis estimated at £2,600/sq.m. New Build all-in costs estimated at £950/sq.m all in, with additional 5% contingency, on-site infrastructure, no Code 5 build costs.
Land value of £322k (£430k/net ha), with no CSH5 costs. Viability test against 1) EUV of £450k = negative uplift of £127k, therefore fails Viability Test. Conclusion - not viable, on the basis that EUV is £600k/ha, site-based infrastructure is set at £500k/net ha, and with CIL at £100/sq.m. Need to reduce costs to achieve viability, either CIL or affordable %.

% Model No. 7SCHEME LOCATION Bidford
Local Authority Area
Nr of Beds Nr of Dwgs Flsp per Dwg (sqm)Flsp per Dwg (sq.ft)
1 0 50 538
20 2 4 63 677.88
40 3 8 85 914.6
35 4 7 130 1398.8
5 5 1 190 2044.4
100 Total Dwgs & Floorspace 20 2,032 21,864
site area ha & acres 0.6 1.48
Dwellings per Hectare 33 13
Floorspace coverage sq.m/ha & sq.ft/acre 3387 14747
Net Site Area (Ha/acres) 0.60 1.48
Type of Site small greenfield
Housing Market Share (%) GDV/sqm
Open Market 65% £2,800
Affordable Housing 35% 45%
Code For Sustainable Homes (Cfsh) Level: 3
RESIDUAL LAND VALUATION
Open Market Development Value
Floorspace 1,321 GFA sqm
OM Gross Development Value £2,800 GDV/sqm + 0.0% £3,698,240
Less buyers' sales costs 3% £3,698,240 GDV @ -3.0% -£110,947
OM Net Turnover £3,587,293
Affordable Housing Development Value
Floorspace 711 GFA sqm
AH Net Receipts £1,260 GDV/sqm + 0.0% £896,112
1. Total Development Value £4,483,405
Development Costs
Building costs + externals @ Cfsh level 3 2,032 sqm + £950 per sqm £1,930,400
Contingency £1,930,400 Build cost 5% % £96,520
Extra-over CfSH costs 5 CfSH level @ per sqm £0
Developers' profit (% of OM TO) £3,587,293 OM NR @ 20.0% £717,459
Developers' profit on AH Dwgs (8% of AH build cost) £675,640 OM NR @ 8.0% £54,051
Total Build Cost & Developers Profit £2,798,430
Development costs finance (1 year) £2,026,920 Build Cost @ 8.0% per year £162,154
Project/design team fees (% of all construction) £2,026,920 Build Cost @ 12.0% £243,230
Total Build Cost, Fees & Developers Profit £3,203,814
CIL on OM floorspace 1,321 sqm @ £100 per sqm £132,080Developer contributions (non-CIL site-based strategic infrastructure - @ £500k/net ha, including S.106 costs - local highway improvements, PoS, etc)
0.60 ha @ £500,000 per ha £300,000
Extra over demolition/remediation 0.60 ha £200,000 £120,000
Total Additional Development Costs £552,080
2. Total Development Costs £3,755,894
Land Value
Interim land value realised at sale £4,483,405 TDV - £3,755,894 TDC £727,511
Estimated Purchase costs finance £727,511
Actual Purchase costs finance (avoiding circular calc) £638,000 @ 8.0% per year £51,040
Less acquisition fees £638,000 Land Value @ 2.0% £12,760
Less Stamp Duty land tax £638,000 @ 4.0% £25,520
3. Residual Land Value for Site £638,191
Residual Land Value per Hectare £1,063,652
Existing use value (EUV) £30,000 ha £18,000
Value added by consent £638,191 EUV - £18,000 £620,191
Uplift factor 35.46
Minimum Land Value/ha 500,000 300,000
Viability Summary
Viability Conclusion
Small grenfield site at Bidford. Proposal is for 20 dwellings on 0.6 net ha (33 dph); Affordable 35% of total (7 units), new affordable rent product 20%, 20% intermediate, 60% social rent. Likely market mix to reflect both market for OM & AH, adjusted to tak account of location/type of site: 0% 1-bed, 20% 2-bed, 40% 3-bed, 35% 4-bed, 5% 5-bed. The market appraisal indicates that this mix produces a total of 2032 sq.m of floorspace. Average sales values based on housing market analysis estimated at £2,800/sq.m. New Build all-in costs estimated at £950/sq.m all in, with additional 5% contingency, on-site infrastructure, no Code 5 build costs.
Land value of £638k (£1.06m/net ha), with no CSH5 costs. Viability test against 1) uplift of £620k, x 35 from agric value and 20 x hope value of £50k/ha. Against Option Agreement Minimum Land Value of £500k/ha = £300k. Achieved LV = £620kor £1.063m/net ha, therefore passes all 3 Viability Tests. Conclusion - viable, on the basis that site-based infrastructure is set at £500k/net ha, and with CIL at £100/sq.m
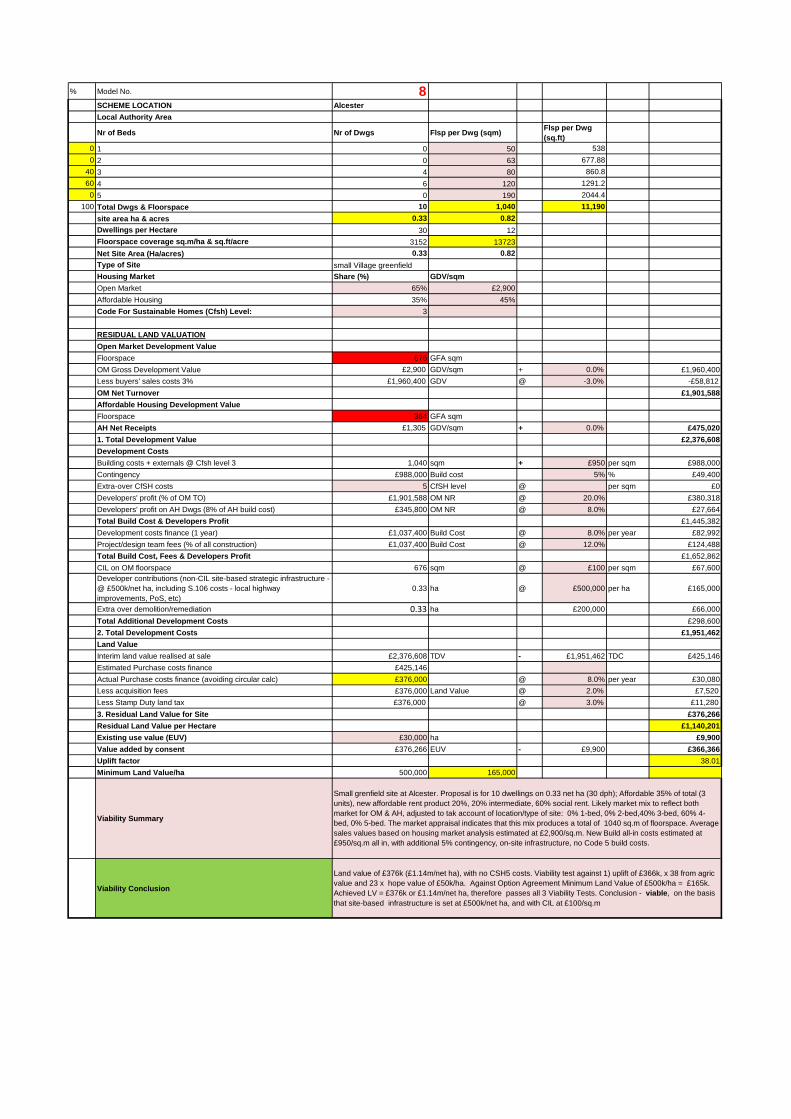
% Model No. 8SCHEME LOCATION Alcester
Local Authority Area
Nr of Beds Nr of Dwgs Flsp per Dwg (sqm)Flsp per Dwg (sq.ft)
0 1 0 50 538
0 2 0 63 677.88
40 3 4 80 860.8
60 4 6 120 1291.2
0 5 0 190 2044.4
100 Total Dwgs & Floorspace 10 1,040 11,190
site area ha & acres 0.33 0.82
Dwellings per Hectare 30 12
Floorspace coverage sq.m/ha & sq.ft/acre 3152 13723
Net Site Area (Ha/acres) 0.33 0.82
Type of Site small Village greenfield
Housing Market Share (%) GDV/sqm
Open Market 65% £2,900
Affordable Housing 35% 45%
Code For Sustainable Homes (Cfsh) Level: 3
RESIDUAL LAND VALUATION
Open Market Development Value
Floorspace 676 GFA sqm
OM Gross Development Value £2,900 GDV/sqm + 0.0% £1,960,400
Less buyers' sales costs 3% £1,960,400 GDV @ -3.0% -£58,812
OM Net Turnover £1,901,588
Affordable Housing Development Value
Floorspace 364 GFA sqm
AH Net Receipts £1,305 GDV/sqm + 0.0% £475,020
1. Total Development Value £2,376,608
Development Costs
Building costs + externals @ Cfsh level 3 1,040 sqm + £950 per sqm £988,000
Contingency £988,000 Build cost 5% % £49,400
Extra-over CfSH costs 5 CfSH level @ per sqm £0
Developers' profit (% of OM TO) £1,901,588 OM NR @ 20.0% £380,318
Developers' profit on AH Dwgs (8% of AH build cost) £345,800 OM NR @ 8.0% £27,664
Total Build Cost & Developers Profit £1,445,382
Development costs finance (1 year) £1,037,400 Build Cost @ 8.0% per year £82,992
Project/design team fees (% of all construction) £1,037,400 Build Cost @ 12.0% £124,488
Total Build Cost, Fees & Developers Profit £1,652,862
CIL on OM floorspace 676 sqm @ £100 per sqm £67,600Developer contributions (non-CIL site-based strategic infrastructure - @ £500k/net ha, including S.106 costs - local highway improvements, PoS, etc)
0.33 ha @ £500,000 per ha £165,000
Extra over demolition/remediation 0.33 ha £200,000 £66,000
Total Additional Development Costs £298,600
2. Total Development Costs £1,951,462
Land Value
Interim land value realised at sale £2,376,608 TDV - £1,951,462 TDC £425,146
Estimated Purchase costs finance £425,146
Actual Purchase costs finance (avoiding circular calc) £376,000 @ 8.0% per year £30,080
Less acquisition fees £376,000 Land Value @ 2.0% £7,520
Less Stamp Duty land tax £376,000 @ 3.0% £11,280
3. Residual Land Value for Site £376,266
Residual Land Value per Hectare £1,140,201
Existing use value (EUV) £30,000 ha £9,900
Value added by consent £376,266 EUV - £9,900 £366,366
Uplift factor 38.01
Minimum Land Value/ha 500,000 165,000
Viability Summary
Viability Conclusion
Small grenfield site at Alcester. Proposal is for 10 dwellings on 0.33 net ha (30 dph); Affordable 35% of total (3 units), new affordable rent product 20%, 20% intermediate, 60% social rent. Likely market mix to reflect both market for OM & AH, adjusted to tak account of location/type of site: 0% 1-bed, 0% 2-bed,40% 3-bed, 60% 4-bed, 0% 5-bed. The market appraisal indicates that this mix produces a total of 1040 sq.m of floorspace. Average sales values based on housing market analysis estimated at £2,900/sq.m. New Build all-in costs estimated at £950/sq.m all in, with additional 5% contingency, on-site infrastructure, no Code 5 build costs.
Land value of £376k (£1.14m/net ha), with no CSH5 costs. Viability test against 1) uplift of £366k, x 38 from agric value and 23 x hope value of £50k/ha. Against Option Agreement Minimum Land Value of £500k/ha = £165k. Achieved LV = £376k or £1.14m/net ha, therefore passes all 3 Viability Tests. Conclusion - viable, on the basis that site-based infrastructure is set at £500k/net ha, and with CIL at £100/sq.m
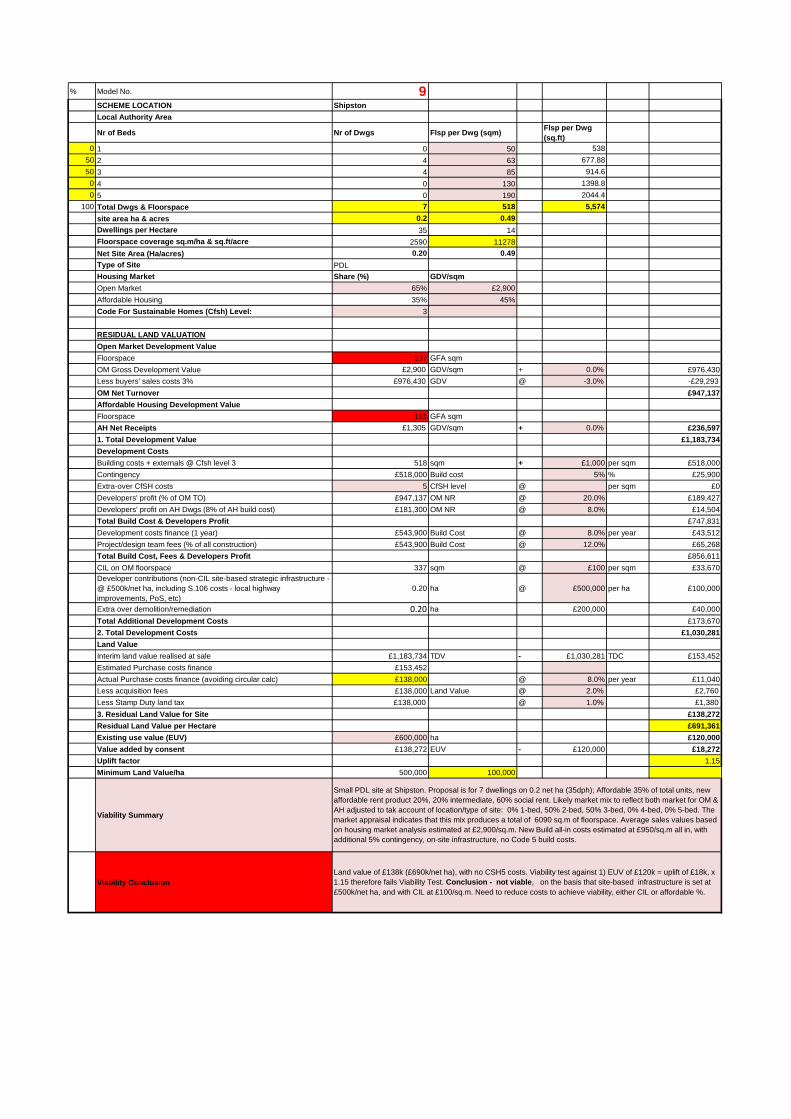
% Model No. 9SCHEME LOCATION Shipston
Local Authority Area
Nr of Beds Nr of Dwgs Flsp per Dwg (sqm)Flsp per Dwg (sq.ft)
0 1 0 50 538
50 2 4 63 677.88
50 3 4 85 914.6
0 4 0 130 1398.8
0 5 0 190 2044.4
100 Total Dwgs & Floorspace 7 518 5,574
site area ha & acres 0.2 0.49
Dwellings per Hectare 35 14
Floorspace coverage sq.m/ha & sq.ft/acre 2590 11278
Net Site Area (Ha/acres) 0.20 0.49
Type of Site PDL
Housing Market Share (%) GDV/sqm
Open Market 65% £2,900
Affordable Housing 35% 45%
Code For Sustainable Homes (Cfsh) Level: 3
RESIDUAL LAND VALUATION
Open Market Development Value
Floorspace 337 GFA sqm
OM Gross Development Value £2,900 GDV/sqm + 0.0% £976,430
Less buyers' sales costs 3% £976,430 GDV @ -3.0% -£29,293
OM Net Turnover £947,137
Affordable Housing Development Value
Floorspace 181 GFA sqm
AH Net Receipts £1,305 GDV/sqm + 0.0% £236,597
1. Total Development Value £1,183,734
Development Costs
Building costs + externals @ Cfsh level 3 518 sqm + £1,000 per sqm £518,000
Contingency £518,000 Build cost 5% % £25,900
Extra-over CfSH costs 5 CfSH level @ per sqm £0
Developers' profit (% of OM TO) £947,137 OM NR @ 20.0% £189,427
Developers' profit on AH Dwgs (8% of AH build cost) £181,300 OM NR @ 8.0% £14,504
Total Build Cost & Developers Profit £747,831
Development costs finance (1 year) £543,900 Build Cost @ 8.0% per year £43,512
Project/design team fees (% of all construction) £543,900 Build Cost @ 12.0% £65,268
Total Build Cost, Fees & Developers Profit £856,611
CIL on OM floorspace 337 sqm @ £100 per sqm £33,670Developer contributions (non-CIL site-based strategic infrastructure - @ £500k/net ha, including S.106 costs - local highway improvements, PoS, etc)
0.20 ha @ £500,000 per ha £100,000
Extra over demolition/remediation 0.20 ha £200,000 £40,000
Total Additional Development Costs £173,670
2. Total Development Costs £1,030,281
Land Value
Interim land value realised at sale £1,183,734 TDV - £1,030,281 TDC £153,452
Estimated Purchase costs finance £153,452
Actual Purchase costs finance (avoiding circular calc) £138,000 @ 8.0% per year £11,040
Less acquisition fees £138,000 Land Value @ 2.0% £2,760
Less Stamp Duty land tax £138,000 @ 1.0% £1,380
3. Residual Land Value for Site £138,272
Residual Land Value per Hectare £691,361
Existing use value (EUV) £600,000 ha £120,000
Value added by consent £138,272 EUV - £120,000 £18,272
Uplift factor 1.15
Minimum Land Value/ha 500,000 100,000
Viability Summary
Viability ConclusionLand value of £138k (£690k/net ha), with no CSH5 costs. Viability test against 1) EUV of £120k = uplift of £18k, x 1.15 therefore fails Viability Test. Conclusion - not viable, on the basis that site-based infrastructure is set at £500k/net ha, and with CIL at £100/sq.m. Need to reduce costs to achieve viability, either CIL or affordable %.
Small PDL site at Shipston. Proposal is for 7 dwellings on 0.2 net ha (35dph); Affordable 35% of total units, new affordable rent product 20%, 20% intermediate, 60% social rent. Likely market mix to reflect both market for OM & AH adjusted to tak account of location/type of site: 0% 1-bed, 50% 2-bed, 50% 3-bed, 0% 4-bed, 0% 5-bed. The market appraisal indicates that this mix produces a total of 6090 sq.m of floorspace. Average sales values based on housing market analysis estimated at £2,900/sq.m. New Build all-in costs estimated at £950/sq.m all in, with additional 5% contingency, on-site infrastructure, no Code 5 build costs.
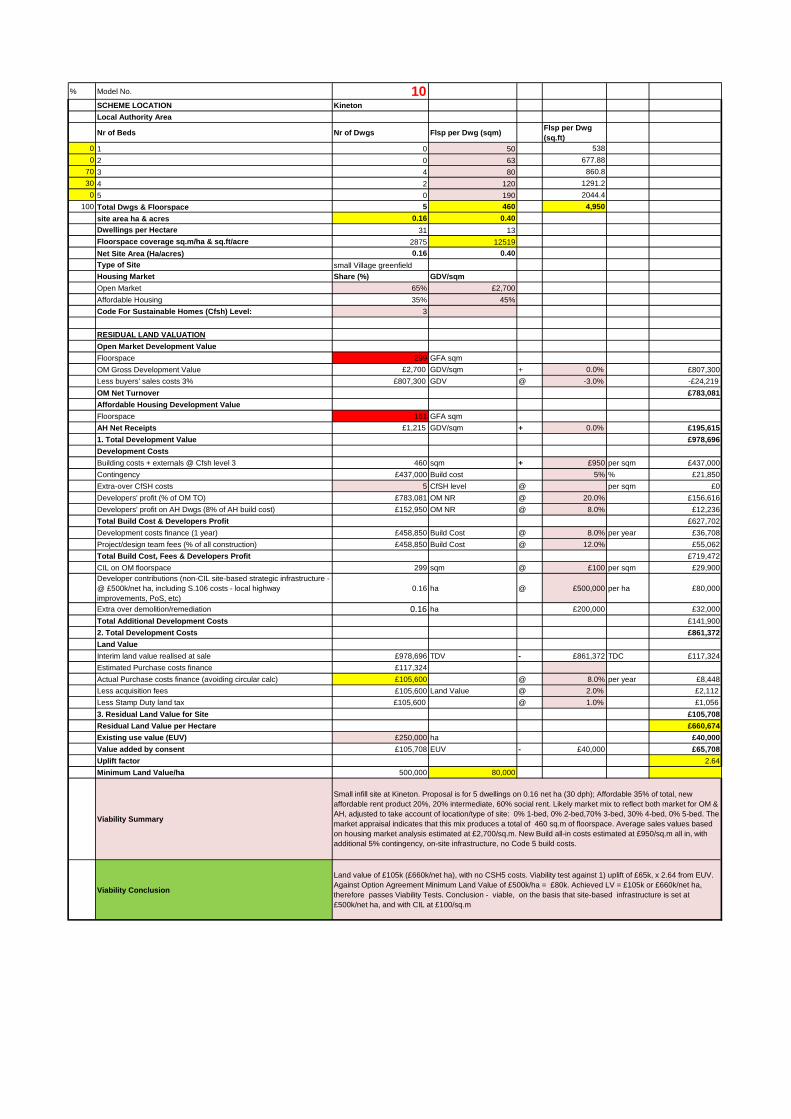
% Model No. 10SCHEME LOCATION Kineton
Local Authority Area
Nr of Beds Nr of Dwgs Flsp per Dwg (sqm)Flsp per Dwg (sq.ft)
0 1 0 50 538
0 2 0 63 677.88
70 3 4 80 860.8
30 4 2 120 1291.2
0 5 0 190 2044.4
100 Total Dwgs & Floorspace 5 460 4,950
site area ha & acres 0.16 0.40
Dwellings per Hectare 31 13
Floorspace coverage sq.m/ha & sq.ft/acre 2875 12519
Net Site Area (Ha/acres) 0.16 0.40
Type of Site small Village greenfield
Housing Market Share (%) GDV/sqm
Open Market 65% £2,700
Affordable Housing 35% 45%
Code For Sustainable Homes (Cfsh) Level: 3
RESIDUAL LAND VALUATION
Open Market Development Value
Floorspace 299 GFA sqm
OM Gross Development Value £2,700 GDV/sqm + 0.0% £807,300
Less buyers' sales costs 3% £807,300 GDV @ -3.0% -£24,219
OM Net Turnover £783,081
Affordable Housing Development Value
Floorspace 161 GFA sqm
AH Net Receipts £1,215 GDV/sqm + 0.0% £195,615
1. Total Development Value £978,696
Development Costs
Building costs + externals @ Cfsh level 3 460 sqm + £950 per sqm £437,000
Contingency £437,000 Build cost 5% % £21,850
Extra-over CfSH costs 5 CfSH level @ per sqm £0
Developers' profit (% of OM TO) £783,081 OM NR @ 20.0% £156,616
Developers' profit on AH Dwgs (8% of AH build cost) £152,950 OM NR @ 8.0% £12,236
Total Build Cost & Developers Profit £627,702
Development costs finance (1 year) £458,850 Build Cost @ 8.0% per year £36,708
Project/design team fees (% of all construction) £458,850 Build Cost @ 12.0% £55,062
Total Build Cost, Fees & Developers Profit £719,472
CIL on OM floorspace 299 sqm @ £100 per sqm £29,900Developer contributions (non-CIL site-based strategic infrastructure - @ £500k/net ha, including S.106 costs - local highway improvements, PoS, etc)
0.16 ha @ £500,000 per ha £80,000
Extra over demolition/remediation 0.16 ha £200,000 £32,000
Total Additional Development Costs £141,900
2. Total Development Costs £861,372
Land Value
Interim land value realised at sale £978,696 TDV - £861,372 TDC £117,324
Estimated Purchase costs finance £117,324
Actual Purchase costs finance (avoiding circular calc) £105,600 @ 8.0% per year £8,448
Less acquisition fees £105,600 Land Value @ 2.0% £2,112
Less Stamp Duty land tax £105,600 @ 1.0% £1,056
3. Residual Land Value for Site £105,708
Residual Land Value per Hectare £660,674
Existing use value (EUV) £250,000 ha £40,000
Value added by consent £105,708 EUV - £40,000 £65,708
Uplift factor 2.64
Minimum Land Value/ha 500,000 80,000
Viability Summary
Viability Conclusion
Small infill site at Kineton. Proposal is for 5 dwellings on 0.16 net ha (30 dph); Affordable 35% of total, new affordable rent product 20%, 20% intermediate, 60% social rent. Likely market mix to reflect both market for OM & AH, adjusted to take account of location/type of site: 0% 1-bed, 0% 2-bed,70% 3-bed, 30% 4-bed, 0% 5-bed. The market appraisal indicates that this mix produces a total of 460 sq.m of floorspace. Average sales values based on housing market analysis estimated at £2,700/sq.m. New Build all-in costs estimated at £950/sq.m all in, with additional 5% contingency, on-site infrastructure, no Code 5 build costs.
Land value of £105k (£660k/net ha), with no CSH5 costs. Viability test against 1) uplift of £65k, x 2.64 from EUV. Against Option Agreement Minimum Land Value of £500k/ha = £80k. Achieved LV = £105k or £660k/net ha, therefore passes Viability Tests. Conclusion - viable, on the basis that site-based infrastructure is set at £500k/net ha, and with CIL at £100/sq.m

% Model No. 11SCHEME LOCATION
Local Authority Area
Nr of Beds Nr of Dwgs Flsp per Dwg (sqm)Flsp per Dwg (sq.ft)
0 1 0 50 538
0 2 0 63 677.88
70 3 4 80 860.8
30 4 2 120 1291.2
0 5 0 190 2044.4
100 Total Dwgs & Floorspace 5 460 4,950
site area ha & acres 0.16 0.40
Dwellings per Hectare 31 13
Floorspace coverage sq.m/ha & sq.ft/acre 2875 12519
Net Site Area (Ha/acres) 0.16 0.40
Type of Site small Village greenfield
Housing Market Share (%) GDV/sqm
Open Market 65% £3,000
Affordable Housing 35% 45%
Code For Sustainable Homes (Cfsh) Level: 3
RESIDUAL LAND VALUATION
Open Market Development Value
Floorspace 299 GFA sqm
OM Gross Development Value £3,000 GDV/sqm + 0.0% £897,000
Less buyers' sales costs 3% £897,000 GDV @ -3.0% -£26,910
OM Net Turnover £870,090
Affordable Housing Development Value
Floorspace 161 GFA sqm
AH Net Receipts £1,350 GDV/sqm + 0.0% £217,350
1. Total Development Value £1,087,440
Development Costs
Building costs + externals @ Cfsh level 3 460 sqm + £950 per sqm £437,000
Contingency £437,000 Build cost 5% % £21,850
Extra-over CfSH costs 5 CfSH level @ per sqm £0
Developers' profit (% of OM TO) £870,090 OM NR @ 20.0% £174,018
Developers' profit on AH Dwgs (8% of AH build cost) £152,950 OM NR @ 8.0% £12,236
Total Build Cost & Developers Profit £645,104
Development costs finance (1 year) £458,850 Build Cost @ 8.0% per year £36,708
Project/design team fees (% of all construction) £458,850 Build Cost @ 12.0% £55,062
Total Build Cost, Fees & Developers Profit £736,874
CIL on OM floorspace 299 sqm @ £100 per sqm £29,900Developer contributions (non-CIL site-based strategic infrastructure - @ £500k/net ha, including S.106 costs - local highway improvements, PoS, etc)
0.16 ha @ £500,000 per ha £80,000
Extra over demolition/remediation 0.16 ha £200,000 £32,000
Total Additional Development Costs £141,900
2. Total Development Costs £878,774
Land Value
Interim land value realised at sale £1,087,440 TDV - £878,774 TDC £208,666
Estimated Purchase costs finance £208,666
Actual Purchase costs finance (avoiding circular calc) £188,000 @ 8.0% per year £15,040
Less acquisition fees £188,000 Land Value @ 2.0% £3,760
Less Stamp Duty land tax £188,000 @ 1.0% £1,880
3. Residual Land Value for Site £187,986
Residual Land Value per Hectare £1,174,913
Existing use value (EUV) £250,000 ha £40,000
Value added by consent £187,986 EUV - £40,000 £147,986
Uplift factor 4.70
Minimum Land Value/ha 500,000 80,000
Viability Summary
Viability Conclusion
Local Service Village - Tysoe
Small infill site at a Local service village - Tysoe. Proposal is for 5 dwellings on 0.16 net ha (30 dph); Affordable 35% of total, new affordable rent product 20%, 20% intermediate, 60% social rent. Likely market mix to reflect both market for OM & AH, adjusted to take account of location/type of site: 0% 1-bed, 0% 2-bed,70% 3-bed, 30% 4-bed, 0% 5-bed. The market appraisal indicates that this mix produces a total of 460 sq.m of floorspace. Average sales values based on housing market analysis estimated at £3,000/sq.m. New Build all-in costs estimated at £950/sq.m all in, with additional 5% contingency, on-site infrastructure, no Code 5 build costs.
Land value of £188k (£1174k/net ha), with no CSH5 costs. Viability test against 1) uplift of £148k, x 4.7 from EUV. Against Option Agreement Minimum Land Value of £500k/ha = £80k. Achieved LV = £188k or £1174k/net ha, therefore passes Viability Tests. Conclusion - viable, on the basis that site-based infrastructure is set at £500k/net ha, and with CIL at £100/sq.m
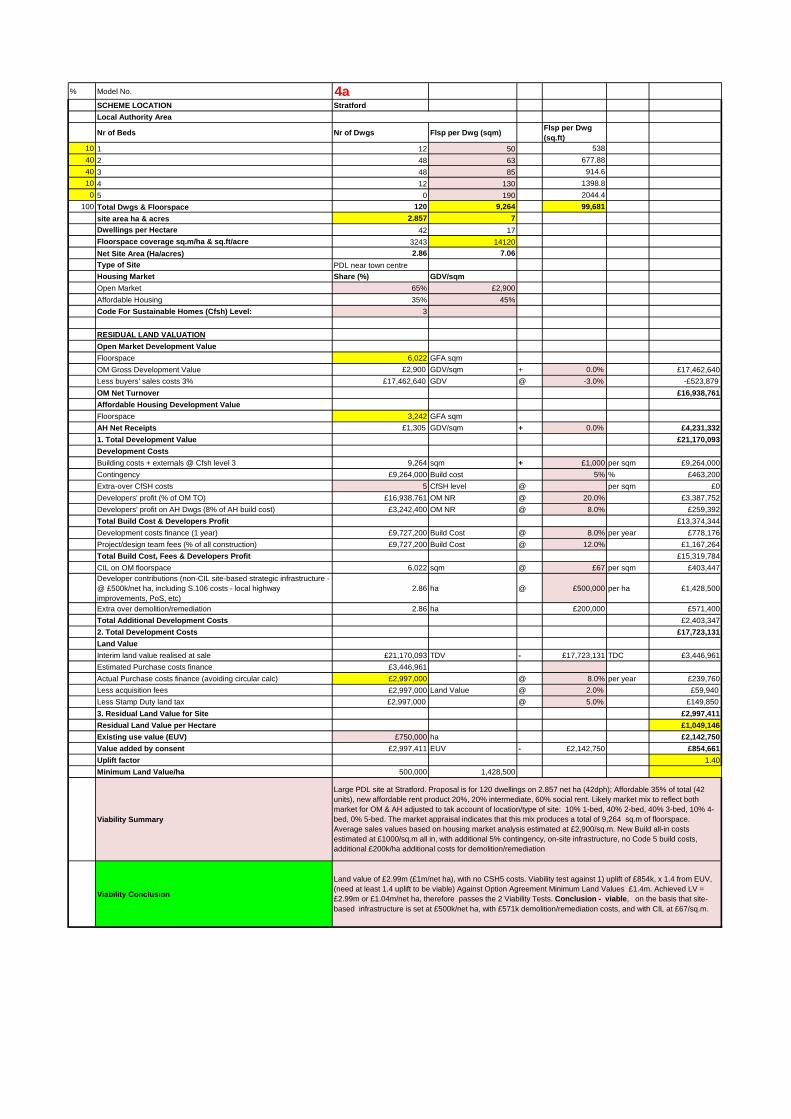
% Model No. 4aSCHEME LOCATION Stratford
Local Authority Area
Nr of Beds Nr of Dwgs Flsp per Dwg (sqm)Flsp per Dwg (sq.ft)
10 1 12 50 538
40 2 48 63 677.88
40 3 48 85 914.6
10 4 12 130 1398.8
0 5 0 190 2044.4
100 Total Dwgs & Floorspace 120 9,264 99,681
site area ha & acres 2.857 7
Dwellings per Hectare 42 17
Floorspace coverage sq.m/ha & sq.ft/acre 3243 14120
Net Site Area (Ha/acres) 2.86 7.06
Type of Site PDL near town centre
Housing Market Share (%) GDV/sqm
Open Market 65% £2,900
Affordable Housing 35% 45%
Code For Sustainable Homes (Cfsh) Level: 3
RESIDUAL LAND VALUATION
Open Market Development Value
Floorspace 6,022 GFA sqm
OM Gross Development Value £2,900 GDV/sqm + 0.0% £17,462,640
Less buyers' sales costs 3% £17,462,640 GDV @ -3.0% -£523,879
OM Net Turnover £16,938,761
Affordable Housing Development Value
Floorspace 3,242 GFA sqm
AH Net Receipts £1,305 GDV/sqm + 0.0% £4,231,332
1. Total Development Value £21,170,093
Development Costs
Building costs + externals @ Cfsh level 3 9,264 sqm + £1,000 per sqm £9,264,000
Contingency £9,264,000 Build cost 5% % £463,200
Extra-over CfSH costs 5 CfSH level @ per sqm £0
Developers' profit (% of OM TO) £16,938,761 OM NR @ 20.0% £3,387,752
Developers' profit on AH Dwgs (8% of AH build cost) £3,242,400 OM NR @ 8.0% £259,392
Total Build Cost & Developers Profit £13,374,344
Development costs finance (1 year) £9,727,200 Build Cost @ 8.0% per year £778,176
Project/design team fees (% of all construction) £9,727,200 Build Cost @ 12.0% £1,167,264
Total Build Cost, Fees & Developers Profit £15,319,784
CIL on OM floorspace 6,022 sqm @ £67 per sqm £403,447Developer contributions (non-CIL site-based strategic infrastructure - @ £500k/net ha, including S.106 costs - local highway improvements, PoS, etc)
2.86 ha @ £500,000 per ha £1,428,500
Extra over demolition/remediation 2.86 ha £200,000 £571,400
Total Additional Development Costs £2,403,347
2. Total Development Costs £17,723,131
Land Value
Interim land value realised at sale £21,170,093 TDV - £17,723,131 TDC £3,446,961
Estimated Purchase costs finance £3,446,961
Actual Purchase costs finance (avoiding circular calc) £2,997,000 @ 8.0% per year £239,760
Less acquisition fees £2,997,000 Land Value @ 2.0% £59,940
Less Stamp Duty land tax £2,997,000 @ 5.0% £149,850
3. Residual Land Value for Site £2,997,411
Residual Land Value per Hectare £1,049,146
Existing use value (EUV) £750,000 ha £2,142,750
Value added by consent £2,997,411 EUV - £2,142,750 £854,661
Uplift factor 1.40
Minimum Land Value/ha 500,000 1,428,500
Viability Summary
Viability Conclusion
Large PDL site at Stratford. Proposal is for 120 dwellings on 2.857 net ha (42dph); Affordable 35% of total (42 units), new affordable rent product 20%, 20% intermediate, 60% social rent. Likely market mix to reflect both market for OM & AH adjusted to tak account of location/type of site: 10% 1-bed, 40% 2-bed, 40% 3-bed, 10% 4-bed, 0% 5-bed. The market appraisal indicates that this mix produces a total of 9,264 sq.m of floorspace. Average sales values based on housing market analysis estimated at £2,900/sq.m. New Build all-in costs estimated at £1000/sq.m all in, with additional 5% contingency, on-site infrastructure, no Code 5 build costs, additional £200k/ha additional costs for demolition/remediation
Land value of £2.99m (£1m/net ha), with no CSH5 costs. Viability test against 1) uplift of £854k, x 1.4 from EUV, (need at least 1.4 uplift to be viable) Against Option Agreement Minimum Land Values £1.4m. Achieved LV = £2.99m or £1.04m/net ha, therefore passes the 2 Viability Tests. Conclusion - viable, on the basis that site-based infrastructure is set at £500k/net ha, with £571k demolition/remediation costs, and with CIL at £67/sq.m.
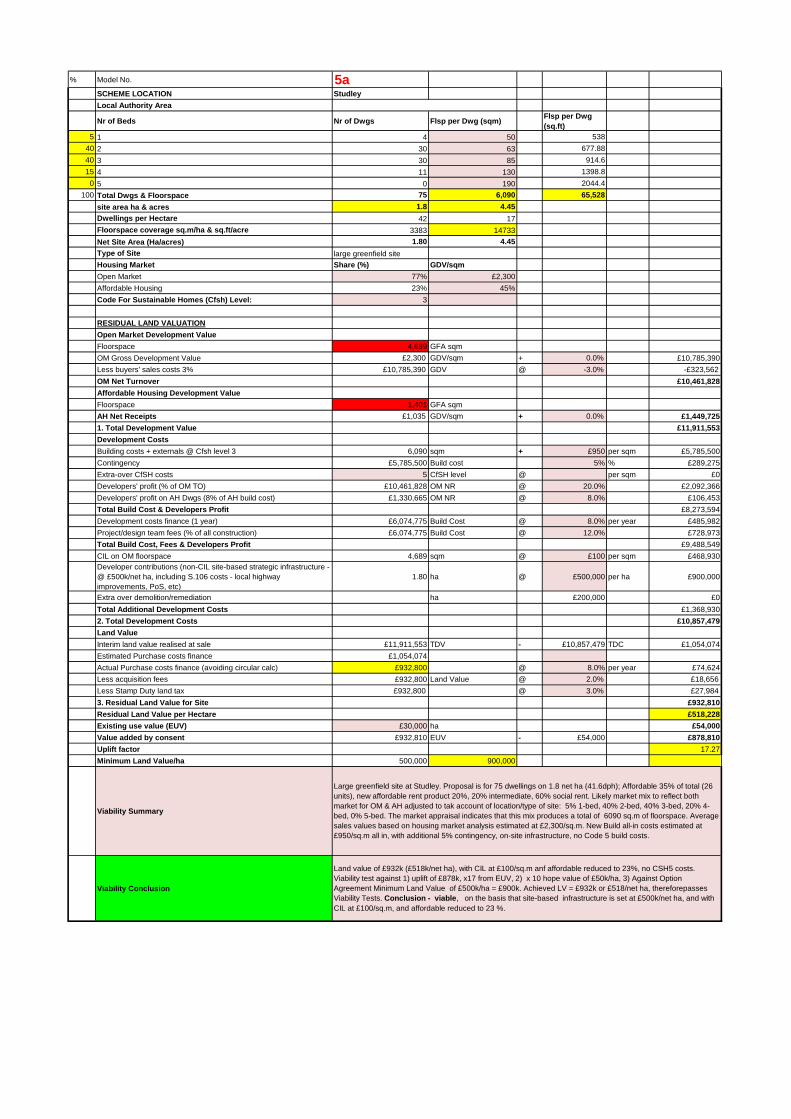
% Model No. 5aSCHEME LOCATION Studley
Local Authority Area
Nr of Beds Nr of Dwgs Flsp per Dwg (sqm)Flsp per Dwg (sq.ft)
5 1 4 50 538
40 2 30 63 677.88
40 3 30 85 914.6
15 4 11 130 1398.8
0 5 0 190 2044.4
100 Total Dwgs & Floorspace 75 6,090 65,528
site area ha & acres 1.8 4.45
Dwellings per Hectare 42 17
Floorspace coverage sq.m/ha & sq.ft/acre 3383 14733
Net Site Area (Ha/acres) 1.80 4.45
Type of Site large greenfield site
Housing Market Share (%) GDV/sqm
Open Market 77% £2,300
Affordable Housing 23% 45%
Code For Sustainable Homes (Cfsh) Level: 3
RESIDUAL LAND VALUATION
Open Market Development Value
Floorspace 4,689 GFA sqm
OM Gross Development Value £2,300 GDV/sqm + 0.0% £10,785,390
Less buyers' sales costs 3% £10,785,390 GDV @ -3.0% -£323,562
OM Net Turnover £10,461,828
Affordable Housing Development Value
Floorspace 1,401 GFA sqm
AH Net Receipts £1,035 GDV/sqm + 0.0% £1,449,725
1. Total Development Value £11,911,553
Development Costs
Building costs + externals @ Cfsh level 3 6,090 sqm + £950 per sqm £5,785,500
Contingency £5,785,500 Build cost 5% % £289,275
Extra-over CfSH costs 5 CfSH level @ per sqm £0
Developers' profit (% of OM TO) £10,461,828 OM NR @ 20.0% £2,092,366
Developers' profit on AH Dwgs (8% of AH build cost) £1,330,665 OM NR @ 8.0% £106,453
Total Build Cost & Developers Profit £8,273,594
Development costs finance (1 year) £6,074,775 Build Cost @ 8.0% per year £485,982
Project/design team fees (% of all construction) £6,074,775 Build Cost @ 12.0% £728,973
Total Build Cost, Fees & Developers Profit £9,488,549
CIL on OM floorspace 4,689 sqm @ £100 per sqm £468,930Developer contributions (non-CIL site-based strategic infrastructure - @ £500k/net ha, including S.106 costs - local highway improvements, PoS, etc)
1.80 ha @ £500,000 per ha £900,000
Extra over demolition/remediation ha £200,000 £0
Total Additional Development Costs £1,368,930
2. Total Development Costs £10,857,479
Land Value
Interim land value realised at sale £11,911,553 TDV - £10,857,479 TDC £1,054,074
Estimated Purchase costs finance £1,054,074
Actual Purchase costs finance (avoiding circular calc) £932,800 @ 8.0% per year £74,624
Less acquisition fees £932,800 Land Value @ 2.0% £18,656
Less Stamp Duty land tax £932,800 @ 3.0% £27,984
3. Residual Land Value for Site £932,810
Residual Land Value per Hectare £518,228
Existing use value (EUV) £30,000 ha £54,000
Value added by consent £932,810 EUV - £54,000 £878,810
Uplift factor 17.27
Minimum Land Value/ha 500,000 900,000
Viability Summary
Viability Conclusion
Land value of £932k (£518k/net ha), with CIL at £100/sq.m anf affordable reduced to 23%, no CSH5 costs. Viability test against 1) uplift of £878k, x17 from EUV, 2) x 10 hope value of £50k/ha, 3) Against Option Agreement Minimum Land Value of £500k/ha = £900k. Achieved LV = £932k or £518/net ha, thereforepasses Viability Tests. Conclusion - viable, on the basis that site-based infrastructure is set at £500k/net ha, and with CIL at £100/sq.m, and affordable reduced to 23 %.
Large greenfield site at Studley. Proposal is for 75 dwellings on 1.8 net ha (41.6dph); Affordable 35% of total (26 units), new affordable rent product 20%, 20% intermediate, 60% social rent. Likely market mix to reflect both market for OM & AH adjusted to tak account of location/type of site: 5% 1-bed, 40% 2-bed, 40% 3-bed, 20% 4-bed, 0% 5-bed. The market appraisal indicates that this mix produces a total of 6090 sq.m of floorspace. Average sales values based on housing market analysis estimated at £2,300/sq.m. New Build all-in costs estimated at £950/sq.m all in, with additional 5% contingency, on-site infrastructure, no Code 5 build costs.
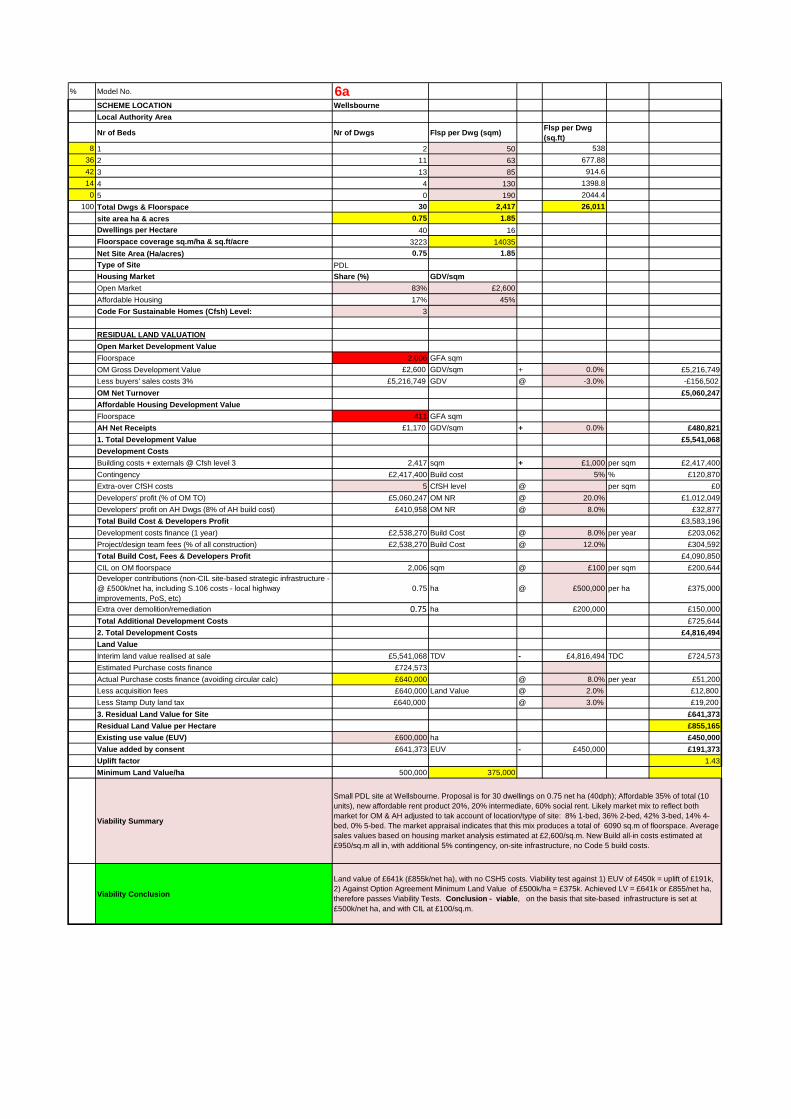
% Model No. 6aSCHEME LOCATION Wellsbourne
Local Authority Area
Nr of Beds Nr of Dwgs Flsp per Dwg (sqm)Flsp per Dwg (sq.ft)
8 1 2 50 538
36 2 11 63 677.88
42 3 13 85 914.6
14 4 4 130 1398.8
0 5 0 190 2044.4
100 Total Dwgs & Floorspace 30 2,417 26,011
site area ha & acres 0.75 1.85
Dwellings per Hectare 40 16
Floorspace coverage sq.m/ha & sq.ft/acre 3223 14035
Net Site Area (Ha/acres) 0.75 1.85
Type of Site PDL
Housing Market Share (%) GDV/sqm
Open Market 83% £2,600
Affordable Housing 17% 45%
Code For Sustainable Homes (Cfsh) Level: 3
RESIDUAL LAND VALUATION
Open Market Development Value
Floorspace 2,006 GFA sqm
OM Gross Development Value £2,600 GDV/sqm + 0.0% £5,216,749
Less buyers' sales costs 3% £5,216,749 GDV @ -3.0% -£156,502
OM Net Turnover £5,060,247
Affordable Housing Development Value
Floorspace 411 GFA sqm
AH Net Receipts £1,170 GDV/sqm + 0.0% £480,821
1. Total Development Value £5,541,068
Development Costs
Building costs + externals @ Cfsh level 3 2,417 sqm + £1,000 per sqm £2,417,400
Contingency £2,417,400 Build cost 5% % £120,870
Extra-over CfSH costs 5 CfSH level @ per sqm £0
Developers' profit (% of OM TO) £5,060,247 OM NR @ 20.0% £1,012,049
Developers' profit on AH Dwgs (8% of AH build cost) £410,958 OM NR @ 8.0% £32,877
Total Build Cost & Developers Profit £3,583,196
Development costs finance (1 year) £2,538,270 Build Cost @ 8.0% per year £203,062
Project/design team fees (% of all construction) £2,538,270 Build Cost @ 12.0% £304,592
Total Build Cost, Fees & Developers Profit £4,090,850
CIL on OM floorspace 2,006 sqm @ £100 per sqm £200,644Developer contributions (non-CIL site-based strategic infrastructure - @ £500k/net ha, including S.106 costs - local highway improvements, PoS, etc)
0.75 ha @ £500,000 per ha £375,000
Extra over demolition/remediation 0.75 ha £200,000 £150,000
Total Additional Development Costs £725,644
2. Total Development Costs £4,816,494
Land Value
Interim land value realised at sale £5,541,068 TDV - £4,816,494 TDC £724,573
Estimated Purchase costs finance £724,573
Actual Purchase costs finance (avoiding circular calc) £640,000 @ 8.0% per year £51,200
Less acquisition fees £640,000 Land Value @ 2.0% £12,800
Less Stamp Duty land tax £640,000 @ 3.0% £19,200
3. Residual Land Value for Site £641,373
Residual Land Value per Hectare £855,165
Existing use value (EUV) £600,000 ha £450,000
Value added by consent £641,373 EUV - £450,000 £191,373
Uplift factor 1.43
Minimum Land Value/ha 500,000 375,000
Viability Summary
Viability Conclusion
Small PDL site at Wellsbourne. Proposal is for 30 dwellings on 0.75 net ha (40dph); Affordable 35% of total (10 units), new affordable rent product 20%, 20% intermediate, 60% social rent. Likely market mix to reflect both market for OM & AH adjusted to tak account of location/type of site: 8% 1-bed, 36% 2-bed, 42% 3-bed, 14% 4-bed, 0% 5-bed. The market appraisal indicates that this mix produces a total of 6090 sq.m of floorspace. Average sales values based on housing market analysis estimated at £2,600/sq.m. New Build all-in costs estimated at £950/sq.m all in, with additional 5% contingency, on-site infrastructure, no Code 5 build costs.
Land value of £641k (£855k/net ha), with no CSH5 costs. Viability test against 1) EUV of £450k = uplift of £191k, 2) Against Option Agreement Minimum Land Value of £500k/ha = £375k. Achieved LV = £641k or £855/net ha, therefore passes Viability Tests. Conclusion - viable, on the basis that site-based infrastructure is set at £500k/net ha, and with CIL at £100/sq.m.
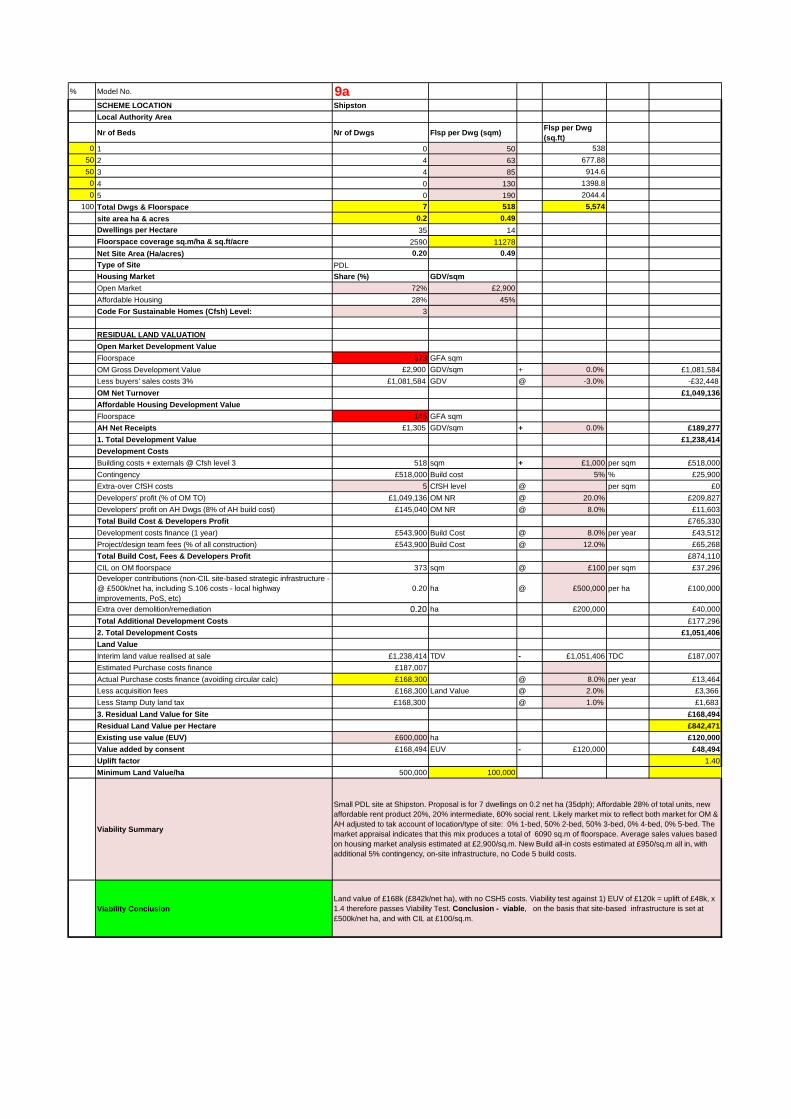
% Model No. 9aSCHEME LOCATION Shipston
Local Authority Area
Nr of Beds Nr of Dwgs Flsp per Dwg (sqm)Flsp per Dwg (sq.ft)
0 1 0 50 538
50 2 4 63 677.88
50 3 4 85 914.6
0 4 0 130 1398.8
0 5 0 190 2044.4
100 Total Dwgs & Floorspace 7 518 5,574
site area ha & acres 0.2 0.49
Dwellings per Hectare 35 14
Floorspace coverage sq.m/ha & sq.ft/acre 2590 11278
Net Site Area (Ha/acres) 0.20 0.49
Type of Site PDL
Housing Market Share (%) GDV/sqm
Open Market 72% £2,900
Affordable Housing 28% 45%
Code For Sustainable Homes (Cfsh) Level: 3
RESIDUAL LAND VALUATION
Open Market Development Value
Floorspace 373 GFA sqm
OM Gross Development Value £2,900 GDV/sqm + 0.0% £1,081,584
Less buyers' sales costs 3% £1,081,584 GDV @ -3.0% -£32,448
OM Net Turnover £1,049,136
Affordable Housing Development Value
Floorspace 145 GFA sqm
AH Net Receipts £1,305 GDV/sqm + 0.0% £189,277
1. Total Development Value £1,238,414
Development Costs
Building costs + externals @ Cfsh level 3 518 sqm + £1,000 per sqm £518,000
Contingency £518,000 Build cost 5% % £25,900
Extra-over CfSH costs 5 CfSH level @ per sqm £0
Developers' profit (% of OM TO) £1,049,136 OM NR @ 20.0% £209,827
Developers' profit on AH Dwgs (8% of AH build cost) £145,040 OM NR @ 8.0% £11,603
Total Build Cost & Developers Profit £765,330
Development costs finance (1 year) £543,900 Build Cost @ 8.0% per year £43,512
Project/design team fees (% of all construction) £543,900 Build Cost @ 12.0% £65,268
Total Build Cost, Fees & Developers Profit £874,110
CIL on OM floorspace 373 sqm @ £100 per sqm £37,296Developer contributions (non-CIL site-based strategic infrastructure - @ £500k/net ha, including S.106 costs - local highway improvements, PoS, etc)
0.20 ha @ £500,000 per ha £100,000
Extra over demolition/remediation 0.20 ha £200,000 £40,000
Total Additional Development Costs £177,296
2. Total Development Costs £1,051,406
Land Value
Interim land value realised at sale £1,238,414 TDV - £1,051,406 TDC £187,007
Estimated Purchase costs finance £187,007
Actual Purchase costs finance (avoiding circular calc) £168,300 @ 8.0% per year £13,464
Less acquisition fees £168,300 Land Value @ 2.0% £3,366
Less Stamp Duty land tax £168,300 @ 1.0% £1,683
3. Residual Land Value for Site £168,494
Residual Land Value per Hectare £842,471
Existing use value (EUV) £600,000 ha £120,000
Value added by consent £168,494 EUV - £120,000 £48,494
Uplift factor 1.40
Minimum Land Value/ha 500,000 100,000
Viability Summary
Viability Conclusion
Small PDL site at Shipston. Proposal is for 7 dwellings on 0.2 net ha (35dph); Affordable 28% of total units, new affordable rent product 20%, 20% intermediate, 60% social rent. Likely market mix to reflect both market for OM & AH adjusted to tak account of location/type of site: 0% 1-bed, 50% 2-bed, 50% 3-bed, 0% 4-bed, 0% 5-bed. The market appraisal indicates that this mix produces a total of 6090 sq.m of floorspace. Average sales values based on housing market analysis estimated at £2,900/sq.m. New Build all-in costs estimated at £950/sq.m all in, with additional 5% contingency, on-site infrastructure, no Code 5 build costs.
Land value of £168k (£842k/net ha), with no CSH5 costs. Viability test against 1) EUV of £120k = uplift of £48k, x 1.4 therefore passes Viability Test. Conclusion - viable, on the basis that site-based infrastructure is set at £500k/net ha, and with CIL at £100/sq.m.

CIL Economic Stratford-on-Avon CIL
Appendix 2: Non-Residential Viability Appraisals
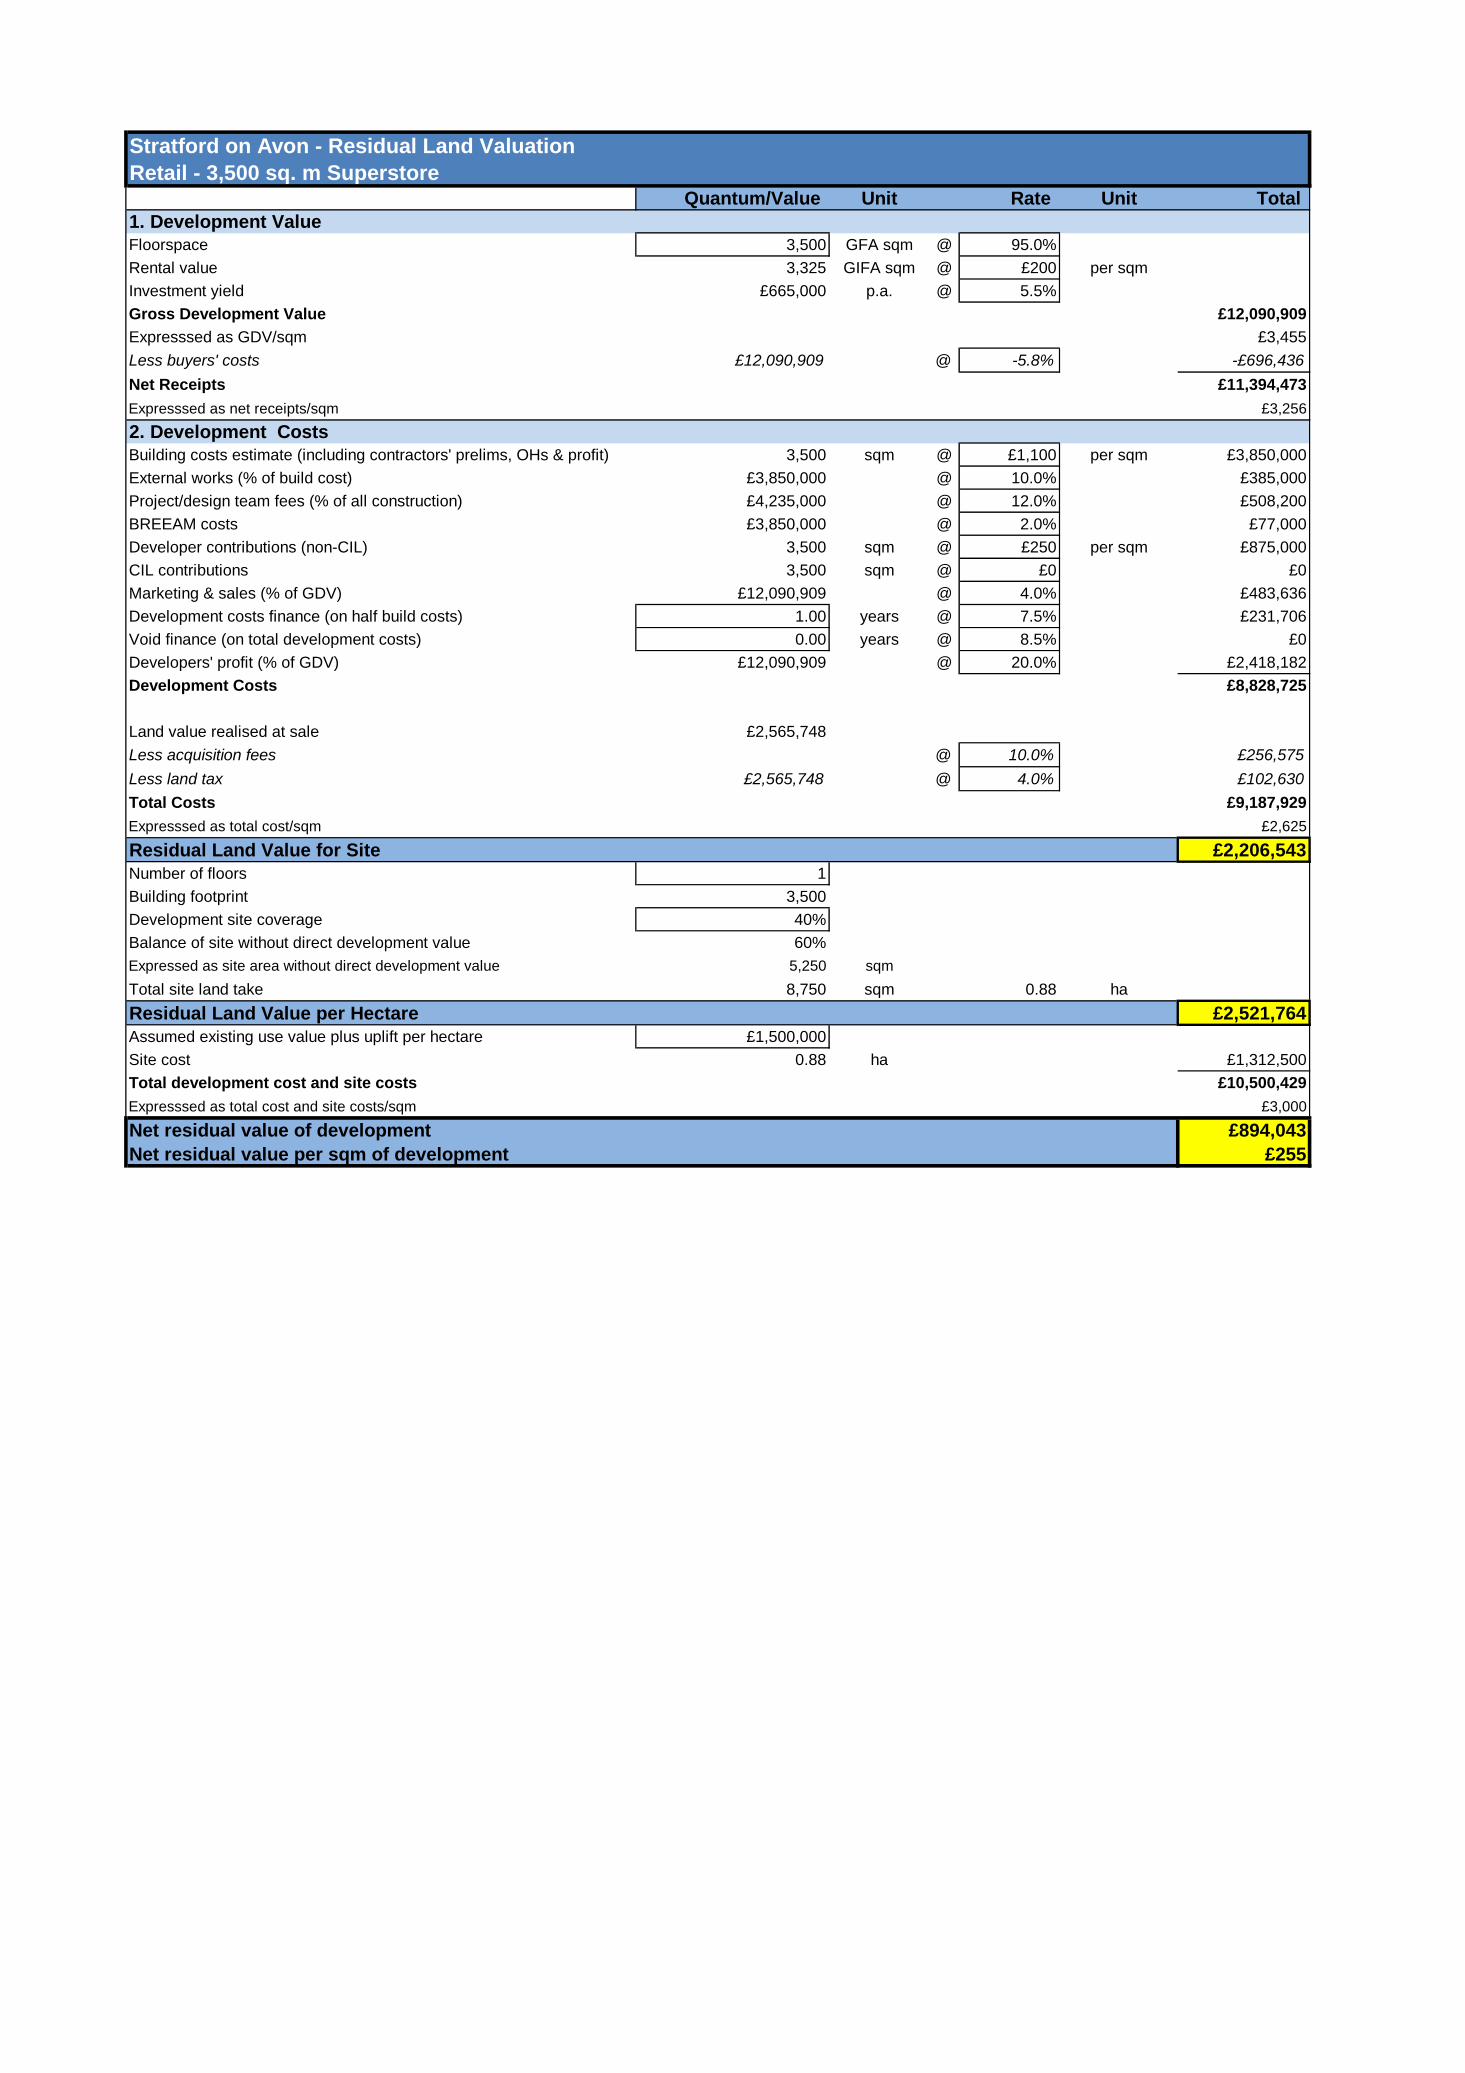
Stratford on Avon - Residual Land Valuation
Retail - 3,500 sq. m SuperstoreQuantum/Value Unit Rate Unit Total
1. Development Value
Floorspace 3,500 GFA sqm @ 95.0%
Rental value 3,325 GIFA sqm @ £200 per sqm
Investment yield £665,000 p.a. @ 5.5%
Gross Development Value £12,090,909
Expresssed as GDV/sqm £3,455
Less buyers' costs £12,090,909 @ -5.8% -£696,436
Net Receipts £11,394,473
Expresssed as net receipts/sqm £3,256
2. Development Costs
Building costs estimate (including contractors' prelims, OHs & profit) 3,500 sqm @ £1,100 per sqm £3,850,000
External works (% of build cost) £3,850,000 @ 10.0% £385,000
Project/design team fees (% of all construction) £4,235,000 @ 12.0% £508,200
BREEAM costs £3,850,000 @ 2.0% £77,000
Developer contributions (non-CIL) 3,500 sqm @ £250 per sqm £875,000
CIL contributions 3,500 sqm @ £0 £0
Marketing & sales (% of GDV) £12,090,909 @ 4.0% £483,636
Development costs finance (on half build costs) 1.00 years @ 7.5% £231,706
Void finance (on total development costs) 0.00 years @ 8.5% £0
Developers' profit (% of GDV) £12,090,909 @ 20.0% £2,418,182
Development Costs £8,828,725
Land value realised at sale £2,565,748
Less acquisition fees @ 10.0% £256,575
Less land tax £2,565,748 @ 4.0% £102,630
Total Costs £9,187,929
Expresssed as total cost/sqm £2,625
Residual Land Value for Site £2,206,543
Number of floors 1
Building footprint 3,500
Development site coverage 40%
Balance of site without direct development value 60%
Expressed as site area without direct development value 5,250 sqm
Total site land take 8,750 sqm 0.88 ha
Residual Land Value per Hectare £2,521,764
Assumed existing use value plus uplift per hectare £1,500,000
Site cost 0.88 ha £1,312,500
Total development cost and site costs £10,500,429
Expresssed as total cost and site costs/sqm £3,000
Net residual value of development £894,043
Net residual value per sqm of development £255

Stratford on Avon - Residual Land Valuation
Supermarket 1,100 sqmQuantum Unit Rate Unit Total
1. Development ValueFloorspace 1,100 GFA sqm @ 95.0%
Rental value 1,045 GIFA sqm @ £190 per sqm
Investment yield £198,550 p.a. @ 5.7%
Gross Development Value £3,483,333
Expresssed as GDV/sqm £3,167
Less buyers' costs £3,483,333 @ -5.8% -£200,640
Net Receipts £3,282,693
Expresssed as net receipts/sqm £2,984
2. Development CostsBuilding costs estimate (including contractors' prelims, OHs & profit) 1,100 sqm @ £1,100 per sqm £1,210,000
External works (% of build cost) £1,210,000 @ 10.0% £121,000
Project/design team fees (% of all construction) £1,331,000 @ 12.0% £159,720
BREEAM costs £1,210,000 @ 2.0% £24,200
Developer contributions (non-CIL) 1,100 sqm @ £125 per sqm £137,500
CIL contributions 1,100 sqm @ £0 £0
Marketing & sales (% of GDV) £3,483,333 @ 4.0% £139,333
Development costs finance (on half build costs) 1.00 years @ 7.5% £67,191
Void finance (on total development costs) 0.00 years @ 8.5% £0
Developers' profit (% of GDV) £3,483,333 @ 20.0% £696,667
Development Costs £2,555,611
Land value realised at sale £727,083
Less acquisition fees @ 10.0% £72,708
Less land tax £727,083 @ 4.0% £29,083
Total Costs £2,657,402
Expresssed as total cost/sqm £2,416
Residual Land Value for Site £625,291Number of floors 1
Building footprint 1,100
Development site coverage 40%
Balance of site without direct development value 60%
Expressed as site area without direct development value 1,650 sqm
Total site land take 2,750 sqm 0.28 ha
Residual Land Value per Hectare £2,273,786Assumed existing use value plus uplift per hectare £1,500,000
Site cost 0.28 ha £412,500
Total development cost and site costs £3,069,902
Expresssed as total cost and site costs/sqm £2,791
Net residual value of development £212,791
Net residual value per sqm of development £193

Stratford on Avon - Residual Land Valuation
Local Convenience Retail - 280 sq. m Quantum Unit Rate Unit Total
1. Development ValueFloorspace 280 GFA sqm @ 95.0%
Rental value 266 GIFA sqm @ £150 per sqm
Investment yield £39,900 p.a. @ 6.0%
Gross Development Value £665,000
Expresssed as GDV/sqm £2,375
Less buyers' costs £665,000 @ -5.8% -£38,304
Net Receipts £626,696
Expresssed as net receipts/sqm £2,238
2. Development CostsBuilding costs estimate (including contractors' prelims, OHs & profit) 280 sqm @ £1,000 per sqm £280,000
External works (% of build cost) £280,000 @ 10.0% £28,000
Project/design team fees (% of all construction) £308,000 @ 12.0% £36,960
BREEAM costs £280,000 @ 2.0% £5,600
Developer contributions (non-CIL) 280 sqm @ £25 per sqm £7,000
CIL contributions 280 sqm @ £0 £0
Marketing & sales (% of GDV) £665,000 @ 4.0% £26,600
Development costs finance (on half build costs) 1.00 years @ 7.5% £14,406
Void finance (on total development costs) 0.00 years @ 8.5% £0
Developers' profit (% of GDV) £665,000 @ 20.0% £133,000
Development Costs £531,566
Land value realised at sale £95,130
Less acquisition fees @ 10.0% £9,513
Less land tax £95,130 @ 4.0% £3,805
Total Costs £544,884
Expresssed as total cost/sqm £1,946
Residual Land Value for Site £81,812Number of floors 1
Building footprint 280
Development site coverage 80%
Balance of site without direct development value 20%
Expressed as site area without direct development value 70 sqm
Total site land take 350 sqm 0.04 ha
Residual Land Value per Hectare £2,337,480Assumed existing use value plus uplift per hectare £1,000,000
Site cost 0.04 ha £35,000
Total development cost and site costs £579,884
Expresssed as total cost and site costs/sqm £2,071
Net residual value of development £46,812
Net residual value per sqm of development £167
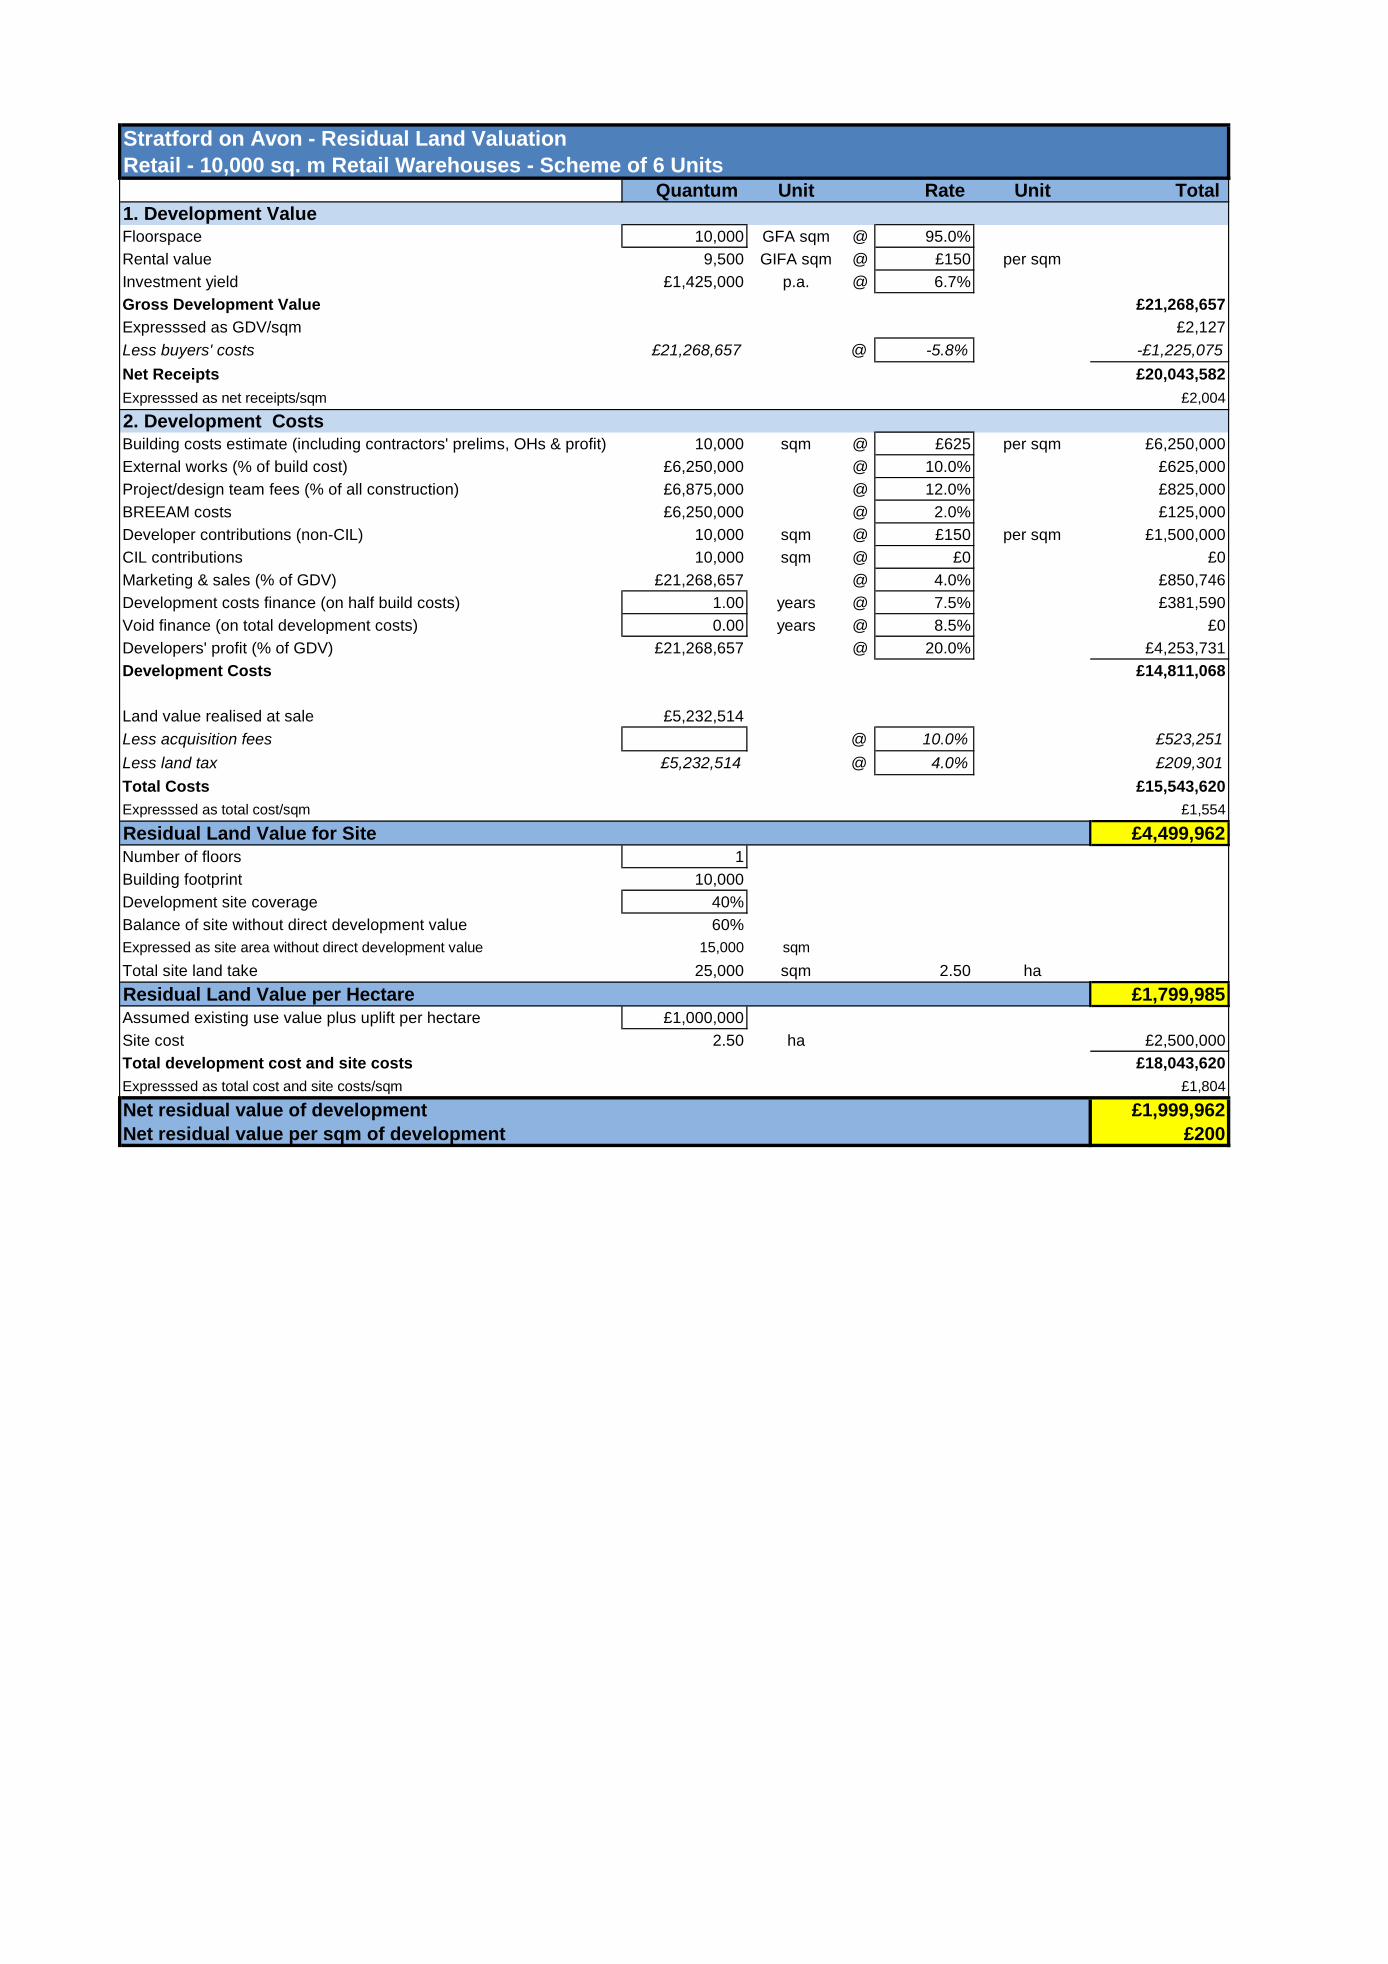
Stratford on Avon - Residual Land Valuation
Retail - 10,000 sq. m Retail Warehouses - Scheme of 6 UnitsQuantum Unit Rate Unit Total
1. Development ValueFloorspace 10,000 GFA sqm @ 95.0%
Rental value 9,500 GIFA sqm @ £150 per sqm
Investment yield £1,425,000 p.a. @ 6.7%
Gross Development Value £21,268,657
Expresssed as GDV/sqm £2,127
Less buyers' costs £21,268,657 @ -5.8% -£1,225,075
Net Receipts £20,043,582
Expresssed as net receipts/sqm £2,004
2. Development CostsBuilding costs estimate (including contractors' prelims, OHs & profit) 10,000 sqm @ £625 per sqm £6,250,000
External works (% of build cost) £6,250,000 @ 10.0% £625,000
Project/design team fees (% of all construction) £6,875,000 @ 12.0% £825,000
BREEAM costs £6,250,000 @ 2.0% £125,000
Developer contributions (non-CIL) 10,000 sqm @ £150 per sqm £1,500,000
CIL contributions 10,000 sqm @ £0 £0
Marketing & sales (% of GDV) £21,268,657 @ 4.0% £850,746
Development costs finance (on half build costs) 1.00 years @ 7.5% £381,590
Void finance (on total development costs) 0.00 years @ 8.5% £0
Developers' profit (% of GDV) £21,268,657 @ 20.0% £4,253,731
Development Costs £14,811,068
Land value realised at sale £5,232,514
Less acquisition fees @ 10.0% £523,251
Less land tax £5,232,514 @ 4.0% £209,301
Total Costs £15,543,620
Expresssed as total cost/sqm £1,554
Residual Land Value for Site £4,499,962
Number of floors 1
Building footprint 10,000
Development site coverage 40%
Balance of site without direct development value 60%
Expressed as site area without direct development value 15,000 sqm
Total site land take 25,000 sqm 2.50 ha
Residual Land Value per Hectare £1,799,985
Assumed existing use value plus uplift per hectare £1,000,000
Site cost 2.50 ha £2,500,000
Total development cost and site costs £18,043,620
Expresssed as total cost and site costs/sqm £1,804
Net residual value of development £1,999,962
Net residual value per sqm of development £200

Stratford on Avon - Residual Land Valuation
Retail - 1000 sq. m Stratford Town CentreQuantum Unit Rate Unit Total
1. Development ValueFloorspace 1,000 GFA sqm @ 95.0%
Rental value 950 GIFA sqm @ £260 per sqm
Investment yield £247,000 p.a. @ 7.5%
Gross Development Value £3,293,333
Expresssed as GDV/sqm £3,293
Less buyers' costs £3,293,333 @ -5.8% -£189,696
Net Receipts £3,103,637
Expresssed as net receipts/sqm £3,104
2. Development CostsBuilding costs estimate (including contractors' prelims, OHs & profit) 1,000 sqm @ £1,200 per sqm £1,200,000
External works (% of build cost) £1,200,000 @ 10.0% £120,000
Project/design team fees (% of all construction) £1,320,000 @ 12.0% £158,400
BREEAM costs £1,200,000 @ 2.0% £24,000
Developer contributions (non-CIL) 1,000 sqm @ £50 per sqm £50,000
CIL contributions 1,000 sqm @ £0 £0
Marketing & sales (% of GDV) £3,293,333 @ 4.0% £131,733
Development costs finance (on half build costs) 1.00 years @ 7.5% £63,155
Void finance (on total development costs) 0.00 years @ 8.5% £0
Developers' profit (% of GDV) £3,293,333 @ 20.0% £658,667
Development Costs £2,405,955
Land value realised at sale £697,682
Less acquisition fees @ 10.0% £69,768
Less land tax £697,682 @ 4.0% £27,907
Total Costs £2,503,631
Expresssed as total cost/sqm £2,504
Residual Land Value for Site £600,007Number of floors 1
Building footprint 1,000
Development site coverage 80%
Balance of site without direct development value 20%
Expressed as site area without direct development value 250 sqm
Total site land take 1,250 sqm 0.13 ha
Residual Land Value per Hectare £4,800,054Assumed existing use value plus uplift per hectare £5,000,000
Site cost 0.13 ha £625,000
Total development cost and site costs £3,128,631
Expresssed as total cost and site costs/sqm £3,129
Net residual value of development -£24,993
Net residual value per sqm of development -£25

Stratford on Avon - Residual Land Valuation
Office - 800 sqm Town Centre B1Quantum Unit Rate Unit Total
1. Development ValueFloorspace 800 GFA sqm @ 95.0%
Rental value 760 GIFA sqm @ £120 per sqm
Investment yield £91,200 p.a. @ 8.7%
Gross Development Value £1,048,276
Expresssed as GDV/sqm £1,310
Less buyers' costs £1,048,276 @ -5.8% -£60,381
Net Receipts £987,895
Expresssed as net receipts/sqm £1,235
2. Development CostsBuilding costs estimate (including contractors' prelims, OHs & profit) 800 sqm @ £1,200 per sqm £960,000
External works (% of build cost) £960,000 @ 10.0% £96,000
Project/design team fees (% of all construction) £1,056,000 @ 12.0% £126,720
BREEAM costs £960,000 @ 2.0% £19,200
Developer contributions (non-CIL) 800 sqm @ £50 per sqm £40,000
CIL contributions 800 sqm @ £0 £0
Marketing & sales (% of GDV) £1,048,276 @ 4.0% £41,931
Development costs finance (on half build costs) 1.00 years @ 7.5% £48,144
Void finance (on total development costs) 0.00 years @ 7.5% £0
Developers' profit (% of GDV) £1,048,276 @ 20.0% £209,655
Development Costs £1,541,651
Land value realised at sale -£553,755
Less acquisition fees @ 10.0% £3,333
Less land tax -£553,755 @ 4.0% £1,333
Total Costs £1,546,317
Expresssed as total cost/sqm £1,933
Residual Land Value for Site -£558,422Number of floors 3
Building footprint 267
Development site coverage 80%
Balance of site without direct development value 20%
Expressed as site area without direct development value 67 sqm
Total site land take 333 sqm 0.03 ha
Residual Land Value per Hectare -£16,752,663Assumed existing use value plus uplift per hectare £1,000,000
Site cost 0.03 ha £33,333
Total development cost and site costs £1,579,651
Expresssed as total cost and site costs/sqm £1,975
Net residual value of development -£591,755
Net residual value per sqm of development -£740

Stratford on Avon - Residual Land Valuation
Office - 2000 sq. m Business Park B1Quantum Unit Rate Unit Total
1. Development ValueFloorspace 2,000 GFA sqm @ 95.0%
Rental value 1,900 GIFA sqm @ £120 per sqm
Investment yield £228,000 p.a. @ 7.3%
Gross Development Value £3,123,288
Expresssed as GDV/sqm £1,562
Less buyers' costs £3,123,288 @ -5.8% -£179,901
Net Receipts £2,943,386
Expresssed as net receipts/sqm £1,472
2. Development CostsBuilding costs estimate (including contractors' prelims, OHs & profit) 2,000 sqm @ £1,200 per sqm £2,400,000
External works (% of build cost) £2,400,000 @ 10.0% £240,000
Project/design team fees (% of all construction) £2,640,000 @ 12.0% £316,800
BREEAM costs £2,400,000 @ 2.0% £48,000
Developer contributions (non-CIL) 2,000 sqm @ £50 per sqm £100,000
CIL contributions 2,000 sqm @ £0 £0
Marketing & sales (% of GDV) £3,123,288 @ 4.0% £124,932
Development costs finance (on half build costs) 1.00 years @ 7.5% £121,115
Void finance (on total development costs) 0.00 years @ 7.5% £0
Developers' profit (% of GDV) £3,123,288 @ 20.0% £624,658
Development Costs £3,975,504
Land value realised at sale -£1,032,118
Less acquisition fees @ 10.0% £15,000
Less land tax -£1,032,118 @ 4.0% £6,000
Total Costs £3,996,504
Expresssed as total cost/sqm £1,998
Residual Land Value for Site -£1,053,118Number of floors 2
Building footprint 1,000
Development site coverage 40%
Balance of site without direct development value 60%
Expressed as site area without direct development value 1,500 sqm
Total site land take 2,500 sqm 0.25 ha
Residual Land Value per Hectare -£4,212,471Assumed existing use value plus uplift per hectare £600,000
Site cost 0.25 ha £150,000
Total development cost and site costs £4,146,504
Expresssed as total cost and site costs/sqm £2,073
Net residual value of development -£1,203,118
Net residual value per sqm of development -£602

Stratford on Avon - Residual Land Valuation
Industrial - 1500 sq. m B2 - Edge of TownQuantum Unit Rate Unit Total
1. Development ValueFloorspace 1,500 GFA sqm @ 95.0%
Rental value 1,425 GIFA sqm @ £55 per sqm
Investment yield £78,375 p.a. @ 9.0%
Gross Development Value £870,833
Expresssed as GDV/sqm £581
Less buyers' costs £870,833 @ -5.8% -£50,160
Net Receipts £820,673
Expresssed as net receipts/sqm £547
2. Development CostsBuilding costs estimate (including contractors' prelims, OHs & profit) 1,500 sqm @ £740 per sqm £1,110,000
External works (% of build cost) £1,110,000 @ 10.0% £111,000
Project/design team fees (% of all construction) £1,221,000 @ 12.0% £146,520
BREEAM costs £1,110,000 @ 2.0% £22,200
Developer contributions (non-CIL) 1,500 sqm @ £50 per sqm £75,000
CIL contributions 1,500 sqm @ £0 £0
Marketing & sales (% of GDV) £870,833 @ 4.0% £34,833
Development costs finance (on half build costs) 1.00 years @ 7.5% £56,233
Void finance (on total development costs) 0.00 years @ 7.5% £0
Developers' profit (% of GDV) £870,833 @ 20.0% £174,167
Development Costs £1,729,953
Land value realised at sale -£909,280
Less acquisition fees @ 10.0% £18,750
Less land tax -£909,280 @ 4.0% £7,500
Total Costs £1,756,203
Expresssed as total cost/sqm £1,171
Residual Land Value for Site -£935,530Number of floors 1
Building footprint 1,500
Development site coverage 40%
Balance of site without direct development value 60%
Expressed as site area without direct development value 2,250 sqm
Total site land take 3,750 sqm 0.38 ha
Residual Land Value per Hectare -£2,494,746Assumed existing use value plus uplift per hectare £500,000
Site cost 0.38 ha £187,500
Total development cost and site costs £1,943,703
Expresssed as total cost and site costs/sqm £1,296
Net residual value of development -£1,123,030
Net residual value per sqm of development -£749

Stratford on Avon - Residual Land Valuation
Industrial - 5,000 sq. m B2 - Edge of TownQuantum Unit Rate Unit Total
1. Development ValueFloorspace 5,000 GFA sqm @ 95.0%
Rental value 4,750 GIFA sqm @ £55 per sqm
Investment yield £261,250 p.a. @ 9.0%
Gross Development Value £2,902,778
Expresssed as GDV/sqm £581
Less buyers' costs £2,902,778 @ -5.8% -£167,200
Net Receipts £2,735,578
Expresssed as net receipts/sqm £547
2. Development CostsBuilding costs estimate (including contractors' prelims, OHs & profit) 5,000 sqm @ £560 per sqm £2,800,000
External works (% of build cost) £2,800,000 @ 10.0% £280,000
Project/design team fees (% of all construction) £3,080,000 @ 12.0% £369,600
BREEAM costs £2,800,000 @ 2.0% £56,000
Developer contributions (non-CIL) 5,000 sqm @ £50 per sqm £250,000
CIL contributions 5,000 sqm @ £0 £0
Marketing & sales (% of GDV) £2,902,778 @ 4.0% £116,111
Development costs finance (on half build costs) 1.00 years @ 7.5% £145,189
Void finance (on total development costs) 0.00 years @ 7.5% £0
Developers' profit (% of GDV) £2,902,778 @ 20.0% £580,556
Development Costs £4,597,456
Land value realised at sale -£1,861,878
Less acquisition fees @ 10.0% £62,500
Less land tax -£1,861,878 @ 4.0% £25,000
Total Costs £4,684,956
Expresssed as total cost/sqm £937
Residual Land Value for Site -£1,949,378Number of floors 1
Building footprint 5,000
Development site coverage 40%
Balance of site without direct development value 60%
Expressed as site area without direct development value 7,500 sqm
Total site land take 12,500 sqm 1.25 ha
Residual Land Value per Hectare -£1,559,502Assumed existing use value plus uplift per hectare £500,000
Site cost 1.25 ha £625,000
Total development cost and site costs £5,309,956
Expresssed as total cost and site costs/sqm £1,062
Net residual value of development -£2,574,378
Net residual value per sqm of development -£515
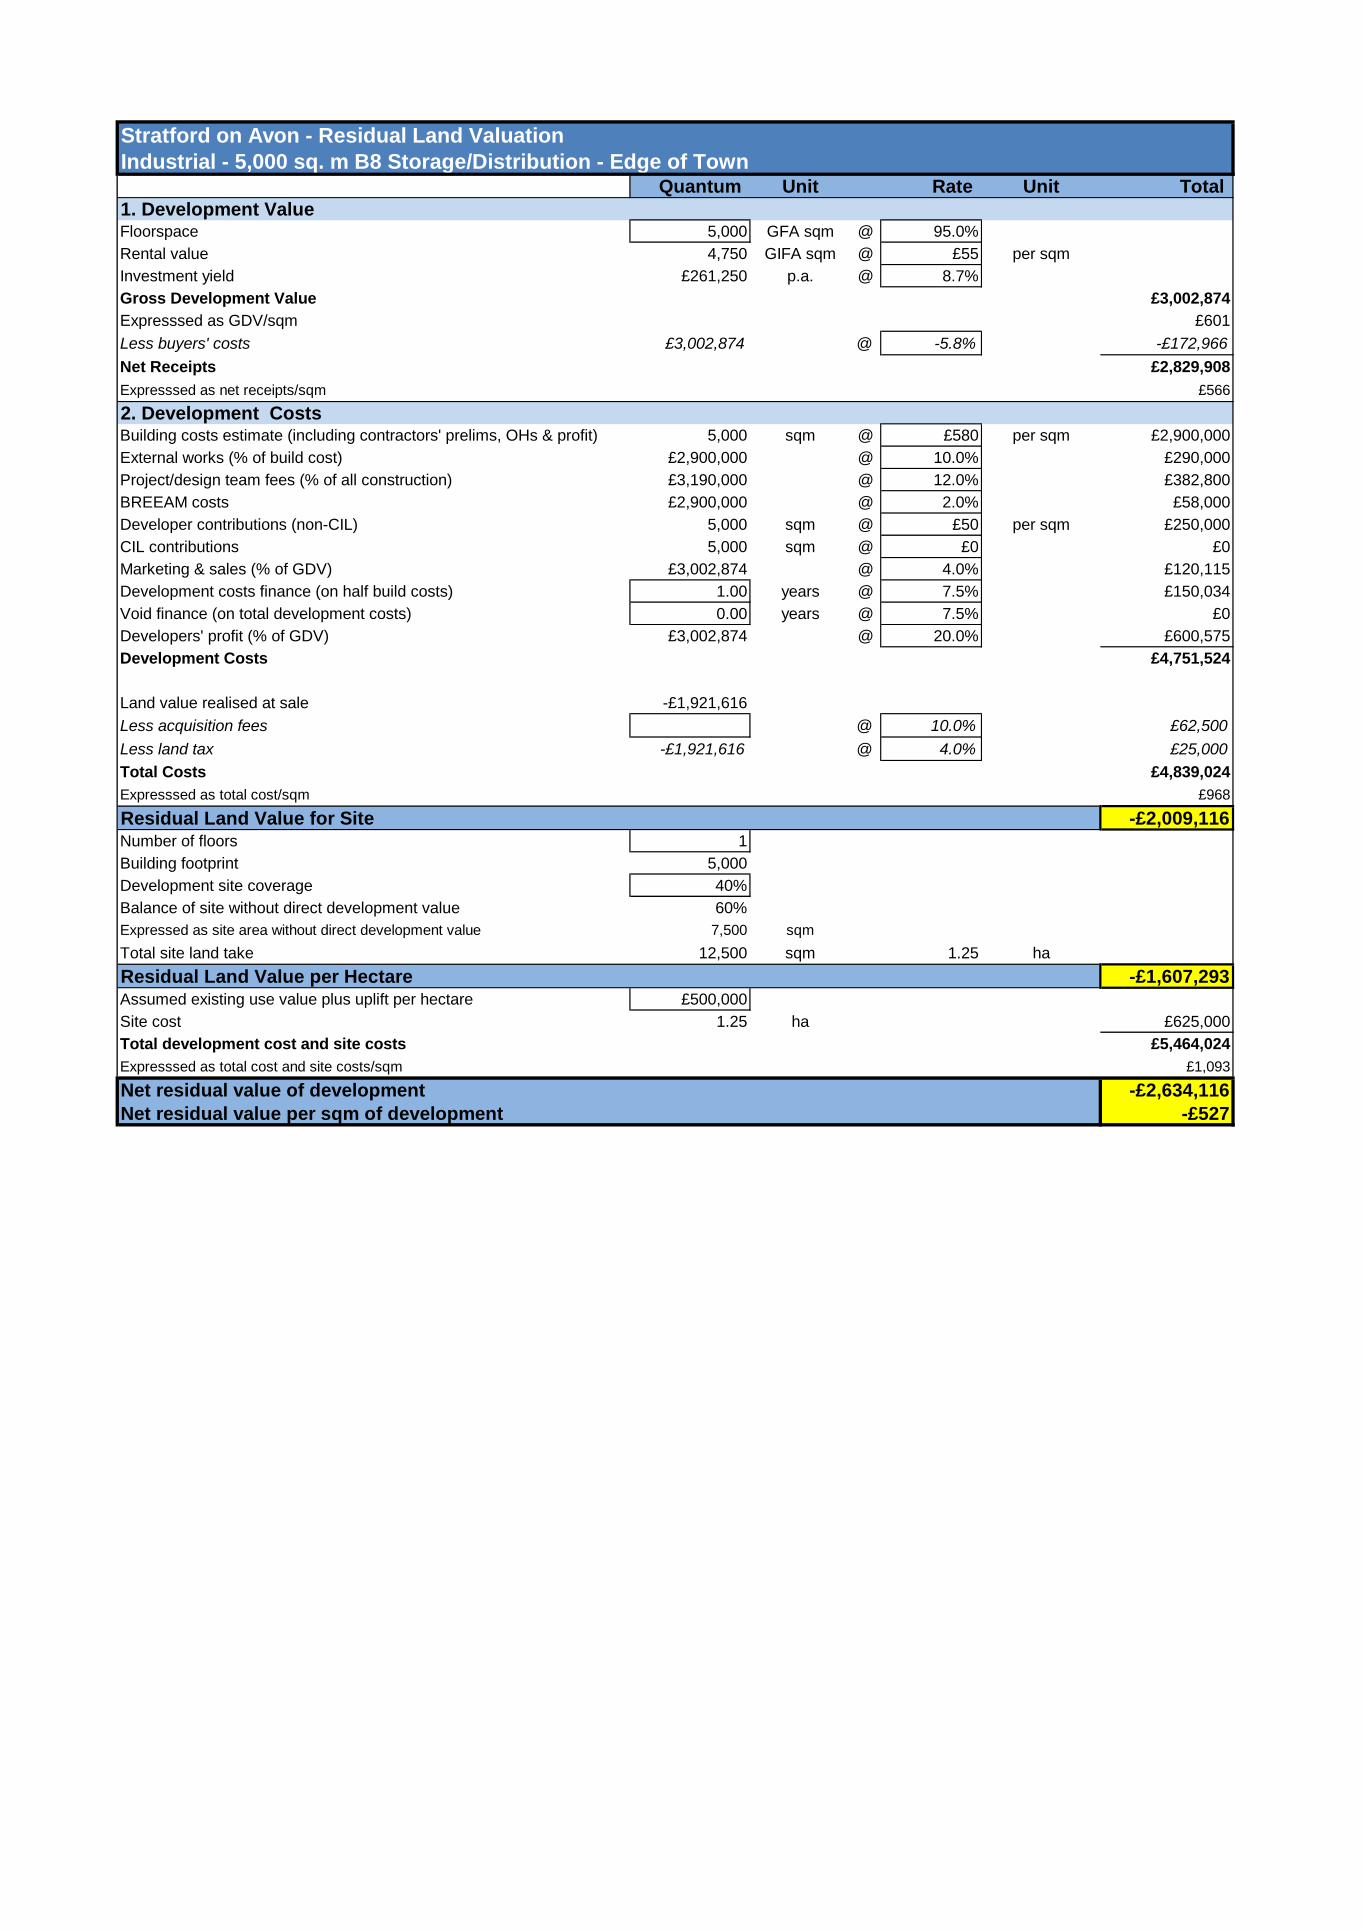
Stratford on Avon - Residual Land Valuation
Industrial - 5,000 sq. m B8 Storage/Distribution - Edge of TownQuantum Unit Rate Unit Total
1. Development ValueFloorspace 5,000 GFA sqm @ 95.0%
Rental value 4,750 GIFA sqm @ £55 per sqm
Investment yield £261,250 p.a. @ 8.7%
Gross Development Value £3,002,874
Expresssed as GDV/sqm £601
Less buyers' costs £3,002,874 @ -5.8% -£172,966
Net Receipts £2,829,908
Expresssed as net receipts/sqm £566
2. Development CostsBuilding costs estimate (including contractors' prelims, OHs & profit) 5,000 sqm @ £580 per sqm £2,900,000
External works (% of build cost) £2,900,000 @ 10.0% £290,000
Project/design team fees (% of all construction) £3,190,000 @ 12.0% £382,800
BREEAM costs £2,900,000 @ 2.0% £58,000
Developer contributions (non-CIL) 5,000 sqm @ £50 per sqm £250,000
CIL contributions 5,000 sqm @ £0 £0
Marketing & sales (% of GDV) £3,002,874 @ 4.0% £120,115
Development costs finance (on half build costs) 1.00 years @ 7.5% £150,034
Void finance (on total development costs) 0.00 years @ 7.5% £0
Developers' profit (% of GDV) £3,002,874 @ 20.0% £600,575
Development Costs £4,751,524
Land value realised at sale -£1,921,616
Less acquisition fees @ 10.0% £62,500
Less land tax -£1,921,616 @ 4.0% £25,000
Total Costs £4,839,024
Expresssed as total cost/sqm £968
Residual Land Value for Site -£2,009,116Number of floors 1
Building footprint 5,000
Development site coverage 40%
Balance of site without direct development value 60%
Expressed as site area without direct development value 7,500 sqm
Total site land take 12,500 sqm 1.25 ha
Residual Land Value per Hectare -£1,607,293Assumed existing use value plus uplift per hectare £500,000
Site cost 1.25 ha £625,000
Total development cost and site costs £5,464,024
Expresssed as total cost and site costs/sqm £1,093
Net residual value of development -£2,634,116
Net residual value per sqm of development -£527

Stratford on Avon - Residual Land Valuation
Budget Hotel - 2000 sqm (60 bedrooms) - Edge of townQuantum Unit Rate Unit Total
1. Development ValueFloorspace 2,000 GFA sqm @ 95.0%
Rental value 1,900 GIFA sqm @ £103 per sqm
Investment yield £195,700 p.a. @ 6.6%
Gross Development Value £2,965,152
Expresssed as GDV/sqm £1,483
Less buyers' costs £2,965,152 @ -5.8% -£170,793
Net Receipts £2,794,359
Expresssed as net receipts/sqm £1,397
2. Development CostsBuilding costs estimate (including contractors' prelims, OHs & profit) 2,000 sqm @ £1,080 per sqm £2,160,000
External works (% of build cost) £2,160,000 @ 10.0% £216,000
Project/design team fees (% of all construction) £2,376,000 @ 12.0% £285,120
BREEAM costs £2,160,000 @ 2.0% £43,200
Developer contributions (non-CIL) 2,000 sqm @ £50 per sqm £100,000
CIL contributions 2,000 sqm @ £0 £0
Marketing & sales (% of GDV) £2,965,152 @ 4.0% £118,606
Development costs finance (on half build costs) 1.00 years @ 7.5% £109,610
Void finance (on total development costs) 0.00 years @ 7.5% £0
Developers' profit (% of GDV) £2,965,152 @ 20.0% £593,030
Development Costs £3,625,566
Land value realised at sale -£831,207
Less acquisition fees @ 10.0% £8,000
Less land tax -£831,207 @ 4.0% £3,200
Total Costs £3,636,766
Expresssed as total cost/sqm £1,818
Residual Land Value for Site -£842,407Number of floors 3
Building footprint 667
Development site coverage 50%
Balance of site without direct development value 50%
Expressed as site area without direct development value 667 sqm
Total site land take 1,333 sqm 0.13 ha
Residual Land Value per Hectare -£6,318,055Assumed existing use value plus uplift per hectare £600,000
Site cost 0.13 ha £80,000
Total development cost and site costs £3,716,766
Expresssed as total cost and site costs/sqm £1,858
Net residual value of development -£922,407
Net residual value per sqm of development -£461

Stratford on Avon - Residual Land Valuation
Mixed Leisure Scheme 8,000 sqm - cinema/bowlingQuantum Unit Rate Unit Total
1. Development ValueFloorspace 8,000 GFA sqm @ 95.0%
Rental value 7,600 GIFA sqm @ £149 per sqm
Investment yield £1,132,400 p.a. @ 6.6%
Gross Development Value £17,157,576
Expresssed as GDV/sqm £2,145
Less buyers' costs £17,157,576 @ -5.8% -£988,276
Net Receipts £16,169,299
Expresssed as net receipts/sqm £2,021
2. Development CostsBuilding costs estimate (including contractors' prelims, OHs & profit) 8,000 sqm @ £1,400 per sqm £11,200,000
External works (% of build cost) £11,200,000 @ 10.0% £1,120,000
Project/design team fees (% of all construction) £12,320,000 @ 12.0% £1,478,400
BREEAM costs £11,200,000 @ 2.0% £224,000
Developer contributions (non-CIL) 8,000 sqm @ £50 per sqm £400,000
CIL contributions 8,000 sqm @ £0 £0
Marketing & sales (% of GDV) £17,157,576 @ 4.0% £686,303
Development costs finance (on half build costs) 1.00 years @ 7.5% £566,576
Void finance (on total development costs) 0.00 years @ 7.5% £0
Developers' profit (% of GDV) £17,157,576 @ 20.0% £3,431,515
Development Costs £19,106,795
Land value realised at sale -£2,937,495
Less acquisition fees @ 10.0% £48,000
Less land tax -£2,937,495 @ 4.0% £19,200
Total Costs £19,173,995
Expresssed as total cost/sqm £2,397
Residual Land Value for Site -£3,004,695Number of floors 2
Building footprint 4,000
Development site coverage 50%
Balance of site without direct development value 50%
Expressed as site area without direct development value 4,000 sqm
Total site land take 8,000 sqm 0.80 ha
Residual Land Value per Hectare -£3,755,869Assumed existing use value plus uplift per hectare £600,000
Site cost 0.80 ha £480,000
Total development cost and site costs £19,653,995
Expresssed as total cost and site costs/sqm £2,457
Net residual value of development -£3,484,695
Net residual value per sqm of development -£436
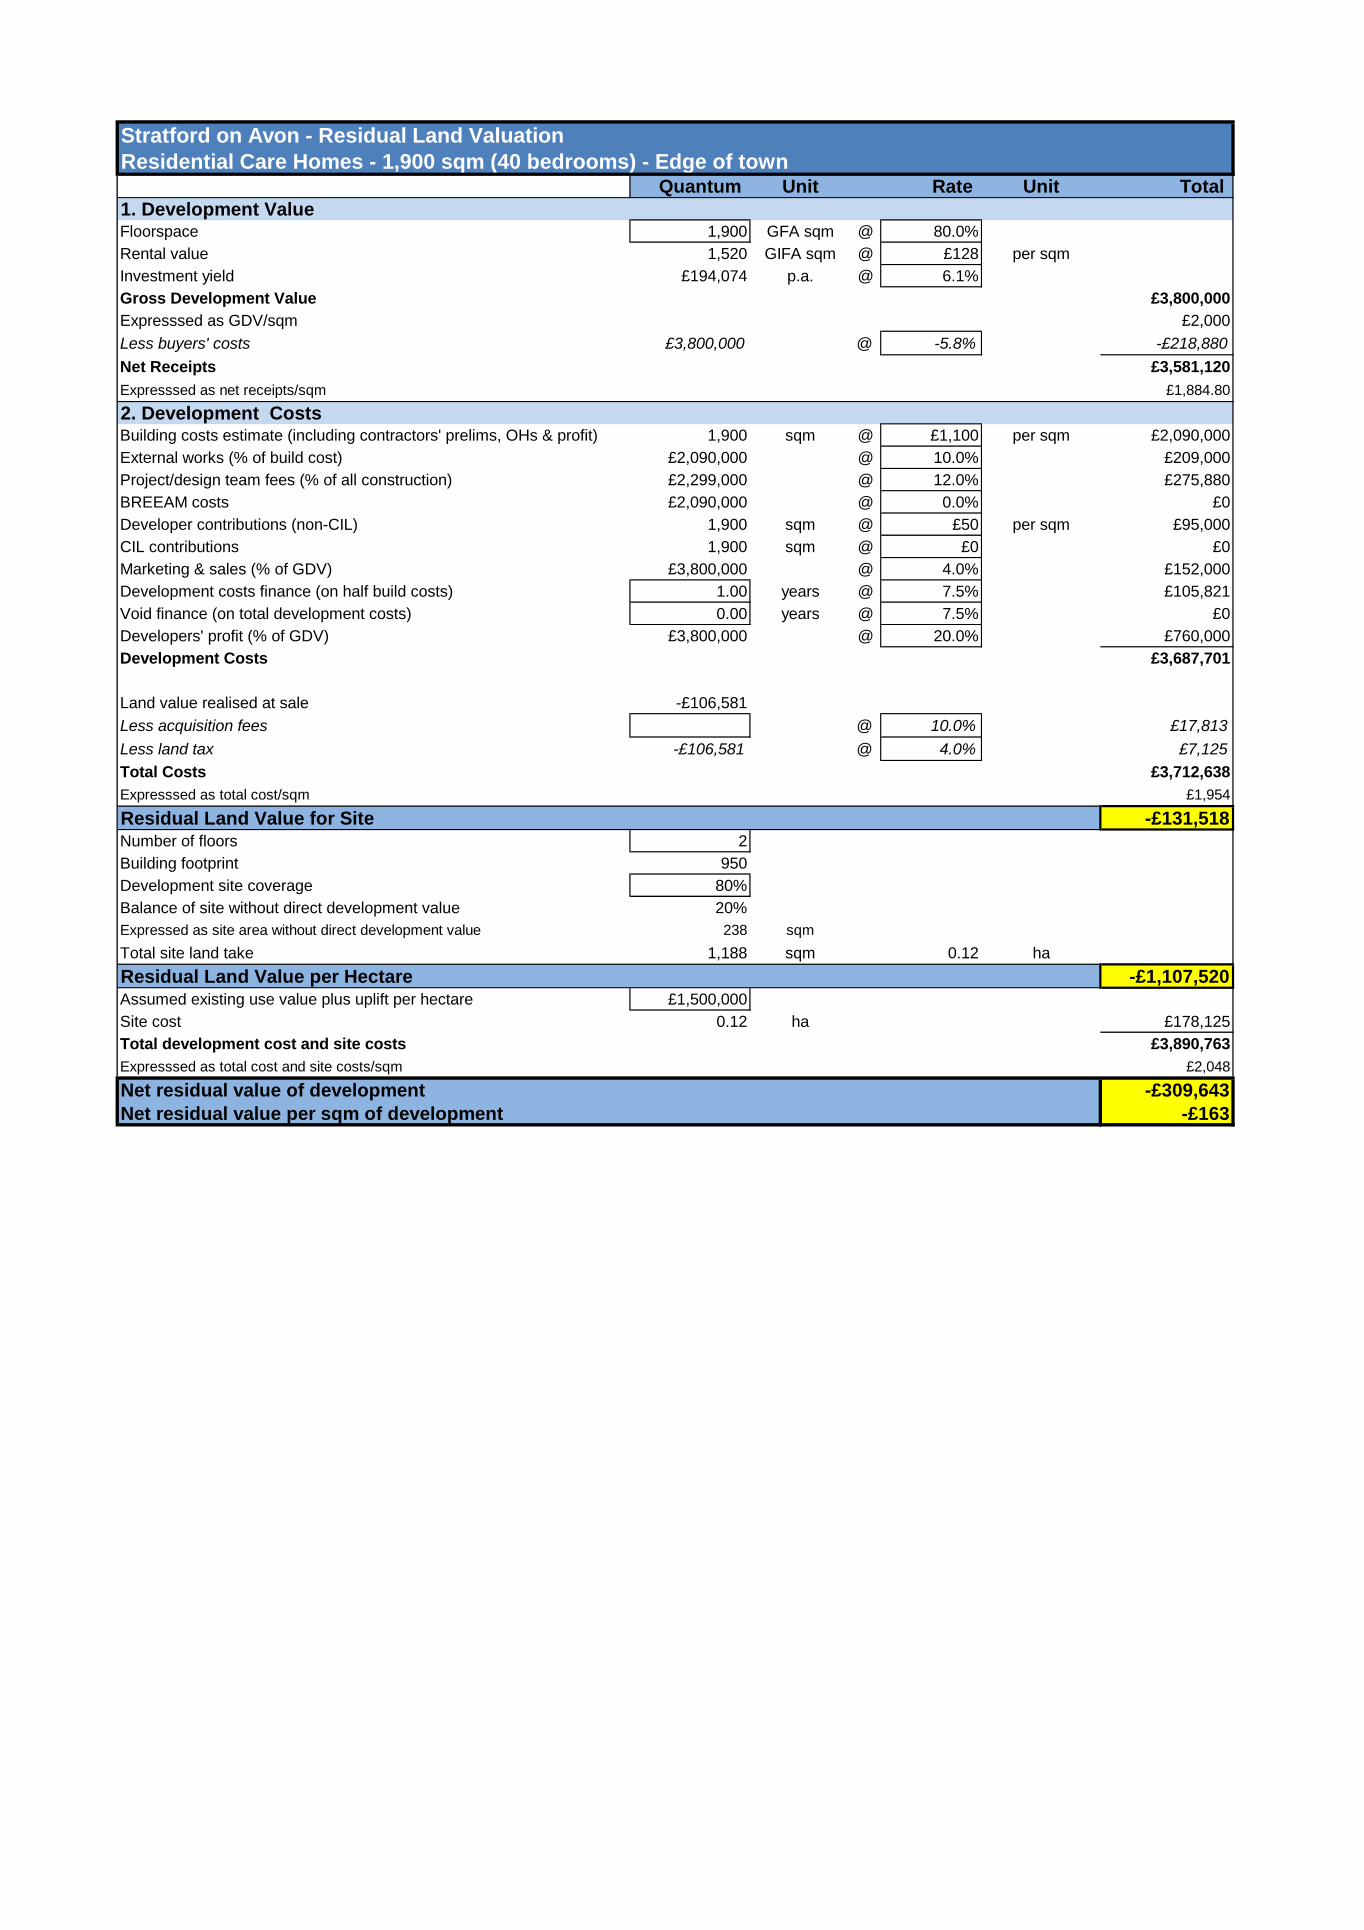
Stratford on Avon - Residual Land Valuation
Residential Care Homes - 1,900 sqm (40 bedrooms) - Edge of townQuantum Unit Rate Unit Total
1. Development ValueFloorspace 1,900 GFA sqm @ 80.0%
Rental value 1,520 GIFA sqm @ £128 per sqm
Investment yield £194,074 p.a. @ 6.1%
Gross Development Value £3,800,000
Expresssed as GDV/sqm £2,000
Less buyers' costs £3,800,000 @ -5.8% -£218,880
Net Receipts £3,581,120
Expresssed as net receipts/sqm £1,884.80
2. Development CostsBuilding costs estimate (including contractors' prelims, OHs & profit) 1,900 sqm @ £1,100 per sqm £2,090,000
External works (% of build cost) £2,090,000 @ 10.0% £209,000
Project/design team fees (% of all construction) £2,299,000 @ 12.0% £275,880
BREEAM costs £2,090,000 @ 0.0% £0
Developer contributions (non-CIL) 1,900 sqm @ £50 per sqm £95,000
CIL contributions 1,900 sqm @ £0 £0
Marketing & sales (% of GDV) £3,800,000 @ 4.0% £152,000
Development costs finance (on half build costs) 1.00 years @ 7.5% £105,821
Void finance (on total development costs) 0.00 years @ 7.5% £0
Developers' profit (% of GDV) £3,800,000 @ 20.0% £760,000
Development Costs £3,687,701
Land value realised at sale -£106,581
Less acquisition fees @ 10.0% £17,813
Less land tax -£106,581 @ 4.0% £7,125
Total Costs £3,712,638
Expresssed as total cost/sqm £1,954
Residual Land Value for Site -£131,518Number of floors 2
Building footprint 950
Development site coverage 80%
Balance of site without direct development value 20%
Expressed as site area without direct development value 238 sqm
Total site land take 1,188 sqm 0.12 ha
Residual Land Value per Hectare -£1,107,520Assumed existing use value plus uplift per hectare £1,500,000
Site cost 0.12 ha £178,125
Total development cost and site costs £3,890,763
Expresssed as total cost and site costs/sqm £2,048
Net residual value of development -£309,643
Net residual value per sqm of development -£163

Stratford on Avon - Residual Land Valuation
Assisted Living with no affordable housing - 4500 sqm (50 units) - Edge of town centreQuantum Unit Rate Unit Total
1. Development ValueFloorspace 4,500 GFA sqm @ 70.0%
GDV 3,150 GIFA sqm @ £3,000 per sqm
Gross Development Value £9,450,000
Expresssed as GDV/sqm £2,100
Less buyers' costs £9,450,000 @ -5.8% -£544,320
Net Receipts £8,905,680
Expresssed as net receipts/sqm £1,979.04
2. Development CostsBuilding costs estimate (including contractors' prelims, OHs & profit) 4,500 sqm @ £1,000 per sqm £4,500,000
External works (% of build cost) £4,500,000 @ 10.0% £450,000
Project/design team fees (% of all construction) £4,950,000 @ 12.0% £594,000
BREEAM costs £4,500,000 @ 0.0% £0
Developer contributions (non-CIL) 4,500 sqm @ £50 per sqm £225,000
CIL contributions 4,500 sqm @ £0 £0
Marketing & sales (% of GDV) £9,450,000 @ 5.0% £472,500
Development costs finance (on half build costs) 1.00 years @ 7.5% £234,056
Void finance (on total development costs) 0.00 years @ 7.5% £0
Developers' profit (% of GDV) £9,450,000 @ 20.0% £1,890,000
Development Costs £8,365,556
Land value realised at sale £540,124
Less acquisition fees @ 10.0% £54,012
Less land tax £540,124 @ 4.0% £21,605
Total Costs £8,441,174
Expresssed as total cost/sqm £1,876
Residual Land Value for Site £464,506Number of floors 2
Building footprint 2,250
Development site coverage 80%
Balance of site without direct development value 20%
Expressed as site area without direct development value 563 sqm
Total site land take 2,813 sqm 0.28 ha
Residual Land Value per Hectare £1,651,578Assumed existing use value plus uplift per hectare £1,000,000
Site cost 0.28 ha £281,250
Total development cost and site costs £8,722,424
Expresssed as total cost and site costs/sqm £1,938
Net residual value of development £183,256
Net residual value per sqm of development £41

Stratford on Avon - Residual Land Valuation
Assisted Living with no affordable housing - 4500 sqm (50 units) - GreenfieldQuantum Unit Rate Unit Total
1. Development ValueFloorspace 4,500 GFA sqm @ 70.0%
GDV 3,150 GIFA sqm @ £3,000 per sqm
Gross Development Value £9,450,000
Expresssed as GDV/sqm £2,100
Less buyers' costs £9,450,000 @ -5.8% -£544,320
Net Receipts £8,905,680
Expresssed as net receipts/sqm £1,979.04
2. Development CostsBuilding costs estimate (including contractors' prelims, OHs & profit) 4,500 sqm @ £1,000 per sqm £4,500,000
External works (% of build cost) £4,500,000 @ 10.0% £450,000
Project/design team fees (% of all construction) £4,950,000 @ 12.0% £594,000
BREEAM costs @ 0.0% £0
Developer contributions (non-CIL) 4,500 sqm @ £50 per sqm £225,000
CIL contributions 4,500 sqm @ £0 £0
Marketing & sales (% of GDV) £9,450,000 @ 5.0% £472,500
Development costs finance (on half build costs) 1.00 years @ 7.5% £234,056
Void finance (on total development costs) 0.00 years @ 7.5% £0
Developers' profit (% of GDV) £9,450,000 @ 20.0% £1,890,000
Development Costs £8,365,556
Land value realised at sale £540,124
Less acquisition fees @ 10.0% £54,012
Less land tax £540,124 @ 4.0% £21,605
Total Costs £8,441,174
Expresssed as total cost/sqm £1,876
Residual Land Value for Site £464,506Number of floors 2
Building footprint 2,250
Development site coverage 80%
Balance of site without direct development value 20%
Expressed as site area without direct development value 563 sqm
Total site land take 2,813 sqm 0.28 ha
Residual Land Value per Hectare £1,651,578Assumed existing use value plus uplift per hectare £500,000
Site cost 0.28 ha £140,625
Total development cost and site costs £8,581,799
Expresssed as total cost and site costs/sqm £1,907
Net residual value of development £323,881
Net residual value per sqm of development £72
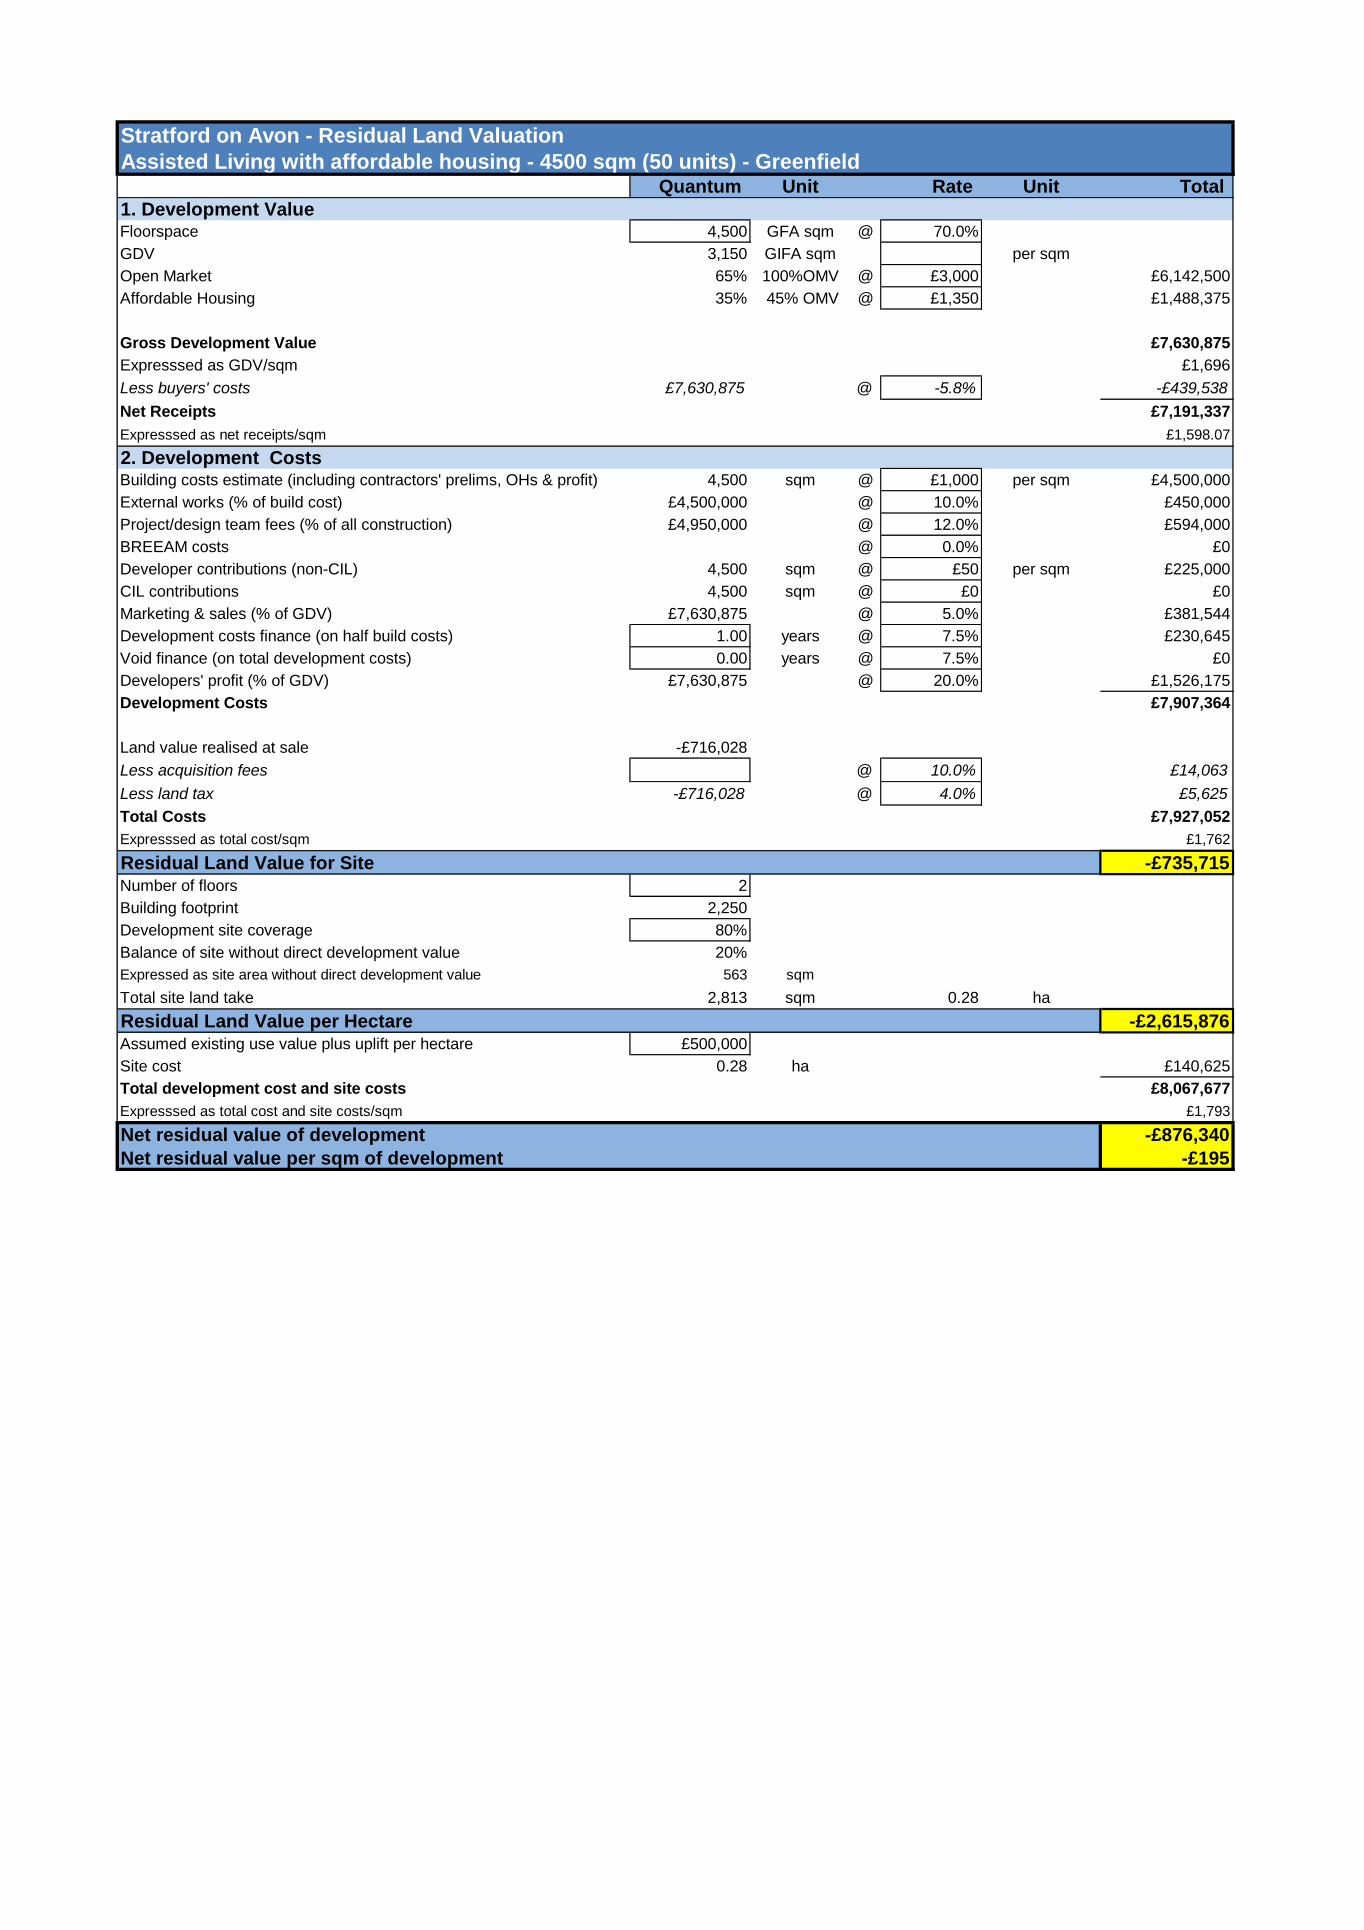
Stratford on Avon - Residual Land Valuation
Assisted Living with affordable housing - 4500 sqm (50 units) - GreenfieldQuantum Unit Rate Unit Total
1. Development ValueFloorspace 4,500 GFA sqm @ 70.0%
GDV 3,150 GIFA sqm per sqm
Open Market 65% 100%OMV @ £3,000 £6,142,500
Affordable Housing 35% 45% OMV @ £1,350 £1,488,375
Gross Development Value £7,630,875
Expresssed as GDV/sqm £1,696
Less buyers' costs £7,630,875 @ -5.8% -£439,538
Net Receipts £7,191,337
Expresssed as net receipts/sqm £1,598.07
2. Development CostsBuilding costs estimate (including contractors' prelims, OHs & profit) 4,500 sqm @ £1,000 per sqm £4,500,000
External works (% of build cost) £4,500,000 @ 10.0% £450,000
Project/design team fees (% of all construction) £4,950,000 @ 12.0% £594,000
BREEAM costs @ 0.0% £0
Developer contributions (non-CIL) 4,500 sqm @ £50 per sqm £225,000
CIL contributions 4,500 sqm @ £0 £0
Marketing & sales (% of GDV) £7,630,875 @ 5.0% £381,544
Development costs finance (on half build costs) 1.00 years @ 7.5% £230,645
Void finance (on total development costs) 0.00 years @ 7.5% £0
Developers' profit (% of GDV) £7,630,875 @ 20.0% £1,526,175
Development Costs £7,907,364
Land value realised at sale -£716,028
Less acquisition fees @ 10.0% £14,063
Less land tax -£716,028 @ 4.0% £5,625
Total Costs £7,927,052
Expresssed as total cost/sqm £1,762
Residual Land Value for Site -£735,715Number of floors 2
Building footprint 2,250
Development site coverage 80%
Balance of site without direct development value 20%
Expressed as site area without direct development value 563 sqm
Total site land take 2,813 sqm 0.28 ha
Residual Land Value per Hectare -£2,615,876Assumed existing use value plus uplift per hectare £500,000
Site cost 0.28 ha £140,625
Total development cost and site costs £8,067,677
Expresssed as total cost and site costs/sqm £1,793
Net residual value of development -£876,340
Net residual value per sqm of development -£195

Stratford on Avon - Residual Land Valuation
Health & Fitness - 4,000 sqm edge of townQuantum Unit Rate Unit Total
1. Development ValueFloorspace 4,000 GFA sqm @ 95.0%
Rental value 3,800 GIFA sqm @ £105 per sqm
Investment yield £399,000 p.a. @ 7.0%
Gross Development Value £5,700,000
Expresssed as GDV/sqm £1,425
Less buyers' costs £5,700,000 @ -5.8% -£328,320
Net Receipts £5,371,680
Expresssed as net receipts/sqm £1,343
2. Development CostsBuilding costs estimate (including contractors' prelims, OHs & profit) 4,000 sqm @ £1,150 per sqm £4,600,000
External works (% of build cost) £4,600,000 @ 10.0% £460,000
Project/design team fees (% of all construction) £5,060,000 @ 12.0% £607,200
BREEAM costs £4,600,000 @ 2.0% £92,000
Developer contributions (non-CIL) 4,000 sqm @ £50 per sqm £200,000
CIL contributions 4,000 sqm @ £0 £0
Marketing & sales (% of GDV) £5,700,000 @ 4.0% £228,000
Development costs finance (on half build costs) 1.00 years @ 7.5% £232,020
Void finance (on total development costs) 0.00 years @ 7.5% £0
Developers' profit (% of GDV) £5,700,000 @ 20.0% £1,140,000
Development Costs £7,559,220
Land value realised at sale -£2,187,540
Less acquisition fees @ 10.0% £30,000
Less land tax -£2,187,540 @ 4.0% £12,000
Total Costs £7,601,220
Expresssed as total cost/sqm £1,900
Residual Land Value for Site -£2,229,540Number of floors 1
Building footprint 4,000
Development site coverage 80%
Balance of site without direct development value 20%
Expressed as site area without direct development value 1,000 sqm
Total site land take 5,000 sqm 0.50 ha
Residual Land Value per Hectare -£4,459,080Assumed existing use value plus uplift per hectare £600,000
Site cost 0.50 ha £300,000
Total development cost and site costs £7,901,220
Expresssed as total cost and site costs/sqm £1,975
Net residual value of development -£2,529,540
Net residual value per sqm of development -£632
CIL Economic Stratford-on-Avon CIL
Appendix 3: Glossary
CIL Economic Stratford-on-Avon CIL
Affordable Housing
Housing provided for sale, rent or shared equity at prices in perpetuity below the current market rate,
which people in housing need are able to afford
Affordable Rent
Affordable rented housing is let by local authorities or private registered providers of social housing to
households who are eligible for social rented housing. Affordable Rent is subject to rent controls that
require a rent of no more than 80 per cent of the local market rent (including service charges, where
applicable).
Allocated
Land which has been identified for a specific use in the current Development Plan
Asset Management Plans
The means by which Service Providers such as water, energy and health authorities plan for future
investment
Brownfield Land, Brownfield Site
Land or site that has been subject to previous development
Charging Authority
The charging authority is the local planning authority, although it may distribute the received levy to
other infrastructure providers such as the county council in two tier authorities
Charging Schedule
The Charging Schedule sets out the charges the Charging Authority proposes to adopt for new
development
Code for Sustainable Homes
The Code for Sustainable Homes is an environmental assessment method for rating and certifying the
performance of new homes. It is a national standard for use in the design and construction of new
homes with a view to encouraging continuous improvement in sustainable home building
Convenience Goods
Widely distributed and relatively inexpensive goods which are purchased frequently and with minimum
of effort, such as newspapers and food items.

CIL Economic Stratford-on-Avon CIL
Comparison Goods
Household or personal items which are more expensive and are usually purchased after comparing
alternative models/types/styles and price of the item (e.g. clothes, furniture, electrical appliances).
Such goods generally are used for some time
Development
Defined in planning law as ‘the carrying out of building, engineering, mining or other operations in, on,
over, or under land, or the making of a material change of use of any building or land’
Development Brief
A document describing and leading the form and layout of development in a prescribed area
Green Infrastructure
Green spaces and interconnecting green corridors in urban areas, the countryside in and around
towns and rural settlements, and in the wider countryside. It includes natural green spaces colonised
by plants and animals and dominated by natural processes and man-made managed green spaces
such as areas used for outdoor sport and recreation including public and private open space,
allotments, urban parks and designed historic landscapes as well as their many interconnections like
footpaths, cycleways, green corridors and waterways
Infrastructure
The network of services to which it is usual for most buildings or activities to be connected. It includes
physical services serving the particular development (e.g. gas, electricity and water supply;
telephones, sewerage) and also includes networks of roads, public transport routes, footpaths etc. as
well as community facilities and green infrastructure
Intermediate Housing
Intermediate housing is homes for sale and rent provided at a cost above social rent, but below market
levels subject to the criteria in the Affordable Housing definition above. These can include shared
equity (shared ownership and equity loans), other low cost homes for sale and intermediate rent, but
not affordable rented housing. Homes that do not meet the above definition of affordable housing,
such as "low cost market" housing, may not be considered as affordable housing for planning
purposes.
Local Transport Plan (LTP)
A five-year integrated transport strategy, prepared by local authorities in partnership with the
community, seeking funding to help provide local transport projects. The plan sets out the resources
predicted for delivery of the targets identified in the strategy

CIL Economic Stratford-on-Avon CIL
Low Carbon
To minimise carbon dioxide emissions from a human activity
New Homes Bonus
The New Homes Bonus is a government funding scheme to ensure that the economic benefits of
growth are returned to the local area. It commenced in April 2011, and will match fund the additional
council tax raised for new homes and properties brought back into use, with an additional amount for
affordable homes, for the following six years
Planning Obligations
Legal agreements between a planning authority and a developer, or undertakings offered unilaterally
by a developer to ensure that specific works are carried out, payments made or other actions
undertaken which would otherwise be outside the scope of the planning permission. Often called
Section 106 (S106) obligations or contributions. The term legal agreements may embrace S106.
Regional Growth Fund
The Regional Growth Fund (RGF) is a £1.4bn fund operating across England from 2011 to 2014. It
supports projects and programmes that lever private sector investment creating economic growth and
sustainable employment
Renewable Energy
Energy generated from sources which are non-finite or can be replenished. Includes solar power, wind
energy, power generated from waste, biomass etc.
Section 106 (S106) Contributions
See Planning Obligations
Social Rent
Social rented housing is owned by local authorities and private registered providers (as defined in
section 80 of the Housing and Regeneration Act 2008), for which guideline target rents are determined
through the national rent regime. It may also be owned by other persons and provided under
equivalent rental arrangements to the above, as agreed with the local authority or with the Homes and
Communities Agency.
Use Classes and ‘Use’
The Town and Country Planning (Use Classes) Order, 1987, a statutory order made under planning
legislation, which groups land uses into different categories (called use classes). Change of within a
use class and some changes between classes do not require planning permission. Please note that
the definition of ‘use’ within the CIL regulations is meant in its wider sense and not in terms of the use
classes e.g. whilst a supermarket and a shop selling clothes are the same use in terms of the use

CIL Economic Stratford-on-Avon CIL
class system i.e. A1 – they are clearly a different use in terms of the CIL regulations as a store selling
only clothes is different from a store selling predominantly food.