community health needs assessment 2016, mercy care ... · community health needs assessment 2016....
TRANSCRIPT

Community Health Needs Assessment 2016 Mercy Care Chamblee Service Area

1 | P a g e
Contents I. Executive Summary ......................................................................................................................... 2
II. Introduction .................................................................................................................................... 4
III. Mercy Care’s Mission ...................................................................................................................... 6
IV. Approach to Assessment ................................................................................................................. 7
Community Definition ......................................................................................................................... 7
Community Input................................................................................................................................. 8
Secondary Data ................................................................................................................................... 9
Community Resource Inventory ........................................................................................................... 9
V. Summary of Findings ..................................................................................................................... 10
Priority 1: Access to Affordable Health Care for Uninsured and Underinsured Residents .................. 10
Priority 2: Integration of Primary and Behavioral Health Care Services ............................................. 10
Priority 3: Chronic Disease Prevention and Management .................................................................. 11
Priority 4: Coordinated, Culturally Sensitive, and Patient-Centered Care .......................................... 11
Priority 5: Community Engagement to Facilitate Social Cohesion and Wellness ................................. 12
Recommendations ............................................................................................................................ 13
Non-Clinic Related Opportunities to Invest in Community Dialogue................................................... 14
VI. Community Resident Input ........................................................................................................... 15
Purpose ............................................................................................................................................. 15
Methodology ..................................................................................................................................... 15
Characteristics ................................................................................................................................... 16
Recommendations ............................................................................................................................. 16
Summary ........................................................................................................................................... 17
VII. Community Leader Input ............................................................................................................. 22
Purpose ............................................................................................................................................. 22
Methodology ..................................................................................................................................... 22
Characteristics ................................................................................................................................... 22
Recommendations ............................................................................................................................. 22
Summary ........................................................................................................................................... 23
VIII. Secondary Data ........................................................................................................................... 27
IX. Community Resources to Meet Needs .......................................................................................... 41
X. Appendices ................................................................................................................................... 48

2 | P a g e
I. Executive Summary
Mercy Care is a Federally Qualified Health Center and Atlanta’s only Healthcare for the Homeless
program (330h). Mercy Care provides affordable and comprehensive health and healthcare services
to underinsured and uninsured residents throughout fourteen locations.
During a three month period, Mercy Care contracted with the Georgia Health Policy Center to
collect primary and secondary data to assess the health needs of residents of its Chamblee, Georgia,
service area—a contiguous group of 22 zip codes in DeKalb, Fulton, and Gwinnett counties. The
information will help inform the design of programs and services that will be offered Mercy Care's
new clinic opening early 2017 in Chamblee. The new clinic will serve the patient population receiving
care at the Buford Highway location (Mercy Care North) while expanding programs and services.
The assessment was developed using secondary health data pulled from sources in the public
domain (e.g. Georgia Department of Public Health Online Analytical Statistical Information System -
OASIS) reinforced by primary data and information collected from residents, community leaders,
providers and public health experts through key informant interviews, focus groups, and
community listening sessions.
While the health status and outcomes of residents living in DeKalb, Fulton, and Gwinnett counties
rank relatively higher than that of people living in many other counties throughout the state, there
are communities within these counties themselves with poor and disparate health outcomes linked
to significant health risks and challenging socioeconomic conditions.
In the Mercy Care North service area:
The majority of the population is between 35 and 54 years of age and very racially and ethnically
diverse. In the Chamblee area, almost 60% of the population identifies as Latino, 38% are
foreign born, and 48% speak a language other than English at home. Many residents in the
service area have identified themselves as Hispanic and immigrant.
One in four people live at, or below, the federal poverty level. Extreme poverty is present in the
service area, particularly concentrated along the I-85 corridor and near Chamblee and Norcross.
Children in poverty follow a similar pattern, with high rates along Buford Highway in the
southern part of the service area.
There are relatively low levels of educational attainment. In one census tract adjacent to the site
of the proposed clinic, over 50% of adults have not obtained a high school diploma or equivalent
certification.
As is common throughout the rest of the county, chronic disease conditions and their risk
factors (including obesity and tobacco use) continue to be a significant health burden.
Increased barriers to healthcare (from the Community Need Index) are most significant in
Tucker and Chamblee areas of DeKalb County. The zip codes with the highest barriers to
accessing healthcare are:
o 30340 (Doraville)
o 30360 (Atlanta)

3 | P a g e
o 30093 & 30071 (Norcross)
o 30084 (Tucker)
o 30329 (North Druid Hills)
o 30341 (Chamblee)
Five thematic health needs or priorities emerged from an analysis of both the primary and secondary
data in the assessment.
Priority 1: Access to affordable health and health care services for uninsured and underinsured
residents
Priority 2: Integration of primary care and behavioral health care services
Priority 3: Chronic disease prevention and management (e.g. obesity, diabetes, asthma,
cardiovascular disease, etc.)
Priority 4: Patient-centered, coordinated, and holistic care
Priority 5: Community engagement to increase knowledge, awareness, and healthy behaviors
Stakeholders made several recommendations about actions to address these priorities and broaden the
scope of services to be provided in the new clinic facility. These include:
Continue to provide ongoing outpatient wellbeing and healthcare services particularly to
vulnerable populations;
Use community and clinical approaches to address prevention, treatment, and coordination of
care for patients with chronic disease;
Ensure and/or facilitate access to appropriate treatment options, particularly affordable and
effective prescription medications and treatments;
Address other access issues related to transportation to and from clinic and service provision
(including translation) after normal working hours;
Track improvements to access and outcomes over time by conducting community health needs
assessments at regular intervals;
Focus on an approach to integrating primary care and behavioral services that considers life
stage (i.e. substance abuse in teens, depression in seniors etc.) in care management;
Include pastoral/spiritual counseling as part of treatment and coping protocols;
Build trust and value cultural competency in providers; engage more providers and staff who are
reflective of the diversity of the community and who can provide or facilitate services to non-
English speaking clients;
Use health education sessions to address burdensome health challenges including chronic
diseases- nutrition, physical activity, obesity, diabetes, hypertension and cancer screening
Use clinic physical infrastructure to build trust, engage the community (space for community
meetings), and provide support for family members during client visit (e.g. child care, etc.).
The findings of this assessment are reinforcing of the qualitative study that was conducted by Emory
University students in the fall of 2015.

4 | P a g e
II. Introduction
The Buford Highway corridor is home to a diverse population, many of whom are hard-working
immigrant families. For more than ten years, Mercy Care North, located in the Northeast Plaza
Shopping Center, has served the working poor of this community and is the only Federally Qualified
Health Center (FQHC) in the immediate area. Mercy Care North (MCN) provides care to 3,300 patients
per year – which amounts to more than 11,000 office visits – yet demand for affordable, comprehensive
care far exceeds the clinic’s capacity.
To meet the great need for healthcare services in this part of Atlanta, Mercy Care purchased property in
January 2015 near the Chamblee MARTA station and began construction of a 45,000-square-foot
healthcare facility. The building will house a clinic, community health education center, and
administrative offices.
The new clinic will accommodate 12 examination rooms, four dental operatories, and space for lab
services and is expected to enable Mercy Care to double its service capacity. When service capacity is
fully realized, it is expected that primary care will be available for up to 5,500 patients annually – a
potential volume of 16,000 primary care, dental, and behavioral health office visits.1
Over the past three months, Mercy Care and the Georgia Health Policy Center worked to collect data to assess
the health needs of residents to inform the programs and services to be offered in the new Chamblee clinic.
Mercy Care collaborated with the following organizations throughout the assessment:
The Latin American Association
Holy Spirit Catholic Center
Our Lady of the Americas Catholic Mission
Senior Connections
Mercy Housing
La Amistad After School Program
Kaiser Permanente of Georgia
Children's Healthcare of Atlanta
Gwinnett County Administration
The City of Chamblee
Futbol Pasion
The Georgia House of Representatives
Catholic Charities of Atlanta
The Center for Pan Asian Community Services (CPACS)
Emory-Saint Joseph’s Hospital
Society of St. Vincent de Paul
1 The Intersection of Hope and Healing, A Campaign for Mercy Care Chamblee; (Website 4/12/16)
http://mercyatlanta.org/Case_for_Support_MCC_6_23_15_reduced.pdf

5 | P a g e
Findings from a recent pre-assessment study completed by Emory University Public Health students,
aimed at understanding the support for the Mercy Care North clinic (MCN) showed that "many of the
needs of the Hispanic community are being met by MCN, including affordable, culturally, and
linguistically competent care. The vast majority of patients are pleased with the care they receive at the
clinic and will continue attending the clinic after its relocation to Chamblee. They are also looking
forward to the clinic expansion and the services this will provide them in terms of increased pediatric
care and a larger space in which to conduct health education classes".
Participants in that effort believed that there was a need for more flexible walk-in appointment hours,
child care services, and a larger variety of mental and behavioral health classes. They also were hopeful
for shorter wait times, a move linked to improved quality of services provided by the clinic.
Mercy Care seeks to understand the needs of the clients served, and has completed this assessment
process to accurately comprehend and better serve the needs identified.
This report provides a summary of the secondary and primary data collected and the community-driven
recommendations to inform programs and services.

6 | P a g e
III. Mercy Care’s Mission
Our mission is to honor the heritage and advance the ministry of the Sisters of Mercy by providing excellent healthcare to poor and marginalized persons. We promise to continue to serve with compassion and excellence those who are poor, marginalized, and unable to access healthcare. We will bring our hearts to work. Our fundamentals are compassion, commitment to the poor, excellence, integrity, justice, stewardship, and reverence for the dignity of each person. We are rich with workers, volunteers, board members, collaborators, funders; excellent facilities and vehicle fleets; and professional and technological expertise. Our approach is collaborative, purposeful, restorative, innovative,
transforming, respectful, hopeful, integrated, joyful, comprehensive, efficient, and effective.
Since 1985, Mercy Care has been operating to "restore vulnerable individuals in the community through
powerful outreach programs that care for body, mind and spirit. We provide preventive and curative
services to Atlanta's homeless and poor with some of the highest needs, all the while seeking to make a
positive difference in their lives and the overall wellbeing of the city.
Mercy Care is focused on providing compassionate, high-quality, comprehensive primary care and
health services to the poor. For these patients, the cost of traditional medical care is overwhelming and
sometimes exclusionary. Mercy Care embraces the patients often deemed “undesirable” by society. Of
the 11,392 patients who received care from all Mercy Care clinic sites in 2015, 62% were homeless, 88%
were uninsured, and 84% were living at, or below, the Federal Poverty Level.
The organization, which is a Mission Health Ministry of Trinity Health Systems following the health
system's merger with Catholic Health East, is also a member of the Atlanta Safety Net collaborative, a
group of providers committed to coordination of care for indigent patients. In this partnership, Mercy
Care providers occasionally render onsite medical care at partner locations and Mercy Care clients are
provided with additional services at these locations (e.g. Grady Health System). Mercy Care is an active
member of the Atlanta Regional Collaborative for Health Improvement
Many of Mercy Care's "services" are supported by community outreach programs. One of its flagship
programs - the Community Homeless Outreach Program (CHOP) attempts to meet the needs of street
bound homeless individuals by providing referrals for critical housing, medical, and behavioral health
services. Direct care to this population is made possible through the Street Medicine program supported
by doctors who travel to find and care for patients experiencing homelessness.
Mercy Care's mission is accomplished through dedicated professionals serving at 15 locations in metro
Atlanta. Key domains of service include:
Primary Care o Preventive Care
o Chronic Care
o Health Screenings
Pediatrics o Preventative & Routine
Care
o Well Child Services
o Developmental Screenings
Dental & Vision o Routine Examinations
o Tooth Extractions
o Eye Exams & Glasses
Health Education o Community Classes
o Patient Groups
o Individual Sessions
Behavioral Health
o Counseling and Medication
o Substance Abuse
o Case Management
HIV Integrated Treatment o Enrollment
o Medication Management
o Case Management

7 | P a g e
30075
30350
30328 30338
30342 30319
30329
30092
30071
30096
30043
30046 30045
30047
30044
30093
30084
30340
30360
30341
30345
30346
IV. Approach to Assessment
With input from a core group of Mercy Care providers and staff, the Georgia Health Policy Center
designed and facilitated a comprehensive community health needs assessment process with a focus on
the expressed needs of residents living in the service area. The assessment process valued input from
residents and leaders alike, representing the broad interests of communities served by Mercy Care.
Community Definition
Though the focus of the assessment was the construction of the new clinic, the community was defined
as the broader service area or region of the current Mercy Care North Clinic. The service region consists
of 22 zip codes throughout DeKalb, Fulton, and Gwinnett Counties. (See map and table below). These zip
codes were selected because they are home to approximately 80% of MCN's current clients, and the
new clinic location is expected to expand access within this region.
8 | P a g e
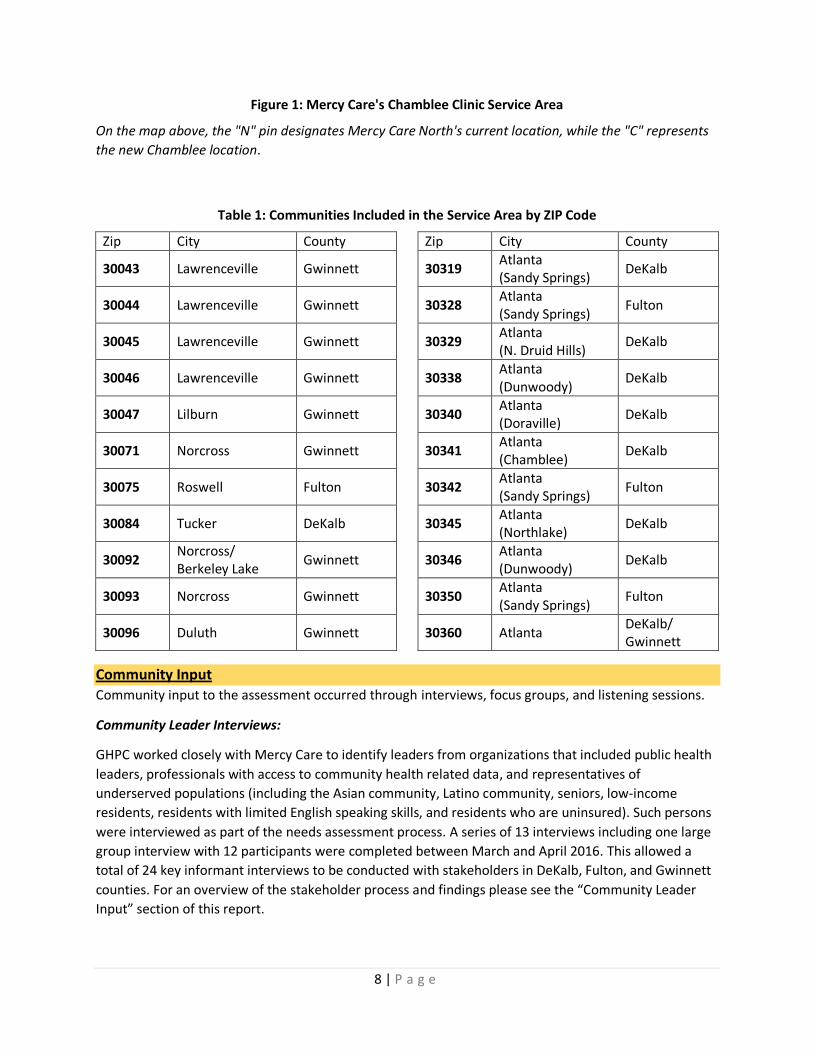
Figure 1: Mercy Care's Chamblee Clinic Service Area
On the map above, the "N" pin designates Mercy Care North's current location, while the "C" represents
the new Chamblee location.
Table 1: Communities Included in the Service Area by ZIP Code
Zip City County Zip City County
30043 Lawrenceville Gwinnett 30319 Atlanta (Sandy Springs)
DeKalb
30044 Lawrenceville Gwinnett 30328 Atlanta (Sandy Springs)
Fulton
30045 Lawrenceville Gwinnett 30329 Atlanta (N. Druid Hills)
DeKalb
30046 Lawrenceville Gwinnett 30338 Atlanta (Dunwoody)
DeKalb
30047 Lilburn Gwinnett 30340 Atlanta (Doraville)
DeKalb
30071 Norcross Gwinnett 30341 Atlanta (Chamblee)
DeKalb
30075 Roswell Fulton 30342 Atlanta (Sandy Springs)
Fulton
30084 Tucker DeKalb 30345 Atlanta (Northlake)
DeKalb
30092 Norcross/ Berkeley Lake
Gwinnett 30346 Atlanta (Dunwoody)
DeKalb
30093 Norcross Gwinnett 30350 Atlanta (Sandy Springs)
Fulton
30096 Duluth Gwinnett 30360 Atlanta DeKalb/ Gwinnett
Community Input
Community input to the assessment occurred through interviews, focus groups, and listening sessions.
Community Leader Interviews:
GHPC worked closely with Mercy Care to identify leaders from organizations that included public health
leaders, professionals with access to community health related data, and representatives of
underserved populations (including the Asian community, Latino community, seniors, low-income
residents, residents with limited English speaking skills, and residents who are uninsured). Such persons
were interviewed as part of the needs assessment process. A series of 13 interviews including one large
group interview with 12 participants were completed between March and April 2016. This allowed a
total of 24 key informant interviews to be conducted with stakeholders in DeKalb, Fulton, and Gwinnett
counties. For an overview of the stakeholder process and findings please see the “Community Leader
Input” section of this report.
9 | P a g e
Resident Focus Groups and Listening Sessions:
Three focus groups and four listening sessions were conducted across the wider Mercy Care community
between January and March 2016. Focus group audiences were identified using secondary data to
surface the areas and target populations with overlapping health needs and deficits. Specific focus
group participants included:
• Latino residents
• Women in prenatal
education class
• Korean residents
• Senior citizens
• Residents of
Chamblee, GA
Secondary Data GHPC staff completed a comprehensive analysis of health status, socio-economic, and environmental
factors related to the health of the community from existing data sources such as the Georgia Online
Analytical Statistical Information System (OASIS), the U.S. Census Bureau, the Centers for Disease
Control and Prevention, Health Indicators Warehouse, County Health Rankings, the Community Needs
Index of Truven, the Behavioral Risk Factors Surveillance System, Community Commons, and other data
sources. The data was used to generate maps to help tell the story of where challenges to health and
wellbeing are still an issue in the service area.
Community Resource Inventory In an attempt to fully understand local assets and gaps in services, the GHPC also conducted an
environmental scan of the community resources that are currently available to residents. Additionally
this scan will be helpful in identifying the types of partnerships that may have to be built or
strengthened to support improved health outcomes in these communities.

10 | P a g e
V. Summary of Findings
The area included in this study covered a large geographic region, spanning some of the most diverse
communities in the state. The study area is represented by rapidly growing populations of varying
ethnicities, ages, incomes, education levels, cultures, and languages. Many of the areas’ health
challenges are the result of interdependent social determinants of health such as: socio-economic status
(represented by income, education, and housing), geographic location, immigration status, country of
origin, culture, and ability to speak English.
Five thematic health needs or priorities emerged from both the primary and secondary data in the
assessment. They are presented below along with stakeholder recommendations for action:
Priority 1: Access to affordable health and health care services for uninsured and underinsured residents
There is a large and growing population of immigrants in the clinic service area whose income and legal
status restricts their access to health insurance and subsequently many types of health care services.
Women who lack citizenship often lack access to prenatal care. Latino community members
participating in primary data collection activities were most often uninsured and unconnected to
medical homes. Data shows that there are pockets of poverty in DeKalb, Fulton, and Gwinnett Counties
where socio-economic indicators correlate strongly with poor health outcomes. Primary data collected
during this assessment indicates that there is a need for access to affordable health services, including
pharmaceutical, primary, pediatric, and oral health care. Primary data also highlighted the need for
affordable access to specialty care (orthopedic, oncology, etc.) for underinsured and uninsured
residents, including residents who are not legal citizens and persons experiencing homelessness. The
lack of access to health insurance and care may be, at least in part, driving the health disparities found in
communities in the study area.
Priority 2: Integration of primary and behavioral health care services
Unmet behavioral health care needs is one of the most discussed health priorities across the country and the Mercy Care study area is no exception. Currently Mercy Care offers behavioral health services, including: counseling, medication, substance abuse, and case management. Data collected during the assessment validated the need for an increase in behavioral health and substance abuse services across the continuum of care.
Residents recognized that behavioral health was a need that cut across demographic and geographic
parameters. Residents often discussed the need for behavioral health services for adolescents, adults,
and seniors. Study participants discussed mental health issues often related to the prevalence of
substance abuse among adolescents, stress in adult populations, and depression among senior
populations. Discussions focused largely on the lack of resources in general for underinsured/uninsured
people regardless of age and resistance to seek care due to the stigma associated with behavioral health
diagnoses. Stakeholders discussed the need for a continuum of behavioral health services, citing a
dearth of available referral sources in their communities.
11 | P a g e
Priority 3: Chronic disease prevention and management (e.g. obesity, diabetes, asthma, cardiovascular disease) According to the Georgia Department of Public Health, chronic diseases—such as asthma, cancer,
diabetes and heart disease—cost Georgia approximately $40 billion each year, keep children out of
school, and result in more than 200,000 years of potential life lost annually.2 Chronic disease prevention
and management were cited as major health issues, particularly for the Latino population. The most
commonly discussed chronic diseases were diabetes, obesity, cardiovascular issues, high blood pressure,
hypertension, and pediatric asthma. The underlying causal factors discussed are described below:
Poor nutrition – Community input indicated that residents often:
Do not have access to affordable healthy food due to the limited number of affordable grocery stores and/or lack of transportation.
Have cultural dietary preferences that are not healthy (i.e. fried foods, foods high in fat and sugar, habits of eating before bedtime, etc.).
Are not always aware of how to prepare foods.
Do not have the time to prepare healthy food.
Are not aware of the impact of poor nutrition.
Lack of physical exercise – Community input indicated that residents:
May not have access to resources that facilitate healthy physical activity.
May not be aware of the impact that physical activity/no physical activity can have on health status.
May not know how to engage in a healthy level of physical activity.
Priority 4: Offering coordinated, culturally sensitive, and patient-centered care
Patient-centered care shows up throughout the data linked to diversity, language of preference, cultural
practices/traditions/beliefs, convenience of office hours, the inclusion of faith in primary care settings,
and access to transportation. Mercy Care is recognized as a Patient-Centered Medical Home (PCMH) and
seeks to build and maintain trusting relationships with community leaders, churches, and relevant
community-based organizations in the study area. According to the data, there are growing immigrant
and refugee populations that do not speak English and/or speak English as a second language. Both
stakeholders and residents whose native language was not English discussed the need for health
services to be provided in the patient’s language of origin as often as possible. Such action would
minimize challenges with translation of health terminology, which might lead to misunderstanding of
diagnosis and/or treatment recommendations. They specified that the need for service provision in a
first language extends beyond medical care and includes outreach services, health education, printed
materials, and more.
2 Years of potential life lost (YPLL) is an estimate of the average years a person would have lived if he or she had
not died prematurely (before age 75 years). It is, therefore, a measure of premature mortality - Georgia Department of Public Health, Chronic Disease Prevention, (Website 4/12/16) https://dph.georgia.gov/chronic-disease-prevention

12 | P a g e
Study participants talked about the importance of being able to receive care and services, including
translation services, in their communities after traditional operating hours (Monday through Friday, 8
AM - 5/6 PM). Community members also discussed a cultural preference among Latino and Asian
populations for alternative medicine and medical practices to be considered as part of their care. Many
participants indicated that they were open to participating in health education sessions, though others
perceived that some undocumented segments of the Latinos community might avoid public events,
including health education sessions and health fairs, out of fear of deportation.
Respondents also identified transportation to and from the clinic as a significant issue. Public
transportation is not always reliable, affordable, and/or accessible for residents, which can lead to
inconsistency in appointment attendance.
Priority 5: Community engagement to facilitate social cohesion and wellness
Community engagement is integral to the health of the community, especially one that is so diverse.
Isolation challenges are present due to lack of trust and awareness of community resources. More
specifically, community members may not naturally gravitate to a new clinic or new location and may
not be aware of the plans for relocation.
Many participants report that Mercy Care has a longstanding, trusted relationship in the community and
suggest that the system should seize opportunities to deepen the trust between providers and the
community in the Chamblee area, in order for the providers to effectively meet the needs of residents.
This will require outreach efforts to engage community members both on site at the clinic and offsite at
churches, civic meetings, and community events.

13 | P a g e
Recommendations
Continue to provide ongoing outpatient wellbeing and healthcare services particularly to vulnerable populations. Such services should target individuals in greatest need of care, for example: low income, uninsured, underserved residents living in Doraville (30340), Norcross (30093 and 30071), Tucker (30084), North Druid Hills (30329), and Chamblee (30341). Services should include outreach and education, screening, primary care, "wrap-around" and specialty care, dental care, and social service connections.
Promote interventions across the disease control continuum in order to reduce the burden of the most common health issues. The burden of conditions such as diabetes, obesity, cardiovascular issues, teen pregnancy, pediatric asthma, and cancer would be more efficiently diminished if interventions focused on prevention/education, screening/diagnostics treatment, support services, and maintenance/management. Efforts should value community clinical linkages and occur both onsite and in the community.
Ensure and/or facilitate access to affordable and effective treatment. One of the major challenges to medication compliance, as reported by some stakeholders, is the affordability of drugs used to treat their chronic conditions, especially if they are uninsured or underinsured. Many stakeholders cited the need for programs that would make prescription medications and effective treatments affordable.
Measure change in access to care and health outcomes over time. Mercy Care should promote continuous understanding of current and emergent health needs and progress by conducting community health needs assessments at regular intervals (e.g., every five years). Additionally, a client advisory board comprised of Mercy Care Chamblee patients would allow continuous realignment to the needs of the community in the period between needs assessments.
Value pastoral counseling. Some residents believe that religion and faith play a central role in their physical and mental wellbeing. Many of the focus group participants discussed the need for behavioral health care services to include pastoral and/or spiritual counseling, given the religious backdrop and importance of faith to the lives of many of the patients seeking care at the clinic.
Engage more culturally competent providers. It was important to stakeholders that the diversity of community be reflected in the types of behavioral health providers offering culturally competent care. People perceived this to be necessary for effective treatment and care. Key ethnicities and languages to be aware of include: Spanish, Korean, Vietnamese, Chinese, French, Kru, Ibo, Yoruba, Amharic, Hindi, and Russian. Efforts should also be made to ensure that documentation and forms are culturally sensitive and appropriate.
Outreach and education. Use the integration of services to leverage the primary care platform to reach out to and educate families and the community about behavioral and mental health conditions and the benefits of seeking care.
Facilitate the transportation of patients to and from appointments. Participants recommended that part of the clinic service might include some form of transportation to and from scheduled appointments (e.g. shuttle services and/or MARTA cards). This may be an opportunity to collaborate with community partners.

14 | P a g e
Consider extended clinic hours. Being able to access provider services after the end of the work day (after-hours appointments) and on weekends is of high value to members of the community who are otherwise unable to benefit from clinic services during the work week.
Configure and design community friendly spaces in clinic. Offer meeting and teaching spaces for community use to promote engagement. Additionally, provide specialized spaces that consider the unique needs of the populations Mercy Care serves (e.g. a chapel area/prayer room, an area for children to play, child care services).
Actively engage in outreach and educational services, particularly with the populations in greatest need. Study participants recommended an array of health education, instruction, and demonstration classes. Some desired topic areas include: cooking and nutrition, physical activity, prevention of obesity and chronic conditions, stress management, and instruction for new mothers. Use awareness campaigns and screenings where appropriate to help prevent, bring attention to, and ensure early detection of the most common health issues (e.g. diabetes, obesity, cardiovascular issues, teen pregnancy, pediatric asthma, and cancer). This is an opportunity to consider the use of community outreach workers (perhaps from churches), to link clients to wrap-around care and social services.
Non-Clinic Related Opportunities to Invest in Community Dialogue
There were a few topics discussed that did not relate directly to health and traditional health care. Many
of these areas may present opportunities to engage the community and community leaders in dialogue
about strategy and planning. Some participants reported that their community experienced barriers to
health such as poverty, lack of educational opportunity, social exclusion, a lack of places to be active or
experience nature, and limited policing - lending to the perception of an unsafe community. Many
participants discussed the value of increasing collaboration with the local school system, noting that
youth learn a lot about nutrition and exercise from the food that is served in schools and the importance
placed on physical activities. Similarly, many participants discussed the need for recreational facilities
that are safe and well-maintained to provide an optimal environment for youth to participate in physical
activities.
The discussion often focused on the disconnection of neighboring communities. Participants felt that
community members are not interacting with one another and families are disintegrating. Participants
indicated that there are very few spaces for people to socialize in a healthy way in their communities.
This leads to a recommendation for municipalities to focus on the built environment in such a way that
it encourages interaction and activity.
Residents discussed the isolation of seniors, who may not be able to get to and from senior centers or
easily access needed resources. Specifically, participants discussed the need for seniors with limited
support to receive some oversight and assistance in medical treatment and home care to ensure they
are not cycling through the emergency room.
15 | P a g e
VI. Community Resident Input
Purpose
This study engaged community residents to develop a deeper understanding of the health needs,
existing opinions and perspectives related to the health status, health-seeking behaviors, and health
needs of the populations in communities that will be served by the Mercy Care Chamblee Clinic.
Methodology GHPC and Mercy Care worked together to recruit and conduct three focus groups and four listening
sessions among residents living in the communities that Mercy Care intends to serve with the new clinic
in Chamblee. GHPC designed facilitation guides for focus group discussions and listening sessions, which
were reviewed by Mercy Care and approved by the University’s Internal Review Board. Mercy Care
recruited participants for the focus groups and listening sessions by working with partners in the
community. Focus groups lasted approximately 1.5 hours, during which time trained facilitators led 6-12
participants through a discussion about the health status of their communities, health needs, resources
available to meet health needs, and recommendations to address health needs in their communities. All
participants were offered appropriate compensation for their time. The following focus groups were
conducted by GHPC on behalf of Mercy Care throughout the first quarter of 2016:
Spanish-speaking participants in a chronic disease management program (conducted in Spanish): The Latin American Association - January 11, 2016
Spanish speaking women participating in a prenatal education program (conducted in Spanish): The Society of St. Vincent DePaul – February 17, 2016
Chamblee Residents: Chamblee, GA – March 23, 2016
Listening sessions were designed to facilitate community input in a larger forum. Each session lasted
approximately 2 hours, during which time participants were asked to respond to a variety of questions
about the health of their community using audience response technology. Instant results were offered
to participants to encourage small and large group discussions about the collective responses. Also,
participants were asked to visualize the ideal healthy community and discuss in small groups. The
following listening sessions were conducted by GHPC on behalf of Mercy Care throughout January and
February 2016:
Latino Population (conducted in Spanish):
o Holy Spirit Catholic Center- February 3, 2016
o Our Lady of the Americas - February 7, 2016
Older Adults Population:
o Senior Connections - January 27, 2016
o Mercy Housing - January 29, 2016 (English and Korean language translation
provided)
Focus groups and listening sessions were recorded and transcribed with the consent of all participants.
The Georgia Health Policy Center analyzed and summarized data from the focus groups and listening
sessions to determine similarities and differences across populations related to the collective experience
of healthcare, health needs, and recommendations. These similarities, differences, and
recommendations are summarized in this section.

16 | P a g e
Characteristics The study area covers a large geographic area, which houses some of the most diverse communities in
the state. Chamblee itself is a rapidly growing area with communities that represent diverse incomes,
ethnicities, and age. Often in group discussions and listening sessions, participants would speak of two
populations: an affluent, insured, healthier population of professionals, and a lower-income earning,
less educated, uninsured/underinsured, less healthy population that includes undocumented and
documented community members with higher rates of immigration (i.e. Asian, African, and Latino). The
majority of participants reported living in their communities for more than ten years.
Insurance Status: Seniors and residents in the Chamblee focus group were most often insured either
through Medicare or employer-provided insurance coverage. Most of the Latino participants including
pregnant females reported that they had no insurance coverage.
Health Status: The majority of Latino community members reported that they consider their
communities to be either not very healthy or extremely unhealthy. A variety of responses were reported
by the older adult residents with most reporting either moderately healthy or not very healthy
communities.
Common Care Resources: The majority of seniors and residents in the Chamblee focus group reported a
family physician as their primary source of care. However, Latino community members, including the
prenatal women’s focus group, reported their family physician and a variety of ‘other’ responses such as
a chiropractor and naturopath as their primary source of care. When health care was not readily
available, participants indicated there were a variety of resources they use to secure health services.
These resources included: Centro Internacional de Maternidad (CIMA) Women's Health Clinic, hospital
programs offering care at a discounted rate, and clinics for underinsured and uninsured patients. All
groups showed a strong preference for health providers whose practices were in close proximity and
accepting new patients, with caring physicians who spend time with patients to explain their condition
and to understand their health needs.
Recommendations Participants had a wide range of recommendations for improving health in their communities. Many of
these recommendations were not related to traditional clinical services, but could instead impact the
health of residents and potentially reduce the need for clinical care.
Services for women and children: Teen pregnancy was often mentioned among participants as
a health concern for adolescents. Residents recommended that services for women and children
be increased (i.e. faith based prenatal clinics/programs for expectant Latinas, childcare, and
after school programs and services).
Increased access to affordable primary care: Given high uninsured rates, residents
recommended that affordable care for uninsured and underinsured residents be increased,
including access to affordable prescription medications.
More convenient clinic hours: Residents suggested that clinic hours could be extended earlier
and later than standard business hours of 8am to 6pm, and that walk-in appointments be
available to patients. Some in the community worked long hours and believed that after-hour
services, including translation, would be of tremendous value and well utilized.

17 | P a g e
Increase in pediatric services: Residents suggested that an increase in pediatric care (i.e. more
accessible pediatricians with better hours and specialty care for children) would be beneficial.
Provider diversity representative of populations served in healthcare: There were
recommendations to better align the diversity of healthcare providers to the diversity of the
patient population in the study area to increase the trust and use of health services. Participants
believed that increasing the number of Latino and Asian health providers in the area could
increase the use of health services in communities in the study area.
Increase in health services available within local communities: Participants felt that there was
a need to increase the following specific services: hospice care, auditory support and care,
health education, pediatric care, and specialty care for underinsured/uninsured.
Community outreach and health promotion programs: The recommendation was made by
many participants to increase activities to promote community health and health education,
both onsite at the Chamblee clinic and in the community where residents naturally gather.
Some of the recommendations mentioned included: group exercise classes (specifically Zumba
and yoga), nutrition education, cooking classes, disease management classes, English as a
second language classes, programs that encourage socialization, space for religious reflection,
and peer support programs.
Accessible transportation: More accessible public transportation and general transportation to
care is a top priority. Residents recommended a shuttle service for scheduled appointments.
Mental health services for individuals and families: Participants felt that there was
considerable need for counseling and other mental health services, but emphasized that
providers should be competent in the language, culture, and spiritual beliefs of the community.
Realignment of community perspective: Participants felt there was a need to realign
community attitude in a way that prioritizes health, and eliminates stigmas associated with
certain diseases/disorders such as HIV/AIDS and mental health conditions.
Summary:
Providing Health Services to Underinsured and Uninsured Residents:
Community members do not always have access to insurance due to their legal status or socio-economic
status. Often community members in the study area cannot afford private health insurance. Others
reported that they are not eligible for health insurance subsidies for plans offered through the
Marketplace due to their legal status. The Chamblee resident group indicated that there is a growing
population of homeless people in the community. The group felt there is a need to ensure that the
health needs of the homeless are met.
Focus group populations discussed the need for access to affordable health services, which included
pharmaceutical, primary, pediatric, and oral health care. Focus group populations also discussed the
need for specialty care and affordable medications for underinsured/uninsured residents. While there
are a variety of primary care clinics offering care to underinsured and uninsured community members,
the demand is greater than the available services, and there are few specialists (e.g., orthopedics, etc.)
18 | P a g e
practicing in these clinics. Additionally, many clinics do not have the ability to provide prescription
medications for underinsured/uninsured community members.
Integration of Primary Care and Behavioral Health Care:
One of the most discussed health needs among focus group and listening session participants was the
need for behavioral health and substance abuse services. Residents recognized that behavioral health
was a need that cut across demographic and geographic parameters.
Study participants specifically focused on mental health issues such as the prevalence of substance
abuse among adolescents, stress in adult populations, and depression among senior populations.
Residents often discussed the need for specialized behavioral health services for adolescents, adults,
and seniors.
Substance Abuse among Adolescents: Many participants felt that youth were abusing substances for
entertainment and/or to cope with life stressors. Participants felt that youth needed afterschool
activities and opportunities for healthy recreational activity. They indicated that younger children have
activities available, but that few activities are offered for older and transitional age children. The need
for activities was attributed to parental obligations such as work, as well as lack of support for positive
parenting.
Stress in Adult Populations: High levels of stress among adults was thought to be due to the various
demands local adults face due to poverty and the impact poverty can have on mental health status.
Depression in Senior Populations: Depression in senior populations was often discussed as being
connected to isolation, decreased sensory experience, and increased levels of grief.
Many of the groups discussed offering spiritual counseling as part of Mercy Care's behavioral health
services, particularly given the religious practices and beliefs of so many patients.
Chronic Disease Prevention and Management (obesity, diabetes, asthma, cardiovascular issues, etc.):
The most commonly discussed health issues among focus group populations were diabetes, obesity,
cardiovascular issues, teen pregnancy, pediatric asthma, and cancer. Management of these health
conditions should therefore likely inform the development of services for the clinic in Chamblee, GA.
Focus group participants believed that obesity was a universal health issue regardless of age. When
looking across health concerns for specific age groups, respondents identified the following prioritized
health concerns:
For adults and seniors - the most cited health concerns were diabetes, heart disease, and
mental health issues
For youth - the most pressing health challenges were substance abuse, asthma, and teen
pregnancy
Study participants discussed the need for chronic disease management and prevention in children,
adults and seniors. They also noted that youth seemed to be developing poor attitudes and habits

19 | P a g e
towards nutrition and physical activity that would have later consequences. The underlying factors
discussed most often related to:
Poor nutrition –
No access to affordable healthy food due to limited affordable grocery outlets and/or lack of
transportation
Cultural dietary preferences that are not healthy (i.e. fried foods, foods high in fat and sugar, habits of eating before bedtime, etc.)
Lack of awareness of and preference for foods prepared in healthy ways
Not enough time to prepare healthy food
Ignorance of the impact of poor nutrition
Insufficient physical exercise –
Poor access to resources that facilitate healthy physical activity (i.e., recreational space that is convenient, accessible and perceived as safe)
Lack awareness of the impact that physical activity/no physical activity can have on health status
Insufficient skills and motivation to incorporate a healthy level of physical activity into their current habits.
Offering Patient-Centered Care:
There are immigrant and refugee populations of significant size that do not speak English and/or speak
English as a second language. Languages spoken in focus groups included Korean and Spanish. Study
participants, including stakeholders and residents whose native languages were not English discussed
the need for health services (i.e. medical care, outreach/education, printed materials, etc.) to be
provided in the patient’s language of origin. While there is a Federally Qualified Health Center (FQHC) in
the area that is the preferred provider for many residents that speak Asian dialects, there is a growing
need for translation in the communities included in this study. There are a number of Asian dialects and
cultures that do not translate into English very well, which may lead to misunderstanding of diagnosis
and/or treatment recommendations. Latino participants had also encountered translators who lacked
the medical knowledge to properly translate highly technical health terminology. Additionally, Latino
community members were most often uninsured and without medical homes.
Many participants indicated that they do not eat as healthily as they should for a variety of reasons,
including: cultural preferences for fried, sugary, and fatty foods; not enough time to prepare meals; and
financial restraints. Many also indicated that they were open to participating in health education and
outreach activities, though respondents suggested that there may be some hesitation among
undocumented community members in the Latino community to participate in formal health fairs and
public events.
Focus group participants talked about the importance of being able to access care in their communities
after traditional operating hours (8am – 5 or 6pm). Residents suggested that the Mercy Care clinic offer
after-hours appointments to increase the level of access to care for residents that work during normal
business hours and their families. They also noted that translators were rarely available outside of
traditional operating hours.

20 | P a g e
Participants discussed the importance of faith and the role of the church in healing mind and body.
Many felt that their religious beliefs and practices should play a central role in the healing of their bodies
and that medical providers should embrace and value faith and its role in healthcare (perhaps through
pastoral counseling).
Study participants discussed difficulties related to transportation to and from the clinic. Transportation
is not always reliable, affordable and/or accessible to residents, which was thought to cause
inconsistency in appointment attendance. Participants recommended the clinic services include some
form of transportation for scheduled appointments (for example, shuttle services or MARTA cards).
Community Engagement:
Focus group populations discussed the importance of community engagement. The clinic should be
designed to include space (meeting rooms and classrooms) for community engagement.
Additionally, residents felt that offsite outreach in the community at churches, events, and other public
spaces would increase the reach of the clinic, increase connectivity with the community, and raise
awareness about prevention, healthy behaviors, and common health issues. Some of the onsite/offsite
recommendations from focus group members were related to health education, instruction, and
demonstration (cooking, nutrition, physical activity, disease prevention, stress management, instruction
for new mothers, etc.); free screenings for common health issues (addressed above); reservable meeting
space for community initiatives; and community outreach workers (i.e. in churches).
Participants discussed an interest in volunteering in their communities. Often community members
indicated that they do not know about volunteer opportunities outside of their church due to a lack of
communication about existing opportunities. Churches play a vital role in organizing and engaging
community members in the study area.
In addition to the meeting space and classrooms, residents recommended that Mercy Care Chamblee
include specialized spaces like a chapel area/prayer room, areas for children to play, child care services,
etc. that take into consideration the populations Mercy Care is planning to serve.
Non-Clinic Related Opportunities to Invest in Community Dialogue:
There were a few topics discussed that did not relate directly with health and traditional health care.
Many of these areas seem to present an opportunity to engage the community and community leaders
in dialogue about strategy and planning. Some participants reported that their community experienced
barriers to health, such as poverty, lack of educational opportunity, social exclusion and policing, and
few places to be active or experience nature. Many participants discussed the value of increasing
collaboration with the local school system, noting that youth learn a lot about nutrition and exercise
from the food that is served in schools and the importance placed on physical activities. Similarly, many
participants discussed the need for recreational facilities that are safe and well maintained to provide a
safe environment for youth to participate in physical activities.
The discussion often focused on the lack of social connectedness in communities. Participants felt that
community members were not interacting with one another and families were at risk of disintegration.
Participants indicated that there are very few spaces for people to socialize in a healthy way in their

21 | P a g e
communities. Some recommended that municipalities focus on changes to the built environment in such
a way that encourages more community interaction.
Residents discussed the isolation of seniors who are unable to get to and from senior centers and may
not have access to resources in their home. Specifically, participants discussed the need for seniors with
limited support to receive assistance and medical treatment through home care to ensure they are not
cycling through the emergency room.

22 | P a g e
VII. Community Leader Input
Purpose
This study engaged community leaders to gain their input on, and develop a deeper understanding of,
the health needs and health status of the residents they served as professionals and providers working
in the community.
Methodology GHPC worked closely with Mercy Care to identify the following organizational leaders and voices: 1)
public health experts; 2) professionals with access to community health-related data; and 3)
representatives of underserved populations (Asian community, Latino community, seniors, low-income
residents, residents with limited English speaking skills, and residents that are uninsured). These
individuals were interviewed as part of the needs assessment process. GHPC and Mercy Care developed
a discussion guide (see Appendix C) that was used during each interview, which lasted approximately 45
minutes. All tools and processes were approved by the Georgia State Institutional Review Board. A series
of 12 interviews and one group interview were completed with key stakeholders in DeKalb, Fulton, and
Gwinnett Counties.
Characteristics Stakeholders were identified across the abovementioned categories, and participants were largely
program directors, program managers, and a variety of medical professionals (including doctors,
hospitalists, and medical directors). Stakeholders included participants from LaAmistad, Mercy Housing,
and Center for Pan Asian Community Service (CPACS), Kaiser Permanente, Children's Healthcare of
Atlanta, Gwinnett County Administration, Futbol Pasion, the Georgia House of Representatives, and
Catholic Charities. A group interview with doctors and hospitalists at Emory Saint Joseph's Hospital
(ESJH) was also conducted. Each participant was able to offer a unique perspective about the health
needs of the population in the Chamblee area. All interviews were conducted by qualified GHPC staff
and a complete list of the interviewees may be found in Appendix B.
The interview guide used for these interviews included a number of questions regarding the new
Chamblee clinic. All stakeholders were at least aware of the clinic, and all responses regarding the
location of the clinic were extremely positive. Nearly all stakeholders stressed the importance of
culturally competent services, including language services extending beyond Spanish to serve the Asian
community, and the importance of hiring staff with linguistic and cultural competency in mind.
Additionally, nearly all stakeholders stressed the importance of providing after-hours appointment
options, as many potential clients cannot afford to take time off work to visit the doctor.
Recommendations Participants had a wide range of recommendations for improving health in their communities. Many of
these recommendations are not related to traditional clinical services, but would impact the health of
residents and potentially reduce the need for clinical care.
Linkage to care: Emory Saint Joseph's Hospital (ESJH) participants emphasized the value of
creating a liaison between the new clinic and ESJH or other area hospitals. They also emphasized
the importance of increased community education regarding navigating the health care system
and services available at Mercy Care clinics.

23 | P a g e
Obesity and healthy eating: Intervention ideas expressed to combat obesity included: food
pantries, community gardens, cooking classes, creation of a rewards system, nutrition education
in schools, and a program specifically to educate and increase exercise and healthy behaviors
among adolescent Latinas.
Important considerations for the new clinic and clinic services: Culturally competent care and
services (including front office staff and outreach), community workshops on healthy
relationships, home health services, a physical therapy center, health education, outreach and
enabling services, development of programs via churches and/or faith-based nursing, primary
care, dental services, space for those with multiple children/childcare so parent can see their
doctor one-on-one.
Heart health: Education and early prevention programs.
Chronic disease: Free community classes and handouts to give patients at clinic and in hospital
on the availability of these classes.
Senior Health: HIV and STI education for seniors, senior centers should provide culturally
relevant meal services.
Summary
Providing Health Services to Underinsured and Uninsured Residents:
All participants in the ESJH group interview identified health care services for the underserved as the
number one issue for the community. Stakeholders identified a number of challenges that result in such
a large underserved population. In terms of insurance, this population has a relatively large proportion
of people who are not adequately employed to be eligible for coverage assistance under the Affordable
Care Act. Thus, they remain uninsured. However, of much greater significance, as reported by
respondents are the other elements of access - geographic and transportation barriers, and issues
related to immigration status. It was estimated that approximately 40% of the Latino population served
by ESJH is undocumented, and issues related to undocumented status included:
Fear of going to the doctor due to risk of deportation
Many earn low incomes and cannot afford to miss work
Some are unable to afford transportation to seek services
Cultural norms may involve waiting to seek care until the situation is extremely dire
Cultural norms may dictate it is better to receive care in a hospital setting
Lack of understanding and education in how to navigate the health system
Stakeholders emphasized that they perceived these issues to be more critical than the barrier presented
by lack of insurance. When asked about the most pressing health issues in the community, one
stakeholder said, “Access to health care. It used to be affordability, but it’s not that anymore, just
access.” This sentiment was echoed across the data. It was said that “transportation and culture and
access to care has to be addressed before we can even get to disease management.”

24 | P a g e
Integration of Primary Care and Behavioral Health Care:
Overall, behavioral health needs were described as a major issue. Integration of primary care and
behavioral health was chosen as the second most pressing health need in the community by half of the
participants at ESJH. Unmet behavioral health needs were emphasized as a major problem particularly
for children and the elderly, though the discussions focus largely on the lack of resources in general for
underinsured/uninsured people regardless of age. Stakeholders discussed the need for a continuum of
behavioral health services, citing a dearth of available referral sources in the communities within the
study area.
In terms of youth, an issue identified was an inadequate supply of psychologists and psychiatrists to
manage complex issues like psychosis that cannot be managed by a primary care provider. Among the
elderly, one major issue identified was the taboo nature of speaking about mental illness and frequent
refusal to treat a mental illness, as well as the cascading problem of mental illness exacerbating issues
with medication adherence in this population. Feedback on possible solutions for the youth population
was not provided. However, for the elderly population it was suggested that group education and
conversations would be an appropriate initial method for intervention.
Chronic Disease Prevention/Management (obesity, diabetes, asthma, cardiovascular disease, etc.):
Chronic disease prevention and management were cited as major health issues, particularly for the
Latino population. Most stakeholders who discussed chronic disease cited diabetes. In addition to
diabetes, high blood pressure, hypertension, obesity, and cardiovascular diseases were also mentioned.
Almost all stakeholders who discussed chronic disease issues noted the correlation between diet and
the prevalence of chronic disease. Some noted that many in the Asian community tended to have lower
rates of diabetes, high blood pressure, hypertension, and obesity due to an overall healthier diet. While
cultural norms in terms of diet may play a role, access to healthy affordable foods is likely also a factor
contributing to this difference.
Offering Patient-Centered Care:
The importance of culturally competent care was a feature of many of the stakeholder conversations.
This was more strongly emphasized in interviews than any other issue. While some stakeholders focused
on other issues as top priority from their perspective, all who discussed the new clinic pointed out that
given Chamblee’s population, culturally competent care and trust-building will come before all other
questions of service offerings. This encompasses language competencies beyond Spanish, from the front
desk to the pharmacy, as well as culturally competent clinicians to understand needs specific to the
diverse populations that will be served in the Chamblee area.
Transportation & Access:
Some respondents described the challenges of transportation and physical access to healthcare services
as being driven by (a) work obligations that cannot be missed and clinic hours coinciding within work
hours and (b) the inability to afford transportation to the clinic, both in terms of time and cost.
However, stakeholders said that the clinic’s location is ideal for convenience and should improve access
despite geographical and transportation access barriers. These barriers will persist for some residents,
particularly those who cannot afford to use MARTA, and those who live outside MARTA's reach.

25 | P a g e
Community Engagement:
Stakeholders discussed the need to engage residents in the communities throughout the service area, as
well as some of the challenges related to engaging this diverse population.
Stakeholders discussed the isolation of seniors, undocumented community members, and youth. The
senior population can become isolated when they are aging in place for a variety of reasons: 1) they may
not qualify for senior housing or home health services; 2) they may not have family that are involved in
their everyday lives; 3) they may not be able to drive or afford public transportation; and 4) they may
not be mobile or may have a physically limiting disability. These seniors can become isolated without
adequate food, necessary medications, or proper hygiene, which can cause a health hazard.
Undocumented community members can become isolated due to: 1) language/cultural barriers; 2) fear
of deportation; 3) lack of awareness of available programs; 4) limited access to transportation; and 5)
lack of income. Often community members are much unhealthier due to a lack of awareness and limited
education, which has an impact on individual health status and mortality and may lead to health
disparities.
Youth often become isolated due to: 1) their parent(s) working long hours with limited resources to
provide oversight and 2) being exposed to trauma of immigration and poverty (often associated with
violence, abuse, neglect, etc.). Stakeholders also discussed the prevalence of substance abuse and teen
pregnancy. They discussed the need to provide guidance and direction as well as programmed activities
geared toward youth participation throughout the study area.
Engaging community members across the study area will present opportunities to think strategically due
to the diversity of the population (in terms of age, education, profession, citizenship, culture, and
language). Stakeholders believed that the success of the Mercy Care Chamblee clinic will depend upon
the success of their community engagement. Many stakeholders noted that Mercy Care has a
longstanding, trusted reputation in the community.
Recommendations were made during interviews to engage the community where members naturally
gather (churches, shopping centers, etc.). Respondents also recommended strengthening relationships
with residents, businesses, and community leaders. Finally, the recommendation was made to engage
the community through the use of faith-based nursing and/or community health workers.
Community engagement is integral to the health of the community in this study area, where the
community is so diverse and isolation challenges are present due to lack of trust and awareness of
community resources. More specifically, community members may not naturally gravitate to a new
clinic or new location and may not be aware of the plans for relocation.
Non-Clinic Related Opportunities to Invest in Community:
Stakeholders mentioned that, in addition to the trust-building necessary with an immigrant population
of whom many are undocumented, building general health literacy should be a major point of
intervention. This is related to the importance of education and outreach regarding navigation of Mercy
Care services, other health services in the area, and raising awareness of available resources.
Stakeholders suggested that health fairs have been effective in the area, but that more could be done to

26 | P a g e
engage non-English speakers including translation and distribution of materials in multiple languages at
the clinics, hospitals, and other community-based locations.
The importance of home health care was mentioned, but a member of the ESJH group also mentioned
that this is not always the most effective method for residents, as often they live in crowded homes and
may not welcome outsiders into their homes. This person suggested alternatively that follow-up services
to hospital care such as physical/occupational therapy should be offered at the clinic itself. Stakeholders
also stressed the value of free classes on issues such as violence and nutrition to be offered at
community-based locations and/or the clinic itself. The group at ESJH mentioned that it would be useful
to produce and distribute materials on the availability, timing, and location of these classes to offer to
patients prior to hospital discharge.
Transportation was perceived as impeding many from not only going to the doctor, but also from
accessing healthy foods. Stakeholders noted that this area is relatively devoid of true grocery stores:
there are some, but they are located in wealthier areas, closer to those who are not likely to have issues
with transportation.
It was also noted that in parts of Chamblee, in particular, where there are no true grocery stores, there
is a high availability of fast food options. The lack of affordable healthy food options, coupled with the
stressors of living in a low income community and cultural norms that reinforce poor eating habits will
likely result in many families being affected by obesity and diabetes over time.
27 | P a g e
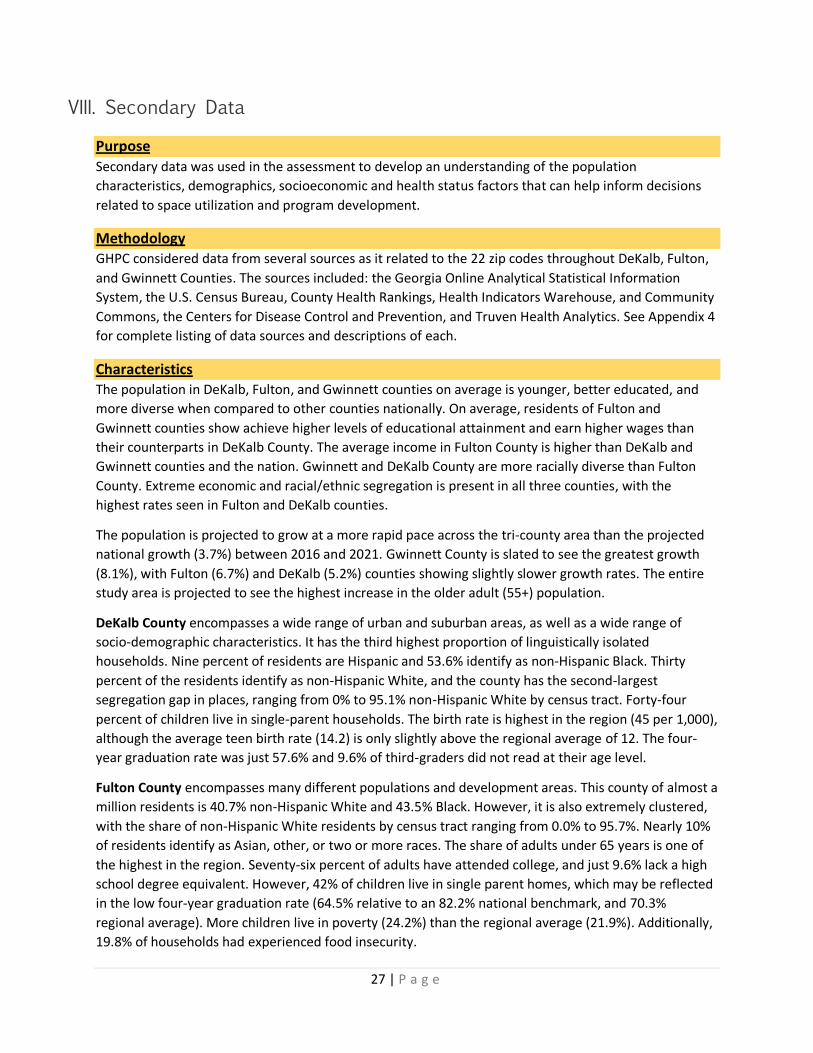
VIII. Secondary Data
Purpose
Secondary data was used in the assessment to develop an understanding of the population
characteristics, demographics, socioeconomic and health status factors that can help inform decisions
related to space utilization and program development.
Methodology GHPC considered data from several sources as it related to the 22 zip codes throughout DeKalb, Fulton,
and Gwinnett Counties. The sources included: the Georgia Online Analytical Statistical Information
System, the U.S. Census Bureau, County Health Rankings, Health Indicators Warehouse, and Community
Commons, the Centers for Disease Control and Prevention, and Truven Health Analytics. See Appendix 4
for complete listing of data sources and descriptions of each.
Characteristics The population in DeKalb, Fulton, and Gwinnett counties on average is younger, better educated, and
more diverse when compared to other counties nationally. On average, residents of Fulton and
Gwinnett counties show achieve higher levels of educational attainment and earn higher wages than
their counterparts in DeKalb County. The average income in Fulton County is higher than DeKalb and
Gwinnett counties and the nation. Gwinnett and DeKalb County are more racially diverse than Fulton
County. Extreme economic and racial/ethnic segregation is present in all three counties, with the
highest rates seen in Fulton and DeKalb counties.
The population is projected to grow at a more rapid pace across the tri-county area than the projected
national growth (3.7%) between 2016 and 2021. Gwinnett County is slated to see the greatest growth
(8.1%), with Fulton (6.7%) and DeKalb (5.2%) counties showing slightly slower growth rates. The entire
study area is projected to see the highest increase in the older adult (55+) population.
DeKalb County encompasses a wide range of urban and suburban areas, as well as a wide range of
socio-demographic characteristics. It has the third highest proportion of linguistically isolated
households. Nine percent of residents are Hispanic and 53.6% identify as non-Hispanic Black. Thirty
percent of the residents identify as non-Hispanic White, and the county has the second-largest
segregation gap in places, ranging from 0% to 95.1% non-Hispanic White by census tract. Forty-four
percent of children live in single-parent households. The birth rate is highest in the region (45 per 1,000),
although the average teen birth rate (14.2) is only slightly above the regional average of 12. The four-
year graduation rate was just 57.6% and 9.6% of third-graders did not read at their age level.
Fulton County encompasses many different populations and development areas. This county of almost a
million residents is 40.7% non-Hispanic White and 43.5% Black. However, it is also extremely clustered,
with the share of non-Hispanic White residents by census tract ranging from 0.0% to 95.7%. Nearly 10%
of residents identify as Asian, other, or two or more races. The share of adults under 65 years is one of
the highest in the region. Seventy-six percent of adults have attended college, and just 9.6% lack a high
school degree equivalent. However, 42% of children live in single parent homes, which may be reflected
in the low four-year graduation rate (64.5% relative to an 82.2% national benchmark, and 70.3%
regional average). More children live in poverty (24.2%) than the regional average (21.9%). Additionally,
19.8% of households had experienced food insecurity.

28 | P a g e
Gwinnett County has one of the lowest shares of people over 65 years (7.4%), an above average
population under 18 years (28.7%), and low levels of residents with disabilities (7.3%). The county has a
large Hispanic population (20.5%), and 9.6% of households are linguistically isolated. While just 41.6% of
residents are non-Hispanic White, by census tract this share ranges from 5.6% to 90.0%, which is a
relatively high level of clustering. Nearly 40% of households pay over 30% of their income for housing,
above the 36.8% regional average, and 5.4% of households are overcrowded. Twenty-nine percent of
adults were uninsured, which was above the regional mean of 25.8%. Additionally, 12.1% of children
were uninsured, versus 10.5% regionally. The four year graduation rate in Gwinnett County was 71.3%,
above the Georgia average but below the national benchmark of 82.2%.
In some parts of the county, more than 25.3% of commuters travel over an hour each way to work,
mainly by car. There are also parts of the county where more than 25% of commuters do not have
access to a car. Many socioeconomic indicators in the county are positive, such as a low unemployment
rate and low poverty rate. However, population-wide data indicated disparities in employment for non-
Hispanic White (8.4%), Hispanic (11.5%), or Black (14.0%) labor force participants. The county has a low
percentage of single parent households (28% versus 37% statewide). County residents are also less likely
to experience food insecurity (13.9% versus 16.4% regionally).
Summary Current research points to a correlation between socioeconomic status, level of language isolation, etc.
and health outcomes. For this study, data related to socioeconomic status were considered from a
variety of sources (i.e., Truven Health Analytics Community Need Index (CNI), Community Commons,
American Community Survey (ACS), etc.). See Appendix D for a brief description of each data source
considered in this study. The following is a review of the notable secondary data findings related to
socioeconomic status. Additional data table, charts, maps, and analysis can be found in Appendix D.
Note that the marker on all maps is the location of Mercy Care's new Chamblee clinic.
Sociodemographic Barriers
Extreme poverty is present in the service area, particularly concentrated along the I-85 corridor and near
Chamblee and Norcross. At this concentration, poverty may result in disinvestment, blight, and a lack of
jobs and services. Children in poverty follow a similar pattern, with high rates along Buford Highway in
the southern part of the service area. The following map depicts the 22-Zip code CHNA Study area (note
the marker for the location of the clinic) and the 188 census tracts that are fully or partially within its
boundaries. The shading indicates the level of poverty as a percentage of the total population, which
ranges from 5% of the population (lightest color) to more than 30% of the population (darkest color)
living below poverty.

29 | P a g e
Figure 2: Poverty as a Percentage of the Total Population by Census Tract3
Fulton County, as a whole, aligns with regional averages for many health factors and outcomes,
although there are disparities concealed within these averages. Disparities are also reflected in
employment. While the 8.6% unemployment rate in 2015 was only slightly higher than the state average
(8.2%), population-wide data from 2010-14 found that the unemployment rate for Black residents
(18.4%) was about three times higher than the rate for non-Hispanic White residents (6.2%). In one part
of the county, women were employed at 3.8 times the rate of males in the labor force.
Relative to statewide rates of health insurance coverage, both adults and children in the service area
were much more likely to be uninsured. The majority of adults did not have insurance in many areas
around Chamblee and Norcross. Uninsured children were more widely distributed, but exceeded 30% in
some places. The American Community Survey (ACS) data do not capture recent improvements in
coverage rates resulting from the Affordable Care Act and from increased employment. However, many
families in the area may continue to be ineligible for coverage.
While Fulton County has had higher socioeconomic barriers to accessing care related to income, culture,
education, insurance, and housing, DeKalb County saw the greatest increase in these barriers from 2014
3 US Census Bureau, American Community Survey 2010-14
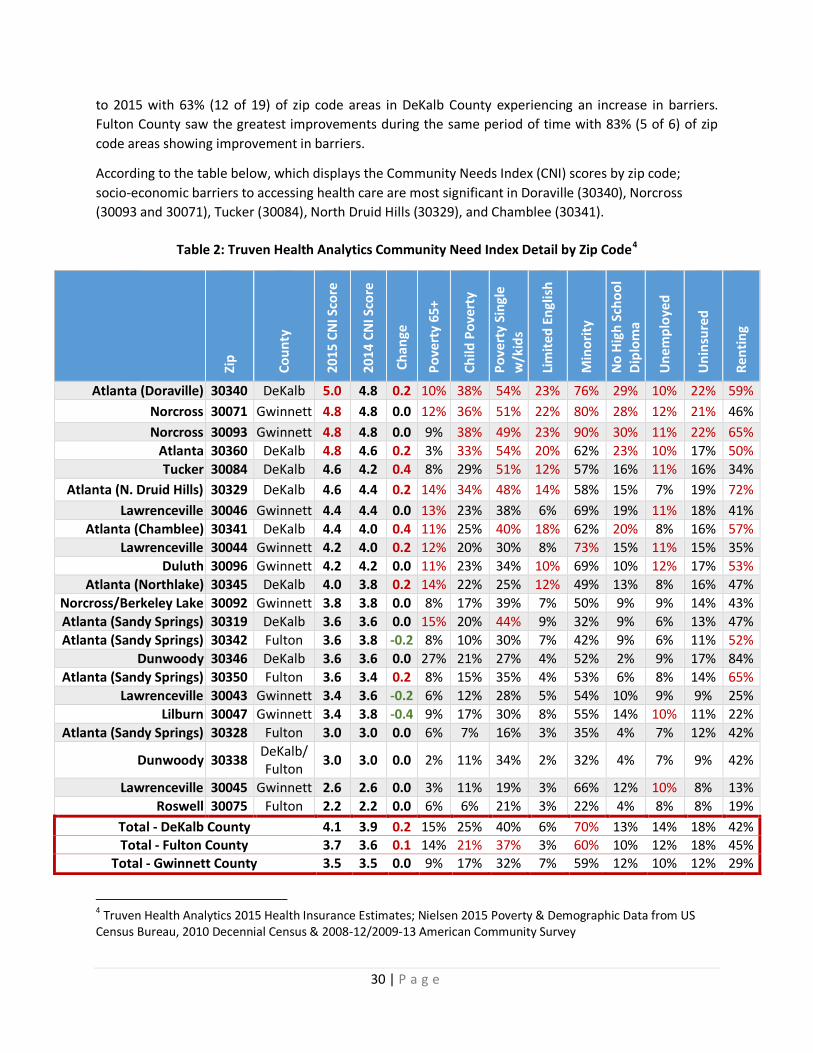
30 | P a g e
to 2015 with 63% (12 of 19) of zip code areas in DeKalb County experiencing an increase in barriers.
Fulton County saw the greatest improvements during the same period of time with 83% (5 of 6) of zip
code areas showing improvement in barriers.
According to the table below, which displays the Community Needs Index (CNI) scores by zip code;
socio-economic barriers to accessing health care are most significant in Doraville (30340), Norcross
(30093 and 30071), Tucker (30084), North Druid Hills (30329), and Chamblee (30341).
Table 2: Truven Health Analytics Community Need Index Detail by Zip Code4
4 Truven Health Analytics 2015 Health Insurance Estimates; Nielsen 2015 Poverty & Demographic Data from US
Census Bureau, 2010 Decennial Census & 2008-12/2009-13 American Community Survey
Zip
Co
un
ty
20
15
CN
I Sco
re
20
14
CN
I Sco
re
Ch
ange
Po
vert
y 6
5+
Ch
ild P
ove
rty
Po
vert
y Si
ngl
e w
/kid
s
Lim
ite
d E
ngl
ish
Min
ori
ty
No
Hig
h S
cho
ol
Dip
lom
a
Un
emp
loye
d
Un
insu
red
Re
nti
ng
Atlanta (Doraville) 30340 DeKalb 5.0 4.8 0.2 10% 38% 54% 23% 76% 29% 10% 22% 59%
Norcross 30071 Gwinnett 4.8 4.8 0.0 12% 36% 51% 22% 80% 28% 12% 21% 46%
Norcross 30093 Gwinnett 4.8 4.8 0.0 9% 38% 49% 23% 90% 30% 11% 22% 65%
Atlanta 30360 DeKalb 4.8 4.6 0.2 3% 33% 54% 20% 62% 23% 10% 17% 50%
Tucker 30084 DeKalb 4.6 4.2 0.4 8% 29% 51% 12% 57% 16% 11% 16% 34%
Atlanta (N. Druid Hills) 30329 DeKalb 4.6 4.4 0.2 14% 34% 48% 14% 58% 15% 7% 19% 72%
Lawrenceville 30046 Gwinnett 4.4 4.4 0.0 13% 23% 38% 6% 69% 19% 11% 18% 41%
Atlanta (Chamblee) 30341 DeKalb 4.4 4.0 0.4 11% 25% 40% 18% 62% 20% 8% 16% 57%
Lawrenceville 30044 Gwinnett 4.2 4.0 0.2 12% 20% 30% 8% 73% 15% 11% 15% 35%
Duluth 30096 Gwinnett 4.2 4.2 0.0 11% 23% 34% 10% 69% 10% 12% 17% 53%
Atlanta (Northlake) 30345 DeKalb 4.0 3.8 0.2 14% 22% 25% 12% 49% 13% 8% 16% 47%
Norcross/Berkeley Lake 30092 Gwinnett 3.8 3.8 0.0 8% 17% 39% 7% 50% 9% 9% 14% 43%
Atlanta (Sandy Springs) 30319 DeKalb 3.6 3.6 0.0 15% 20% 44% 9% 32% 9% 6% 13% 47%
Atlanta (Sandy Springs) 30342 Fulton 3.6 3.8 -0.2 8% 10% 30% 7% 42% 9% 6% 11% 52%
Dunwoody 30346 DeKalb 3.6 3.6 0.0 27% 21% 27% 4% 52% 2% 9% 17% 84%
Atlanta (Sandy Springs) 30350 Fulton 3.6 3.4 0.2 8% 15% 35% 4% 53% 6% 8% 14% 65%
Lawrenceville 30043 Gwinnett 3.4 3.6 -0.2 6% 12% 28% 5% 54% 10% 9% 9% 25%
Lilburn 30047 Gwinnett 3.4 3.8 -0.4 9% 17% 30% 8% 55% 14% 10% 11% 22%
Atlanta (Sandy Springs) 30328 Fulton 3.0 3.0 0.0 6% 7% 16% 3% 35% 4% 7% 12% 42%
Dunwoody 30338 DeKalb/ Fulton
3.0 3.0 0.0 2% 11% 34% 2% 32% 4% 7% 9% 42%
Lawrenceville 30045 Gwinnett 2.6 2.6 0.0 3% 11% 19% 3% 66% 12% 10% 8% 13%
Roswell 30075 Fulton 2.2 2.2 0.0 6% 6% 21% 3% 22% 4% 8% 8% 19%
Total - DeKalb County 4.1 3.9 0.2 15% 25% 40% 6% 70% 13% 14% 18% 42% Total - Fulton County 3.7 3.6 0.1 14% 21% 37% 3% 60% 10% 12% 18% 45%
Total - Gwinnett County 3.5 3.5 0.0 9% 17% 32% 7% 59% 12% 10% 12% 29%

31 | P a g e
Barriers to healthcare increased the most in DeKalb County, with Tucker and Chamblee showing the
greatest increases from 2014 to 2015. In general, zip code areas with the highest barriers in 2014 show
an increase in barriers from 2014 to 2015, while low barrier areas have remained unchanged or
decreased.
In the central corridor of the service area, the share of residents over the age of 5 who do not speak
English well or at all, exceeds 30%. This includes many households that are linguistically isolated;
meaning no one in the household over the age of 14 speaks English well. In several sections of the
service area, at least one quarter of households are linguistically isolated. The following map depicts the
CHNA Study area (note the marker for the location of the clinic) by census tract. The shading indicates
the percentage of the total population, which ranges from 5% or less of the population (lightest purple)
to more than 30% of the population (darkest purple) that are older than 5 years of age and speak English
less than well.
Figure 3: Language Barrier as a Percentage of the Population by Census Tract5
5 US Census Bureau, 2010-14 American Community Survey
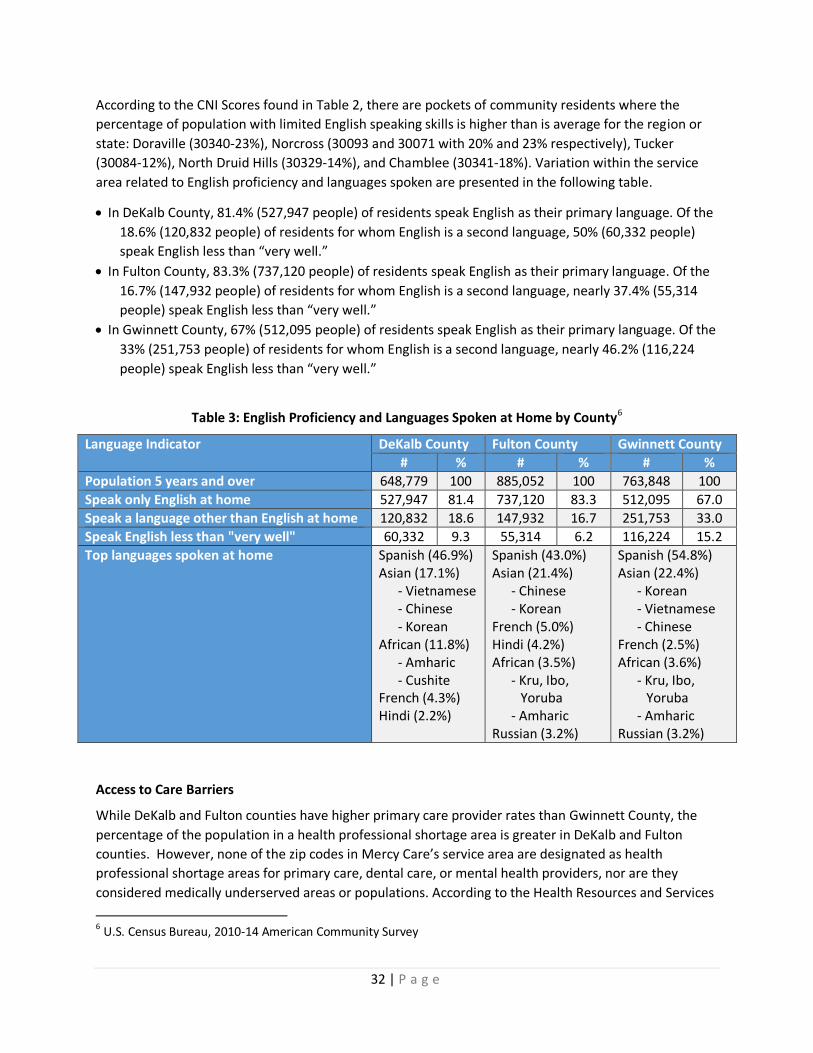
32 | P a g e
According to the CNI Scores found in Table 2, there are pockets of community residents where the
percentage of population with limited English speaking skills is higher than is average for the region or
state: Doraville (30340-23%), Norcross (30093 and 30071 with 20% and 23% respectively), Tucker
(30084-12%), North Druid Hills (30329-14%), and Chamblee (30341-18%). Variation within the service
area related to English proficiency and languages spoken are presented in the following table.
In DeKalb County, 81.4% (527,947 people) of residents speak English as their primary language. Of the
18.6% (120,832 people) of residents for whom English is a second language, 50% (60,332 people)
speak English less than “very well.”
In Fulton County, 83.3% (737,120 people) of residents speak English as their primary language. Of the
16.7% (147,932 people) of residents for whom English is a second language, nearly 37.4% (55,314
people) speak English less than “very well.”
In Gwinnett County, 67% (512,095 people) of residents speak English as their primary language. Of the
33% (251,753 people) of residents for whom English is a second language, nearly 46.2% (116,224
people) speak English less than “very well.”
Table 3: English Proficiency and Languages Spoken at Home by County6
Language Indicator DeKalb County Fulton County Gwinnett County
# % # % # %
Population 5 years and over 648,779 100 885,052 100 763,848 100
Speak only English at home 527,947 81.4 737,120 83.3 512,095 67.0
Speak a language other than English at home 120,832 18.6 147,932 16.7 251,753 33.0
Speak English less than "very well" 60,332 9.3 55,314 6.2 116,224 15.2
Top languages spoken at home Spanish (46.9%) Asian (17.1%)
- Vietnamese - Chinese - Korean
African (11.8%) - Amharic - Cushite
French (4.3%) Hindi (2.2%)
Spanish (43.0%) Asian (21.4%)
- Chinese - Korean
French (5.0%) Hindi (4.2%) African (3.5%)
- Kru, Ibo, Yoruba
- Amharic Russian (3.2%)
Spanish (54.8%) Asian (22.4%)
- Korean - Vietnamese - Chinese
French (2.5%) African (3.6%)
- Kru, Ibo, Yoruba
- Amharic Russian (3.2%)
Access to Care Barriers
While DeKalb and Fulton counties have higher primary care provider rates than Gwinnett County, the
percentage of the population in a health professional shortage area is greater in DeKalb and Fulton
counties. However, none of the zip codes in Mercy Care’s service area are designated as health
professional shortage areas for primary care, dental care, or mental health providers, nor are they
considered medically underserved areas or populations. According to the Health Resources and Services
6 U.S. Census Bureau, 2010-14 American Community Survey

33 | P a g e
Administration, (HRSA), there are seven Health Center Service Delivery Sites and two Health Care
Service Delivery Grantees in the service area (shown in the following figure). Health Center Service
Delivery Sites (HCSD) are community-based and patient-directed organizations that serve populations
with limited access to health care, including low-income populations, the uninsured, those with limited
English proficiency, migrant and seasonal farm-workers, individuals and families experiencing
homelessness, and those living in public housing. Health center service delivery site information includes
data for Health Center Program grantees as well as health center look-alike facilities, which are entities
that operate and provide services consistent with all policy requirements that apply to Section 330-
funded health centers (grantees), but do not receive funding under Section 330. It is important to note
that there is no standard measure, to-date, of the number of providers that are accepting patients that
are underinsured, uninsured, or insured by Medicare/Medicaid, especially undocumented individuals.
What the data tells us is that the rate of FQHCs is lower in the study area than is average for the state
(1.53 per 100,000 pop.), which may point to less access to primary care services for lower income
populations in the study area.
Of the three counties, Gwinnett County has the lowest rate of mental health providers while DeKalb and
Fulton have higher rates than the state and the nation. Fulton County does have one of the highest rates
of mental health providers per 100,000 residents (189.4), though not all residents may be able to access
these services at the same rate. Twenty-seven percent of the county residents live in a health care
professional shortage area. It is important to note that there is no standard measure of the number of
behavioral health providers that serve underinsured or uninsured populations. Fulton County has higher
ER utilization for mental health than any other county. However, African American residents show
higher utilization rates when compared to other races. Emergency Department utilization for mental
health appears relatively low in the service area. Note that the maps, in the Appendix, show counts,
since rates cannot be accurately calculated for small areas with the given population data. Self-harm
events have been decreasing in the area since 2009, while state and national rates have increased
during the same period. Asian residents show lower rates of self-harm when compared to other races.
There have also been a relatively low number of cases in the service area.
Table 4: Availability of Health Services by County with State and National Comparison
Health Care Access DeKalb Fulton Gwinnett GA U.S.
Primary Care Providers / 100,000 (2012)7 102.4 98.6 58.4 63.6 74.5
Dental Providers / 100,000 (2013)7 54.8 65.1 57.0 47.6 63.2
Mental Health Providers / 100,000 (2014)8 246.7 189.4 86.3 71.1 134.1
% of Adults with No Regular Doctor (2011-2012)7 26.9% 29.7% 25.5% 26.1% 22.1%
Federally Qualified Health Centers / 100,000 (2014)7 1.3 1.19 0.25 1.53 1.92
% Population in Health Professional Shortage Area (2015)7 10.0% 27.0% 0% 34.6% 34.1%
7 CHNA.org/Community Commons from Centers for Medicare & Medicaid Services, Health Resources and Services
Administration, Centers for Disease Control and Prevention Behavioral Risk Factor Surveillance System 8 University of Wisconsin Population Health Institute, County Health Rankings & Roadmaps from Centers for
Medicare & Medicaid Services

34 | P a g e
Figure 4: Uninsured Adults as a Percentage of Adults 18-64 by Census Tract Overlaid with Health Center Service Delivery Sites and Grantees9
Access to Goods and Services Barriers
Transit access varies from excellent to poor in the service area. Many households have little or no transit
access, but also do not have access to a private motor vehicle. This can significantly limit their ability to
patronize health care facilities, supermarkets, educational opportunities, and much more. According to
US Department of Agriculture (USDA)'s Low Income/Low Food Access (LILA) database, the corridor along
I-85 in the service area has many census tracts which are classified as low income and residents do not
have a supermarket within a half-mile (orange) or one mile (green) travel distance. See Figure 34 in the
Appendix for transportation services.
9 U.S. Census Bureau, 2010-14 American Community Survey; Health Resources and Services Administration 2016
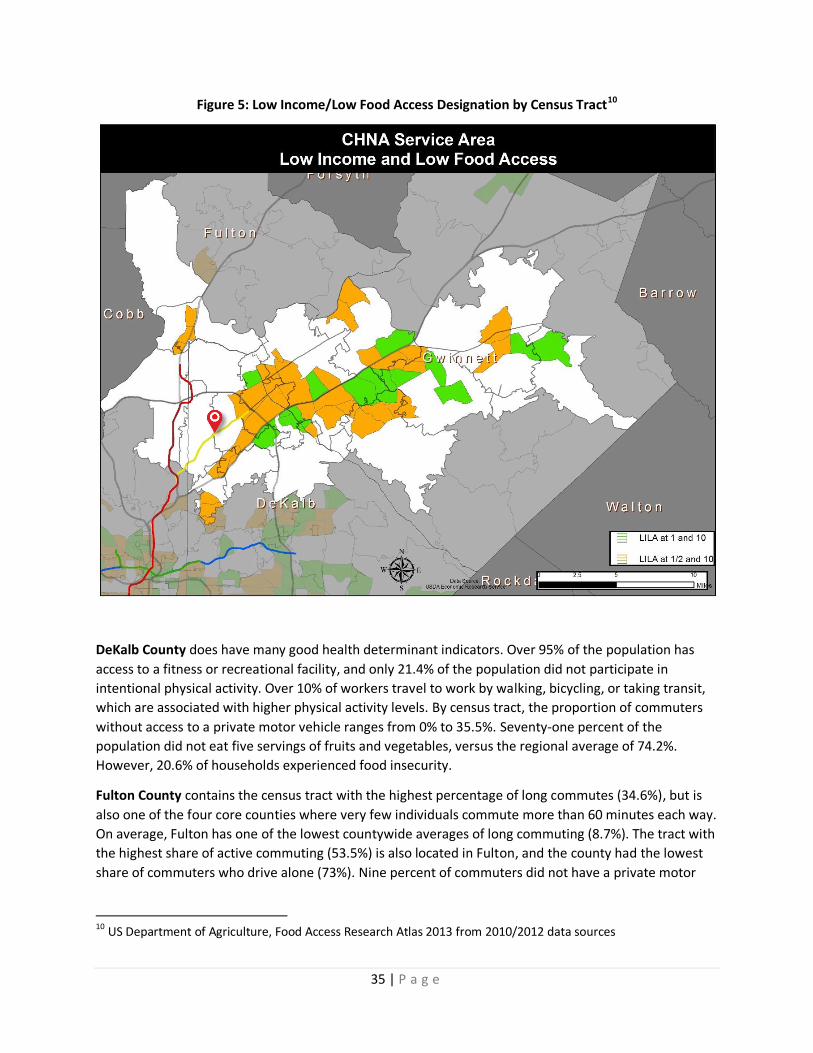
35 | P a g e
Figure 5: Low Income/Low Food Access Designation by Census Tract10
DeKalb County does have many good health determinant indicators. Over 95% of the population has
access to a fitness or recreational facility, and only 21.4% of the population did not participate in
intentional physical activity. Over 10% of workers travel to work by walking, bicycling, or taking transit,
which are associated with higher physical activity levels. By census tract, the proportion of commuters
without access to a private motor vehicle ranges from 0% to 35.5%. Seventy-one percent of the
population did not eat five servings of fruits and vegetables, versus the regional average of 74.2%.
However, 20.6% of households experienced food insecurity.
Fulton County contains the census tract with the highest percentage of long commutes (34.6%), but is
also one of the four core counties where very few individuals commute more than 60 minutes each way.
On average, Fulton has one of the lowest countywide averages of long commuting (8.7%). The tract with
the highest share of active commuting (53.5%) is also located in Fulton, and the county had the lowest
share of commuters who drive alone (73%). Nine percent of commuters did not have a private motor
10 US Department of Agriculture, Food Access Research Atlas 2013 from 2010/2012 data sources

36 | P a g e
vehicle (8.6%), ranging as high as 46.1% of the commuters in one census tract, and 11.8% of all
households in the county did not have a motor vehicle.
Gwinnett County had low unemployment rates but long travel times from some areas of the county.
Health Status Indicators
Georgia shows higher cancer, diabetes, obesity, and teen pregnancy rates than the nation. DeKalb
County shows higher incidence and mortality rates in general for each of the health issues addressed in
focus groups (i.e. diabetes, obesity, cardiovascular issues, teen pregnancy, pediatric asthma, and
cancer). African American residents show higher death and incidence rates than any other race across
most measures except breast cancer (white) and teen pregnancy (Hispanic). Hispanic and Asian
residents show lower rates of cancer incidence and mortality when compared with other racial
identities. Using combined death, hospital discharge, and ER utilization as a proxy for cancer incidence,
there are a few areas in the service area with a higher number of cancer cases than the surrounding
area. However, they cannot be calculated or compared as rates due to lack of accurate small area
population data.
Approximately one in four residents was reported to be obese across the study area counties, with one
in three being overweight. DeKalb County has higher rates of adults that are overweight than the state
and the other two counties in the study area. No obesity data was readily available for adults at a sub-
county scale.
Georgia shows higher teen births than the nation. DeKalb County shows the highest rate of teen births
when compared to the counties in the study area and the U.S. While not discussed directly in the focus
groups, the prevalence of HIV is much higher in DeKalb and Fulton Counties than Gwinnett County and
the state. It is important to note that screening rates are higher in these areas, which could increase
prevalence rates over areas with lower screening rates. The service area has very high hospital
utilization levels for pregnancy and childbirth for women of all ages. These utilization rates are above
state average for Fulton, DeKalb, and Gwinnett, and DeKalb is notably the highest. Rates could not be
accurately calculated for the service area due to limitations on population data. However, among
women ages 19 and under, above-average utilization levels were primarily concentrated in an area
between Norcross, Tucker, and Lilburn. The area with the highest utilization numbers also had the
highest number of teen births.
Cardiovascular disease is the leading cause of death in Georgia. There are higher rates of hypertensive
heart disease in DeKalb and Fulton Counties than is average for the state. African American residents
show higher rates than any other race or geography. More than 2.3 million adults (33%) in Georgia are
unaware of modifiable risk factors (lack of physical activity, poor diet, smoking, etc.) that may impact
cardiovascular disease.
Asthma rates are not as high as the state rate when considered at the county level; however, asthma
rates among African American residents are higher than any other race as well as higher than the state
and county rates. The service area also has somewhat higher amounts of ER utilization for asthma
attack, including for children. Areas along I-85 saw higher utilization for asthma. The number of pediatric
asthma ER visits was high in parts of the service area outside the Perimeter (Interstate 285), generally
between Buford Highway and Lawrenceville Highway.

37 | P a g e
Table 5: Chronic Health Issues by County and Race
Health Need DeKalb Fulton Gwinnett Asian African
American Hispanic/ Latino
White US GA
Cancer Mortality Age-adjusted11
156.5 165.2 145.2 89.6 185.6* 64.4 149.0* 168.9 171.2
Cancer Incidence – Lung11 55.1 56.1 54.1 26.6 60.0 31.5 53.9 63.7 68.8
Cancer Incidence – Breast11 135.0 135.0 129.4
133.1 104.6 139.8 123.0 123.5
Cancer Incidence – Colorectal11
42.4 41.0 37.6 28.1 49.4 31.3 35.3 41.9 42.3
Cancer Incidence – Prostate11 179.6 188.4 145.2 61.7 241.0 128.4 145.9 131.7 150.1
Diabetes (Age Adjusted %)11
10.4% 8.6% 8.6% 9.11% 10.48%
Diabetes Mortality (Age-adjusted rate)12
20.4 18.3 18.6 11.3 39.3 11.8 18.6 21.3 23.1
Medicare Enrollee Diabetes11 27.6% 23.5% 25.1% 26.9% 27.6%
Adult Obesity12
26% 22% 27% 27.10% 29%
Adult Overweight12 36.8% 33.3% 34.4% 35.8% 34.6%
Teen Pregnancy (per 1,000 pop) 11
28.9 26.0 18.4 -- 39 41.7 18.6 26.5 30.5
Pregnancy & Childbirth (per 100,000 women)11
3191.1 2794.7 2805.6 2588 3119.8 2072.5 2670.5
Heart Disease (Hypertensive)11
11.4 12.7 5.4 -- 19.2 -- 5.8 9.9
Heart Disease (Obstructive)11 27.9 39.4 40.3 67.1 216.3 -- 311.6 274.5
Asthma11 15 13.2 11 25.0 131.5 -- 72.2 -- 98.4
11
Georgia Department of Public Health Online Analytical Statistical Information System 2010-14 12 Health Indicators Warehouse
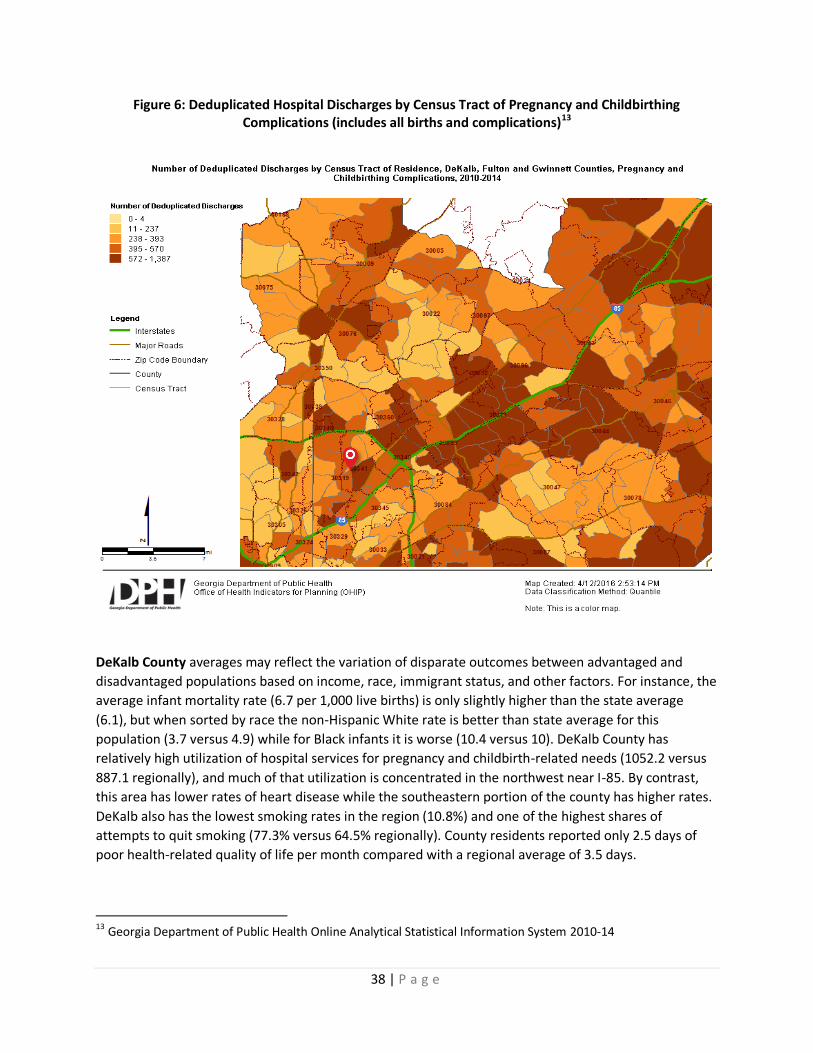
38 | P a g e
Figure 6: Deduplicated Hospital Discharges by Census Tract of Pregnancy and Childbirthing Complications (includes all births and complications)13
DeKalb County averages may reflect the variation of disparate outcomes between advantaged and
disadvantaged populations based on income, race, immigrant status, and other factors. For instance, the
average infant mortality rate (6.7 per 1,000 live births) is only slightly higher than the state average
(6.1), but when sorted by race the non-Hispanic White rate is better than state average for this
population (3.7 versus 4.9) while for Black infants it is worse (10.4 versus 10). DeKalb County has
relatively high utilization of hospital services for pregnancy and childbirth-related needs (1052.2 versus
887.1 regionally), and much of that utilization is concentrated in the northwest near I-85. By contrast,
this area has lower rates of heart disease while the southeastern portion of the county has higher rates.
DeKalb also has the lowest smoking rates in the region (10.8%) and one of the highest shares of
attempts to quit smoking (77.3% versus 64.5% regionally). County residents reported only 2.5 days of
poor health-related quality of life per month compared with a regional average of 3.5 days.
13 Georgia Department of Public Health Online Analytical Statistical Information System 2010-14
39 | P a g e
Overall, it seems that county residents enjoy above average health if they can avoid particular health
and safety hazards. Assault is a greatly elevated cause of premature death, at 11.1 deaths per 100,000
population and 39 hospital discharges per 100,000 population, both age-adjusted, versus 6.4 and 21.4
statewide. Premature death due to HIV/AIDS is also significantly elevated, as are hypertension, maternal
and infant health problems, and asthma. County residents are also more likely to die from common
types of cancer, excluding lung cancer. HIV prevalence is 1247.9 per 100,000 population, one of the
highest rates in the country. Chlamydia (651.3) and gonorrhea (234.0) prevalence are also higher than
the regional averages (421.0 and 124.0). Anemia is also an elevated cause of hospitalization (89.1 versus
51.2). However, residents are less likely to be hospitalized for mental health needs; the county has the
highest ratio of mental health providers in the region. Twenty seven percent of adults lack health
insurance, which is slightly higher than the regional average. The county has elevated rates of ER usage
for asthma (796.8 versus 551.6).
Fulton County residents report the second-lowest number of days of poor physical health per month
(2.4 versus 3.5), average premature death rates, and very low rates of preventable hospitalization (43.5
versus 60.6 statewide). County residents also report the third-lowest number of poor mental health
days (2.7 versus 3.3). However, ER utilization for mental health needs is above average (1,146.2 versus
902.9 per 100,000 population). Fulton also has elevated rates of assault-related hospitalizations (46.6
versus 33.0 per 100,000 population) and ER visits (368.6 versus 230.0). Overall, traffic related fatality
rates are very low.
In the county, just 19.1% of adults reported that they did not engage in intentional physical activity,
versus 22.3% of the region. Fourteen percent of workers used a physically active form of commuting.
Diabetes diagnoses were relatively low (8.6% age adjusted versus 10.0% regionally), though
hospitalization for this condition was slightly above average (181.4 versus 155.4). Most cardiovascular
disease rates were average or below average, with the exception of hypertension-related conditions;
Fulton residents were hospitalized for hypertension at a rate of 107.7 versus 81.7 per 100,000
population regionally.
Smoking rates were below average at 13.3% compared with 15% regionally. However, asthma-related
ER visits were elevated (674.1 versus 551.6). Approximately five percent of households were
overcrowded (4.7%), and 16.0% of residential properties were vacant. Sexually transmitted infections
continue to be a concern for the county as well. Chlamydia prevalence was 556.9 versus 421 per
100,000 population region-wide, and gonorrhea was prevalent at 239.5 versus 124. At 1,307.3, HIV/AIDS
rates were the highest in the region, and one of the highest rates in the U.S. HIV testing rates, 55.0%,
were also some of the highest in the region.
Gwinnett County had the lowest percentage of residents reporting poor dental health in the region, at
8.3%. Most health indicators are better than average. Rates of heart disease, respiratory disease,
cancers, injuries, mental health, maternal and infant health, and most other leading health conditions
were all well below regional and state averages. Premature mortality was less likely to result from traffic
fatalities but more likely to occur by gun violence. The birth rate (38.7) was nearly equivalent to the
regional average (38.6), and hospital utilization for pregnancy and childbirth was only marginally above
average. The teen birth rate, 9.1, was below the regional average of 12.0. The prevalence of sexually
transmitted illnesses (STIs) was below average, and HIV testing rates were above average.

40 | P a g e
The premature death rate, 4,827.5, is much lower than the regional average (6,330.5). Residents report
fewer poor physical health days (2.6 versus 3.5) and fewer poor mental health days (2.7 versus 3.3).
However, the county’s elderly appear to have some elevated health risks for their age, such as slightly
elevated mortality due to dementia and hospital utilization for Alzheimer’s.
41 | P a g e
IX. Community Resources to Meet Needs
Purpose
Taking an inventory of the resources available to improve health is an important step in assessing the
health needs of communities served by Mercy Care. Knowing what resources are available to improve
health offers an understanding of the capacity and potential partners in the community which can
increase the success of any efforts to address health needs.
Methodology GHPC completed an environmental scan of community resources that may meet health needs of
residents by collecting information from Mercy Care, primary data sources (i.e., interviews, focus groups
and listening sessions), secondary data, and internet research to identify the community resources that
are currently operating in the community to meet the needs identified by the CHNA.
GHPC focused specifically on assets that were deemed to be operational and of notable value to the
community. Not all assets in each county have been included in this report. Assets were prioritized
based on their scope and level of activity so far as could be determined. We have not listed
organizations without a functioning website or food banks that do not distribute food or meals. A strong
focus has been placed on representing organizations that provide services to vulnerable populations, as
well as organizations that provide free or sliding scale services.
The organizations GHPC documented were broken out into three separate categories based on their
primary focus: health care, community focused, and education. Of the 23 county-specific assets, 1 has a
focus on education, 7 have a healthcare or health related focus, and 15 are community focused. The
region includes assets with a regional, and in some cases, a statewide reach. A table has been provided
showing in which counties larger organizations are operating.
Characteristics Community assets are people, places, and relationships that can conceivably be used in acting to bring
about the most equitable functioning of a community. Community assets can include grocery stores,
parks, schools, and hospitals. The Mercy Care Chamblee service area has a multitude of community and
organizational assets ranging from local healthcare facilities, to faith-based institutions, to independent
community groups. To analyze the community assets in the region, GHPC focused on those providing
health and health related services. GHPC included faith-based institutions when they provide health-
related services to the community. Reviewing data from the National Center for Charitable Statistics, the
Georgia Center for Nonprofits, and Community Commons GHPC was able to document 33 county-
specific organizations within the region. Each of the region’s counties has within its boundaries or is
proximate to the basic community assets of schools, parks, and healthcare facilities.
Recommendations GHPC recommends that Mercy Care continue to foster and facilitate a partnership with community
resources. It will be important to convene stakeholders around important issues and goals. Mercy Care’s
new clinic can lend space for community meetings. Mercy Care can also participate in the broader
community discussions related to the health of residents.

42 | P a g e
Summary
Existing health care facilities
Access is a crucial component of achieving health. An estimated 2,180 primary care physicians (86 per
every 100,000 people) are available in the region. Twenty-seven (27) federally qualified health centers
and 21 acute care hospitals are located in the 3 counties.
Table 6: Acute Care Hospitals in Mercy Care Chamblee Service Area
Hospital Name City County
Children's Healthcare of Atlanta at Egleston Atlanta DeKalb
DeKalb Medical Decatur DeKalb
DeKalb Medical Hillandale Lithonia DeKalb
Emory University Hospital Atlanta DeKalb
Emory University Orthopedics and Spine Hospital Tucker DeKalb
Wesley Woods Geriatric Hospital of Emory University Atlanta DeKalb
Atlanta Medical Center Atlanta Fulton
Children's Healthcare of Atlanta at Hughes Spalding Atlanta Fulton
Children's Healthcare of Atlanta at Scottish Rite Atlanta Fulton
Emory Johns Creek Hospital Johns Creek Fulton
Emory University Hospital Midtown Atlanta Fulton
Grady Memorial Hospital Atlanta Fulton
North Fulton Regional Hospital Roswell Fulton
Northside Hospital Sandy Springs Fulton
Piedmont Hospital Atlanta Fulton
Emory Saint Joseph's Hospital Atlanta Fulton
South Fulton Medical Center East Point Fulton
Emory Eastside Medical Center Snellville Gwinnett
Emory John’s Creek Hospital Duluth Gwinnett
Gwinnett Medical Center Duluth Duluth Gwinnett
Gwinnett Medical Center Lawrenceville Gwinnett
Other existing community resources
Below is a listing of community assets by county. Following the list of state-wide assets, the
organizations are presented in alphabetical order by county. The total number of county-specific assets
identified in each county follows the name of each county.

43 | P a g e
Table 7: State-wide Community Resources
Organization Counties Served
Boys and Girls Club DeKalb, Fulton, Gwinnett
Children’s Advocacy Centers of Georgia Fulton, Gwinnett
CIMA International Women's Health Services Fulton, Gwinnett
Communities in Schools DeKalb, Fulton
Georgia Family Connection All Counties
Georgia Head Start All Counties
United Way Fulton#
YMCA DeKalb, Fulton, Gwinnett #United Way of Greater Atlanta is located in Fulton County, but also serves DeKalb and Gwinnett.
Boys and Girls Clubs provide a structured and positive environment and programs for young people.
http://bgcncg.org/
Children’s Advocacy Centers of Georgia The majority of CAC Georgia’s professional work product is
designed to provide direct services to CACs across the state. A critical corollary is to provide direct
services and support to those Georgia communities that seek to establish a CAC within their judicial
circuit, by working with the base of stakeholders who will ultimately become active as multidisciplinary
team members. http://www.cacga.org/
CIMA Women’s Clinic primarily serves the immigrant female population through its five locations in
Doraville, Norcross, Sandy Springs, Indian Trail and Chamblee. The clinic, which has been serving the
community for 13 years, offers maternity and family planning services as well as routine Ob/Gyn
services. http://www.cimasalud.net/cima--about-us.html
Communities in Schools is the nation’s largest dropout prevention organization. The mission of
Communities in Schools is to champion the connection of needed community resources with schools to
help young people successfully learn, stay in school and prepare for life. By bringing caring adults into
the schools to address children’s unmet needs, CIS provides the link between educators and the
community. For over 30 years, Communities In Schools has worked to ensure that every child needs and
deserves these “Five Basics”: a one-on-one relationship with a caring adult, a safe place to learn and
grow, a healthy start and a healthy future, a marketable skill to use upon graduation, and a chance to
give back to peers and community. http://www.communitiesinschools.org/
Georgia Family Connection collaborative organizations operate in independently in counties as local
decision-making bodies, bringing community partners together to develop, implement, and evaluate
plans that address the serious challenges facing Georgia’s children and families. They are supported by
the Georgia Family Connection Partnership, a nonprofit public-private intermediary which exists to:
unify their commitment to Georgia’s children and families, make sure their efforts to improve the lives
of children and families work and, protect every dime of their investment in Georgia’s future.
http://www.gafcp.org/
Georgia Head Start and Early Head Start programs provide comprehensive early childhood and family
development services to children from birth to five-years-old, pregnant women and families. Their
programs have a long tradition of delivering comprehensive and high quality services designed to foster
healthy development in low-income children and their families. Head Start agencies provide a range of

44 | P a g e
individualized services in the areas of education and early childhood development; medical, dental, and
mental health; nutrition; parent involvement and family support. In addition, the entire range of Head
Start services is responsive and appropriate to each child and family's developmental, ethnic, cultural,
and linguistic heritage and experience. They operate in 57 of 59 Georgia counties.
http://www.georgiaheadstart.org/
United Way seeks to provide adequate funding and guidance for member agencies to:
Provide for immediate needs of those in crisis situations
Meet long-term needs through the educational, emotional and moral guidance of children
Enable financially or physically disabled people to become self-supporting
Websites are regional, https://www.unitedwayatlanta.org/
YMCA makes accessible the support and opportunities that empower people and communities to learn,
grow and thrive. With a focus on youth development, healthy living and social responsibility, the YMCA
nurtures the potential of every youth and teen, improves the nation’s health and well-being and
provides opportunities to give back and support neighbors. Website is regional,
http://www.ymcaatlanta.org/
County-specific Community Resources
DeKalb (8):
All About Developmental Disabilities is a 501(c)(3) Georgia non-profit organization. They work to
ensure that individuals and families living with developmental disabilities are equipped with critical
support services, broad-based education, community integration opportunities, and effective advocacy
from age three and throughout their lifespan. http://aadd.org/
Care and Counseling Center of Georgia is a faith based non-profit organization offering counseling
services to individuals and families in the greater Atlanta area. They are one of the largest mental health
providers in Georgia. http://cccgeorgia.org/
CaringWorks helps those who are homeless stabilize their lives and move toward greater self-
sufficiency. They provide the housing and support needed to get people to a better place in life.
http://www.caringworksinc.org
Hispanic Health Coalition of Georgia is a 501 (c) (3) non-profit organization created to advance health
policies that will improve access to services for Hispanic children and adults throughout the state.
HHCGA is currently Georgia's only statewide organization that focuses on Latino/Hispanic health.
Together with its members (both health-related and non-health centered organizations and
professionals), HHCGA identifies needs and service gaps leading to health disparities for Georgia
Hispanics and offers direct community services as well as supportive activities to help its members
improve the health wellbeing of Georgia Latinos. HHCGA informs individuals and agencies on current
health disparities and ways to reduce these disparities. As part of its efforts, HHCGA offers skills
development services to organizations who desire to provide high quality, culturally and linguistically
appropriate services. http://www.hhcga.org/

45 | P a g e
21st Century Leaders (21CL) was established by a group of executives in response to two alarming
trends: 1) a lack of people prepared to accept leadership roles, and 2) the difficulty of employees in
crossing class and racial barriers to work together. The group realized the key to reversing these trends
is providing young people with the training, guidance, and encouragement necessary to enter college
and the workforce with a highly developed set of leadership skills. The mission of 21st Century Leaders is
to inspire the next generation of Georgia leaders by empowering high school students with essential
business and community leadership skills through programs connecting a diverse group of enthusiastic
peers and passionate professionals. http://21stcenturyleaders.org/
The Wylde Center teaches environmental awareness through hands-on gardening and outdoor
education programs. The Wylde Center engages students in projects that address real needs, both
through the community gardens and through outreach projects in Decatur City and DeKalb County
schools and community centers. The Wylde Center has been instrumental in helping create the outdoor
garden environments at many of the schools in Decatur and is also helping guide the Farms to School
initiative in Decatur. http://wyldecenter.org/
Arms Wide Open Community Development Fund is a tax-exempt corporation specializing in home and
community-based services. When people become frail due to age, accident, serious illness, injury or
sickness, Arms Wide Open CDC helps them to live at home with dignity. Arms Wide Open CDC operates
three programs: 1) Durable Medical Equipment Loan Program, 2) Community Chaplaincy Program, and
3) Life Care Program. Arms Wide Open CDC administers high-quality, cost-effective, and goal-oriented
programs that help people with disabilities and chronic illnesses. http://armswideopen.org/
Center for Pan Asian Community Services CPACS is a private non-profit agency that promotes self-
sufficiency and equity for immigrants, refugees, and the under-privileged through comprehensive health
and social services, capacity building, and advocacy. http://www.icpacs.org/
Fulton (8):
100 Black Men of Atlanta Inc. provides mentoring, physical fitness training, and college preparation for
inner city youth, through activities such as Robotics. http://www.100blackmen-atlanta.org
Action Ministries serves homeless women through their Women’s Community Kitchen and homeless
children through their Children’s Program. http://actionministries.net/
AID Atlanta focuses on prevention and early diagnosis of common health issues such as diabetes and
heart disease. Their services include physical exams, prostate and testicular exams, screening and
treatment for sexually transmitted diseases, and blood glucose and cholesterol testing.
https://www.aidatlanta.org/home
Agape Community Center empowers and supports underserved families within its community to
discover and embrace their full potential. Agape achieves this mission by offering programs and services
that are responsive to a variety of needs for school-age children, disabled individuals, adults, senior
citizens, and families of northwest Atlanta. Current programs offered include the following:
Academic—based afterschool for elementary and middle school students
ESOL for Spanish speaking students with language barriers
The Ginger Kaney Mentoring Institute for high school students

46 | P a g e
Ragtime, a day program for seniors and disabled adults
Emergency assistance for families
GOGIRLGO! and F.I.T. Camp for Boys, athletic, health & wellness summer camp
Camp Jumpstart – a summer early reading program for rising first and second graders
Agape to Go – a family nutrition backpack program
Annual Events: great backpack giveaway, great Thanksgiving giveaway, extreme bedroom
makeover
http://agapeatlanta.org/
Atlanta Housing Authority – Quality of Life Initiative allows families in AHA's remaining conventional
public housing projects the opportunity to escape an environment of concentrated poverty, consistent
with AHA's vision of providing eligible families with access to affordable housing, while de-concentrating
poverty and building healthy communities.
http://www.atlantahousing.org/portfolio/index.cfm?fuseaction=qli
The Center for Black Women’s Wellness, Inc. is a non-profit organization that provides free and low-
cost services to empower black women, and their families, toward physical, mental, and economic
wellness. CBWW recognizes that empowering black women leads to the empowerment of the family
and, eventually, the empowerment of the community. CBWW’s comprehensive services include:
preventative health services, maternal and child health services, mental health screening and referrals,
and self-employment training. http://www.cbww.org/
CHRIS Kids, Inc. offers an array of individualized programs through its Family of Services which includes:
Behavioral Health, Safe Homes & Environments, Strong Communities and Education & Training. This
holistic approach enables children, youth and families to unlock their potential for happiness, health and
success despite challenging circumstances, often beyond their control. CHRIS Kids’ ambition is to be
Georgia's go-to place where every vulnerable child or traumatized youth discovers how to unlock their
potential. http://www.chriskids.org/home-page
Health Education, Assessment, and Leadership (HEAL) provides health education and medical services
to at risk and underserved populations. It is committed to assess the needs of communities and to build
leaders from within those communities through health awareness and health education, training, and
supportive programs. The HEALing Community Center is located in one of Atlanta’s poorest
neighborhoods (Zip Code 30314), where having no medical insurance is commonplace. The HEALing
Community Center is dedicated to providing free specialty medical care to low income children, women,
and men. http://healingourcommunities.org/
Los Niños Primeros is an educational enrichment program for Latino children in Sandy Springs. The
program aids at-risk Latino children increase their school readiness through their Saturday School and
Summer School programs. The program serves over one hundred children each year and yields positive
outcomes in increasing reading proficiency and language skills. http://www.losninosprimeroga.org
Gwinnett (7):
Good Samaritan Health Center of Gwinnett, Inc., a 501(c) (3) non-profit organization, is a faith-based
organization committed to caring for the uninsured and underinsured working poor in our community.
47 | P a g e
They serve the community by helping to eliminate health disparities for uninsured and underinsured
populations. www.goodsamgwinnett.org
Gwinnett Children’s Food Umbrella’s mission is to alleviate hunger and improve the nutritional well-
being of Georgia's Children. http://www.gwinnettchildren.com/
The Gwinnett Coalition for Health and Human Services is a non-profit organization dedicated to
addressing the health and human service needs of everyone in Gwinnett County, Georgia. The two
primary functions of the Coalition are the management of a community Helpline, and coordination of a
3 year Strategic Plan for children and families. Major strategic focus areas include Positive Child and
Youth Development, Strengthening Individuals and Families, and Strengthening Communities.
http://www.gwinnettcoalition.org/
Gwinnett United in Drug Education Inc. has used data-driven, evidenced-based strategies since 1986 to
reduce and prevent the use, misuse, and abuse of alcohol, tobacco and other drugs by focusing on
environmental strategies to achieve community-level change. In the past, they have made significant
strides in reducing inhalant use, tobacco use, second hand smoke, and underage drinking. GUIDE follows
SAMHSA‘s Strategic Prevention Framework (SPF) for all strategic planning. http://www.guideinc.org
Health MPowers is a designated 501(c)(3) non-profit organization working to improve the health status
and environment for students in grades PreK-8. HealthMPowers is a comprehensive school health
intervention program that exemplifies the key strategies that the Centers for Disease Control and
Prevention (CDC) has outlined for improving health, physical activity, and healthy eating in schools. The
HealthMPowers’ program is designed to provide students, school staff, and families with information,
skills, resources, and motivation necessary to take responsibility for their own health.
http://www.healthmpowers.org/
The Hope Clinic, a non-profit primary care internal medicine clinic in Gwinnett County provides an
affordable alternative to the hospital emergency room for the primary care medical needs of the
uninsured. The clinic is a vital part of Gwinnett's healthcare safety net and supplies over half of the
available charitable primary care capacity in the county. http://hopeclinicgwinnett.info/
Norcross Meals on Wheels has provided thousands of hot midday meals, five days a week, for over
thirty-five years. Norcross Meals on Wheels began by delivering to the Norcross and Duluth areas, and
has expanded to include Berkeley Lake and Peachtree Corners. They are now a 501(c)(3) nonprofit
organization with a dedicated board of directors and program coordinator.
https://norcrossmealsonwheels.org/
CPACS’ Cosmo Health Center (Center for Pan Asian Community Services) is a Federally Qualified Health
Center located in Norcross. This new status as an FQHC allowed CPACS to purchase a new facility and
expand its existing health services to accommodate a larger population including more low-income,
underserved, uninsured individuals and those with low English language proficiency. It also allowed
CPACS to expand its existing primary and preventative care clinics as well as expand its hours. In addition
to primary and preventative care, Cosmo Health Center also offers Internal Medicine, In-Office Minor
Surgeries, Immigration Physical Exams, Ob/Gyn and Dental services. Cosmo also provides health
education resources on HIV/AIDs, Family Planning, Medical Insurance, Mental Health and Counseling
and Breast Cancer awareness. http://cpacscosmo.org/

48 | P a g e
X. Appendices
Appendix A:
Focus Group Discussion Guide
Overview of Purpose of Discussion and Rules of a Focus Group
Facilitator introduces self and thanks those in attendance for participating Facilitator explains purposes of discussion:
The project is being undertaken by Mercy Care. The health system is planning to open a clinic in the Chamblee
area. Mercy Care would like to hear from people who live in these communities. They are particularly
interested in your feelings about the location of the clinic, health and health needs of the community, how the
health-related challenges might be addressed and what is already in place in your community to help make
change happen. More than just determining what the problems are, they want to hear what solutions you all
have to address the needs and what you would be willing to support in terms of programs, services, and
opportunities.
Explain about focus groups:
Give and take conversation
I have questions I want to ask, but you will do most of the talking
There are no right or wrong answers
You are not expected to be an expert on health care, we just want your opinion and your perspective as a member of this community
You don't have to answer any questions you are uncomfortable answering
It is important to speak one at a time because we are recording this conversation
Your names will not be used when the tapes are transcribed, just male or female will appear on any transcript
I want to give everyone the opportunity to talk, so I may call on some of you who are quiet or ask others to “hold on a minute” while I hear from someone else, so don’t take offense
Here is an informed consent form for you to read along with me and then sign. (Read informed consent, collect signatures)
Participant Introductions
Please go around the table and introduce yourself and tell us how long you have lived in the Chamblee area.
I am going to ask you all a series of questions about your opinions related to healthcare and the locations where
you seek health services (primary care, hospital care, urgent care, etc.).
1. Where do you secure health services (primary care, hospital care, urgent care, etc.?) 2. If you have a regular doctor, what do you like about the practice? If you do not have a regular doctor, what do
you look for when seeking health services? (Primary care, hospital care, urgent care, etc.) I am going to ask you all a series of questions about your own health and healthcare first, and then some questions
about what you see happening in your larger community related to health and wellbeing.
Thoughts on Health for Your Family and Community
3. Do you think that most people in your community are healthy? 4. Do you think that there is something about your community that contributes to people having these types of
issues? 5. What do think might be effective solutions to addressing these issues in the community? I am going to ask you all a series of questions about Mercy Care as a health provider.
49 | P a g e
6. What are your thoughts/feelings regarding the location of a Mercy Care clinic in your community? 7. What should be the focus areas for health education programs at the new Mercy Care Clinic in the
community? 8. What types of services would you like to see provided? 9. Are there any other ways you would like to be engaged by Mercy Care (information, volunteerism, etc.)?
Healthy Behaviors
I want to go a bit deeper in a few areas related to your and your family’s health.
10. Let’s start with healthy eating. Most of the time, do you and your family eat as healthily as you would like? What prevents you from eating healthily? (Probe for cultural issues, access to healthy food)
11. Now let’s talk about physical activity. What kinds of physical activity do you and your family engage in? Do you think you get enough physical activity to be healthy?
12. What keeps you and your family from being as physically active as you would like to be? What would help you and your family get more exercise?
13. If you could make 2 or 3 changes that would promote better health, what would they be? 14. How about tobacco use? How prevalent is tobacco use among your family and friends? Do you think most
people are aware of the risks related to tobacco use? What do you think it would take to change people’s habits when it comes to tobacco use?
15. Are drug and alcohol abuse a problem in your community? What contributes to this problem? What could be done to address the problem?
16. Another health issue of concern is risky sexual behavior among teens. Do you see this as prevalent in your community? Are there support services to help teens deal with this type of issue?
17. When you think about the health concerns we have discussed –do you know of any resources/programs/services in your community that help with these issues? Are there different types of services that would be more appropriate or effective?
Health Outcomes and Access
18. What is your reaction to this information? Does it ring true to what you know about your community? Is there anything missing from these data that you believe to be true about your community?
19. What do you think is the best/most effective way to begin to address these issues? 20. What do you see as the role of the hospital or health system to address these issues? 21. Considering the information that I just presented to you, along with your own experience with critical health
needs here, which 1 or 2 of these health issues should be the priorities for addressing over the next three years?
Health Concerns in the Community
22. Now let’s talk about what about your community. Please tell me about the strengths/positives in your community.
23. In communities, people often talk about community leaders- these are organizations or individuals that everyone knows, places/people that you seek out when you need information that is trusted. Do you know of these types of organizations or people who are concerned about health issues and serve as
leaders in trying to improve health in your community? Who are they – what are they doing? Are their efforts
successful? Why or why not?
24. Would these organizations or people be good leaders for addressing other health issues in the community? If not them, then who?
Closing:
How would you like your community to be different in 5 years in order to be a healthier place for you and your
family to live?

50 | P a g e
Appendix B: Stakeholders Interviewed for Community Leader Input
Stakeholder Interview List
Name Organization Position
Shirley Anne Cruz LaAmistad Assistant Director
Selena Freeman Mercy Housing Chamblee Program Manager
Keun Kim The Center for Pan Asian Community Services, Inc.
Marketing and Development
Adam Causey The City of Chamblee Economic Development Manager
Evonne Yancey Kaiser Permanente Director of Government and Community Affairs
Emily VanderWiele and Dr. Lennon
CHOA, Children’s at Chamblee Primary Care Center
Director of Physician Practice Operations and Medical Director, Primary Care
Nicole Hendrickson Gwinnett County Administration Community Outreach Program Director
Salvador Arias Retired Mercy Care Board Member
Morgan Alexander The Georgia Lions Lighthouse Foundation Inc. Program Manager
ESJH Group Interview (12) Emory Saint Joseph's Hospital Doctors and Hospitalists
Jose Almaraz Futbol Pasion Director
Pedro Marin Georgia State House of Representatives State Representative
Sandra Valencia Thompson
Catholic Charities Program Manager, Clinical Services

51 | P a g e
Appendix C:
Community Leader/Stakeholder/Key Informant In-Depth Interview Guide
INTRODUCTION
1. What in your opinion are the districts/county’s biggest health issues or challenges that need to
be addressed?
2. What do you think are some of the root causes for these challenges?
3. How important an issue to the district/county is the reduction/elimination of health disparities? What is your perception of current disparities?
4. How would you describe the present level of public/private partnerships that are occurring to improve health and reduce health disparities in the county?
5. What are the challenges to beginning and sustaining such partnerships? 6. What specific programs and local resources have been used in the past to address health
improvement/disparity reduction?(might cite examples of programs by disease state, life stage or otherwise)
COMMUNITY CAPACITY 1. Who/What are some of key individuals/organizations/programs to health and health care in the
community? 2. Which community based organizations are best positioned to help improve the community’s
health? Private sector agencies Public sector agencies
3. Are there individuals, agencies or organizations you’d like to see more engaged in your community’s health improvement journey?
4. Are you familiar Mercy Care’s plan to open a clinic in the Chamblee area? 5. What are your thoughts about the Mercy Care building a clinic in the Chamblee community (i.e.,
appropriateness of location, who might be likely users, etc.)? 6. What should be the focus areas of programs and services at the new Mercy Care Clinic in the
Chamblee area (serving parts of DeKalb, Fulton and Gwinnett Counties)? Clinic services: Other programs and services (e.g. health education, health promotion, outreach and enabling services, etc.)
MOVING THE NEEDLE
1. If you could only pick 3 of these health issues, which are the most important ones to address
either now (short term) or later (long term)? What should be the focus of intervention by county/district/community?
2. Why did you pick these? 3. What interventions do you think will make a difference?
a. Probe for different types of interventions related to: i. Policy ii. Environment
iii. Program 4. Do you have any other recommendations that you would make to Mercy Care as they develop
intervention strategies?

52 | P a g e
Appendix D: Secondary Data
Data Sources - Descriptions
Centers for Disease Control and Prevention (CDC): The Behavioral Risk Factor Surveillance System
(BRFSS) is the nation's premier system of health-related telephone surveys that collect state data about
U.S. residents regarding their health-related risk behaviors, chronic health conditions, and use of
preventive services. Established in 1984 with 15 states, BRFSS now collects data in all 50 states as well as
the District of Columbia and three U.S. territories. BRFSS completes more than 400,000 adult interviews
each year, making it the largest continuously conducted health survey system in the world.
County Health Rankings and Roadmaps: The annual County Health Rankings measure vital health
factors, including high school graduation rates, obesity, smoking, unemployment, access to healthy
foods, the quality of air and water, income, and teen births. The annual rankings provide a revealing
snapshot of how health is influenced by where we live, learn, work and play. Building on the work of
America's Health Rankings, the University of Wisconsin Population Health Institute has used this model
to rank the health of Wisconsin’s counties every year since 2003. The County Health Rankings measure
the health of nearly all counties in the nation and rank them within states. The rankings are compiled
using county-level measures from a variety of national and state data sources. These measures are
standardized and combined using scientifically-informed weights.
Georgia Department of Public Health Online Analytical Statistical Information System (OASIS): The
Online Analytical Statistical Information System (OASIS) is a web-based tool that allows access publicly
available health data and statistics for the state of Georgia. The standardized health data repository
used by OASIS is currently populated with Vital Statistics (births, deaths, fetal deaths, induced
terminations, and pregnancies), Hospital Discharge, Emergency Room Visit, Arboviral Surveillance, Youth
Risk Behavior Survey (YRBS), Behavioral Risk Factor Surveillance Survey (BRFSS), and STD, Motor Vehicle
Crash, and Population data. Where applicable, data can be stratified by age groups, race, ethnicity, sex
(person), census tract, county commission district, county, health district, legislative district, perinatal
region, state (place), and year (time).
Health Indicators Warehouse: The Health Indicators Warehouse (HIW) is a user-friendly web-accessible
database of pre-tabulated national, state, and local health indicators, reflecting multiple dimensions of
population health, health care, and health determinants. The HIW also contains supporting descriptive
data to facilitate understanding and appropriate use of the indicators, as well as links to evidence-based
interventions. The National Center for HIV/AIDS, Viral Hepatitis, STD, and TB Prevention data is also
accessible through the Health Indicators Warehouse.
Community Commons: This toolkit is a free web-based platform designed by a collaborative body in
response to the IRS requirement outlined in the Affordable Care Act. This tool was built to assist
hospitals and organizations seeking to better understand the needs and assets of their communities as
well as collaborate to make measurable improvements in community health and well-being. It
aggregates up-to-date data from dozens of sources, including the American Community Survey, Centers
for Medicare and Medicaid Services, Dartmouth Atlas of Health Care, Environmental Protection Agency,
National Cancer Institute, National Center for Education Statistics, National Highway Traffic Safety
Administration, and others.

53 | P a g e
Truven Health Analytics Community Need Index: The CNI score is an average of five different barrier
scores that measure various socio-economic indicators. The insurance barrier is drawn from their own
health insurance coverage estimates using multiple data inputs. The other four barriers are obtained
from Nielsen (formerly Claritas) which derives estimates from decennial census data from 2000 and
2010, and Five-Year American Community Survey data with 2008-12 as the most recent published
update. These barriers, and the statistics that comprise them, were chosen and tested by Dignity Health
and Truven Health. Every populated ZIP code in the United States is assigned a barrier score of 1, 2, 3, 4,
or 5 depending upon the ZIP code national rank (quintile). A score of 1 represents the lowest rank
nationally for the statistics listed, while a score of 5 indicates the highest rank nationally. For the two
barriers with only one statistic each (education and housing), Truven Health used only the single statistic
listed to calculate the barrier score. For the three barriers with more than one component statistic
(income, cultural and insurance), Truven Health analyzed the variation and contribution of each
statistics for its barrier; Truven Health then weighted each component statistic appropriately when
calculating the barrier score. Once each ZIP code is assigned its barrier scores from 1 to 5, all five barrier
scores for each ZIP code are averaged together to yield the CNI score. Each of the five barrier scores
receives equal weight (20% each) in the CNI score.
Health Resources and Services Administration (HRSA). The HRSA Data Warehouse (HDW) map and
feature services provide access to the spatial data available in the HDW. Services include HRSA data as
well as additional layers, such as state and county boundaries, that help establish the geographic
context of HRSA-specific data. Map layers can be directly viewed with ArcGIS for Desktop Software or
through custom applications using the service's REST or SOAP endpoints. The Primary Health Care
Facilities feature service provides information on Health Center Service Delivery Sites and Health Center
Service Delivery Grantees.
US Department of Agriculture Food Access Research Atlas. In the Food Access Research Atlas, several
indicators are available to measure food access along these dimensions. The criteria for identifying a
census tract as low income are from the Department of Treasury’s New Markets Tax Credit (NMTC)
program. This program defines a low-income census tract as any tract where the tract’s poverty rate is
20 percent or greater; or the tract’s median family income is less than or equal to 80 percent of the
State-wide median family income; or the tract is in a metropolitan area and has a median family income
less than or equal to 80 percent of the metropolitan area's median family income. In the Food Access
Research Atlas, low access to healthy food is defined as being far from a supermarket, supercenter, or
large grocery store ("supermarket" for short). A census tract is considered to have low access if a
significant number or share of individuals in the tract is far from a supermarket. Low access was
measured as living far from a supermarket, where 1 mile was used in urban areas and 10 miles was used
in rural areas to demarcate those who are far from a supermarket. In urban areas, about 70 percent of
the population was within 1 mile of a supermarket, while in rural areas over 90 percent of the
population was within 10 miles. A slightly more complex measure incorporates vehicle access directly
into the measure, delineating low-income tracts in which a significant number of households are located
far from a supermarket and do not have access to a vehicle.
54 | P a g e
US Census Bureau. The decennial census is conducted once every 10 years to provide an official count of
the entire U.S. population to Congress. The American Community Survey (ACS) is conducted every year
to provide up-to-date information about the social and economic needs of the community. Every year,
the U.S. Census Bureau contacts over 3.5 million households across the country to participate in the
ACS. The ACS shows how people live-- education, housing, jobs and more. For example, results may be
used to decide where new schools, hospitals, and emergency services are needed. The Census Bureau
aggregates individual ACS responses into estimates at many geographic summary levels, such as states,
counties, cities, tracts, block groups, and census designated places. In order to balance geographic
resolution, temporal frequency, statistical significance, and respondent privacy, ACS estimates released
each year are aggregated from responses received in the previous one, three, or five calendar years. 1-
year estimates are available for areas with a population of at least 65,000 people; 3-year estimates were
available for areas with 20,000 people or more (this data product was discontinued in 2015 due to
budget cuts); and 5-year estimates are available for all areas down to the block group scale.

55 | P a g e
Supplementary Maps and Tables.
Figure 7: Community Need Index by Zip Code
* Note- Darker color indicates high socio-economic barriers to accessing healthcare

56 | P a g e
Figure 8: Children in Poverty by Census Tract14
14 US Census Bureau, 2010-2014 American Community Survey

57 | P a g e
Figure 9: Parental Resources: Single Parent Households by Census Tract and School Performance Index15
In Figure 9, the proportion of single-parent households is shown in orange, with more heavily-shaded
areas having the highest rates. The lightest areas have less than 25% single-parent households, medium-
shaded areas have >25% to 50%, and the brightest orange areas have >50% to 75%. None of the census
tracts in the service area had more than 75% single parent households, but several had rates over 50%.
For families with limited parental resources, schools can play a larger role in child care and
development. The College and Career Readiness Performance Index (CCRPI), developed by the Georgia
Department of Education, rates schools not only on grades and test scores, but also on factors such as
attendance, enhanced curricula, and the performance gaps between English-learners, economically
disadvantaged students, and students with disabilities relative to other students. Scores range from 0 to
100 plus up to 10 bonus points. There were around twenty failing schools in the service area (60 points
or under) but also many high-performing schools.
15 US Census Bureau, 2010-2014 American Community Survey; Georgia Department of Education

58 | P a g e
Figure 10: Language Barriers by Census Tract16
16 US Census Bureau, 2010-2014 American Community Survey

59 | P a g e
Figure 11: Linguistically Isolated Households by Census Tract
Figures 10 and 11 indicate the extent of language barriers in the service area. In Figure 10, the areas of
darkest purple show an extensive corridor along I-85 and Buford Highway, in and outside of the
perimeter, in which over 30% of residents above the age of 5 do not speak English well. This
concentration may support businesses and services which can serve these individuals in their native
language; however, they may encounter difficulties accessing goods and services elsewhere, such as
specialty medical care. Figure 11 shows the distribution of households in which no person over the age
of 14 speaks English well. In the darkest shade of periwinkle, over a quarter of households are isolated
by language barriers, and at least 10% in the second-darkest areas. Thus, at least one in ten households
is linguistically isolated in much of the service area.

60 | P a g e
Figure 12: Racial/Ethnic Distribution by Census Tract17
Figure 12 shows the distribution of people who identify themselves and their family members as non-
Hispanic White, as a percentage. Due to structural discrimination relative to race and ethnicity, spatial
concentration by racial or ethnic identity also results in disparities in goods, services, and living
environments. In an unsegregated area, racial and ethnic identities will be relatively evenly dispersed. In
the service area, nearly half of the census tracts are highly segregated (more than 80% or less than 20%
non-Hispanic White).
17 US Census Bureau, 2010-2014 American Community Survey
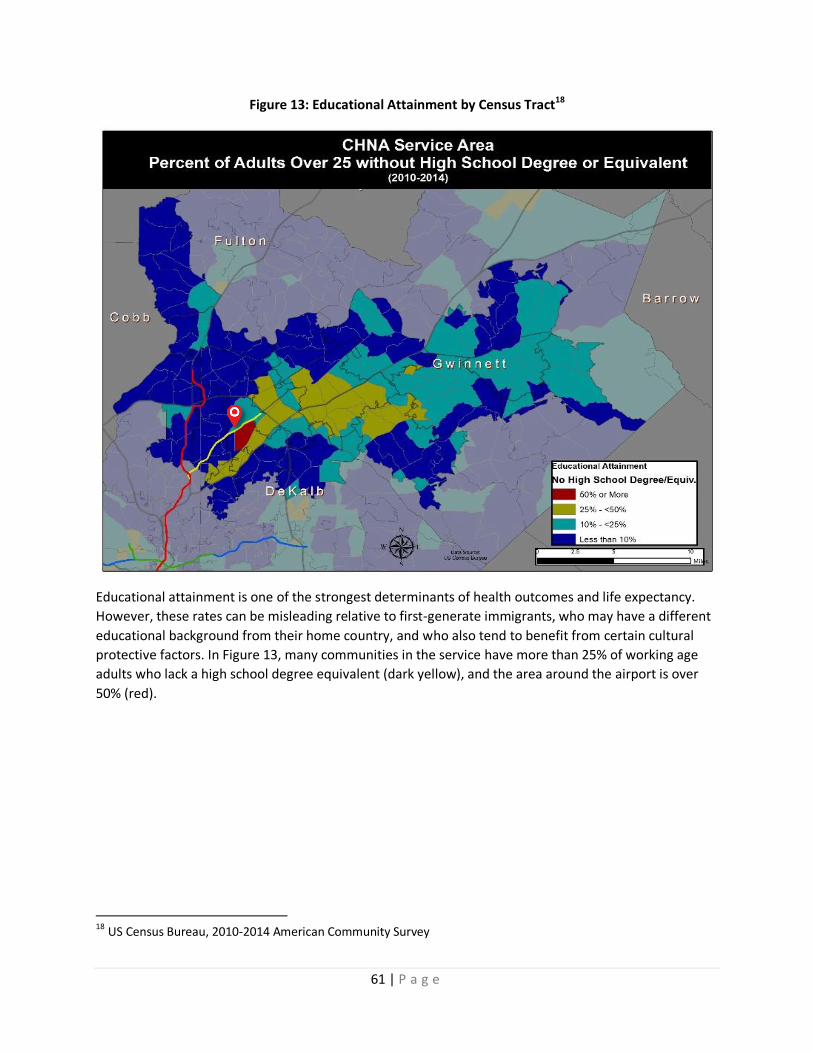
61 | P a g e
Figure 13: Educational Attainment by Census Tract18
Educational attainment is one of the strongest determinants of health outcomes and life expectancy.
However, these rates can be misleading relative to first-generate immigrants, who may have a different
educational background from their home country, and who also tend to benefit from certain cultural
protective factors. In Figure 13, many communities in the service have more than 25% of working age
adults who lack a high school degree equivalent (dark yellow), and the area around the airport is over
50% (red).
18 US Census Bureau, 2010-2014 American Community Survey

62 | P a g e
Figure 14: Unemployment by Census Tract19
About half of the service area had above average unemployment rates, especially in the outermost
areas, for the 2010-2014 estimates shown in Figure 14. Unemployment rates have decreased by about
half as of 2016, but only state and county level rates are available. However, spatial patterns in
unemployment tend to persist even as their mean rates rise and fall.
19 US Census Bureau, 2010-2014 American Community Survey

63 | P a g e
Figures 15 & 16: Uninsured Adults and Children by Census Tract20
20 US Census Bureau, 2010-2014 American Community Survey

64 | P a g e
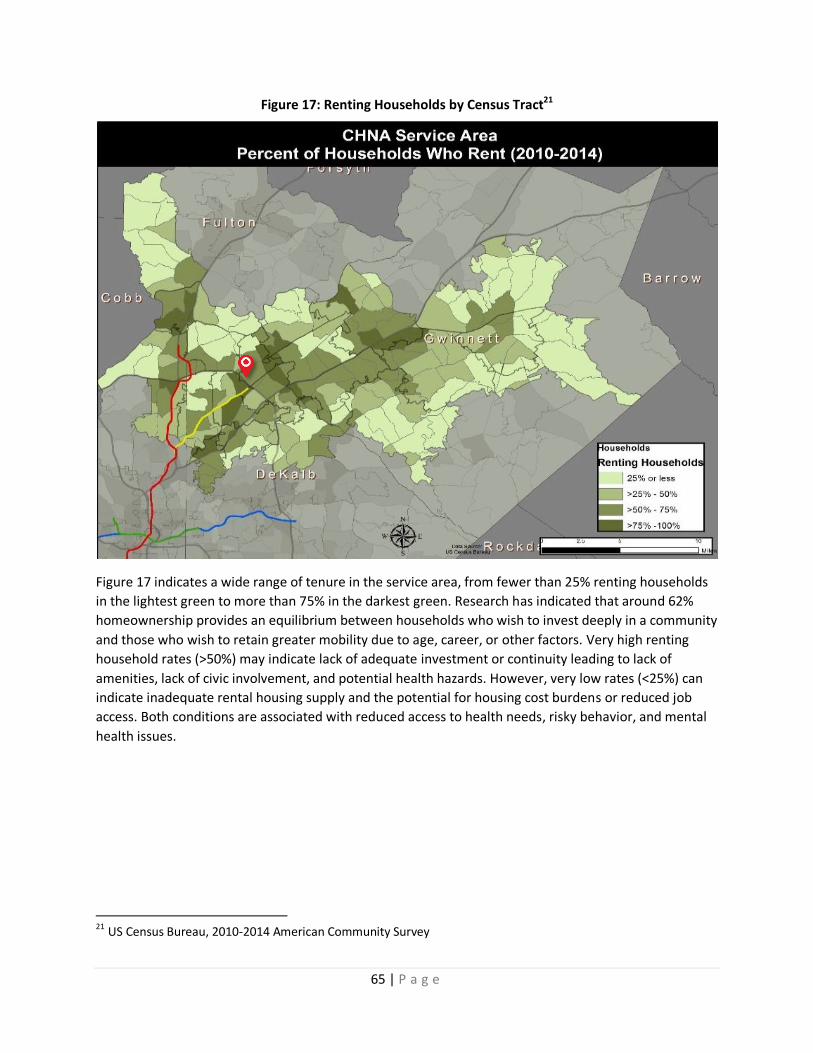
65 | P a g e
Figure 17: Renting Households by Census Tract21
Figure 17 indicates a wide range of tenure in the service area, from fewer than 25% renting households
in the lightest green to more than 75% in the darkest green. Research has indicated that around 62%
homeownership provides an equilibrium between households who wish to invest deeply in a community
and those who wish to retain greater mobility due to age, career, or other factors. Very high renting
household rates (>50%) may indicate lack of adequate investment or continuity leading to lack of
amenities, lack of civic involvement, and potential health hazards. However, very low rates (<25%) can
indicate inadequate rental housing supply and the potential for housing cost burdens or reduced job
access. Both conditions are associated with reduced access to health needs, risky behavior, and mental
health issues.
21 US Census Bureau, 2010-2014 American Community Survey

66 | P a g e
Table 8: Measures of Behavioral Health Need by County and Race/Ethnicity
Health Need DeKalb Fulton Gwinnett Asian African
American Hispanic/Latino
White US GA
Mental Health Providers per 100,00022
246.7 189.3 86.3
134.1 109.5
Mental Health ER Rates23 761.1 1,146.2 557.4 136.5 1,187.8
598.4
1,007.2
Poor Mental Health Days24 3.0 2.7 2.7
3.5 3.3
Self-Harm/Suicide ER Rates23 50.6 57.5 45.9 14.1 61.8
44.6
62.9
Medicare Enrollee Depression24 14.1% 13.3% 14.2%
15.8% 14.9%
Figure 18: ER Visits for Mental and Behavioral Disorders (includes Substance Use)23
22
CHNA.org/Community Commons from Centers for Medicare & Medicaid Services, Health Resources and Services Administration, Centers for Disease Control and Prevention 2006-12 Behavioral Risk Factor Surveillance System 23
Georgia Department of Public Health Online Analytical Statistical Information System 2010-14 24
University of Wisconsin Population Health Institute, County Health Rankings & Roadmaps from Centers for Medicare & Medicaid Services

67 | P a g e
Figure 19: Cancer Mortality/Hospital/ER Combined Cases by Census Tract, 2010-201425
Cancer did not appear to be highly prevalent in the service area, relative to surrounding areas. Rates could not be established by census tract or ZIP code, and the OASIS interface provides limited mapping options for scale or identifying factors. Overall, Figure 19 indicated that cancers were low in prevalence except for some wealthier, predominantly non-Hispanic areas by Perimeter Center and Tucker.
25 Georgia Department of Public Health Online Analytical Statistical Information System 2010-14

68 | P a g e
Figure 20: Breast Cancer Mortality/Hospital/ER Combined Cases by Census Tract, 2010-201426
Breast cancer prevalence appeared extremely low in Figure 20.
26 Georgia Department of Public Health Online Analytical Statistical Information System 2010-14

69 | P a g e
Figure 21: Colorectal Cancer Mortality/Hospital/ER Combined Cases by Census Tract, 2010-201427
Figure 21 indicates moderate to low colon cancer prevalence in the service area. The largest number of cases, in darker shades of orange/brown, appear mainly south of I-85 and north of I-285. However, risk factors may change over time.
27 Georgia Department of Public Health Online Analytical Statistical Information System 2010-14
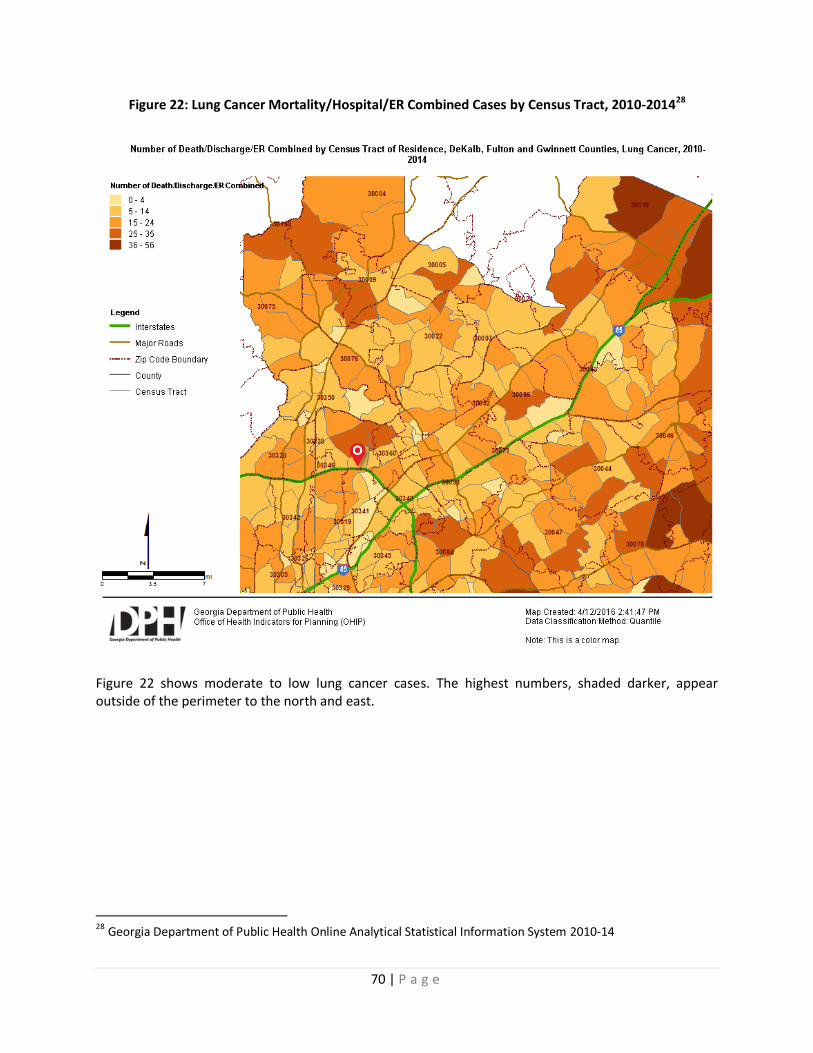
70 | P a g e
Figure 22: Lung Cancer Mortality/Hospital/ER Combined Cases by Census Tract, 2010-201428
Figure 22 shows moderate to low lung cancer cases. The highest numbers, shaded darker, appear outside of the perimeter to the north and east.
28 Georgia Department of Public Health Online Analytical Statistical Information System 2010-14

71 | P a g e
Figure 23: Prostate Cancer Mortality/Hospital/ER Combined Cases by Census Tract, 2010-201429
Prostate cancer appeared low in Figure 23 except for some higher numbers of cases, in darker
orange/brown, in the Perimeter Center and Chastain areas.
29 Georgia Department of Public Health Online Analytical Statistical Information System 2010-14

72 | P a g e
Figure 24: Diabetes Mortality by Census Tract, 2010-201430
Figure 24 shows very low risk from diabetes in the service area. However, diabetes mortality may take much longer to manifest than risk factors or diagnoses.
30 Georgia Department of Public Health Online Analytical Statistical Information System 2010-14

73 | P a g e
Figure 25: ER Visits for Suicide/Self-Harm31
Figure 25 indicates moderately low risk for self-harm in the service area.
31 Georgia Department of Public Health Online Analytical Statistical Information System 2010-14

74 | P a g e
Figure 26: Cancer Mortality by Census Tract, 2010-201432
Deaths from cancers were low to moderate in the service area.
32 Georgia Department of Public Health Online Analytical Statistical Information System 2010-14

75 | P a g e
Figure 27: Deduplicated Pregnancy and Childbirthing Hospital Visits, Age 19 and Under33
Among women ages 19 and under, above average utilization levels were primarily concentrated in an area between Norcross, Tucker, and Lilburn, shown in Figure 27.
33 Georgia Department of Public Health Online Analytical Statistical Information System 2010-14
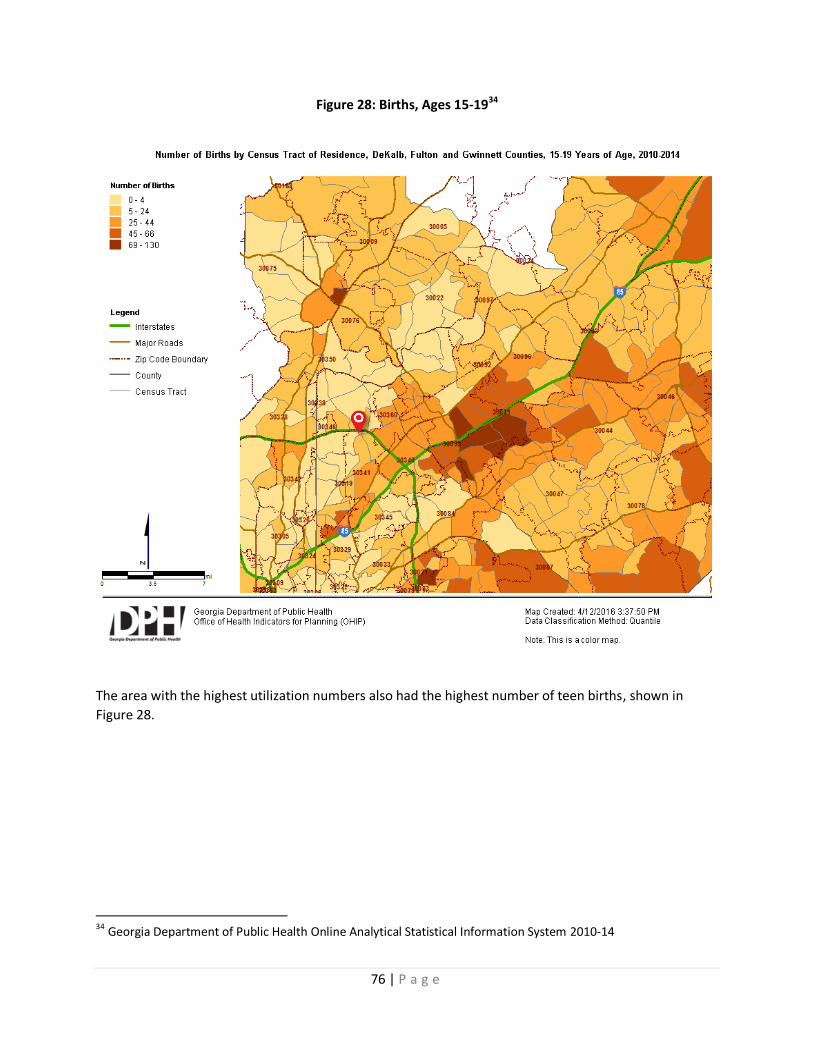
76 | P a g e
Figure 28: Births, Ages 15-1934
The area with the highest utilization numbers also had the highest number of teen births, shown in
Figure 28.
34 Georgia Department of Public Health Online Analytical Statistical Information System 2010-14

77 | P a g e
Figure 29: Deduplicated Hypertensive Heart Disease & High Blood Pressure Hospital Visits35
There were low numbers of hospital utilization for hypertensive heart disease and high blood pressure
in the service area, which is consistent with the population profile.
35 Georgia Department of Public Health Online Analytical Statistical Information System 2010-14
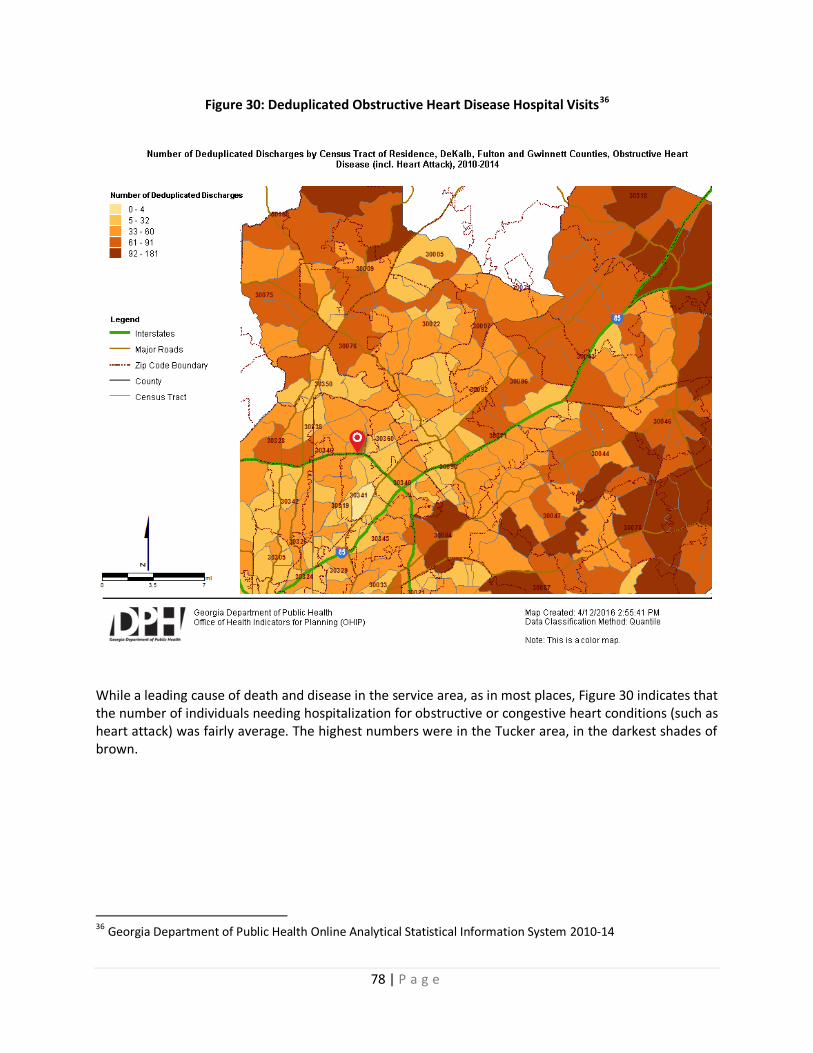
78 | P a g e
Figure 30: Deduplicated Obstructive Heart Disease Hospital Visits36
While a leading cause of death and disease in the service area, as in most places, Figure 30 indicates that the number of individuals needing hospitalization for obstructive or congestive heart conditions (such as heart attack) was fairly average. The highest numbers were in the Tucker area, in the darkest shades of brown.
36 Georgia Department of Public Health Online Analytical Statistical Information System 2010-14
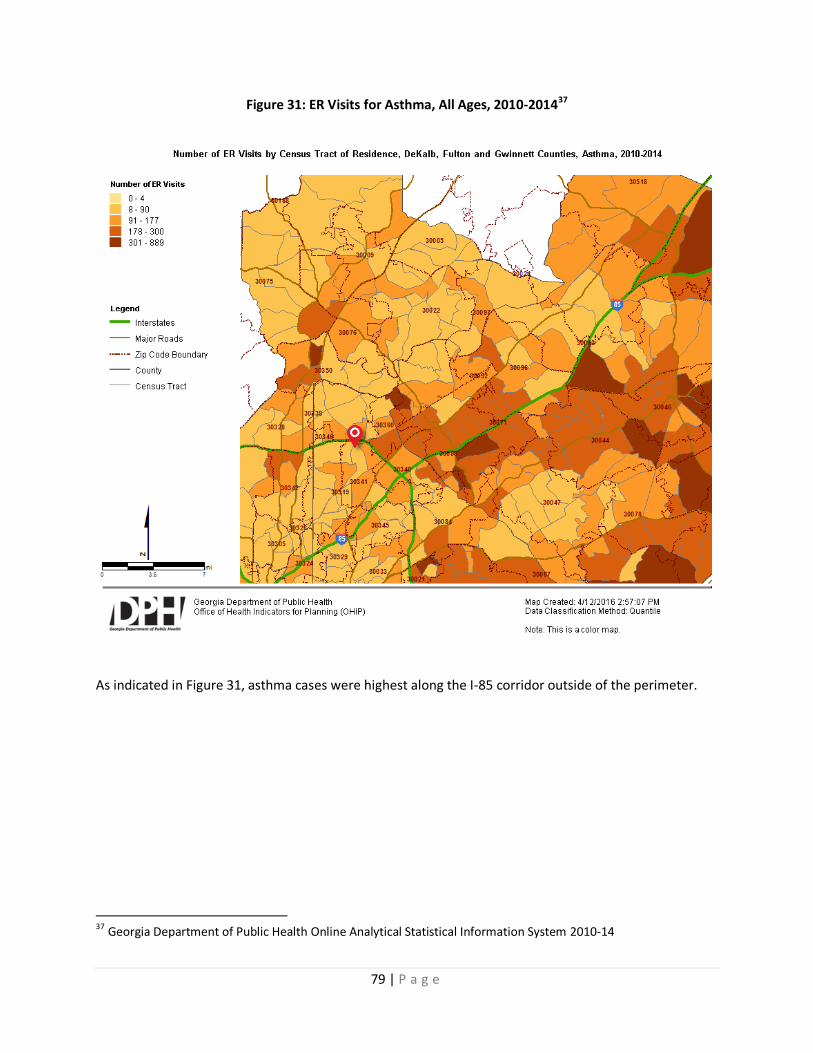
79 | P a g e
Figure 31: ER Visits for Asthma, All Ages, 2010-201437
As indicated in Figure 31, asthma cases were highest along the I-85 corridor outside of the perimeter.
37 Georgia Department of Public Health Online Analytical Statistical Information System 2010-14
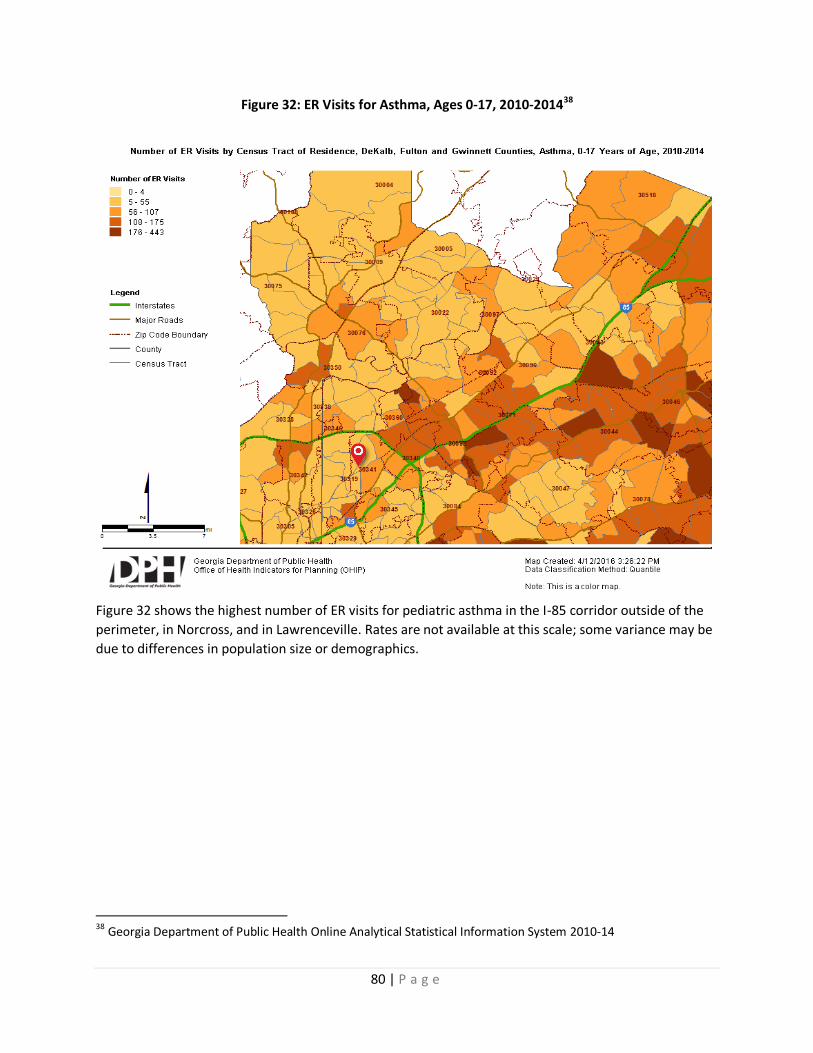
80 | P a g e
Figure 32: ER Visits for Asthma, Ages 0-17, 2010-201438
Figure 32 shows the highest number of ER visits for pediatric asthma in the I-85 corridor outside of the
perimeter, in Norcross, and in Lawrenceville. Rates are not available at this scale; some variance may be
due to differences in population size or demographics.
38 Georgia Department of Public Health Online Analytical Statistical Information System 2010-14

81 | P a g e
Figure 33: Households Using SNAP Benefits (Food Stamps)39
Supplemental Nutrition Assistance Program (SNAP) benefits provided substantial food budget benefits
in the service area, with more than a quarter of households in some places using SNAP to afford
nutritious foods in the year prior to participating in the American Community Survey.
39 US Census Bureau, 2010-2014 American Community Survey

82 | P a g e
Figure 34: Transit Service, Bicycle Facilities, and Proportion of Carless Households40
Although more than a quarter of households in the core of the service area do not have a car available,
and although there are several high-frequency transit corridors in those areas, large expanses lack
transit or bicycle facilities to connect residents from their homes to jobs, services, and transit routes.
This can limit their ability to access health care and other health supporting goods and services even if
they are just a few miles away. Figure 34 shows regional bicycle facilities as of 2015 in light green, bus
transit in purple, and heavy rail transit in gold and red. The percentage of households with no motor
vehicle available is indicated by gray shading, ranging from less than 5% in the lightest areas to more
than 30% in the darkest.
40 US Census Bureau, 2010-2014 American Community Survey; Atlanta Regional Commission