community college impact study final report presentation
TRANSCRIPT

Community College Impact Study
Final Report Presentation
_________________
Henry Brady & Anita Mathur
May 16, 2008

Authors
• Henry BradyProfessor of Public Policy and Political Science, UC BerkeleyDirector, Survey Research Center, UC Berkeley
• Anita MathurDoctoral Candidate, Sociology, UC Berkeley

Purpose of Study
Data & Methodology
_________________

Purpose of Study
To assess the impact of Community College on outcomes of CalWORKs students in comparison to Non-CalWORKs students.
Specifically we assess:Educational OutcomesEmployment and Earnings Outcomes Financial Aid Utilization and Impact

Data and Definitions
Entry (Any Date)
2 years pre-college wages
4 years post-college wages
In schoolNot in school
2+ termsNot in school
3+ terms
Exit (1999-2002)
Last year in college wages
2 years post-college
4-year school enrollment
Sample:1,700,743 students
82,460 CalWORKs and 1,618,283 Non-CalWORKs

Data Sample
• Three Exit Groups:CCCCO Management Information Systems (MIS) student record database.
1999-2000, 2000-2001, 2001-2002 all pooled.
• Type of Students:Credit and Non-Credit Students included. Age 22-50 to ensure working age population & head of household on CalWORKs case.
• Sample Size: 1,700,743 students total.82,460 CalWORKs Students.1,618,283 Non-CalWORKs (unaided) Students.

Definitions - Entry and Exit
• Entry: Not having been enrolled at a community college for two consecutive primary terms (fall or spring) prior to entry term.
• Exit: Not returning to college for at least three consecutive primary terms.

Definitions - CalWORKs and Non-CalWORKs
• CalWORKs Students:Students with a CDSS CalWORKs cash aid code (30, 35) or involved in the CCC CalWORKs program during the last year in school (value of 1-6 on SB 27).
• Non-CalWORKs Students:Students without any CDSS aid code assigned the last year in school and not in the CCC CalWORKs program.
Note: Students with aid codes other than CalWORKsaidcodes are not included in the study, therefore “Non-CalWORKs” students in this study refer to completely unaided students.

Definitions - Educational Outcomes
• Educational Attainment: Any award conferred or the number of credit units or non-credit hours completed between entry and exit.
Students might be enrolled or receive an award outside the window of entry/exit, but we do not include these awards or credits as outcomes.
Both Credit and Non-Credit awards included in the analysis. Very few non-credit awards given out during the period of the study.

Definitions - Educational Outcomes
• Field: Field that an award was given in prior to college exit/employment. Does not necessarily indicate the industry of employment. Due to sample size limitations we only study the major field, not subfields/programs.
85% of students fall into these categories:Engineering and Industrial TechnologiesHealthBusiness and ManagementFamily and Consumer SciencesPublic and Protective ServicesInterdisciplinary Studies

Engineering and Industrial Technologies“Instructional programs in the mathematical and natural sciences utilizing the materials and forces of nature for the benefit of human beings. Instructional programs in technol-ogy that require the application of scientific and engineering knowledge, methods, and technical skills in support of engineers and other professionals.”
•Automotive Collision Repair •Aeronautical and Aviation Technology•Construction Crafts Technology•Drafting Technology•Chemical Technology•Laboratory Science Technology•Manufacturing and Industrial Technology•Civil and Construction Management Technology •Water and Wastewater Technology•Marine Technology •Optics•Musical Instrument Repair
•Engineering, General (requires Calculus) (Transfer)•Engineering Technology, General (requires Trigonometry)•Electronics and Electric Technology •Electro-Mechanical Technology •Printing and Lithography•Instrumentation Technology •Industrial Systems Technology and Maintenance•Environmental Control Technology •Diesel Technology •Automotive Technology
(Topcode Taxonomy, 2004, 6th edition)

Health“Instructional programs that study the theories and techniques for the restoration or preservation of mental and physical health through the use of drugs, surgical procedures, manipulations, or other curative or remedial methods.”
•Physical Therapist Assistant•Health Information Technology •School Health Clerk•Radiologic Technology•Radiation Therapy Technician•Diagnostic Medical Sonography•Athletic Training and Sports Medicine•Nursing •Psychiatric Technician•Dental Occupations•Emergency Medical Services•Paramedic•Mortuary Science•Health Professions, Transfer Core Curriculum•Community Health Care Worker•Massage Therapy
•Health Occupations, General•Hospital and Health Care Administration•Medical Laboratory Technology •Physicians Assistant•Medical Assisting •Hospital Central Service Technician•Respiratory Care/Therapy•Polysomnography•Electro-Neurodiagnostic Technology•Cardiovascular Technician•Orthopedic Assistant•Electrocardiography•Surgical Technician•Occupational Therapy Technology•Optical Technology•Speech-Language Pathology and Audiology•Pharmacy Technology
(Topcode Taxonomy, 2004, 6th edition)

Business and Management
“Instructional programs that prepare individuals for a variety of activities in planning, organizing, directing, and managing all business office systems and procedures.”
•Business and Commerce, General•Accounting •Banking and Finance•Business Administration•Business Management •International Business and Trade•Marketing and Distribution •Logistics and Materials Transportation•Real Estate•Insurance•Office Technology/Office Computer Applications •Labor and Industrial Relations•Customer Service
(Topcode Taxonomy, 2004, 6th edition)

Family and Consumer Sciences
“Instructional programs that study the relationship between the physical, social, emotional and intellectual environment in and of the home and family and the development of individuals, including programs in child development, family studies, gerontology, fashion, interior design and merchandising, consumer services, foods and nutrition, culinary arts, and hospitality.”
•Family and Consumer Sciences, General •Interior Design and Merchandising•Fashion•Child Development/Early Care and Education •Nutrition, Foods, and Culinary Arts •Hospitality•Family Studies•Gerontology
(Topcode Taxonomy, 2004, 6th edition)

Public and Protective Services
“Instructional programs in the theories and techniques of the formulation, implementation and evaluation of public policies and services, including public safety occupations. Includes developing and improving competencies in the management and operation of government agencies.”
•Public Administration •Human Services •Administration of Justice •Fire Technology •Legal and Community Interpretation
(Topcode Taxonomy, 2004, 6th edition)

Interdisciplinary Studies“Instructional programs that include those subject field designations which involve more than one major discipline without primary concentration in any one area. Also, courses in guidance, student success, and other categories that do not fall into any other discipline.”
Writing Speech Learning Skills - Handicapped Living Skills - HandicappedLearning Skills -Learning Disabled Learning Skills – Speech Impaired Computational Skills Pre-Algebra - Basic Math/Arithmetic Adult Basic Education - Grades 1-8 High School Diploma Program/G.E.D. Reading Skills, Pre-collegiate Reading Skills, College LevelSkill Development ESL–General, ESL–College Level, ESL–Survival Level,Citizenship
•Liberal Arts and Sciences, General: Transfer StudiesLiberal Studies - teaching preparation
•Biological and Physical Sciences, Math•Humanities:
Humanities and Fine ArtsHumanities and Social Sciences
•Vocational ESL•General Work Experience•General Studies:
Supervised TutoringGuidance Interpersonal SkillsJob Seeking/Changing Skills Academic Guidance Study Skills Communication Skills
(Topcode Taxonomy, 2004, 6th edition)

Definitions - Educational Outcomes
• “Transfer”: Students that enrolled in a 4-year college or university within two years of exiting community college. Not necessarily official transfer students per-say.
Data Match with UC, CSU, NSC (National Student Clearinghouse) Public or privateCalifornia or out of state

Definitions - Employment and Earnings
• Data Match: EDD UI Quarterly Wage Data• Window of Observation: Two years prior to entry, last year in
college prior to exit, and up through fours years after college exit. Due to data restrictions, 99-00 cohort has earnings up to 4 years out, 00-01 has earnings up to 3 years out, 01-02 has earnings up to 2 years out.
• Employment: A student is employed in a year if his or her wage is greater than zero in that year. Don’t know if part-time or full time.
• Earnings Adjustment: Mean Annual Earnings adjusted to 2000-2001 CPI.
• “Transfer” students: Kept in the employment earnings analysis. Perhaps earnings estimated on the low side.Very small percentage of exiting students so doesn’t make much difference.

Definitions - Financial Aid
Rates of Financial Aid:
• We define a student as receiving financial aid if they have received any financial aid at any point during the entire time they were enrolled (entry to exit).
• 5 broad groupings: BOG waivers, Grants, Loans, Scholarships, Work Study (all Work Study combined - CW, Federal, State).
Amount of Financial Aid:
• Being in college longer will typically generate higher total amounts of aid received. Therefore, to compare students we calculate the average aid amount per term.
• Average aid amount per term: The total amount of aid received across all the terms the student was in college divided by the total number of terms the student was enrolled.

Comparison of Outcomes
Throughout the analysis we compare the outcomes of:
• Different groups of students within the CalWORKs student population.
(e.g. CalWORKs students exiting with any award vs. CalWORKs students exiting without an award)
• CalWORKs and Non-CalWORKs student groups.(e.g. CalWORKs students with any award vs. Non-CalWORKs students with any award)

Differences in Background DemographicsBetween Comparison Groups
• CalWORKs students enter college with different basic characteristics than Non-CalWORKs students.
• CalWORKs students:– Are more likely to be female, non-white, have no high school degree,
and have lower pre-college earnings.
– Have a slightly different age distribution and educational goal at entry.
• Therefore it is important to control for these characteristics when comparing outcomes between CW and Non-CW students.
Example: Gender distribution of All, CW, Non-CW studentsNon - CalWORKs
51%49%Male
Female
CalWORKs
81%
19%
Male
Female
All Students
47%53%
Male
Female

Matching MethodologyIn both types of comparisons:
• CalWORKs vs. CalWORKs (with different educational attainment)• CalWORKs vs. Non-CalWORKs
Comparison groups are matched on 6 demographic characteristics to ensure more similar populations compared on outcomes:
6. Two years of Pre-College Wages3. Age5. Academic Goal at Entry2. Education at Entry4. Race/Ethnicity1. Gender
For some comparisons we add in other matching variables in addition to these basic 6, such as type of award or field of study.
The matches are not perfect!There are some key variables that we could not include in the match due to data limitations - such as number of children in the household and marital status.
The categories within each matching characteristic must be relatively broad in order to find an adequate number of matches.

Example of Matching Effect
• Non-CW students are matched to CW students on the 6 background criteria (plus award type).
After matching, the difference in the percentage of CW and Non-CW students in many fields is diminished.
Percentage of CW and Non-CW in Different Fields (Among Award Holders)
0%
5%
10%
15%
20%
25%
30%
35%
40%
Other Health Consumer Ed Engineering Business Public Affairs Interdis.
Non-CalWORKs CalWORKs
UNMATCHED
0%
5%
10%
15%
20%
25%
30%
35%
40%
Other Health Consumer Ed Engineering Business Public Affairs Interdis.
Non-CalWORKs CalWORKs
MATCHED - Including Award Type

Report #1
Educational Outcomes
_________________
Coursework Only Versus Awards
Awarded & Transfer Students

Coursework Only Versus Awards

Summary of Key Findings – Educational OutcomesCoursework Only Versus Awards
Awards:The vast majority of CW and Non-CW students exit college without having completed an award during the enrollment period under observation (over 90%).
Credit Coursework:CW and Non-CW students have similar percentages exiting with more than 12 units (CW have slight advantage).CW students are more likely to exit without completing any coursework or with only non-credit coursework; Non-CW are likely to have taken a few credits prior to exit.
Non-Credit Coursework:CW are more likely than Non-CW to have taken some non-credit coursework prior to exit. Of those with some non-credit, CW are more likely than Non-CW to have taken over 200 non-credit hours prior to exit.

CW and Non-CW Fairly similar in Credit/Award Distribution
• CW slightly more likely to have incomplete coursework or non-credit only.
• Non-CW students more likely to have at least a few credits completed prior to exit (in the .01-11.99 unit range).
Percentage Receiving Credits/Awards
• CW at par with Non-CW at higher number credits (12+).• Fewer than 10% of both CW and Non-CW students complete an award prior to exit.
0%
10%
20%
30%
40%
50%
60%
0 units, nonc
0 units, withnc
.01-11.99units
12-23.99units
24+ units Award
Non-CalWORKs CalWORKsMATCHED

0%5%
10%15%20%25%30%35%40%45%50%
1-10 Hours 11-50 Hours 51-100 Hours 101-200 Hours 201+ Hours
Non-CalWORKs CalWORKs
MATCHED
Non-Credit Hours Detailed
• CW students more likely to have taken at least some non-credit coursework (58% versus 45%).
• Among those with Non-Credit, CW more likely to have 200+ hours while Non-CW more likely to have only 11-50 hours.
Percentage with Particular number of Non-Credit Hours(Among those with some Non-Credit)

Awarded & “Transfer” Students

Summary of Key Findings – Educational Outcomes
Among Award Holders:
CW are as likely as Non-CW to get AS degrees but are less likely to earn an AA and more likely to receive a 30-59 unit certificate.
CW are more likely than Non-CW to receive awards in Consumer Education and Business.
Transfer:
CW are less likely than Non-CW to have an initial goal of transfer and are two times less likely to enroll in a four year college within two years of exit.
Among students who enroll in a 4 year college, CW are more likely than Non-CW to have completed an award at exit.

0%5%
10%15%20%25%30%35%40%45%50%
Associateof Science
Associateof Arts
60+ unitCertificate
30-59 unitCertificate
18-30 unitCertificate
6-18 unitCertificate
<6 unitCertificate
Non-CreditAward
Non-CalWORKs CalWORKs
MATCHED
Awarded Students: Type of Degree
After Matching:
• CW students more likely to choose medium length certificates over the AA degree.
Percentage Receiving Different Types of Awards (Among Award Holders)

Awarded Students: Field of Study
• CW more likely than Non-CW to be in Consumer Ed & Business.
• CW slightly fewer in Health.
• Fewer CW in Interdisciplinary Studies.
Percentage in Different Fields of Study(Among Award Holders)
After Matching:(including award type –Associate level, mid-length cert, short/non-credit cert)
0%
5%
10%
15%
20%
25%
30%
35%
40%
Other Health Consumer Ed Engineering Business Public Affairs Interdis.
Non-CalWORKs CalWORKs
MATCHED - Including Award Type

Enrollment in a Four-Year CollegeCW less likely than Non-CW have a goal of transfer.
CW less likely than Non-CW to enroll in a 4-year college within two years of exit.
22.6
16.2
22.8
12.010.3
4.0
0.0
5.0
10.0
15.0
20.0
25.0
Non-CalWORKs CalWORKs
Had Goal of Transfer at Entry
Enrolled in a 4 Year College - Those with Goal of Transfer
Enrolled in a 4 Year College - All
MATCHED

0.0
10.0
20.0
30.0
40.0
50.0
60.0
0 units, nonc
0 units, withnc
.01-11.99units
12-23.99units
24+ units Award
Non-CalWORKs Transfer
CalWORKs TransferMATCHED
Enrollment in a Four-Year CollegeCW enroll in 4 year with higher educational attainment
CW & Non-CW similar on type of award prior to 4-year Enrollment
•Of students later enrolled in 4 year school, 38% of CW vs. 22% of Non-CW completed > 24 credits or an award at exit.
•AA degree and Interdisciplinary Studies most popular for both.Educational Attainment Among Students
Enrolled in a 4-year college within 2 years of exit

Enrollment in a Four-Year CollegeCW “Transfer” Students Obtain Higher Earnings
Earnings Among EmployedNon-”Transfer” students are matched to the characteristics of “Transfer” Students.
Matching elements also include education received at the time of exit.
$22,331.79
$17,859.93
$0
$5,000
$10,000
$15,000
$20,000
$25,000
2 Yrs Prior 1 Yr Prior Last Yr In 1st Yr Out 2nd Yr Out 3rd Yr Out 4th Yr Out
Enrolled in a 4 Year School within 2 Years of Exit
Did Not Enroll in 4 Year School within 2 years of Exit
MATCHED

Strengthen Individual Courses:
Students rely on coursework more than an award when entering the labor market.
Focus on getting students into coursework that will be most attractive to employers.
Investigate Tracking of CW into Consumer Ed and Business
Even after matching, CW students are more likely to enter Consumer Education and Business fields than Non-CW students.Perhaps take steps to encourage non-traditional field choices for CW students.
Report 1 - Educational Outcomes Policy Implications

If Transfer is Considered to be a Desirable Outcome:
After matching, CW students still lag behind Non-CW students in percentage desiring transfer and percentage enrolling in a four year school after exit.
Improve Transfer Rates for CW Students by:Educating students about transfer benefits and requirements.Encouraging students to consider transfer as an option at time of entry.
Evaluate Necessity of Obtaining an Award Prior to Transfer:Prior award may delay transfer to a four-year program. Do CW students need award-level coursework to become transfer-ready? Are pre-transfer awards beneficial for other reasons?
Report 1 - Educational OutcomesPolicy Implications (Cont.)

Report #2
Employment & Earnings Outcomes_________________
CalWORKs Students Only
CalWORKs vs. Non-CalWORKs Students

CalWORKs Students Only

Summary of Key Findings – Employment & EarningsAmong CalWORKs Students
Impact of Non-Credit: Students with only non-credit coursework see a limited employment and earnings payoff over students who exited without completing any coursework.
Impact of Short Certificate: Short certificates provide higher employment but similar earnings as credit coursework without an award.
Impact of Medium Length Certificate: Medium length certificates yield equivalent employment rates as shorter certificates but produce substantially higher earnings.
Impact of Associate Level Degree: The AS degree brings a substantially higher employment and earnings payoff than a 30-59 unit certificate.
Impact of Field: The Health field has a substantially higher employment and earnings payoff than all other major fields of study.

Comparison with California Population*California 1% Public Use Microdata from the 2000 Census
For women, age 22-50, with less than a BA in 1999:• Employment Rate:
66%• Mean Annual Earnings Among All:
$16,312 in 2001 dollars• Mean Annual Earnings Among Employed:
$24,635 in 2001 dollars• Annual Earnings, full time Minimum Wage:
($5.15 per hour in 1999)$11,558 in 2001 dollars

60.7
49.547.146.944.344.1
0.0
10.0
20.0
30.0
40.0
50.0
60.0
70.0
80.0
90.0
100.0
Year 2 Prior Year 1 Prior Last Yr In 1st Yr Out 2nd Yr Out 3rd Yr Out 4th Yr Out
CalWORKs <6-29 CertCalWORKs 24+ unitsCalWORKs 12-23.99 UnitsCalWORKs .01-11.99 UnitsCalWORKs Non-Credit OnlyCalWORKs No Complete Coursework
MATCHED
Employment Rates
(to AS/60 characteristics)
11 pp gap
Impact of Short Certificates & Non-CreditNon-Credit similar employment rates as no completed coursework Short certificates much better employment rates than credit-only

$18,719
$17,567
$15,740$17,106
$14,240$13,391
$0
$5,000
$10,000
$15,000
$20,000
$25,000
$30,000
$35,000
Year 2 Prior Year 1 Prior Last Yr In 1st Yr Out 2nd Yr Out 3rd Yr Out 4th Yr Out
CalWORKs <6-29 Cert
CalWORKs 24+ Units
CalWORKs 12-23.99 Units
CalWORKs .01-11.99 Units
CalWORKs Non-Credit Only
CalWORKs No Completed Coursework
MATCHED
Mean Annual Earnings among Employed
(to AS/60 characteristics)
Impact of Short Certificates & Non-CreditNon-credit slightly lower earnings than no completed coursework
Short certificates do not bring much higher earnings than credit-only
Short certificates continue to overtake credit-only after Y4?
Possible overtaking of no completed coursework by non-credit only after Y4?
(All Earnings adjusted to 2000-01 CPI)

61.8
69.2
~40.0
63.5
0.0
10.0
20.0
30.0
40.0
50.0
60.0
70.0
80.0
90.0
100.0
Year 2 Prior Year 1 Prior Last Yr In 1st Yr Out 2nd Yr Out 3rd Yr Out 4th Yr Out
CalWORKs AS/60
CalWORKs 30-59 Cert
CalWORKs <6-29 Cert
MATCHED - INCLUDING FIELD
Impact of Medium Length Certificates & AssociateAssociate Level Degrees Somewhat Higher Rates than Certificates
Medium Length Certificates Fairly Equal to Short Certificates
(to AS/60 characteristics)
Employment Rates
~6 pp advantage to AS/60 over 30-59 certificate
~2 pp advantage to 30-59 unit cert over shorter certificates
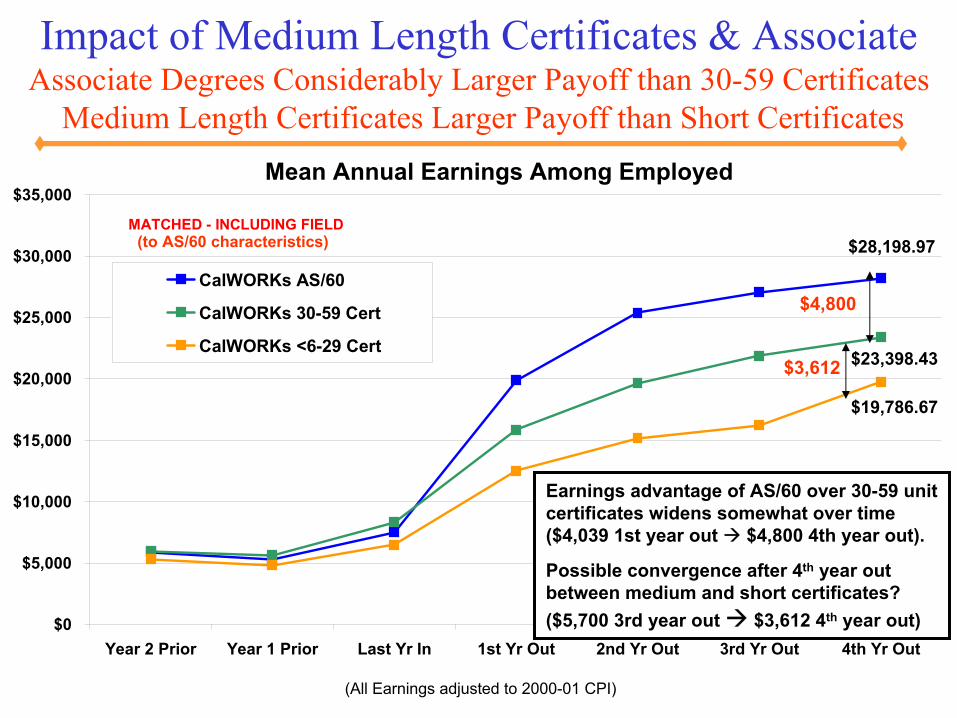
$28,198.97
$23,398.43
$19,786.67
$0
$5,000
$10,000
$15,000
$20,000
$25,000
$30,000
$35,000
Year 2 Prior Year 1 Prior Last Yr In 1st Yr Out 2nd Yr Out 3rd Yr Out 4th Yr Out
CalWORKs AS/60
CalWORKs 30-59 Cert
CalWORKs <6-29 Cert
MATCHED - INCLUDING FIELD
Impact of Medium Length Certificates & AssociateAssociate Degrees Considerably Larger Payoff than 30-59 Certificates
Medium Length Certificates Larger Payoff than Short Certificates
Earnings advantage of AS/60 over 30-59 unit certificates widens somewhat over time ($4,039 1st year out $4,800 4th year out).
Possible convergence after 4th year out between medium and short certificates?($5,700 3rd year out $3,612 4th year out)
(to AS/60 characteristics)
Mean Annual Earnings Among Employed
$4,800
$3,612
(All Earnings adjusted to 2000-01 CPI)

1.03.0
17.7
(7.1)
1.10.5
-10.0
-5.0
0.0
5.0
10.0
15.0
20.0
HEALTH BUS ENGG PS CE IS
Payoff to FieldsPercentage Point Difference
in 4YO Employment & Earnings Between a Particular
Field and Average of “All Other Fields”
Earnings Among Employed
Employment Rates
below average
sameCE
below average
sameENGG
below average
above average
PS
way below average
sameBUS
EARNINGSEMPLMT
way below average
way above average
way below average
IS
way above average
HEALTH
***Public Service, Business, Earnings Out of Line with Employment?
Match – students in “all other fields” matched to the characteristics of students in the particular field.
(All Earnings adjusted to 2000-01 CPI)
$(2,334.76)$(1,555.51)
$14,822.13
$(3,275.45)$(2,272.77)
$(6,963.64)($9,000)
($6,000)
($3,000)
$0
$3,000
$6,000
$9,000
$12,000
$15,000
$18,000
HEALTH BUS ENGG PS CE IS

Report 2 – Employment & Earnings OutcomesPolicy Implications - CalWORKs Students Only
Non-Credit Coursework is Not Enough:Non-Credit does not lead directly to increased employment and earnings.But may provide basic skills training and a base for credit coursework.
Obtain Short Certificates Over Credit-Only:Short-term certificates improve likelihood of employment more than credit coursework without award, even after match.Awards with at least 30-59 unit requirements significantly increase earnings potential.
Obtain Associate Level Degrees over 30-59 Certs:AS degrees or 60+ unit certificates have higher payoffs.Encourage students to stretch for an AS degree or 60+ unit certificate.
Encourage Health Fields, Higher Wage Job Placement:Students with awards in Health fields see higher payoffs in post-college employment than students exiting with awards in other fields of study.Improve job placement efforts in other fields to support higher wages rather than easy job placement (e.g. Business has average employment but low wages).

CalWORKs Vs. Non-CalWORKs
Students

Summary of Key Findings – Employment & EarningsCalWORKs vs. Non-CalWORKs
Employment: CW students have higher employment rates than Non-CW students across all fields of study.
Earnings Among Employed: Employed CW students have substantially lower earnings than employed Non-CW students across all fields of study, even after matching background.
Earnings Among All: Among all students (employed and unemployed) earnings of CW converge with or surpass Non-CW in all fields with exception of Public Service.
Impact of Any Award: CW students see a higher employment and earnings payoff to receiving any award than Non-CW.
Impact of Associate: CW students see a higher employment and earnings payoff to receiving an Associate degree than Non-CW.

67.6
~48.0
56.0
44.6
39.2
0.0
10.0
20.0
30.0
40.0
50.0
60.0
70.0
80.0
90.0
100.0
Year 2 Prior Year 1 Prior Last Yr In 1st Yr Out 2nd Yr Out 3rd Yr Out 4th Yr Out
CalWORKs Any Award
Non-CalWORKs Any Award
CalWORKs 0 Units, No NC
Non-CalWORKs 0 Units, No NC
MATCHED
***Employment Payoff 6 Percentage Points Greater for CW
(to characteristics of CW any award)
23 pp 17 pp
cw advantage
Impact of Any Award Over No Coursework – EmploymentAwarded CW higher employment rates than Non-CW
**Awards mean more for CW than Non-CW in terms of Employment**

$23,478.92
$29,185.09
$13,210.94
$20,103.11
$0
$5,000
$10,000
$15,000
$20,000
$25,000
$30,000
$35,000
Year 2 Prior Year 1 Prior Last Yr In 1st Yr Out 2nd Yr Out 3rd Yr Out 4th Yr Out
CalWORKs Any Award
Non-CalWORKs Any Award
CalWORKs 0 Units, No NC
Non-CalWORKs 0 Units, No NC
MATCHED
Impact of Any Award Over No Coursework - Earnings Among Employed -
Among Employed, Earnings Gap Persists 4 years Out ***Awards mean more for CW than Non-CW in terms of Earnings***
Employed CW with awards earn about $5,700 less than matched Non-CW at all points out of school.
***Earnings Payoff $1,200 Higher for CW
$10,268
$9,082
(to characteristics of CW any award)
gap
(All Earnings adjusted to 2000-01 CPI)

$15,877.27
$16,357.58
$5,890.33
$7,880.80
$0
$5,000
$10,000
$15,000
$20,000
$25,000
$30,000
$35,000
Year 2 Prior Year 1 Prior Last Yr In 1st Yr Out 2nd Yr Out 3rd Yr Out 4th Yr Out
CalWORKs Any Award
Non-CalWORKs Any Award
CalWORKs 0 Units, No NC
Non-CalWORKs 0 Units, No NC
MATCHED
Impact of Any Award Over No Coursework - Earnings Among All -
Among all, earnings converge***Awards mean more for CW than Non-CW in terms of Earnings***
Among employed and unemployed combined, average earnings of CW and Non-CW with awards converge by year 3.
$8,477 $9,987
***Earnings Payoff $1,510 Higher for CW
(to characteristics of CW any award)
(All Earnings adjusted to 2000-01 CPI)

Impact of Associate Degree over a Certificate
• Compared receiving an Associate level award (AA, AS or 60+ certificate) to receiving a Certificate (6-59 units in length) for both CW and Non-CW students.
• Students in all groups matched to the characteristics of CalWORKs students with Associate level degrees.
• Employment Payoff to Associate Degree Higher for CW:Employment Payoff to an Associate degree over a Certificate is twice as large for CW as Non-CW (9 vs. 4 pp by the 4th year out).
• Earnings Payoff to Associate Degree Higher for CW: Among Employed students, the earnings payoff to an Associate degree isalso twice as large for CW students as Non-CW students by the fourth year out ($5,204 vs. $2,542). Similar results among all students (employed and unemployed combined).

Payoff to Fields -Employment
Percentage Point Difference in 4YO Employment Between
CW and Non-CW
Unmatched Results• CW at par with Non-
CW in all fields but Engineering and Public Service.
Matched Results• CW Surpass Non-CW in
all Fields. Approx. 9-16 percentage points higher across fields.
• Advantage relatively steady from Year 1 to Year 4 out of college.
UNMATCHED
MATCHED
3.5
-12.3
-1.9-0.7
-9.9
6.0
-14.0
-9.0
-4.0
1.0
6.0
11.0
16.0
HEALTH BUS ENGG PS CE IS15.9 15.6
13.1
9.3 9.6
12.9
-14.0
-9.0
-4.0
1.0
6.0
11.0
16.0
HEALTH BUS ENGG PS CE IS

Payoff to Fields -Earnings
Difference in 4YO Earnings Between CW and Non-CW
Among Employed• After matching on
background and award type, earnings gap between employed CW and Non-CW students decreases dramatically yet persists for all fields, especially Health, Engineering, Pub. Service.
Among All • Earnings Gap Remains
Substantial Only in Public Service Field.
• Likely cause is the large disparity in earnings between employed CW and Non-CW grads in Public Service.
Earnings Among EmployedMATCHED
MATCHEDEarnings Among All
(All Earnings adjusted to 2000-01 CPI)
$(2,371.46)
$(11,926.74)
$(5,649.34)
$(1,922.49)
$(6,478.00)
$(601.82)
($15,000)
($13,000)
($11,000)
($9,000)
($7,000)
($5,000)
($3,000)
($1,000)
$1,000
$3,000
$5,000
HEALTH BUS ENGG PS CE IS
$2,774.04
$(1,181.30)
$1,099.43$771.18
$(3,690.53)
$1,520.51
($15,000)
($13,000)
($11,000)
($9,000)
($7,000)
($5,000)
($3,000)
($1,000)
$1,000
$3,000
$5,000
HEALTH BUS ENGG PS CE IS

Report 2 – Employment & Earnings OutcomesPolicy Implications - CalWORKs Vs. Non-CalWORKs
Encourage Associate over Certificate:CW students benefit more from Associate-level awards than the general population attending college.Encourage longer term programs for CW recipients over shorter programs.
Evaluate CW Job Placement Rates in Non-Traditional Fields:CW grads may be employed at lower rates in non-traditional fields.Investigate how to achieve job placement parity with Non-CW.
Evaluate CW Job Placement to Improve Earnings:Employed CW students have lower earnings than Employed Non-CW peers.Investigate the earnings disparity in Health, Engineering and Public Service in particular.Examine how job placement programs might help achieve parity.

Report #3
Financial Aid Utilization and Impact
_________________

Financial Aid Utilization

Summary of Key Findings – Financial AidUtilization
Overall Rates and Amounts: CW students are more likely to receive financial aid and higher amounts of aid than Non-CW students, even after matching on background (including earnings prior to entry).
Demographic Differences: Among the CW population, men and Hispanics may have lower uptake than women and non-Hispanic Whites.
Amount of Credit: Higher credit students are more likely to receive financial aid than lower credit students, even after matching on background characteristics and time in school.
Credit Status:Non-credit students are less likely to receive financial aid than students who take at least some credit coursework.Students who earn a mix of credit and non-credit coursework receive higher financial aid awards than credit-only students.

Rates and Amounts of Financial AidAfter matching, CW still much more likely than
Non-CW to receive FA and receive higher awards
61.8
21.0
0.0
10.0
20.0
30.0
40.0
50.0
60.0
70.0
Non-CW CW
$851
$499
$0$100$200$300$400$500$600$700$800$900
$1,000
Non-CW CW
Percentage receiving Financial Aid at some
point during enrollment
Average Amount of Financial Aid per Term
Enrolled

Rates and Amounts of Financial Aidby Type of Financial Aid
CW more likely than Non-CW to get combination of BOG plus other awards. CW have similar BOG amount to NCW but higher grants.
49.962.7
36.327.1
10.3 13.8
0%
20%
40%
60%
80%
100%
Non-CW CW
BOG only BOG & Grant Other
$1,276
$83 $87
$946
$0
$200
$400
$600
$800
$1,000
$1,200
$1,400
Non-CW CW
BOG only BOG & Grant
Percentage Receiving FA Average Amount of FA Per Term

Financial Aid by DemographicsAfter match on all other demographics,
CW women more likely to get FA than CW men, CW Hispanics receive lower amounts of aid than CW Whites
67.1 71.564.6
55.6
66.562.4
01020304050607080
W/M W/H HS/NoHS
$913$826
$1,004
$826 $762$803
$0
$200
$400$600
$800
$1,000
$1,200
W/M W/H HS/NoHS
Percent Receiving FA Amount of FA per Term(W/M=Women/Men, W/H=White/Hispanic,
HS/No HS=High school at entry/No High School at entry)

Financial Aid by Credits at ExitAfter match, there is still a positive correlation between receiving
FA, amount of FA and number of credits earned
9098
95
0.010.020.030.040.050.060.070.080.090.0
100.0
24+ 12-23.99 .01-11.99
$491
$1,655
$865
$0$200$400$600$800
$1,000$1,200$1,400$1,600$1,800
24+ 12-23.99 .01-11.99
Percent Receiving FA Amount of FA per TermMatch includes number of terms spent in school

Financial Aid by Credit StatusMixed Students Receive Higher FA Awards than Credit-Only
Non-Credit Students Less Likely to Receive FA and Receive Lower Amounts of FA than Mixed Credit Group
39.9
81.9 81.5
0.010.020.030.040.050.060.070.080.090.0
100.0
mixed creditonly
non-creditonly
$495
$1,047
$780
$0
$200
$400
$600
$800
$1,000
$1,200
mixed credit only non-creditonly
Percent Receiving FA Amount of FA per TermMatch includes number of terms spent in school
Report 3 – Financial Aid Utilization & ImpactPolicy Implications – Financial Aid Utilization
Financial Aid Programs Reach Many CW Students:CW students receive more financial aid than matched non-CW students.
Pay Closer Attention to CW Men & Hispanics:Men receive awards less frequently, and Hispanics receive fewer aid dollars overall.Investigate how to better achieve financial aid parity for these two groups.
Increase Financial Aid Eligibility & Outreach for Part-Time Students:
CW students exiting with fewer credits receive less financial aid.Investigate whether this is related to part-time status.Examine how to increase eligibility and award amounts for part-time students.Increase financial aid outreach to part-time students.
Increase Financial Aid Eligibility for Non-Credit Students:Non-credit students have lower financial aid uptake and amounts.Investigate and eliminate possible eligibility biases against students who take non-credit coursework.

Financial Aid Impact

Summary of Key Findings – Financial AidImpact
Financial Aid and Academic Award Completion:
Students with financial aid are more likely to complete awards. The higher the average financial aid award, the more likely an award is completed.
Among award holders, students with any financial aid are more likely to complete an Associate over a Certificate. Among award holders, students with higher average financial aid awards are more likely to complete an Associate over Certificate.
Work Study and Economic Outcomes:
Working while in school in general pays off: Education held constant, CW students who work while in school have higher employment and earnings outcomes than CW students who do not work while in school.
Among CW students who work while in school, there is no clear association between receiving work study and obtaining higher post-college employment rates and earnings.
Work Study and Educational Attainment: Work Study students have higher educational attainment than students who work while in school but do not receive work study.

Percentage with Any Academic Award by FAStudents with FA somewhat more likely to complete awards
The higher the FA award, more likely award completed
11.06.7
0.0
10.0
20.0
30.0
40.0
50.0
No FA Has FA
18.817.1
10.2
0.0
10.0
20.0
30.0
40.0
50.0
Low FA Med FA High FA
Percent with any Academic Award Percent with any Academic AwardThese statistically significant associations hold after accounting for important intervening
factors such as educational goal at entry, time spent in school, and credits earned.
MATCHED MATCHED

Percentage with Associate Level Award by FA(Among those that earned academic awards)
Students with some FA more likely to complete Associate over CertificateStudents with high FA more likely than those with med/low FA to complete Associate
61.9
47.2
0.010.020.030.040.050.060.070.080.090.0
100.0
No FA Has FA
48.4
65.3
0.010.020.030.040.050.060.070.080.090.0
100.0
Medium/Low FA High FAPercent with Associate Level Award Percent with Associate Level Award
These associations hold after accounting for important intervening factors such as educational goal at entry, time spent in school, and credits earned.
MATCHED MATCHED

Does Work/School Mix Pay for CW? CW Educational and Economic Outcomes by In-School EmploymentMatching on education, working CW students earn more after exit.
However working CW students have lower educational attainment overall.
$0
$2,000
$4,000
$6,000
$8,000
$10,000
$12,000
NotEmployed
LYI
EmployedLYI
Last Year In
1st Year O ut
2nd Year O ut
3rd Year O ut
4th Year O ut
10.6 7.6
57.2
40.7
22.0
14.1
0.05.0
10.015.020.025.030.035.040.045.050.055.060.065.0
Not EmployedLYI
Employed LYI
Has Award2+ Terms24+ credits
Post-College EarningsAmong All CW Students Educational Attainment
(All Earnings adjusted to 2000-01 CPI)

Does Work/School Mix Pay for Non-CW? Educational and Economic Outcomes by In-School EmploymentSimilar Results for the Non-CW Population as for CW
$0
$5,000
$10,000
$15,000
$20,000
$25,000
$30,000
$35,000
NotEmployed
LYI
EmployedLYI
Last Year In
1st Year O ut
2nd Year O ut
3rd Year O ut
4th Year O ut
14.1
5.4
71.1
35.6
27.2
7.8
0.05.0
10.015.020.025.030.035.040.045.050.055.060.065.070.075.0
Not EmployedLYI
Employed LYI
Has Award2+ Terms24+ credits
Post-College EarningsAmong All NCW Students Educational Attainment
(All Earnings adjusted to 2000-01 CPI)

Does Work Study Help Employed CW Students?Educational and Economic Outcomes by Work Study Status
If education equal, Work Study in itself no large effect on earnings.However, WS students have higher educational attainment overall.
$0$2,000$4,000$6,000$8,000
$10,000$12,000$14,000$16,000$18,000$20,000
No WS Has WS
Last Year In
1st Year O ut
2nd Year O ut
3rd Year O ut
4th Year O ut50.2
10.2
45.2
96.4
20.7
78.1
0.0
10.0
20.0
30.0
40.0
50.0
60.0
70.0
80.0
90.0
100.0
No WS Has WS
Has Award2+ Terms24+ credits
Post-College Earnings Among EmployedEducational Attainment
CW students that receive WS spend more terms in college, have a higher number credits completed, and are more likely to earn awards than CW students who are employed but that do not receive WS.
(All Earnings adjusted to 2000-01 CPI)

Does Work Study Help Employed NCW Students?Educational and Economic Outcomes by Work Study Status
If education equal, WS has apparent negative effect on earnings.WS students have higher educational attainment overall.
$0
$5,000
$10,000
$15,000
$20,000
$25,000
$30,000
No WS Has WS
Last Year In
1st Year O ut
2nd Year O ut
3rd Year O ut
4th Year O ut 46.1
9.1
46.4
96.2
15.7
82
0.0
10.0
20.0
30.0
40.0
50.0
60.0
70.0
80.0
90.0
100.0
No WS Has WS
Has Award2+ Terms24+ credits
Post-College Earnings Among EmployedEducational Attainment
NCW students that receive WS spend more terms in college, have a higher number credits completed, and are more likely to earn awards than NCW students who are employed but that do not receive WS.
(All Earnings adjusted to 2000-01 CPI)
**There may be other demographic differences between students with and without WS not accounted for by matching variables which are driving the earnings differences.

Report 3 – Financial Aid Utilization & ImpactPolicy Implications –Financial Aid Impact
Encourage Financial Aid Application:
Students who receive aid are more likely to get longer awards.Educate CW students about benefits of financial aid.Support CW students through the application process.Look at interaction between financial aid and CalWORKsgrant – make sure financial aid won’t impact eligibility for CalWORKs.Aim for 100% participation.
Increase Work Study Funding and Participation:
Work Study is associated with greater coursework and award completion.Provide more Work Study opportunities to CW students!

Future Research
Use longer time period to see whether trends we are seeing continue.
Add more cohorts to enlarge sample size to accomodate more detailed analysis.
Try to get a sample of CalWORKs non-community college students to compare outcomes of CalWORKs students to.
Explore doing a systematic CalWORKs program evaluation using new CalWORKs MIS data elements.
Try to identify differences in regions or colleges.

Thank-You!Much thanks to the generous staff at the California Community Colleges Chancellor’s Office who have helped make this research project possible:
Linda Michalowski & Sarah Tyson
Sonia Ortiz-Mercado
Patricia Servin-Lemus
Debbie Velasquez & Melony Ripke
Myrna Huffman & Tonia Lu
Willard Hom & Alice van Ommeren
Chuck Wiseley
Ed Connolly
Judy Reichle & Patrick Conklin
CalWORKs Advisory Committee & the CalWORKs Association