community-based sustainable development in africa
TRANSCRIPT

CommunityCommunity--Based SustainableBased SustainableDevelopment in Africa:Development in Africa:
How to Practically Promote How to Practically Promote Synergies in Climate Mitigation,Synergies in Climate Mitigation,
Poverty Reduction, Health Improvement and Poverty Reduction, Health Improvement and ResilienceResilience
Robert Van Buskirk
Lawrence Berkeley National Laboratory &Village Projects International/ICSEE
2008

OutlineOutline
1. Background2. Community-based Asset-Building3. Development Benefit Supply Curves4. Poverty-Reduction and Health Credits5. An International Community of Projects

AcknowledgementsAcknowledgements
• David I. Levine• Benn Eifert• Mesfin Zaid• Dr. Essel Ben Hagan• Mnat Berhane• Benoit Lebot• Nicolas Drunet • Ed Maurer• Alazar Tecle• Tom Kirkstetter• Brett Singer • Tewelde Stephanos• Debesai Ghebrehiwet• Elena Krieger
• Haile Teclai• Robel Yosief• Francis Hillman• Lesia Whitehurst• Mnat Berhane• Ndeye Djigal Sall• Haile Teclai• Robel Yosief• Francis Hillman• Prof. David Levine• Stacey Currie• Ezana Negusse• Doug Bushey• Robert Lange

My Africa Development ExperienceMy Africa Development Experience
• 1993-1997: Sustainable energy research in Eritrea: improved stoves, wind and solar
• 1999-2003: Initial scale-up of Eritrean improved stoves program
• 2003-2005: Pilot test of rural solar home lighting finance scheme in Eritrea
• 2002-Present: Scale-up of Eritrean improved stoves with some help from voluntary market carbon credits
• 2006-Present: Combination of solar lights and stoves• 2007-Present: Creation of poverty-reduction and health
credits and replication of development model to Ghana, Senegal, and Zanzibar
• 2008: Sign-up of 100-200 villages: Senegal (>100), Zanzibar (1), Eritrea (40), Ghana (3)

CommunityCommunity--based based Asset BuildingAsset Building

Build Social Capital: Types of AssetsBuild Social Capital: Types of Assets
• Physical infrastructure• Organization • Human capacity and education• Ideas, information, and technologies• Environment• Natural resources
Assets and Self-Reliance Build Resilience

Responsibility Delegated to VillagersResponsibility Delegated to Villagers
• No gifts• They work to create their own benefits• They can pay for what they want either in cash or
with work • If they produce social and environmental value
they get credit which is used to discount the price of what they want or do a savings account that can buy equipment they need
• Organizers periodically visit to check the projects and verify impacts
• If they don’t like the deal, no problem, we will go to the next village

Combined Lights and StovesCombined Lights and StovesDo several villages at a time
Give them an initial solar home lighting system (distribute via lottery)
Given them parts and training for building stoves
Demand that villagers build organization and capacity for implementation/maintenance
Buy more lights with carbon credits from stoves
Distribute solar home lights via lottery. One improved stove = one lottery ticket.

Solar LightSolar Light

Eritrea Improved StoveEritrea Improved Stove
Traditional
Improved
How Project Grows AssetsHow Project Grows Assets
• Physical infrastructure: Lights and stoves are more efficient energy services infrastructure
• Organization: Village has to organize to make its contribution through stove building
• Human capacity and education: Training for project, and lights allow big increase in education
• Ideas, information, and technologies: Villages get access to renewable energy, cell phones, and potentially more technologies
• Environment: Improved indoor air quality, and lower GHG emissions
• Natural resources: Enhanced natural resources, more trees, bushes and grass

Development Benefit Development Benefit Supply CurvesSupply Curves

Example: Eritrean Emissions Reduction Supply Example: Eritrean Emissions Reduction Supply Implied LogImplied Log--Normal B/C DistributionNormal B/C Distribution

Therefore: Wide Range of Environmental Therefore: Wide Range of Environmental Returns on InvestmentReturns on Investment

PovertyPoverty--Reduction Reduction and Health Creditsand Health Credits

Poverty and Health CreditsPoverty and Health Credits
Poverty Credits Measure Relative Labor Productivity Improvement: Can someone increase the value of their consumption and livelihood without increasing labor? People have only 40 to 60 hours per week. Anything that increases actual productivity usually leads to increased basic consumption Typical cost in Eritrea: A doubling of personal productivity costs about $100 direct capital investment.
Health Credits Measure Decrease in Disease Burden: Disablity-Adjusted Life Year (DALY) saved. Generally costs $50 - $200. Take current burden of disease (such as 0.05 DALY per year per person) and multiply by the fractional decrease in disease due to a particular measure (such as decreased indoor air pollution)

Poverty Metric CommentsPoverty Metric Comments
• Standard of Living measured in terms of basket of goods and services ‘Purchasing Power Parity’income
• Poverty reduction measured as concrete labor productivity increase
• PPP/Cash income ratio is 5-10 for many developing countries
• Efficient investment in rural Eritrea converts cash investment to cash income at the rate of $1/year of income for about $1 invested.
• No new technologies needed!

Poverty Metric Comments (cont)Poverty Metric Comments (cont)
• Cash incomes are often less than $100/person/year• If efficiently invested it takes about $100/person
investment to double incomes in rural Africa, producing $1000 PPP income/year for ten years (because of 10:1 PPP to cash income ratio)
• PPP Benefit/Cost ratio is therefore $10000 effective income over ten years for $100 invested or 100:1
• Because incomes are very low, the human benefit per dollar of effective income may be as much as 100 times higher than a typical U.S. investment
• This means that the human B/C ratio of an efficient investment in rural African can be 100*100 = 10,000 times higher than a typical investment in the U.S.

Some Development Credit ResultsSome Development Credit Results
Development Credit Value Estimates:High B/C ratio implies asset/capital accumulation potential
OutputEnviron-
ment(tons CO2)@ $20/ton
Poverty-Reduction
(person years)
@ $20/unit
Disease Reduction
(DALY)@
$40/DALY
10 yr Benefit (minus
25%over-head)
Output Cost
B/CRatio
Qty/yr $/yr Qty/
yr $/yr Qty/yr $/yr Tot Net1 Unit
CostImproved Stoves 0.2 $4 0.5 $0.1 0.14 $5.6 $62 $20 3.1:1
Solar Lighting System 0.1 $2 0.7 $14 0.01 $0.4 $123 $150 0.82:1
Sust. Land Mngmnt (ha) 0.9 $18 1.0 $20 0.025 $1 $295 $50 5.9:1
Mangrove forestry (ha) 3.6 $72 1.0 $20 0 $0 $653 $150 4.4:1
Solar Ovens 0.1 $2 0 $0 0.05 $2 $30 $100 0.3:11 Net income from the credits has the 25% marketing and distribution costs deducted

An International An International Community of ProjectsCommunity of Projects

Senegal Mangrove PlantingSenegal Mangrove Planting

CommunityCommunity--Based Mangrove PlantingsBased Mangrove Plantings

Monitoring w/Kite Aerial PhotographyMonitoring w/Kite Aerial Photography
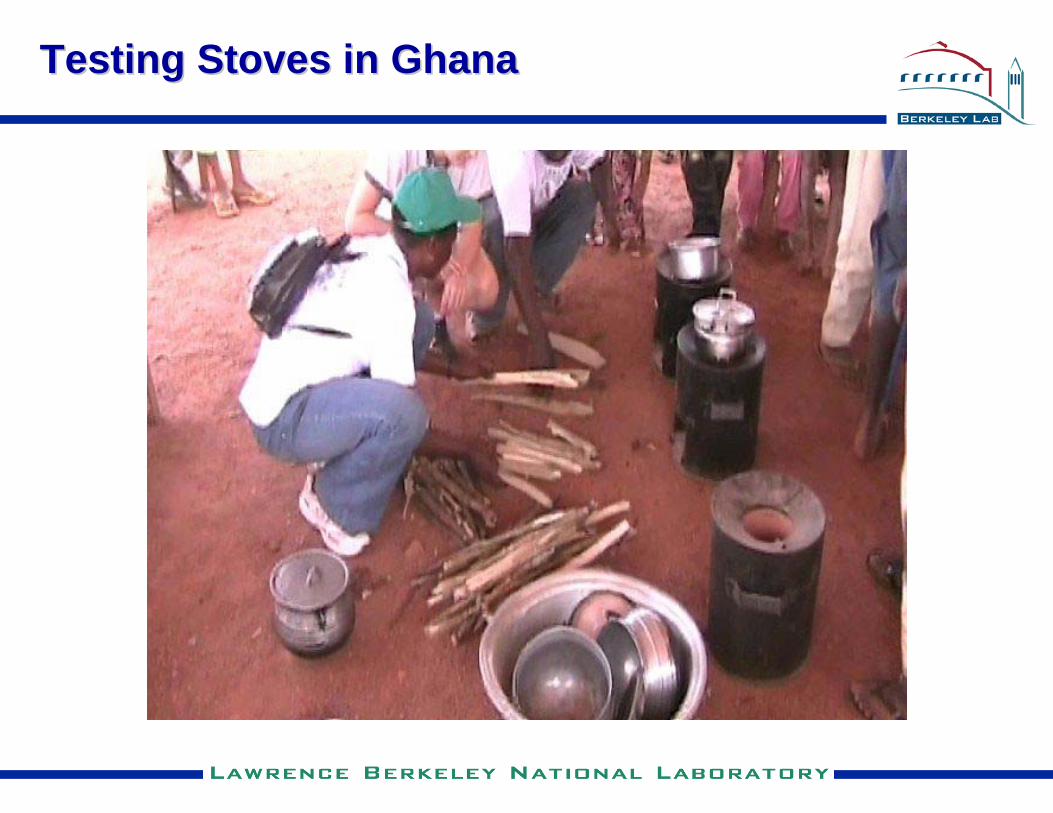
Testing Stoves in GhanaTesting Stoves in Ghana

More Stoves in GhanaMore Stoves in Ghana

Solar Installation in GhanaSolar Installation in Ghana

Solar Light Raffle Winner in GhanaSolar Light Raffle Winner in Ghana

Developing FloodDeveloping Flood--Resistant Housing in Resistant Housing in GhanaGhana

Zanzibar Solar Lights and StovesZanzibar Solar Lights and Stoves

Building Global Building Global Resilience to Climate Resilience to Climate ChangeChange

Climate Change ProblemClimate Change Problem
Annual Rate of Atmospheric Carbon Increase
0
1
2
3
4
5
6
7
8
1950 1970 1990 2010 2030 2050
Year
Ann
ual C
arbo
n In
crea
se (G
tC/y
ear)
Current Path
Needed Path
The Past

Current Cost of a SolutionCurrent Cost of a Solution
The Needed Path requires an additional deceleration of net emissions of 0.1 to 0.2 GtC/yr2
For example accelerating wind replacement of coal gives one tC/yr2 deceleration at an investment cost of about $1500/yr
Near term cost of additional needed carbon deceleration at this unit cost is $150 billion to $300 billion per year
We need to lower this investment cost AND motivate the needed level of additional investment NOW

The Carbon CycleThe Carbon Cycle
The earth recycles CO2 naturallyBy moving 4 GtC/year of biological carbon into peat the net atmosphericcarbon increase can be neutralized

The Terrestrial Carbon CycleThe Terrestrial Carbon Cycle
65.6 billion tons of carbon per year (GtC/yr) cycle through terrestrial ecosystems
More than 22% of this is appropriated by humans in two forms
6.26 GtC/yr (9.5%) is appropriated as decreased vegetative production (e.g. replacing forests with roads, grasslands or low productivity agriculture)
8.22 GtC/yr (12.5%) is harvestedIncreased land use productivity and efficiency allows
increased harvest without increasing impact on the environment
Ecological carbon sequestration is enabled through increased land use productivity/efficiency

Where is the Ecological Carbon?Where is the Ecological Carbon?
Human appropriated net primary productivity potentials by region
RegionArea
106 km2Baseline
NPPGtC/yr
DecreasedProduction
GtC/yr
GrossHarvestGtC/yr
Prod. Incr.@85% Eff
GtC/yr
Prod. Incr.@110% Eff
GtC/yr
Northern Africa and Western Asia 10.3 0.9 0.13 0.23 0.08 0.17
Sub-Saharan Africa 24.0 13.5 1.56 0.94 1.19 1.81
Central Asia and Russian Federation
20.5 8.3 0.68 0.29 0.53 0.77
Eastern Asia 11.5 4.2 0.22 1.23 0.00 0.36
Southern Asia 6.7 2.6 0.38 1.23 0.14 0.54
Southeastern Asia 4.5 4.6 0.77 0.60 0.57 0.91
Northern America 18.5 8.0 0.61 1.15 0.35 0.79
Latin America and the Caribbean 20.3 16.5 1.22 1.34 0.83 1.47
Western Europe 3.7 2.0 0.14 0.68 0.02 0.23
Eastern and Southeastern Europe 2.2 1.3 0.35 0.33 0.25 0.42
Oceania and Australia 8.4 3.8 0.21 0.21 0.15 0.25
Global Total/Average 130.4 65.5 6.26 8.22 4.09 7.73
Efficiency Potentials

What is the Cost?What is the Cost?
Improved efficiency biomass stoves may cost $10 and decrease emissions by 0.1 tC/year (i.e. sequestration acceleration cost $100/yr investment per tC/yr2)
Conversion to more sustainable/productive land use: $100/ha which means $100/yr investment will provide about 1 tC/yr2 (same sequestration acceleration cost)
Money required for global sequestration acceleration by 0.1 to 0.2 GtC/yr2 may be only $10 to $20 billion/year investment for taking C out of atmosphere.
Ten times lower capital requirements, same benefit, ten times the return on investment: a big potential for exponential socio-economic growth and capital recruitment is created

Motivating a Billion PeopleMotivating a Billion People
1. First, ask them to do something that want to do already2. Everyone will invest time and energy for a long and
prosperous life for themselves and their loved ones 3. Don’t just solve climate change, also solve poverty and
health problems to create long lives and prosperity4. In poor countries, ½ year is lost through disease for
every year of life that is lived5. In poor countries, a few hundred dollars of investment
can double a person’s income or standard of living6. Potential biomass carbon productivity improvement
investments are of the order of a few hundred dollars investment per person

Why Integrated CoWhy Integrated Co--benefit and Climate benefit and Climate Solutions?Solutions?
1. Decelerating atmospheric carbon requires accelerating clean energy and carbon sequestration investments
2. Cheapest net carbon opportunities are in areas with lowest resource and economic efficiencies: i.e. the poorest developing countries
3. In poor countries co-benefits (health improvement and poverty reduction) far outweigh carbon benefits
4. We find the highest return solutions and mobilize the greatest amount of capital for integrated investment and market transformation by solving all three problems at once: net carbon reduction, poverty reduction, and disease reduction

Supporting Research PlanSupporting Research Plan
1. Define poverty-reduction and disease-reduction credits, crediting methodologies and monitoring technologies
2. Measure social value production price elasticities with rigorous evaluation of actual field program experiments
3. Develop integrated socio-environmental (SE) market transformation policy designs and policy impact evaluation models
4. Develop life-cycle SE performance standards for technologies and project/program types
5. Compile & develop a long list and menu of high SE performance technologies and project models
6. Develop long-term ecological bio-carbon sequestration techniques
7. Design menu of systems for increasing net primary biomass productivity (e.g. irrigated sea water agriculture)