communications alliance ltd · communications alliance ltd was formed in 2006 to provide ... 1.2.5...
TRANSCRIPT

COMMUNICATIONS
ALLIANCE LTD
INDUSTRY GUIDELINE
G634:2013
Quality of Service parameters for Voice over
Internet Protocol (VoIP) services

G634:2013 Quality of Service parameters for Voice over
Internet Protocol (VoIP) services Industry Guideline
First published as G634:2007
Communications Alliance Ltd was formed in 2006 to provide
a unified voice for the Australian communications industry
and to lead it into the next generation of converging
networks, technologies and services.
Disclaimers
1. Notwithstanding anything contained in this Industry Guideline:
(a) Communications Alliance disclaims responsibility (including
where Communications Alliance or any of its officers,
employees, agents or contractors has been negligent) for
any direct or indirect loss, damage, claim, or liability any
person may incur as a result of any:
(i) reliance on or compliance with this Industry
Guideline;
(ii) inaccuracy or inappropriateness of this Industry
Guideline; or
(iii) inconsistency of this Industry Guideline with any law;
and
(b) Communications Alliance disclaims responsibility (including
where Communications Alliance or any of its officers,
employees, agents or contractors has been negligent) for
ensuring compliance by any person with this Industry
Guideline.
2. The above disclaimers will not apply to the extent they are
inconsistent with any relevant legislation.
Copyright
© Communications Alliance Ltd 2013
This document is copyright and must not be used except as permitted
below or under the Copyright Act 1968. You may reproduce and publish
this document in whole or in part for your or your organisation‘s own
personal or internal compliance, educational or non-commercial
purposes. You must not alter or amend this document in any way. You
must not reproduce or publish this document for commercial gain without
the prior written consent of Communications Alliance. Organisations
wishing to reproduce or publish this document for commercial gain (i.e. for
distribution to subscribers to an information service) may apply to subscribe
to the Communications Alliance Publications Subscription Service by
contacting the Communications Alliance Commercial Manager at
[email protected]. If you publish any part of this document for
any purpose, you must also publish this copyright notice as part of that
publication.

- i -
G634:2013 COPYRIGHT
APRIL 2013
EXPLANATORY STATEMENT
This is the Explanatory Statement for the G634:2013 Quality of Service parameters for
Voice over Internet Protocol (VoIP) services Industry Guideline. This Explanatory
Statement outlines the purpose of this Industry Guideline (the Guideline) and the factors
that have been taken into account in its development.
Background
The Internet Protocol (IP) is used for a range of services, some of which are sensitive to
delays in packet delivery and to packet loss e.g. voice, video. The performance of these
services benefit from having a defined Quality of Service (QoS).
Objectives of the Guideline
This Guideline provides an indicator of quality for Voice over Internet Protocol (VoIP)
services and information on factors that determine conversational voice quality on VoIP
Services.
How the Objectives will be Achieved
The objectives will be achieved by the adoption of the QoS parameters suggested in this
Guideline in a consistent manner by providers of VoIP Services.
Anticipated Benefits to Consumers
Consumers are likely to benefit from a consistent approach by service providers to the
delivery of QoS for VoIP Services. Benefits include the ability to make an informed choice
of VoIP Services as well as improved confidence that the VoIP Services will operate as
expected and will operate between different networks.
Anticipated Benefits to Industry
A consistent approach to the definition of QoS for VoIP Service by service providers will
reduce the complexity and cost of informing end-users. It will also increase the number
of users that can be connected reliably.
Anticipated Cost to Industry
Anticipated costs include those associated with the use of an approach consistent with
the information in this Guideline.
Acknowledgements
Nortel contributed content in multiple places in the document, including:
Section 4.2: Table 3 ―Bandwidth per Voice Calls with Standard IP Header‖; Section4.8:
Echo Control, Figure 2 ―Echo Level and one-way Delay‖, Appendix C, Section C5
―Graphical representation of relationship between R and delay‖ - diagrams and
Appendix D on Quality of Experience from Essentials of Real-Time Networking: How Real-
Time Disrupts the Best-Effort Paradigm.
Lawrie Clarke
Chairman
WC48 : VoIP QoS Revision Working Committee

- 1 -
G634:2013 COPYRIGHT
APRIL 2013
TABLE OF CONTENTS
1 GENERAL 4
1.1 Introduction 4
1.2 Future Work 4
1.3 Scope 5
1.4 Objective 5
1.5 Guideline Review 5
2 ACRONYMS, DEFINITIONS AND INTERPRETATIONS 6
2.1 Acronyms 6
2.2 Definitions 7
3 VOIP SERVICE QUALITY INDICATORS 9
3.1 Measure of QoS for VoIP Services (Transmission Rating R) 9
3.2 Recommended Performance Values 11
4 IMPLEMENTATION GUIDELINES 16
4.1 VoIP End-user Access Connection 16
4.2 VoIP Inter-Carrier Connection 16
4.3 VoIP Packet Handling 17
4.4 VoIP Packet Routing 18
4.5 VoIP Packet Type and Priority 18
4.6 VoIP Codec Choice and Codec Negotiation 18
4.7 VoIP Echo Control 18
4.8 VoIP Transcoding 22
4.9 Other Components 23
4.10 IP Network QoS Classes 26
5 REFERENCES 27
APPENDIX A – VARIOUS SCENARIOS FOR VOICE SERVICES 31
A1 SINGLE CARRIER 31
A2 TWO CARRIERS 32
A3 THREE CARRIERS 34

- 2 -
G634:2013 COPYRIGHT
APRIL 2013
APPENDIX B – CODEC CHARACTERISTICS 35
B1 CODEC CHARACTERISTICS AND SELECTION 35
APPENDIX C – PERFORMANCE VALUES BASED ON TRANSMISSION RATING
FACTOR R 36
C1 INTRODUCTION 36
C2 ITU-T RECOMMENDATION G.107 - THE E-MODEL, A COMPUTATIONAL MODEL
FOR USE IN TRANSMISSION PLANNING. 36
C3 ITU-T RECOMMENDATION G.109 (09/99) – DEFINITION OF CATEGORIES OF
SPEECH TRANSMISSION QUALITY 37
C4 ITU-T RECOMMENDATION G.114 – ONE-WAY TRANSMISSION TIME 38
C5 GRAPHICAL REPRESENTATION OF RELATIONSHIP BETWEEN R AND DELAY 40
APPENDIX D - QUALITY OF EXPERIENCE (QOE) 44
D1 INTRODUCTION 44
D2 WHAT IS QOE? 44
D3 MEASURING QOE 46
D4 QUANTIFYING QOE PARAMETERS 47
PARTICIPANTS 49
LIST OF TABLES
TABLE 1 Transmission Rating (R) limits for voice services .................................... 13
TABLE 2 Codec Type vs. allowable delay with default E model values if R is to
be not less than 80 ..................................................................................................... 15
TABLE 3 Bandwidth per Voice Calls with Standard IP Header ............................ 17

- 3 -
G634:2013 COPYRIGHT
APRIL 2013
LIST OF FIGURES
FIGURE 1 Talker Echo Loudness Rating (TELR) ....................................................................... 19
FIGURE 2 Echo Level and one-way Delay ............................................................................ 20
FIGURE 3 Optimum Overall Loudness Rating ........................................................................ 22
FIGURE 4 IP in Core and Access networks ............................................................................ 31
FIGURE 5 TDM Access and Core, IP in access network ....................................................... 32
FIGURE 6 TDM access and core, IP core and access ......................................................... 32
FIGURE 7 TDM Access & IP Core, IP Access .......................................................................... 33
FIGURE 8 IP access, TDM Core, IP Access ............................................................................. 34
FIGURE 9 Impact of mouth to ear delay on R value ............................................................ 39
FIGURE 10 ITU-T G.107 Default Delay Impairment ................................................................. 40
FIGURE 11 E-Model, Echo Impairment .................................................................................... 41
FIGURE 12 E-Model, Speech Compression Impairment ....................................................... 42
FIGURE 13 E-Model, G.729 Packet Loss Impairment ............................................................. 43
FIGURE 14 Some of the factors influencing the QoE of a service, application, or device ...
.................................................................................................................................. 46
FIGURE 15 QoE variation as function of a variable ............................................................... 48

- 4 -
G634:2013 COPYRIGHT
APRIL 2013
1 GENERAL
1.1 Introduction
1.1.1 The development of the Guideline has been facilitated by
Communication Alliance through a Working Committee
comprised of representatives from the telecommunications
industry and Government regulatory agencies.
1.1.2 The Guideline should be read in the context of other relevant
Codes, Guidelines and documents, including the G632:2012
Quality of Service parameters for networks using the Internet
Protocol Guideline.
1.1.3 Statements in boxed text are a guide to interpretation.
1.2 Future Work
1.2.1 The Working Committee that developed this Guideline
considered the application of ―Static‖ Quality of Service (QoS)
targets for networks (i.e. not requiring QoS negotiation between
the Voice over Internet Protocol (VoIP) service and underlying
transport on a call-by-call basis).
NOTE:
1. ‗Call-by-call‘ also refers to the different call scenarios for voice
services on IP networks.
2: The delivery of QoS for VoIP Services may depend on networks
that meet different QoS targets however QoS for networks and
services address different requirements. Refer to G632 for
information on QoS targets for IP networks.
1.2.2 Work is proceeding in international forums on ―Dynamic‖ QoS
Negotiation, which requires a higher level of coordination
between providers of VoIP Services, on a service-by-service basis.
This topic has been left for future work to allow time for
international recommendations and standards to stabilize.
1.2.3 The assumption of growing IP bandwidth in access and core
networks means that these dynamic methods will probably not
be required for some services (e.g. voice), but may become
more important for bandwidth-intensive applications (e.g. video-
on-demand).
1.2.4 Extension of the Guideline to cover VoIP Services over wireless IP is
considered future work. Techniques and standards for deploying
VoIP Services over the radio access are currently immature – it is
expected, however, that ITU Recommendations and 3GPP
Specifications, along with associated technologies and voice
quality tools will emerge over the next few years.
1.2.5 While the deployment and use of wideband codecs
(e.g. AMR-WB, G.722.2) is increasing, the definition of parameters
to guide wideband implementation (e.g. based on G107.1) is for
future study.
- 5 -
G634:2013 COPYRIGHT
APRIL 2013
1.3 Scope
1.3.1 The Guideline recommends Quality of Service (QoS) categories
and identifies influencing impairments for Voice over Internet
Protocol (VoIP) Services within Australia.
NOTES:
1. QoS in this context refers to conversational voice quality on
VoIP networks or, as described in Appendix D, Quality of
Experience (QoE).
2. The use of multiple network types (e.g. a VoIP call over a mix of
packet and circuit switched networks) can degrade overall
performance relative to the use of a single network type.
3. Some networks can have high variability in performance and
may not be suited to VoIP (e.g. the performance of some wireless
networks varies with factors such as coverage, proximity to a
base station/access point).
1.3.2 The Guideline is based on ITU-T G.107 and provides information on
QoS parameters for conversational voice quality for the end-user
experience of VoIP service(s) over Managed Network(s).
NOTES:
1. Refer to G632 for information on QoS performance in networks
using the Internet Protocol (IP).
2. The Guideline could be used for unmanaged (i.e. best effort)
VoIP Services even where they do not meet the performance
measures e.g. the information on codec selection, access links.
1.3.3 The Guideline does not specify QoS parameters for services other
than VoIP (e.g. video over IP, text over IP).
1.3.4 The Guideline does not specify QoS parameters for non-voice
services carried over VoIP (e.g. Fax, dial-up modem,
teletypewriter, burglar alarms, EFTPOS terminals).
1.3.5 The Guideline does not address processes for the measurement
of VoIP QoS. Refer to G635 for information on the measurement
of VoIP QoS.
1.4 Objective
The objective of this Guideline is to specify the categories of speech
transmission quality in terms of limits of Transmission Rating Factor R and
provide an overall indicator of the quality of Voice over Internet Protocol
(VoIP) services. Providers of VoIP Services can use this Guideline for
transmission planning purposes and to inform end-users. In addition, it
provides information on the impairments that determine conversational
voice quality for VoIP Services based on ITU-T Recommendations and
Australian requirements.
1.5 Guideline Review
Review of the Guideline will be conducted within five years of publication.

- 6 -
G634:2013 COPYRIGHT
APRIL 2013
2 ACRONYMS, DEFINITIONS AND INTERPRETATIONS
2.1 Acronyms
For the purposes of the Guideline, the following acronyms apply:
3GPP 3rd Generation Partnership Project
ACIF Australian Communications Industry Forum
ADPCM Adaptive Differential Pulse Code Modulation
AMR Adaptive Multi-Rate
AMR-NB Adaptive Multi-Rate Narrowband
AMR-WB Adaptive Multi-Rate Wideband
CELP Code Excited Linear Prediction
Codec COder / DECoder
CSP Carriage Service Provider
CE Customer Equipment
DTMF Dual Tone Multi Frequency
ECAN Echo Canceller
ERLE Echo Return Loss Enhancement
IP Internet Protocol
IPDV IP Packet Delay Variation
IPTD IP Packet Transfer Delay
ITU-T International Telecommunications Union –
Telecommunications standardization sector
MOS Mean Opinion Score
OLR Overall Loudness Rating
POTS Plain Old Telephone Service
QDUs Quantising Distortion Units
QoS Quality of Service
RFC Request For Comment
RLR Receive Loudness Rating
RTCP Real Time Control Protocol
SLR Send Loudness Rating
TCLw Weighted Terminal Coupling Loss
TELR Talker Echo Loudness Rating
UNI User-to-Network Interface
VoIP Voice over Internet Protocol
WEPL Weighted Echo Path Loss

- 7 -
G634:2013 COPYRIGHT
APRIL 2013
2.2 Definitions
For the purposes of the Guideline, the following definitions apply:
Carriage Service Provider
has the meaning given by section 87 of the Telecommunications Act 1997.
Carrier
has the meaning given by section 7 of the Telecommunications Act 1997.
Customer Equipment
has the meaning given by section 21 of the Telecommunications Act 1997.
E-model
means the computational model with the output of a scalar quality rating
value, R, as defined in ITU-T Recommendation G.107.
NOTE: G.107 defines the E-model (used to generate R values) for
narrowband codecs and G.107.1 extends the E model to cover
wideband codecs.
Internet Protocol
means the protocol defined in the Internet Engineering Task Force (IETF)
Request For Comment (RFC) 791.
IP Packet Delay Variation (IPDV)
means the difference between the actual IP Packet Transfer Delay (IPTD)
of a packet and a reference IPTD for a packet population of interest. The
reference IPTD of a population of packets is the minimum IPTD for the
packets within the population of interest.
IPDV is a statistical sample, measured over a packet population of interest.
Unless otherwise stated, the default quantile is the 10-3 quantile i.e. 99.9%
of packets should be received within the performance objective.
NOTE: IPDV is also referred to as ―jitter‖, and is usually reported in
milliseconds.
IP Packet Loss Ratio (IPLR)
means the ratio of total lost IP packets to total transmitted packets in a
population of interest. Total lost packets includes any delivered with errors
or IPTD greater than 3 seconds.
NOTES:
1. IPLR Ratio is also referred to as ―Packet Loss‖ and is usually
reported as a percentage.
2. The upper limit value of 3 seconds for IPTD is based on the
provisional value for the time limit for a successful packet
outcome (refer to ITU T Rec. Y.1540 clause 5.5.4).

- 8 -
G634:2013 COPYRIGHT
APRIL 2013
IP Packet Transfer Delay (IPTD)
means the one-way time interval between the moment the first bit of an IP
packet crosses an entry point of a network and the moment the last bit of
the same packet crosses an exit point of the network.
NOTE: IP Packet Transfer Delay is also referred to as ―delay‖ or
―latency‖, and is usually reported in milliseconds.
Loudness Rating
means a measure of the volume of speech based on ITU-T
Recommendation G.121.
Managed Network
means an IP network with QoS-enablement e.g. a network that conforms
with the parameters outlined in Guideline G632.
Network Boundary
has the meaning given by section 22 of the Telecommunications Act 1997.
Sidetone Path
means any path, acoustic, mechanical or electrical, by which a
telephone user's speech and/or room noise is heard in their own ear(s).
NOTE: This is based on ITU-T P.10.
Trombone Connection
means the use for a single call of two circuits in tandem between a
remote switching stage and its controlling entity.
VoIP Service
means a voice communication service where the origination and/or the
termination of the voice service is carried over an IP network.
NOTE: A VoIP Service is independent of the underlying transport
method(s), e.g. DSL, Ethernet, HFC.

- 9 -
G634:2013 COPYRIGHT
APRIL 2013
3 VOIP SERVICE QUALITY INDICATORS
3.1 Measure of QoS for VoIP Services (Transmission Rating R)
3.1.1 Transmission Rating R is adopted as a predictive measure of voice
quality, based on the computational model defined by ITU-T
G.107 (the E-Model). The value of R may be derived by
application of the planning guide defined by ITU-T G.108. R is
expressed as a scalar (a single number) on a scale from 0 to 93.2
for narrowband voice services.
NOTES:
1. The E model is only applicable where its parameter values can
be determined on an end-to-end network basis, or as a complete
―mouth-to-ear‖ experience. Assignment of those values into
constituent network segments and operational boundaries is an
area of further work
2. As per the Telecommunications Act, Carriers and Carriage
Service Providers can only manage and measure service quality
to the defined Network Boundaries.
3. Bundled offerings may cross the Network Boundary.
4. Other measures following ITU-T recommendations such as ITU-T
Rec. P.800 and ITU-T Rec. P.862 are not used as part of this
Guideline.
ITU-T Rec. P.800 uses subjective testing for the determination of a
Mean Opinion Score (MOS). This approach of using the human
ear is expensive, time consuming and inconvenient.
ITU-T Rec. P.862 on Perceptual Evaluation of Speech Quality
(PESQ) does not address determining factors for the evaluation of
conversational voice quality such as delay, signal levels, echo
impairment; this does not allow for the tuning of a network and
cannot assist in identifying the source of a problem.
5. The term wideband only refers to the choice of codec, as a
voice service may still be using narrowband channel. For IP
transport different bandwidth is required for different codecs.
6. The R value is extendable, unlike MOS which needs different
scoring for wideband codecs.
7. G.107.1 extends the R value to a range of 0 to 129 for
wideband codecs.
3.1.2 R and its computation are defined in ITU Rec. G.107 and G.107.1.
NOTES:
1. It is important to note that ITU-T G.108 is to be used as a network
planning guide only. It does not imply specific performance that
will be achieved by a particular connection or user device. As
such, ITU-T G.108 refers to R as an indicator of QoS for planning
purposes.
2. The ITU-T uses QoS to refer to conversational voice quality on
VoIP networks, or as described in Appendix D, Quality of

- 10 -
G634:2013 COPYRIGHT
APRIL 2013
Experience (QoE). Refer to ITU-T E.800 for the complete ITU-T
definition of QoS.
3. It is advisable that the reader is fully aware of all the factors
that determine R as described in ITU-T G.107/G.107.1 (the
E-Model). See Appendix C of this document for a summary.
3.1.3 The parameters that contribute to the predictive measure of VoIP
QoS include:
(a) Loudness Ratings and loss plan;
(b) Sidetone Path;
(c) D-value (related to handset design);
(d) echo loudness;
(e) codec distortion;
(f) immunity of the codec to packet loss;
(g) noise levels in room and circuit/codec; and
(h) advantage (gained from mobility or remote access).
NOTES:
1. The E-model does not model all network based impairments.
Examples of the most severe impairments include mobile
background noise and double talk echo. Further details on
factors not covered by the E-model may be found in ITU-T
G.108.1.
2. The E-model has particular limits when applied to services
operated over connections with bandwidth limitations e.g. some
wireless networks. For example, a wireless access network can
have variable signal strength, which affects parameters such as
delay and packet loss, which in turn affects voice call quality.
3. The E-model does not incorporate measures for enhancement
techniques offered by mobile customer equipment, such as
distortion masking or noise suppression. Other CE factors not
easily accommodated include hands free kits and acoustical
design.
4. The default value of 35dBA for room noise does not reflect the
use of mobile devices in noisy environments e.g. it would increase
to 55dBA for a quiet car, more for the use of a power tool in the
next room.
5. Refer to AS/CAF S003 for the Australian loss plan. Customer
Equipment Standards such as AS/CA S004, AS/CA S002 and
AS/CA S003 should be used for the final loss plan analysis.
3.1.4 The key contributing parameters affecting conversational voice
quality in a VoIP network are:
(a) delay;
(b) distortion;
(c) echo; and

- 11 -
G634:2013 COPYRIGHT
APRIL 2013
(d) loss/level plan.
NOTES:
1. Also refer to Appendix D, Quality of Experience (QoE), ITU-T
G.107/G.107.1, ITU-T G.108 and TIA TSB-116-A.
2. Delay Includes impairments due to propagation, processing
and packetisation, queuing/jitter, and switching. Delay
contributes to echo impairment, but is also an impairment on its
own when the total delay becomes sufficiently high. End-to-end
delay is the total of all delays in the voice path. The five main
categories of delay are: processing delay, serialization delay
(time taken to push the packet onto the wire), queuing delay
(accumulates at network nodes), propagation delay and jitter
buffer.
3. Distortion Includes impairments due to compression coding,
end devices, lost/late voice packets, speech interruption, noise,
quantizing distortion, and transcoding.
4. Echo Includes impairments due to hybrid inductive coupling
(transhybrid loss) and acoustic coupling in the terminal
handset/headset. Talker echo loudness rating (TELR) is the
parameter defining the level of echo signal reflected back to the
talker.
5. Loss/level plan Includes impairments due to non-optimal signal
loudness — SLR (send loudness rating), RLR (receive loudness
rating), CLR (circuit loudness rating) and TELR.
3.1.5 Proper control of the above four parameters ensures satisfactory
end-user voice quality. It is relevant to note that the factors
affecting voice quality on a VoIP network need to be considered
as a whole; an isolated view of affecting parameters is
incomplete.
3.1.6 It is also important to consider the resulting R for every call
scenario, as this parameter provides a quantifiable figure for
predicted end-user conversational voice quality.
NOTES:
1. The factors in 3.1.3 and 3.1.4 are combined to generate R. For
the algorithm to combine the factors, refer to ITU-T Rec.s
G.107/G.107.1 and G.108.
2. Quantising Distortion Units (QDUs) also contribute to R.
However the audio signal for VoIP is typically digitally encoded
and decoded in customer equipment so QDUs have less
significance than when using an analogue (access) network.
3.2 Recommended Performance Values
3.2.1 Reference voice service categories A to H have been specified
to provide a set of recommended VoIP Service performance
values as set out in Table 1 below.
3.2.2 Refer to Appendix C for a definition of the categories of speech
transmission quality based on ITU-T Rec. G.109. It highlights

- 12 -
G634:2013 COPYRIGHT
APRIL 2013
variations of R value based on parameters such as echo (refer to
ITU-T G.131, ITU-T G.108, ITU-T G.108.1 and ITU-T G.108.2),
equipment impairment Ie of codecs (refer to ITU-T G.113), and
dependencies on packet loss and delay (refer to ITU-T G.114).
3.2.3 R values have strong dependency on the E-Model input
parameters and impairments relative to the call scenario under
consideration. It follows that specified performance values
require reference to specific assumptions on parameters
affecting the combined Transmission Rating Factor R.
3.2.4 To achieve the recommended performance values for Category
D or better in Table 1 then one should have:
(a) a codec with impairment no worse than ITU-T G.711
(i.e. G.711 or a wideband codec);
(b) a managed access and core IP networks with IP Packet
Loss Ratio less than 0.1%;
(c) IP Packet Delay Variation (IPDV) less than 50ms;
(d) Overall Loudness Rating (OLR) of 10dB;
(e) echo cancellation enabled; and
(f) one-way UNI to UNI mean delay of less than 100ms
(i.e. achieving a mouth to ear delay of less than 150ms).
NOTES:
1. Refer to G632 for details on QoS parameters for networks using
IP.
2. R-values less than 50 including the A parameter are not
recommended when planning VoIP networks.
3.‖Best-efforts‖ services offer no performance target or
performance guarantee.
4. Use of a wideband codec allows some relaxation on the
packet network quality in determining the R value.
5. Appendix C.3.1 provides guidance to interpreting a calculated
R-value with explicit user satisfaction expectations, as defined in
ITU-T G.107 Annex B.

- 13 -
G634:2013 COPYRIGHT
APRIL 2013
Category R limit % of Calls Comment Examples
‗Best Efforts‘ N/A N/A
Best Efforts voice
service; no guarantee
on voice quality
Unmanaged voice
service
A ≥ 50 95% Nearly all users
dissatisfied
B ≥ 60 95% Many users dissatisfied
C ≥ 70 95% Some users dissatisfied
G.729a codec on a
wired network,
achieving voice quality
similar to that
experienced on a
cellular mobile service
D ≥ 80 95% Satisfied
G.711 codec on a wired
network, achieving
voice quality similar to
that experienced on a
POTS voice service
E ≥ 90 95%
Very Satisfied
G.711 codec in an ideal
network environment
F ≥ 100 95% G.722.2 (wideband)
codecs, QoS enabled
network(s) G ≥ 110 95%
H ≥ 120 95%
TABLE 1
Transmission Rating (R) limits for voice services
NOTES:
1. Current typical narrowband VoIP calls are unlikely to exceed
an R value of 93. This would use G.711 codecs at each endpoint,
broadband access links (i.e. greater than 800 kbps, and/or use of
multiple virtual circuits and/or QoS enablement), well managed
core networks (e.g. dimensioned for Class 0 of G632
performance and/or with appropriate QoS treatment), and no
transcoding.
2. A voice call using wideband codecs, along with appropriate
transport conditions, can achieve an R value greater than 100.
The use of wideband codecs is becoming widespread in IP
networks.
3. R values in this table are indicative of those expected for
domestic terrestrial networks. By definition, this excludes calls that
include an International call leg. In these cases call quality
cannot be accurately modeled or predicted, if details of the
terminating network will not be known.

- 14 -
G634:2013 COPYRIGHT
APRIL 2013
4. Refer to Table 2 of ITU-T G.109 for examples of speech
transmission quality with estimates of R values for a number of
typical service/network scenarios.
5. Some access technologies are unable to operate on a Class 0
network and therefore are unlikely to achieve a performance
level higher than Category B e.g. calls using geostationary
satellite connections (see C4.1d in Appendix C), some wireless
access technologies or low bandwidth access links.
6. This table typically represents calls made via an IP network and
terminated either directly via IP, or via TDM with a single IP to TDM
conversion.
7. The comments on the level of satisfaction/dissatisfaction
originate from Table 1 of ITU-T Rec. G.109.
8. Where an end-point with a lower category service
communicates with another end-point with a higher category
service, the end-to-end voice quality will be representative of the
lower category service.
9. One should measure and report the objective call quality
without the A value (refer to Appendix C for more information).
Codec Choice and end-to-end Delay
3.2.5 The end-to-end delay is the total of all delays incurred in the
voice path. The four main categories of delay are:
(a) Processing delay: time taken for speech to accumulate so
that it can be put into a packet, loaded and transmitted.
Where speech compression is used, the time needed for
coding is added as well. The speed of any processors (DSP,
CPU) involved also contributes to the final delay.
(b) Serialization delay: determined by the channel speed
(bits/sec) and the number of bits in the packet. On high
speed links serialization delay becomes negligible
compared to other sources of delay.
(c) Queuing delay: accumulates at network nodes (routers
and switches) across the network. Congestion can increase
packet waiting times in buffers. Note that variation in
queuing and buffering delays in the network account for
most of the variation in packet transport times (i.e. jitter).
The jitter buffer wait time is another instance of queuing
delay.
(d) Propagation delay: time taken for the signal to travel
through a transport medium (e.g. cable or fibre or wireless).
In the conventional public network, propagation delay is
the largest contributor to end-to-end delay. Note that
propagation delay across a fixed distance is not a
controllable parameter, since it is determined by the speed
of the signal through the transmission medium (usually light
through a fibre). However, it is possible to ensure that
packets take the most direct route through the network to
minimise queuing and propagation delay.
- 15 -
G634:2013 COPYRIGHT
APRIL 2013
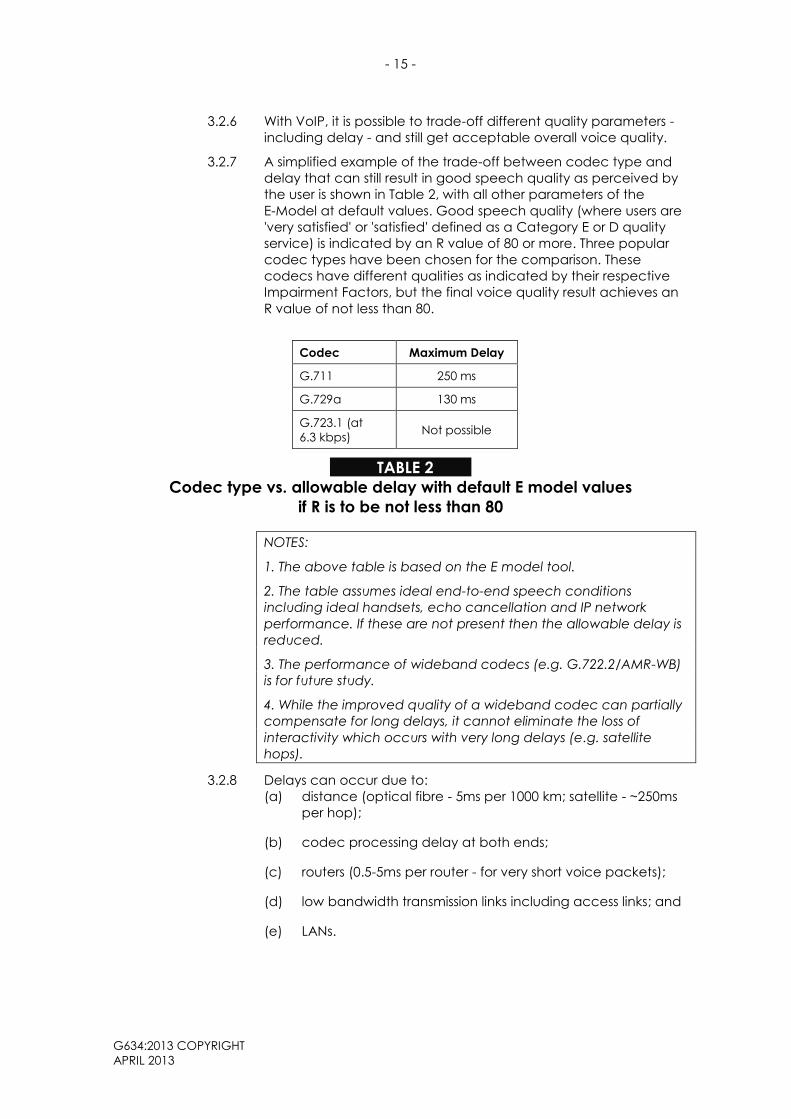
3.2.6 With VoIP, it is possible to trade-off different quality parameters -
including delay - and still get acceptable overall voice quality.
3.2.7 A simplified example of the trade-off between codec type and
delay that can still result in good speech quality as perceived by
the user is shown in Table 2, with all other parameters of the
E-Model at default values. Good speech quality (where users are
'very satisfied' or 'satisfied' defined as a Category E or D quality
service) is indicated by an R value of 80 or more. Three popular
codec types have been chosen for the comparison. These
codecs have different qualities as indicated by their respective
Impairment Factors, but the final voice quality result achieves an
R value of not less than 80.
Codec Maximum Delay
G.711 250 ms
G.729a 130 ms
G.723.1 (at
6.3 kbps) Not possible
TABLE 2
Codec type vs. allowable delay with default E model values
if R is to be not less than 80
NOTES:
1. The above table is based on the E model tool.
2. The table assumes ideal end-to-end speech conditions
including ideal handsets, echo cancellation and IP network
performance. If these are not present then the allowable delay is
reduced.
3. The performance of wideband codecs (e.g. G.722.2/AMR-WB)
is for future study.
4. While the improved quality of a wideband codec can partially
compensate for long delays, it cannot eliminate the loss of
interactivity which occurs with very long delays (e.g. satellite
hops).
3.2.8 Delays can occur due to:
(a) distance (optical fibre - 5ms per 1000 km; satellite - ~250ms
per hop);
(b) codec processing delay at both ends;
(c) routers (0.5-5ms per router - for very short voice packets);
(d) low bandwidth transmission links including access links; and
(e) LANs.

- 16 -
G634:2013 COPYRIGHT
APRIL 2013
4 IMPLEMENTATION GUIDELINES
4.1 VoIP End-user Access Connection
4.1.1 To support services based on Class 0 network(s) (refer to G632),
the end-user access connection should meet the minimum
performance outlined in G632 Appendix B, (i.e. IPDV < 16 ms).
This implies, for support of no more than one voice call:
(a) a minimum access speed of 800 kbps in each direction; or
(b) a means of reducing the impact of other traffic on VoIP
traffic on the end-user access connection. This permits
access speeds as low as 256Kbps or even 128Kbps in each
direction.
4.1.2 Higher access speeds are required for
(a) higher data rate codecs; or
(b) multiple simultaneous calls.
4.2 VoIP Inter-Carrier Connection
4.2.1 To support Category D VoIP Services, connection(s) between
packet networks should meet the minimum performance
requirements of a Class 0 network as defined in G632 Appendix B.
4.2.2 In particular, for interconnection between packetised voice
networks the effects of transcoding (successive encoding by
different codecs) and tandeming (successive encoding by the
same codec) needs to be considered. The total impairment
factor (equipment impairment Ie in the E-Model) as a
consequence of transcoding and/or tandeming for a particular
call scenario is additive (note that Ie = 0 for the G.711 codec).
4.2.3 Table 3 is a guideline for Ethernet and ATM bandwidth per voice
channel for G.711 and G.729a codecs, noting that 5% additional
bandwidth should be allowed for Real Time Control Protocol
(RTCP) packets.

- 17 -
G634:2013 COPYRIGHT
APRIL 2013
Bandwidth per Voice Calls with Standard IP Header
Codec G.711 G.729a
Codec Bit Rate 64 kbps 8 kbps
Voice Sample (ms) 10 20 30 10 20 30
IP Payload size (bytes) 80 160 240 10 20 30
IPv4 Packet size (40 byte header)
IPv6 Packet size (60 byte header)
120
140
200
220
280
300
50
70
60
80
70
90
Ethernet
Ethernet bytes IPv4
(per packet) IPv6
150
170
230
250
310
330
80
100
90
110
100
120
Ethernet bandwidth IPv4
per voice flow (kbps) IPv6
120
136
92
100
82.7
88
64
80
37
44
26.7
32
ATM Transport (ADSL/ADSL2+)
(Includes 6 bytes for PPP)
ATM bytes IPv4
(PPPoAAL5oATM) IPv6
159
212
265
265
371
371
106
106
106
106
106
159
ATM bandwidth per IPv4
voice flow (kbps) IPv6
127.2
169.6
106
106
98.93
98.93
84.8
84.8
42.4
42.4
28.27
42.4
TABLE 3
Bandwidth per voice calls with standard IP header
NOTES:
1. Layer 2 networks using VLAN tagging add 4 bytes per frame
(single tagged) or 8 bytes per frame (dual-tagged).
2. Bandwidth per voice calls when using wideband codecs
(e.g. AMR-WB or G.722.2) is for future study.
4.3 VoIP Packet Handling
4.3.1 CE should recognise VoIP packets with the recommended
markings (as outlined in G632), and should handle them
according to the priority defined by the implemented QoS
scheme.
4.3.2 Network equipment of the voice and access service provider(s)
should also recognise VoIP packets and give them priority
consistent with the QoS provided by the contract with the end-
user.
4.3.3 Where the network is aware that the QoS marking on a packet
received from either an end-user or from an interconnecting
network is inconsistent with the QoS contracted for by the owner
of the destination address, the packet in each direction will be
treated according to G632.

- 18 -
G634:2013 COPYRIGHT
APRIL 2013
4.4 VoIP Packet Routing
4.4.1 Category C (or better) voice services should be carried on
network paths meeting Class 0 as defined in G632. This will result
in a UNI to UNI packet delay of less than 100ms, and should result
in an end-to-end voice delay of less than 150ms.
4.4.2 Ideally, network equipment should route VoIP traffic by the path
providing the shortest end-to-end delay. More broadly, selecting
a path that meets the delay objective of IP traffic class is
required.
4.4.3 For calls that involve interconnection to the TDM network,
consideration should be given to ensuring a minimum end-to-end
delay. To help achieve this providers of VoIP Services should
minimise the use of Trombone Connections to distant points.
4.5 VoIP Packet Type and Priority
Protocols used for VoIP Services and therefore recommended to
be given priority include the following:
(a) RTP Media;
(b) RTCP packets; and
(c) voice signaling.
4.6 VoIP Codec Choice and Codec Negotiation
4.6.1 The codec choice should be made by providers of VoIP Services
in conjunction with overall network considerations that affect
conversational voice quality in VoIP networks (refer to
Appendix D, Quality of Experience (QoE) for a discussion on this
topic).
4.6.2 Different codecs result in different bit rates (which affect the
bandwidth required per call) and introduce different amounts of
distortion (which affects voice quality) through their intrinsic
compression process and their individual robustness to packet
loss.
4.6.3 Where possible, RFC 3264 should be used for codec negotiation
between end points.
4.6.4 To ensure interoperability it is recommended that G.711 (A-law)
be included as an available codec should other preferred
codecs not be available.
4.6.5 Packet loss concealment is recommended to be used in
conjunction with waveform codecs (e.g. with G.711).
4.7 VoIP Echo Control
4.7.1 Equipment for a VoIP Service should support the impedance
requirements in AS/CA S002 in order to achieve the objectives for
echo cancellation and sidetone.

- 19 -
G634:2013 COPYRIGHT
APRIL 2013
4.7.2 In general, VoIP networks have longer delays compared with
traditional PSTN networks. With increasing delay any level of
echo becomes increasingly audible.
4.7.3 For calls between an IP phone and a traditional PSTN phone, the
echo control applied in the traditional network may not be
sufficient. A crucial step in the engineering of the interface
between a TDM and a VoIP Service is echo control, which must
take account of the echo sources in the TDM side and the
additional delay introduced by the VoIP side.
NOTES:
1. The addition of a 2G mobile phone in place of a PSTN phone
as part of the transmission path increases the delay
(approximately 90 ms more in each direction).
2. Refer to Section 7.2 of G.108 (09/99) for further detail on echo
control.
4.7.4 TELR is the sum of losses around the loop as shown in Figure 1
below. TELR represents the level of a talker‘s speech that comes
back from an echo point in the network, often from the 2-wire to
4-wire hybrid in the far end line card.
4.7.5 The loss plan for an ―all digital‖ connection is determined by the
loudness ratings of the telephones — there are no additional
losses in the network.
FIGURE 1
Talker Echo Loudness Rating (TELR)
NOTES:
1. Appendix C shows the effect of TELR variation.
2. TCLw is the weighted terminal coupling loss.
4.7.6 Figure 2 shows how echo impairment depends on the level of
echo and delay.
TELR (side B) = SLR (side B) + Loss in bottom path + ERL or TCLw (side A) + Loss in top path + RLR (side B)

- 20 -
G634:2013 COPYRIGHT
APRIL 2013
Level of
Echo
TE
LR
(d
B)
One way delay
ms
Level of
Echo
TE
LR
(d
B)
One way delay
ms
FIGURE 2
Echo Level and one-way Delay
NOTES:
1. Figure 2 is based on ITU-T G.131.
2. Local = 100 Km, Short Haul = 2,800 Km, Long Haul = 5,000 Km,
International = 14,000 Km.
Proper location of an Echo Canceller (ECAN) in a VoIP network
4.7.7 An ECAN tracks the forward voice signal and the returning echo
and builds a filter matching the echo characteristics. The filter is
used to create a matching echo and is subtracted from the
returning signal to remove the echo.
4.7.8 The audibility of echo depends on the level of the echo signal
and on the delay imposed by the network; longer delay makes
the echo more apparent. Location of the ECAN requires proximity
to the far end to avoid the delay introduced by the packet
network.
4.7.9 ECAN coverage (tail length) requires special consideration for
coast to coast calls in Australia, including:
4.7.9.1 Optical signals travel at 5μs/km. Therefore, to cross
6000 km it would take (6000 x .005)ms, or 30ms. A round
trip would take 60ms.
4.7.9.2 Australian loss plan considerations for TDM should follow
Standards such as AS/CA S004, AS/CA S002 and AS/CA
S003 for loss plan analysis.
4.7.9.3 The VoIP-TDM gateway needs to consider echoes that
are not cancelled by the ECAN in the TDM network.
- 21 -
G634:2013 COPYRIGHT
APRIL 2013
These will be calls that have delays up to the point
where the TDM network puts cancellers on the trunks. As
long as ECANs are at the correct point in the VoIP
network, providers of VoIP Services will not need to worry
about delay from the VoIP cross-country trunks getting
into their tail circuit. Therefore, providers of VoIP Services
do not need to have tail coverage equivalent to the
delay across the country. They only need to have tail
coverage sufficient to address the delay up to the point
where the ECAN are added to TDM trunks. ACIF C519
states that ECANs must be employed when the round
trip delay exceeds 34ms (Refer to ACIF C519 clause
6.2.12).
4.7.9.4 If for some reason, the TDM cancellers are not sufficient
to remove echo to meet 65 dB TELR, then providers of
VoIP Services would need to cover a longer tail, but this
is not expected to be a common occurrence.
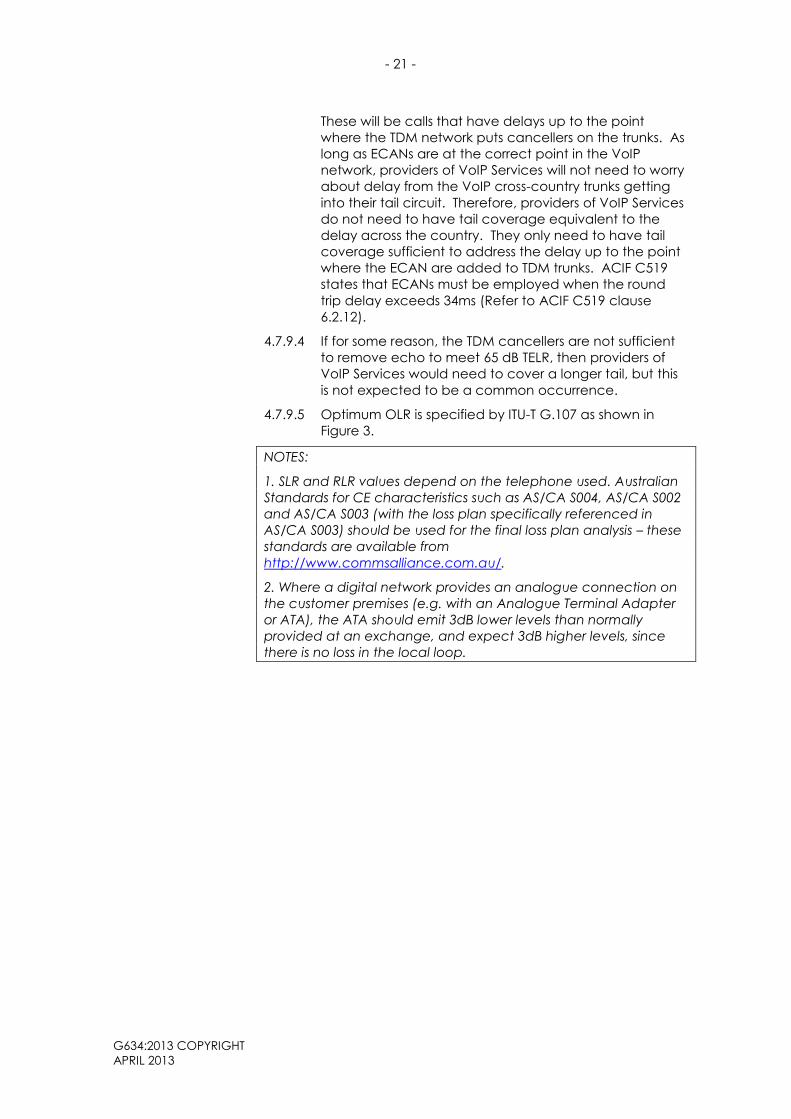
4.7.9.5 Optimum OLR is specified by ITU-T G.107 as shown in
Figure 3.
NOTES:
1. SLR and RLR values depend on the telephone used. Australian
Standards for CE characteristics such as AS/CA S004, AS/CA S002
and AS/CA S003 (with the loss plan specifically referenced in
AS/CA S003) should be used for the final loss plan analysis – these
standards are available from
http://www.commsalliance.com.au/.
2. Where a digital network provides an analogue connection on
the customer premises (e.g. with an Analogue Terminal Adapter
or ATA), the ATA should emit 3dB lower levels than normally
provided at an exchange, and expect 3dB higher levels, since
there is no loss in the local loop.

- 22 -
G634:2013 COPYRIGHT
APRIL 2013
E-Model Optimum OLR
(all other parameters at V19 default)
80
85
90
95
100
0 2 4 6 8 10 12 14 16 18 20
OLR (dB)
R-Value
ITU-T G.107 specifies the optimum at OLR = 10 dB
The “peak/optimum” OLR is at 7 dB, but this level could cause echo.
QuieterQuieterLouderLouder
OLR = SLR + Electrical Loss + RLR = 8 + 0 + 2 = 10 dB
FIGURE 3
Optimum Overall Loudness Rating
4.7.10 Engineering considerations affecting echo control on a VoIP
network need to be considered as a whole for the particular
network (and call scenario) in question. Take care when using
standards developed for PSTN networks (e.g. ITU-T G.168) as
overall echo control considerations for a VoIP network are not
totally addressed by these TDM standards.
4.8 VoIP Transcoding
4.8.1 Connecting to systems or endpoints that use a different codec
requires transcoding.
NOTE: Transcoding implies successive encoding of a digital signal
by different codecs. Each encoding degrades the quality, and
degradation from the successive encodings is cumulative. The
E-Model handles transcoding using an additive mode: i.e. the
impairment factor for each codec is added to the total
impairment for the call. The more codecs there are in succession,
the lower the final R. (Note that there is also additional delay with
transcoding, which is accounted for separately.)
The following example shows this for multiple codecs in a voice
path (packet loss is assumed to be < 10-3): where successive
encodings are made using Global System for Mobile - Enhanced
Full Rate (GSM EFR) (Ie=5), G.711 (Ie=0), and G.729 (Ie=11), the Ie
values add up to 16 (again, this does not take account of delay).
Transcoding successively by the same codec (separated by
G.711) is sometimes called Tandeming.

- 23 -
G634:2013 COPYRIGHT
APRIL 2013
4.8.2 For additional information on transcoding when interworking with
mobile networks and using wideband codecs refer to G.722.2
Section 10.All end points should support the G.711 (A-law) codec
as a fallback. This is to avoid transcoding (distortion) or the
situation where endpoints are unable to negotiate a mutually
agreeable codec (i.e. the call fails).
4.8.3 End-points should negotiate the codec to be used without
enforced transcoding occurring on call gateway(s) at a point of
interconnection.
4.8.4 Transcoding between G.711 and G.726 (32kbps) can occur
multiple times provided that the signal remains digital,
synchronous coding adjustment is used, with no data corruption
(packet loss, etc.).
Note: G.726 (32 kbps) is used on DECT handsets.
4.8.5 One should avoid transcoding between CELP codecs (e.g.
G.729) or between CELP and ADPCM (G.726/G.722) codecs.
4.8.6 One should count the number of compression codecs when
assessing transcoding.
4.8.7 One should reduce the occurrences of transcoding and
preferably eliminate them.
4.9 Other Components
4.9.1 Design considerations relating to the handling of fax tones from a
codec selection viewpoint, handling of modem tones and the
handling of DTMF tones are outside the scope of this guideline but
should be considered.
Number of Simultaneous Calls (Call Admission Control)
4.9.2 Providers of VoIP Services should consider monitoring the number
of simultaneous calls and take appropriate action according to
the type or quality of service subscribed to, as exceeding
available bandwidth will obviously result in a severely degraded
voice experience.
Post dial delay – parameter definition and value
4.9.3 Post-Dial delay for:
(a) Category C should meet the performance targets for fixed
lines in ACIF C519.
(b) Category B should meet the performance targets for
mobile services in ACIF C519.
(c) The ―Best Effort‖ category has no target value.
Voice Activity Detection (VAD)
4.9.4 The number of simultaneous calls sharing the available
bandwidth when VAD is in use should be sufficient to ensure the
probability of active speech on each call, to minimise dropped
packets due to overload e.g. less than 1%.

- 24 -
G634:2013 COPYRIGHT
APRIL 2013
NOTES:
1. VAD reduces bandwidth requirements for aggregate calls by
30–40% because only active speech is transmitted.
2. VAD is also known as silence suppression. When silence
suppression is used, typical clipping of 5–8 ms can be noticed due
to most gateway VAD implementations. It is often recommended
to turn on comfort noise when silence suppression is turned on at
the gateway.
3. Bandwidth required to support voice calls with silence
suppression depends primarily on the voice activity level, i.e. the
ratio of talk spurt/(talk spurt + silence), and the mix of voice calls
and voice band data. There are methods developed for
capacity engineering based on the central limit theorem (CLT) for
voice traffic with silence suppression capability. The CLT model
becomes progressively more accurate as the number of sources
increase. With voice activity level greater than 30% and the
number of voice sources exceeding about 700, it is suitable for
capacity engineering.
4. The clipping of the initial sound of the first word in a talk spurt
and the packet loss associated with simultaneous talking on the
large majority of calls can cause VAD to degrade the perceived
conversational voice quality.
Tradeoffs applicable to VoIP Services
4.9.5 Selection of an audio codec (waveform versus frame-based) is of
major importance. Factors affected by codec choice include:
NOTE: G.711 and G.726 are waveform codecs which directly
represent the analogue signal. Frame-based codecs (e.g., G.729
and AMR) parse the incoming signal into frames before encoding
it. Frame-based codecs commonly use Code Excited Linear
Prediction (CELP) compression.
(a) Delay: encoding of a waveform codecs is virtually
instantaneous while encoding of a frame codec can
introduce significant delay.
NOTE: A nominal estimate of the encoding delay of a codec is
two times the processing sample size (duration) plus the look
ahead, if any. The frame is the processing sample for a frame-
based codec.
(b) Voice Bandwidth: Wideband codecs such as AMR-WB
support voice frequencies from 50Hz-7kHz, which improves
speech clarity compared to narrowband codecs like
AMR-NB, G.711 and G.729, which support a bandwidth of
300Hz-3.3kHz.
(c) Data Bandwidth: frame codecs require less bandwidth.
NOTE: For instance, for 20 ms voice sample G.711 has an IP
packet size of 200 bytes while G.729 has an IP packet size of 60
bytes (both including 40 byte header) which over Ethernet
translates into 96.8 kbps versus 40.8 kbps respectively. Note that

- 25 -
G634:2013 COPYRIGHT
APRIL 2013
even though G.729 has an 8-to-1 compression ratio for the
speech data compared to G.711, for a 20-ms packet, the ratio is
about 2-to-1 once the packet headers and other overheads are
included.
(d) Distortion: the distortion added by waveform codecs is more
tolerable than that added by frame-based codecs.
(e) It is an advantage to use G.711 for conference and
emergency calls. G.726 and all ADPCM codecs are more
vulnerable to lost data than G.711.
(f) CELP codecs don‘t perform very well with non-speech signals
such as DTMF tones, EFTPOS machines, intruder alert systems,
health alert systems and music. It is recommended to switch
to G.711 for transmission of fax(es) when a CELP codec
(e.g. G.729 or AMR) is the main voice codec in use.
(g) Packet loss concealment and silence suppression: Some
codecs have these two characteristics built-in, while G.711
requires them added externally.
4.9.6 The effect of echo is covered in section 4.7.
4.9.7 Access Jitter can be seriously affected on low speed networks
(i.e. less than 10 Mbps). This is especially true on the end-user
access network‘s upstream which often has less bandwidth.
When data loading increases relative to voice, the probability of
a data packet being put onto the wire increases. Even where
voice packets are assigned priority over data packets, a voice
packet must wait until the serialization of the current data packet
is complete before it can be sent. The slower the link and the
larger the data packets, the more this possibility increases the
voice packet jitter.
NOTE: Jitter is a function of the loading of all the statistical
multiplexers a packet passes through (access, routers, switches,
gateways). When loading is unbounded (>90%) jitter is
unbounded, delay rises asymptotically and Voice Quality is
unpredictable/unstable.
4.9.8 The final goal when engineering a VoIP network is that such a
network can provide acceptable levels of Conversational Voice
Quality to end-users. When all E-Model factors are considered as
a whole, the transmission rating R determines the level of
Conversational Voice Quality that can be achieved. The level of
acceptability of the new service is determined by how well it
meets user expectations regarding perceived voice quality, given
their experience with traditional PSTN and wireless technologies.
NOTE: Research has determined that users cannot detect a
difference less than 3R and are likely to perceive a difference
greater than 7R. Therefore, the end-user acceptability of a new
VoIP Service can be quantified. Refer to Appendix D, Quality of
Experience (QoE).

- 26 -
G634:2013 COPYRIGHT
APRIL 2013
4.10 IP Network QoS Classes
4.10.1 G632 defines a number of IP Network QoS classes for network
level QoS on networks using IP.
NOTE: The IP network QoS classes and parameter values in G632
are consistent with those in ITU-T Recommendation Y.1541.
4.10.2 Network performance that meets IP Network QoS class 0 in G632
will help meet the recommended QoS for VoIP Services.

- 27 -
G634:2013 COPYRIGHT
APRIL 2013
5 REFERENCES
Publication Title
3GPP Specification
TS 06.60 Enhanced full rate speech transcoding
http://www.3gpp.org/ftp/Specs/html-info/0660.htm
TS 26.190 Speech codec speech processing functions;
Adaptive Multi-Rate - Wideband (AMR-WB) speech
codec; Transcoding functions
http://www.3gpp.org/ftp/Specs/html-info/26190.htm
TS 26.194 Speech codec speech processing functions;
Adaptive Multi-Rate - Wideband (AMR-WB) speech
codec; Voice Activity Detector (VAD)
http://www.3gpp.org/ftp/Specs/html-info/26194.htm
Australian Standards
AS/CA S002:2010 Analogue interworking and non-interference
requirements for Customer Equipment for connection
to the PSTN
http://commsalliance.com.au/Documents/all/Standa
rds/s002
AS/CA S003:2010 Customer Access Equipment for connection to a
Telecommunications Network
http://commsalliance.com.au/Documents/all/Standa
rds
AS/CA S004:2013 Voice frequency performance requirements for
Customer Equipment
http://commsalliance.com.au/Documents/all/Standa
rds/s004
IETF RFCs
RFC 791 Internet Protocol
http://tools.ietf.org/html/rfc791
RFC 3264 An Offer/Answer Model with the Session Description
Protocol (SDP)
http://tools.ietf.org/html/rfc3264
ITU-T Recommendations
E.800 (09/2008) Definitions of terms related to quality of service
http://www.itu.int/ITU-
T/recommendations/rec.aspx?rec=9524

- 28 -
G634:2013 COPYRIGHT
APRIL 2013
G.107 (12/2011) The E-model, a computational model for use in
transmission planning
http://www.itu.int/ITU-
T/recommendations/rec.aspx?rec=11460
G.107.1 (12/2011) Wideband E-model
http://www.itu.int/ITU-
T/recommendations/rec.aspx?rec=11453
G.108 (09/1999) Application of the E-model: A planning guide
http://www.itu.int/ITU-
T/recommendations/rec.aspx?rec=4753
G.108.1 (05/2000) Guidance for assessing conversational speech
transmission quality effects not covered by the
E-Model
http://www.itu.int/ITU-
T/recommendations/rec.aspx?rec=5082
G.108.2 (03/2007) Transmission planning aspects of echo cancellers
http://www.itu.int/ITU-
T/recommendations/rec.aspx?rec=9062
G.109 (09/1999) Definition of categories of speech transmission quality
http://www.itu.int/ITU-
T/recommendations/rec.aspx?rec=4754
G.113 (11/2007) Transmission impairments due to speech processing
http://www.itu.int/ITU-
T/recommendations/rec.aspx?rec=9273
G.113 (2007) Amd.1
(03/2009)
Transmission impairments due to speech processing
Amendment 1: Revised Appendix I – Provisional
planning values for the wideband equipment
impairment factor and the wideband packet-loss
robustness factor
http://www.itu.int/ITU-
T/recommendations/rec.aspx?rec=9273
G.114 (05/2003) One-way transmission time
http://www.itu.int/ITU-
T/recommendations/rec.aspx?rec=6254
G.121 (03/1993) Loudness ratings (LRs) of national systems
http://www.itu.int/ITU-
T/recommendations/rec.aspx?rec=764
G.131 (11/2003) Talker echo and its control
http://www.itu.int/ITU-
T/recommendations/rec.aspx?rec=7037
- 29 -
G634:2013 COPYRIGHT
APRIL 2013
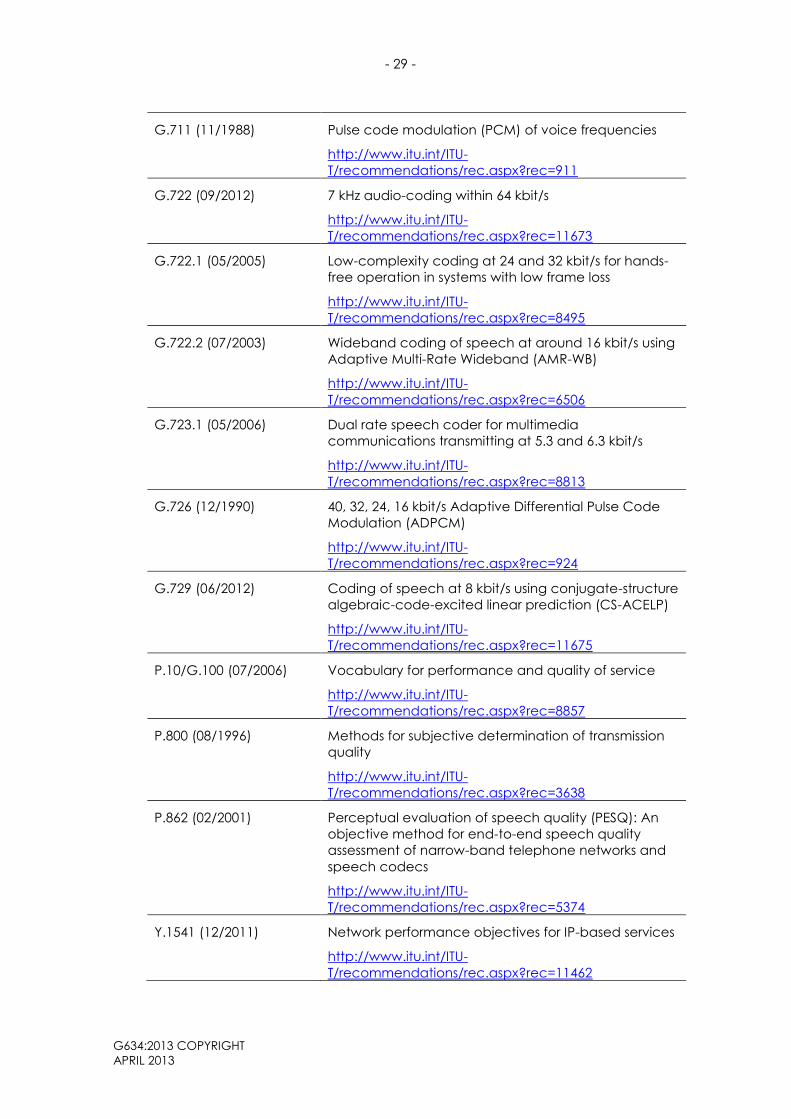
G.711 (11/1988) Pulse code modulation (PCM) of voice frequencies
http://www.itu.int/ITU-
T/recommendations/rec.aspx?rec=911
G.722 (09/2012) 7 kHz audio-coding within 64 kbit/s
http://www.itu.int/ITU-
T/recommendations/rec.aspx?rec=11673
G.722.1 (05/2005) Low-complexity coding at 24 and 32 kbit/s for hands-
free operation in systems with low frame loss
http://www.itu.int/ITU-
T/recommendations/rec.aspx?rec=8495
G.722.2 (07/2003) Wideband coding of speech at around 16 kbit/s using
Adaptive Multi-Rate Wideband (AMR-WB)
http://www.itu.int/ITU-
T/recommendations/rec.aspx?rec=6506
G.723.1 (05/2006) Dual rate speech coder for multimedia
communications transmitting at 5.3 and 6.3 kbit/s
http://www.itu.int/ITU-
T/recommendations/rec.aspx?rec=8813
G.726 (12/1990) 40, 32, 24, 16 kbit/s Adaptive Differential Pulse Code
Modulation (ADPCM)
http://www.itu.int/ITU-
T/recommendations/rec.aspx?rec=924
G.729 (06/2012) Coding of speech at 8 kbit/s using conjugate-structure
algebraic-code-excited linear prediction (CS-ACELP)
http://www.itu.int/ITU-
T/recommendations/rec.aspx?rec=11675
P.10/G.100 (07/2006) Vocabulary for performance and quality of service
http://www.itu.int/ITU-
T/recommendations/rec.aspx?rec=8857
P.800 (08/1996) Methods for subjective determination of transmission
quality
http://www.itu.int/ITU-
T/recommendations/rec.aspx?rec=3638
P.862 (02/2001) Perceptual evaluation of speech quality (PESQ): An
objective method for end-to-end speech quality
assessment of narrow-band telephone networks and
speech codecs
http://www.itu.int/ITU-
T/recommendations/rec.aspx?rec=5374
Y.1541 (12/2011) Network performance objectives for IP-based services
http://www.itu.int/ITU-
T/recommendations/rec.aspx?rec=11462

- 30 -
G634:2013 COPYRIGHT
APRIL 2013
Industry Guidelines
G632:2012 Quality of Service parameters for networks using the
Internet Protocol Guideline
http://commsalliance.com.au/Documents/all/guideli
nes/g632
G635:2013 Testing Arrangements for Quality of Service
parameters for Voice over Internet Protocol (VoIP)
services
http://commsalliance.com.au/Documents/all/guideli
nes/g635
Industry Code
ACIF C519:2004 End-To-End Network Performance
http://commsalliance.com.au/Documents/all/codes/
c519
TIA Publications
TSB-116-A Telecommunications, IP Telephony Equipment, Voice
Quality Recommendations for IP Telephony
http://global.ihs.com/doc_detail.cfm?document_na
me=TIA%20TSB-116&item_s_key=00381377

- 31 -
G634:2013 COPYRIGHT
APRIL 2013
APPENDIX A – VARIOUS SCENARIOS FOR VOICE SERVICES
A1 Single Carrier
A.1.1 IP Access and Core networks
This scenario represents calls within a managed VoIP Service, where the
originating and terminating legs exist entirely within Carrier X‘s network
domain (see Figure 4). In this case Carrier X manages the voice and IP
network service. In this scenario the call signaling and media is carried as
IP on an end-to-end basis. The call could be delivered via DSL, HFC, fibre
or some other access network technology. Impacts on speech quality are
primarily the end-to-end IP network characteristics, the CE characteristics
and the choice of codec.
In this case end-to-end delay will usually be higher than the analogue
case, particularly if the ―last mile‖ is a lower-speed portion of the network
(as can often be the case in the upstream direction). This can easily add
20-40ms of delay to the call (or more if using wireless CE).
To provide a high quality voice service:
(a) the CE must be able to identify voice packets, and give them an
appropriate priority when sending them to Carrier X‘s network;
(b) Carrier X must identify the voice packets and treat them with the
correct priority. To be considered ―voice-grade‖, Carrier X must be
able to meet criteria for delay and packet loss in the ―last mile‖.
NOTE: This also applies to a Customer LAN segment of the
network.
Acoustic echo cancellation is handled within the VoIP CE and is not
required within the network.
FIGURE 4
IP in Core and Access networks
A.1.2 TDM access and core, IP access network
This scenario covers the case where both TDM and IP segments are used,
with an intervening TDM-IP voice gateway (see Figure 5). Speech quality
impairments due to the packet CE, access and core networks are given
the same considerations as in the example in A.1.1.
In this scenario additional end-to-end delay is incurred due to the addition
of the TDM network component (typically small) and speech transcoding
required at the TDM-IP gateway. For optimum performance the same
codec should be used for interconnected networks (refer to Section 4.8).
“A” Party
“B” Party
Carrier X
Packet

- 32 -
G634:2013 COPYRIGHT
APRIL 2013
For an indication of performance characteristics expected of PSTN
services refer to ACIF C519.
Cancellation of network echo heard by the B party caused by reflections
of B-Party speech at the A-Party PSTN 2-4 wire hybrid should take place at
the packet-TDM gateway (refer to Section 4.7). Acoustic echo at the B
party handset should be dealt with within that handset.
FIGURE 5
TDM Access and Core, IP in access network
A2 Two Carriers
A.2.1 TDM access and core, IP core and access
This scenario is similar to the example in A.1.2 from a functional
perspective, with the exception that a TDM interconnect is used between
Carrier Y and Carrier X for termination of calls to the PSTN (see Figure 6).
The goals are to minimise the risk of transcoding, minimise delay and the
potential for trombone trunking. For packet origination, it is
recommended to support the carriage of voice as packet as far as
possible. TDM originated calls are governed by regulation on where one
can interconnect.
FIGURE 6
TDM access and core, IP core and access
A.2.2 TDM Access & IP Core, IP Access
This scenario is also functionally similar to the examples in A.1.2 and A.2.1,
in that a single TDM-IP conversion is required. In this case, however,
Carrier X offers a voice service to both the A party and B party (see
Figure 7). The primary difference is that Carrier Y offers a packet layer
access service to Carrier X, to enable delivery of service to the B party.
In this case, there is a packet interconnect (typically IP) required between
Carrier X‘s network and the ―B‖ party CE.
“A” Party
“B” Party
Carrier X
PSTN/TDM
“A” Party “B” Party Carrier X
Packet PSTN/TDM
Carrier Y
Voice/TDM POI
TDM - IP
Packet

- 33 -
G634:2013 COPYRIGHT
APRIL 2013
In order to predict impairments and end-to-end speech quality, the end-
to-end packet layer characteristics must be known i.e. for the packet
segment spanning Carrier X, Carrier Y and the B party‘s local network.
FIGURE 7
TDM Access & IP Core, IP Access
A.2.3 IP Access & IP Core, L2 Access
This scenario represents a competitive target architecture, where any
carrier can provide a VoIP service to any party, with packet transmission
from end to end.
One or more of the carriers may optionally use a L2 access network for the
final connection to the party, such as the NBN.
In this case, there is a packet interconnect (typically IP) required between
Carrier X‘s network and Carrier ―Y‖, and a Layer 2 interconnect between
Carrier ―Y‖ and the ―Z‖ Carrier Access network.
In order to predict impairments and end-to-end speech quality, the end-
to-end packet layer characteristics must be known i.e. for the packet
segment spanning Carrier X, Carrier Y and Carrier Z.
FIGURE 8
TDM Access, IP Core, L2 Access
“A” Party “B” Party Carrier X
(Voice Service)
L2
Access
Carrier Y (IP Core)
Packet
Packet/L2POI
Packet
Packet/IP POI
“A” Party “B” Party Carrier X
(Voice Service & IP Core)
Packet PSTN/TDM
Carrier Y
(IP access)
Packet
Packet/IP POI
TDM - IP
Carrier Z
(L2 access)

- 34 -
G634:2013 COPYRIGHT
APRIL 2013
A3 Three Carriers
A.3.1 IP Access, TDM Core, IP Access
FIGURE 9
IP access, TDM Core, IP Access
In this scenario packet access is used by both the A party and B party,
with TDM interconnection (see Figure 9). To ensure acceptable end-to-
end speech quality careful consideration must be given to packet
network delays, access bandwidth and voice codecs. In this case total
network delay could severely impact speech quality. It is particularly
important to ensure sufficient points of interconnect are used, thus
minimising the effects of network tromboning. Given sufficient access
bandwidth, optimal performance will also be achieved if both the A-party
and B-party use G.711 codecs.
Where the A- and/or B-parties do not use G.711 codecs then providers of
VoIP Service should minimise the use of this scenario with a TDM
interconnect between service providers because of the impact of
transcoding on voice quality.
This IP-TDM-IP scenario increases end-to-end delays, and has several points
where various tones must be detected and acted upon asynchronously.
A packet based interconnect is preferred ahead of an IP-TDM-IP scenario.
“A” Party “B” Party
Carrier Y
Packet PSTN/TDM
Carrier Z
Packet
TDM POI
TDM POI
Carrier X
TDM - IP
TDM - IP
- 35 -
G634:2013 COPYRIGHT
APRIL 2013
APPENDIX B – CODEC CHARACTERISTICS
B
B1 Codec characteristics and selection
B.1.1 Various codecs differ along the multiple characteristics including:
(a) access link speed required and traffic generated (as it affects call
charges);
(b) baseline voice distortion;
(c) delay;
(d) immunity to packet loss; and
(e) immunity to transcoding.
Most of these factors are captured in the transmission rating factor R for
the service.
B.1.2 Codecs should be selected to meet the target service category (refer
to ITU-T G.114, Table I.4 for typical performance of some codecs).

- 36 -
G634:2013 COPYRIGHT
APRIL 2013
APPENDIX C – PERFORMANCE VALUES BASED ON TRANSMISSION
RATING FACTOR R
C
C1 Introduction
The sections in this Appendix are presented as relevant information when
determining performance values based on the transmission rating factor R.
Readers are encouraged to consult the complete referenced ITU-T
Recommendations (see Section 5 for the list of References).
The earlier G.107 model supports narrowband codecs, while the more
recent G.107.1 supports wideband codecs. They use a similar method,
and the resulting value R can be compared on a common scale;
Narrowband codecs score 0-93, while wideband codecs score 0-129.
The major difference for the end user is that the Ie parameter for
narrowband codecs should be used on the narrowband model, and the
Ie for wideband codecs should be used on the wideband model.
C2 ITU-T Recommendation G.107 - The E-Model, a
computational model for use in transmission planning.
C.2.1 Section 3.1:
The transmission rating factor R is calculated as:
R = Ro – Is – Id – Ie-eff + A
Where:
(a) Ro represents the basic signal-to-noise ratio including noise sources
such as circuit noise and room noise;
(b) Is is a combination of all impairments which occur more or less
simultaneously with the voice signal;
(c) Id represents the impairments caused by delay;
(d) Ie-eff represents impairments caused by low bit rate codecs and
includes impairment due to packet losses of random distribution;
and
NOTE: Values of Ie-eff for different codecs are presented in
Appendix B, Codec Characteristics. Also refer to G.113
Amendment 2 for provisional planning values for the equipment
impairment factor Ie.
(e) A represents the advantage factor, which allows for compensation
of impairment factors when there are other advantages of access
to the user. Provisional examples for A are given in Table 3 in
section 3.6 of G.107.
NOTE: One should measure and report the objective call quality
without the A value.
C.2.2 Table 2 in section 3.7 of G.107 presents default values for input
parameters of the E-Model.

- 37 -
G634:2013 COPYRIGHT
APRIL 2013
C.2.3 Guidance for interpreting calculated R factors for planning purposes is
given in Annex B of G.107.
C3 ITU-T Recommendation G.109 (09/99) – Definition of
categories of speech transmission quality
C.3.1 Section 5 of ITU-T G.109, Definition of categories of speech transmission
quality
This section provides the following table which gives definitions of the
categories of speech transmission quality in terms of ranges of
transmission rating factor R:
R-value range Speech transmission
quality category User satisfaction
90 R < 100 Best Very satisfied
80 R < 90 High Satisfied
70 R < 80 Medium Some users dissatisfied
60 R < 70 Low Many users dissatisfied
50 R < 60 Poor Nearly all users dissatisfied
NOTE 1 – Connections with R-values below 50 are not recommended.
NOTE 2 – Although the trend in transmission planning is to use R-values, equations to convert
R-values into other metrics e.g. MOS, %GoB, %PoW, can be found in Annex B/G.107.
C.3.2 Section 6 of ITU-T G.109, ―Examples of speech transmission quality
provided in typical scenarios‖
This section provides the following estimates of R values for a number of
service/network scenarios in Table 2 of G.109:
Service/network scenario R-value Deviations from
Table 3/G.107
ISDN subscriber to ISDN subscriber, local connection 94 Note 1
Analogue PSTN subscriber to analogue PSTN subscriber,
20 ms delay (average echo path losses; no active echo
control)
82 Note 2
Mobile subscriber to analogue PSTN subscriber as
perceived at mobile side
72 Note 3
Mobile subscriber to analogue PSTN subscriber as
perceived at PSTN side
64 Note 4
Voice over IP connection using G.729a + VAD with 2%
packet loss
55 Note 5
NOTE 1 – No deviations.
NOTE 2 – TELR = 35 dB, WEPL = 50 dB, T = 20 ms, Tr = 40 ms, Ta = 20 ms.
NOTE 3 – TELR = 68 dB, WEPL = 101 dB (ECAN with ERLE = 33 dB assumed), T = 110 ms,
Tr = 220 ms, Ta = 110 ms, Ie = 20.
NOTE 4 – TELR = 53 dB, WEPL = 101 dB (ECAN with ERLE = 33 dB assumed), T = 110 ms,
Tr = 220 ms, Ta = 110 ms, Ie = 20.
NOTE 5 – T = 300 ms, Tr = 600 ms, Ta = 300 ms, Ie = 19.

- 38 -
G634:2013 COPYRIGHT
APRIL 2013
C4 ITU-T Recommendation G.114 – One-way transmission
time
C.4.1 Section 4 of ITU-T G.114 states:
(a) Regardless of the type of application, it is recommended to not
exceed a one-way delay of 400 ms for general network planning.
(b) It is desirable to keep the delays seen by user applications as low
as possible. The E model should be used to estimate the effect of
one-way delay (including all delay sources, i.e., "mouth to ear") on
speech transmission quality for conversational speech.
(c) Although a few applications may be slightly affected by end-to-
end (i.e., "mouth to ear" in the case of speech) delays of less than
150 ms, if delays can be kept below this figure, most applications,
both speech and non-speech, will experience essentially
transparent interactivity.
(d) While delays above 400 ms are unacceptable for general network
planning purposes, it is recognized that in some exceptional cases
this limit will be exceeded. An example of such an exception is an
unavoidable double satellite hop for a hard to reach location, the
impact of which can be estimated by use of the advantage factor
in the E-model.
(e) Regarding the use of the E-model for speech applications, the
effect of delay can be seen in the following graph of Transmission
Rating, R, versus delay (see Figure 10 below, or Figure 1 in G.114).
Also shown are the speech quality categories of ITU-T Rec. G.109,
which translate the R values to levels of user acceptance.

- 39 -
G634:2013 COPYRIGHT
APRIL 2013
G.114_F010 100 200 300 400 50050
60
70
80
90
100
Nearly all
users
dissatisfied
Many users
dissatisfied
Some users
dissatisfied
Users
satisfied
Users
very satisfied
Mouth-to-ear-delay/ms
E-m
od
el r
atin
g R
FIGURE 10
Impact of mouth to ear delay on R value
NOTES:
1. The curve in Figure 10 above is based on the effect of pure
delay only, i.e., in the complete absence of any echo. This is
calculated by setting the ITU-T G.107 E-model parameter Ta equal
to the total value of one-way delay from mouth to ear, with all
other E-model input parameter values set to their default values.
The effect of echo, as would be incurred due to imperfect echo
control, will result in lower speech quality for a given value of
one-way delay.
2. The calculation also assumes a narrowband Equipment
Impairment factor (Ie) of zero. Non-zero values, as would be
incurred due to speech coding/processing, will result in lower
speech quality for a given value of one-way delay, while a
wideband codec will produce higher scores for the same delay.
3. For one-way delay values exceeding 500 ms, the graph is
continued as a dashed line to indicate that these results are not
fully validated, but is the best estimate of what should be
expected and therefore provides useful guidance.

- 40 -
G634:2013 COPYRIGHT
APRIL 2013
C5 Graphical representation of relationship between R and
delay
The following diagrams are a useful way to illustrate variation of R with
delay for several cases as shown below.
C.5.1 E-Model reference curve
Figure 10 shows the E-Model reference curve for G.711 codec and
TELR = 65dB (which is effectively echo-free).
50
60
70
80
90
100
0 100 200 300 400 500
One-way Delay (ms)
R TELR = 65 dB
Exceptional
limiting case
Very
satisfactory
Satisfactory
Some users
dissatisfied
Many users
dissatisfied
User Satisfaction
Increasing
Distortion
Increasing
Delay
or Default
or G.711
or Ie = 0
or Best
Possible
Performance
50
60
70
80
90
100
0 100 200 300 400 500
One-way Delay (ms)
R TELR = 65 dB
Exceptional
limiting case
Very
satisfactory
Satisfactory
Some users
dissatisfied
Many users
dissatisfied
User Satisfaction
Increasing
Distortion
Increasing
Delay
or Default
or G.711
or Ie = 0
or Best
Possible
Performance
FIGURE 11
ITU-T G.107 Default Delay Impairment

- 41 -
G634:2013 COPYRIGHT
APRIL 2013
C.5.2 Effect of Increasing Echo
Figure 12 shows the effect of Increasing Echo.
NOTE: The TELR value is also a function of the receivers used, and
thus echo characteristics of the phones used also need to be
considered for transmission planning purposes. For more
information on TELR refer to ITU-T Recommendations G.131, G.108,
G.108.1 and G.108.2.
50
60
70
80
90
100
0 100 200 300 400 500
One-way Delay (ms)
R
TELR = 65 dB
TELR = 60 dB
TELR = 55 dB
TELR = 50 dB
TELR = 45 dB
Exceptional
limiting case
Very
satisfactory
Satisfactory
Some users
dissatisfied
Many users
dissatisfied
User Satisfaction
Increasing
Echo
E-Model referenceE-Model reference
This means that
TELR needs to be
about 65dB to
completely remove
echo
FIGURE 12
E-Model, Echo Impairment
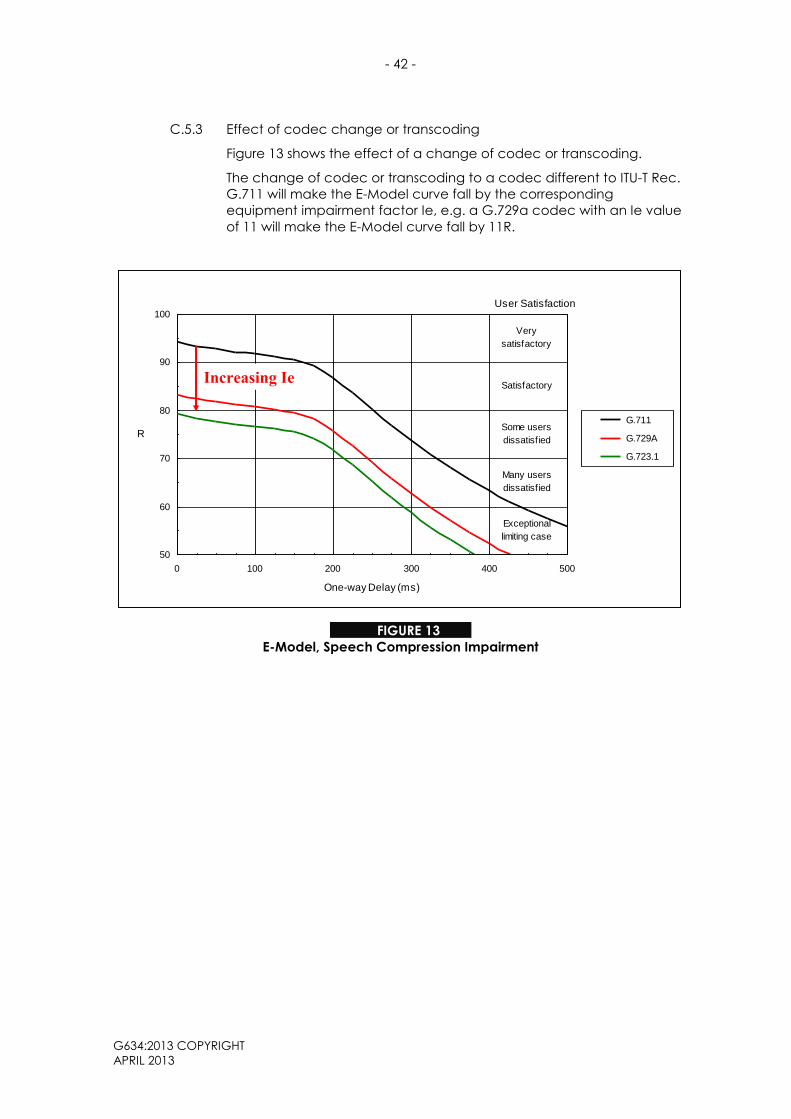
- 42 -
G634:2013 COPYRIGHT
APRIL 2013
C.5.3 Effect of codec change or transcoding
Figure 13 shows the effect of a change of codec or transcoding.
The change of codec or transcoding to a codec different to ITU-T Rec.
G.711 will make the E-Model curve fall by the corresponding
equipment impairment factor Ie, e.g. a G.729a codec with an Ie value
of 11 will make the E-Model curve fall by 11R.
50
60
70
80
90
100
0 100 200 300 400 500
One-way Delay (ms)
R
G.711
G.729A
G.723.1
Exceptional
limiting case
Very
satisfactory
Satisfactory
Some users
dissatisfied
Many users
dissatisfied
User Satisfaction
Increasing Ie
50
60
70
80
90
100
0 100 200 300 400 500
One-way Delay (ms)
R
G.711
G.729A
G.723.1
Exceptional
limiting case
Very
satisfactory
Satisfactory
Some users
dissatisfied
Many users
dissatisfied
User Satisfaction
Increasing Ie
FIGURE 13
E-Model, Speech Compression Impairment
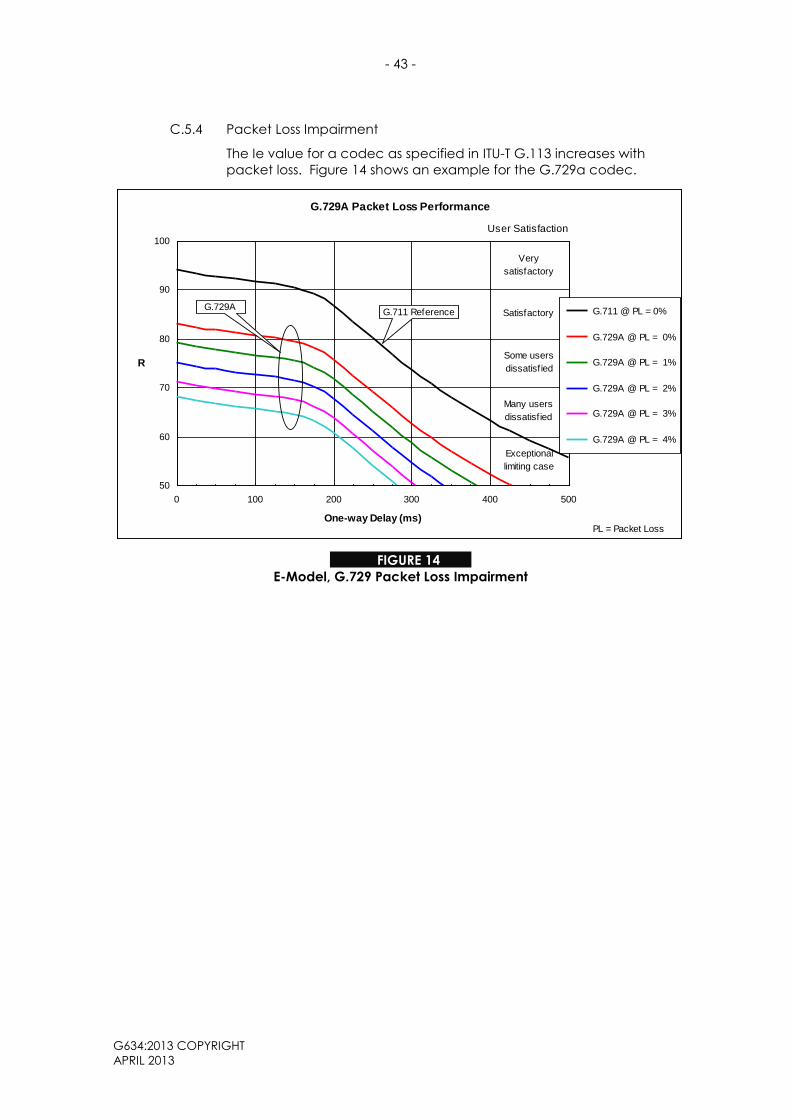
- 43 -
G634:2013 COPYRIGHT
APRIL 2013
C.5.4 Packet Loss Impairment
The Ie value for a codec as specified in ITU-T G.113 increases with
packet loss. Figure 14 shows an example for the G.729a codec.
G.729A Packet Loss Performance
50
60
70
80
90
100
0 100 200 300 400 500
One-way Delay (ms)
R
G.711 @ PL = 0%
G.729A @ PL = 0%
G.729A @ PL = 1%
G.729A @ PL = 2%
G.729A @ PL = 3%
G.729A @ PL = 4%
Exceptional
limiting case
Very
satisfactory
Satisfactory
Some users
dissatisfied
Many users
dissatisfied
User Satisfaction
PL = Packet Loss
G.729AG.711 Reference
FIGURE 14
E-Model, G.729 Packet Loss Impairment

- 44 -
G634:2013 COPYRIGHT
APRIL 2013
APPENDIX D - QUALITY OF EXPERIENCE (QoE)
D
D1 Introduction
D.1.1 QoE refers to the quality of a device, system, or service from the user‘s
point of view. Other terms for similar and related concepts include user
performance, human factors, user engineering, user interface design,
Human-Computer Interface (HCI), and Man-Machine Interface (MMI).
D.1.2 QoE is associated with all technology used by humans to reduce work,
solve problems, or reach goals. Voice telephony is a good example to
explore QoE, since QoE of telephones has been well-studied and used to
guide network and equipment design for decades. QoE shows up in
telephony through:
(a) Efficiency: modern telecommunication services make it fast and
easy to talk to someone.
(b) Ease of Use: the telephone dialpad is a simple user interface: a
number sequence is pressed to set up the call, call progress tones
tell the caller what is happening as call setup completes, the
phone rings, the called party picks up the handset and talks.
(c) Transparency: How well does a telephone call approximate a
face-to face conversation? The voice should have a good
listening level without distortion or noise. Delay should be short
enough, and there should be no echo or other annoying artifacts.
Any impairments will annoy the user or will require that the user
adapt to them. The better the ―virtual reality‖ of the phone
channel, the more the user can forget or ignore that the
conversation is taking place on the phone.
D.1.3 The effectiveness of a device or system in addressing the user‘s needs and
constraints determines its QoE.
D2 What is QoE?
D.2.1 Quality of Experience (QoE) is the user‘s perception of the performance of
a device, a service, or an application. User perception of quality is a
fundamental determinant of acceptability and performance for any
service platform. The design and engineering of telecommunications
networks must address the perceptual, physical, and cognitive abilities of
the humans that will use them; otherwise, the performance of any service
or application that runs on the network is likely to be unacceptable.
NOTE:
1. Without proper understanding of user requirements, there is a
risk of both under-engineering, where the network fails to meet
the needs of the users, and over-engineering, where the
specifications go beyond the user‘s needs, needlessly driving up
the cost to provide the device or service.
2. Figure 14 below illustrates some of the factors that influence the
QoE of a service, application, or device.

- 45 -
G634:2013 COPYRIGHT
APRIL 2013
D.2.2 Successful design requires a thorough understanding of the needs and
constraints of the eventual users of the system. QoE is best understood on
the system level, since system characteristics and usage factors may
interact, and this may be missed in subsystem-level analysis. For
telecommunications networks, this means understanding the end-to-end
performance.
D.2.3 QoE directly affects the bottom line. If service QoE is poor, the service
provider may lose revenue or customers. When a conversation is impaired
by excessive packet loss or delay, when an application is slow, or when an
e-mail arrives late because the network was congested, communication
effectiveness goes down. This affects the user‘s efficiency, and may push
his costs up.
D.2.4 In telecommunications usage, the older term Quality of Service (QoS) has
broadened in meaning and is now used to refer to the mechanisms
intended to improve or streamline the movement of packets through the
network (as in ―Is QoS enabled on that network?‖). In the past, the same
term referred both to the intention (enabling mechanisms used to help
ensure good service quality) and the outcome (the user‘s perception of
the service quality), and described the user‘s perception of quality. We
now use the term QoE for the user‘s perception of quality to eliminate any
confusion.
D.2.5 Examples of user tasks or goals in the telecommunications realm include
making an appointment (e.g. voice call), finding out when a movie is
playing (e.g. internet browsing), or obtaining an item from an online
retailer (e.g. e-commerce). When a user needs to spend attention and
effort to manage the medium (e.g. accommodate complex setup,
unstable session, signal distortion or artifacts, delay or other impairment),
the task becomes more difficult to complete, and QoE is reduced. Each
application will have its own combination of parameters to determine the
QoE. Parameter values leading to acceptable or optimal performance
may also be specific to the application.
D.2.6 Engineering for QoE is most effective when it is undertaken at the
beginning of the design process. Overall requirements are determined
from user needs for the target applications. Other factors such as the total
number of users to be supported and the different applications that will
run on the network are also taken into account. Requirements for
individual network components are derived from the overall requirements.
In some cases, it will be necessary to trade-off between factors. For
example, the use of encryption may improve the user‘s feeling of security
and privacy but can also increase delay and, therefore, reduce
responsiveness. Guidelines for deployment options address the QoE
implications of various choices. The user interface associated with the
network management system and the effectiveness of quality monitoring
features will also be improved by attention to QoE factors.

- 46 -
G634:2013 COPYRIGHT
APRIL 2013
FIGURE 15
Some of the factors influencing the QoE of a service, application, or device
D.2.7 Efforts are more successful where QoE is an integral part of the design
process. Retrofitting to improve low QoE is likely to be difficult, expensive,
or inadequate, e.g. external ECANs are more expensive than integrated
echo control. Tweaking the network to reduce delay may achieve some
minor improvement, but many sources of delay will be hard-coded and
therefore inaccessible to tuning. What does this mean for buyers of real-
time converged networks? Vendors whose performance targets are
derived from a comprehensive set of QoE parameters, and whose design
intent begins with these targets are likely to achieve better overall QoE.
Vendor selection criteria should include the vendor‘s attention to QoE, as
well as system reliability and cost.
D3 Measuring QoE
D.3.1 Aside from the obvious grossly malfunctioning cases and user complaints,
how can we determine the level of QoE our network or service provides?
Quality of Experience is a subjective quantity and can be measured
directly using behavioural science techniques. QoE can be measured in a
laboratory setting or in the field, through user ratings, surveys, or
observation of user behaviour. Specific techniques include user quality
ratings of an application or service, performance measurement, such as
the time taken to complete a task, or tabulation of service-related
information, such as subscriber complaint rates or frequency of
abandoned calls. A familiar QoE metric is subjective MOS.
D.3.2 In the previous section, we emphasize that the outcome is best where
design and development proceeds using performance targets based on
QoE. The performance targets, however, should not be expressed in terms
- 47 -
G634:2013 COPYRIGHT
APRIL 2013
of QoE metrics. This may seem counter-intuitive, given the previous
discussion about QoE. Not only are subjective metrics more time-
consuming and expensive to measure, they cannot always be translated
into engineering characteristics. In concrete terms, if the specification
was given as MOS, and verification testing showed that the performance
was below target, how would we know what to fix?
D.3.3 Instead, we need to identify objectively measurable correlates of QoE,
and determine the target for each. This approach facilitates design
engineering, verification, and troubleshooting in the field, as well as
providing customers with measurable performance targets the vendor will
stand behind.
D.3.4 Objective parameters that contribute to QoE include:
(a) physical properties of the end device (such as size, weight, fit,
button placement);
(b) timing and logic of system operation (such as feedback on
progress of a hidden operation, how long the user must wait before
going on to the next step, number of steps needed to complete a
task);
(c) network characteristics (availability, call setup time, data loss [e.g.
bit errors or missing packets], end-to-end delay/response time);
and
(d) network / account administration (availability of user support,
billing accuracy).
D.3.5 There are a few cases where two or more parameters interact, making it
difficult to assess the QoE impact of one parameter individually. In most
cases, the parameters can be separated into sensible domains. This
allows the network characteristics to be considered separately from the
physical properties of the end device.
D.3.6 Service pricing is not a component of QoE. A service that performs poorly
remains poor even when it is free. Nevertheless, pricing remains a factor in
a customer‘s decision whether to tolerate poor QoE or to complain about
a problem.
D.3.7 The QoE results determine the range of allowable variation in each
parameter that matches the perceptual and cognitive abilities of the user.
The relationship between the range of variation and the acceptability of
the performance allows us to define targets and tolerances for each
parameter. When all parameters and their targets are properly identified,
and a device is properly engineered to meet them, the resulting device
will have high QoE.
D4 Quantifying QoE parameters
D.4.1 As noted previously, we need to relate subjectively measured QoE to a set
of objective parameters, and determine the target for each parameter.
D.4.2 The particular values of QoE parameters determine or influence:
(a) the user's rating of service quality; or
(b) his/her performance on some relevant aspect of the service.

- 48 -
G634:2013 COPYRIGHT
APRIL 2013
D.4.3 Subjective evaluation is done to quantify the relationship between the
overall QoE and the objective parameters we believe determine the QoE.
We vary the physical parameter (e.g. the resolution of a video image) and
examine how the user's quality rating changes.
D.4.4 Figure 15 shows a hypothetical relationship of a generic parameter to
some QoE measure. As our hypothetical parameter increases (x-axis), the
subjective rating also increases (y-axis). The shape shown is common for
QoE parameters, where the user rating bottoms out at the low end and
tops out at the high end (so-called ―floor‖ and ―ceiling‖ effects). Other
shapes are possible.
D.4.5 The positioning of the unacceptable, acceptable, and premium quality
areas depends on another subjective measure, acceptability. Depending
on human perceptual factors, user expectation, etc., the boundaries
between the coloured regions can shift.
FIGURE 16
QoE variation as function of a variable

- 49 -
G634:2013 COPYRIGHT
APRIL 2013
PARTICIPANTS
The Working Committee that developed the original Guideline in 2007 consisted of the
following organisations and their representatives:
Organisation Membership Representative
ACCC Non-Voting Rowan Groves
AAPT Voting Peter Crosby
AAPT / PowerTel Non-Voting Peter Kohlmayer
ACMA Non-Voting Noel Buchanan
Alcatel-Lucent Voting Evan Stanbury
Cisco Systems Voting Kim Yan
Nortel Voting Julio Cadena
Pacific Internet Voting Gary Marshall
SingTel Optus Voting James Dam
TEDICORE Voting Barry Dingle
Telstra Voting Glenn Colville
Telstra Non-Voting Chris Hill
Vodafone Voting Davorka Karacic
This Working Committee was chaired by Gary Marshall.
James Duck of Communications Alliance provided project management support.
The Guideline was revised in 2012-2013.

Communications Alliance was formed in 2006 to provide a
unified voice for the Australian communications industry
and to lead it into the next generation of converging
networks, technologies and services.
In pursuing its goals, Communications Alliance offers a
forum for the industry to make coherent and constructive
contributions to policy development and debate.
Communications Alliance seeks to facilitate open,
effective and ethical competition between service
providers while ensuring efficient, safe operation of
networks, the provision of innovative services and the
enhancement of consumer outcomes.
It is committed to the achievement of the policy objective
of the Telecommunications Act 1997 - the greatest
practicable use of industry self-regulation without
imposing undue financial and administrative burdens on
industry.

Published by:
COMMUNICATIONS
ALLIANCE LTD
Level 9
32 Walker Street
North Sydney
NSW 2060 Australia
Correspondence
PO Box 444
Milsons Point
NSW 1565
T 61 2 9959 9111
F 61 2 9954 6136
TTY 61 2 9923 1911 E [email protected]
www.commsalliance.com.au
ABN 56 078 026 507 Care should be taken to
ensure the material used is
from the current version of
the Standard or Industry
Code and that it is updated
whenever the Standard or
Code is amended or
revised. The number and
date of the Standard or
Code should therefore be
clearly identified. If in doubt
please contact
Communications Alliance.
Published by:
COMMUNICATIONS
ALLIANCE LTD
Level 9
32 Walker Street
North Sydney
NSW 2060 Australia
Correspondence
PO Box 444
Milsons Point
NSW 1565
T 61 2 9959 9111
F 61 2 9954 6136
TTY 61 2 9923 1911 E [email protected]
www.commsalliance.com.au
ABN 56 078 026 507
Care should be taken to
ensure the material used is
from the current version of
the Standard or Industry
Code and that it is updated
whenever the Standard or
Code is amended or
revised. The number and
date of the Standard or
Code should therefore be
clearly identified. If in
doubt please contact Communications Alliance