commonwealth of kentucky pension performance and … 08 28 - ky report 3 final... · commonwealth...
TRANSCRIPT

© PFM 1
Commonwealth of Kentucky
Pension Performance and Best
Practices Analysis
Report #3: Recommended Options
Summary Presentation to the
Public Pension Oversight Board
PFM Group Consulting LLC In conjunction with:
PRM
Stites & Harbison
215-557-1465
pfm.com
August 28, 2017
© PFM 2
Overview
Through past legislative reforms, recent Board actions, and significant additional funding in
FY2017-2018, Kentucky has already taken many positive steps to address its retiree
benefits. Without these prior actions, the current situation would be far worse
Nonetheless, the continued severity of the Commonwealth’s remaining challenge requires
further strong, corrective action. Kentucky’s remaining underfunding is acute and growing,
threatening the solvency of the most underfunded plans, and incremental steps will not
suffice to restore stability
• The most-stressed plans have limited assets to withstand downturns and, under previous
actuarial assumptions and funding schedules, would have gone more than another decade
without improvement to their funded status if all actuarial assumptions were met and
recommended contributions made in full
• If Kentucky plans were subject to federal standards for single-employer private sector
plans, all but the Judicial and Legislative plans would be defined as having a severe
funding shortfall (funded status <60%), and would be required by statute to freeze benefit
accruals
© PFM 3
Overview
Even with a stronger foundation placed quickly and decisively into place, a long-term
commitment to reform will also be needed to rebuild on this foundation toward regaining fully
sustainable fiscal health
The actuarial, funding, benefit, and investment approaches across the Commonwealth’s
different plans are complex, interconnected, and impact many, diverse stakeholders in varying
ways. In our recommendations, we have sought to balance these concerns through a
consistent approach that also resolves the current crisis on a sustainable basis
In so doing, we have also sought to reflect the policy principles and direction set forth by
Governor Bevin and the Commonwealth’s leadership – with a focus on strong action that
places these systems on a truly sound and realistic foundation without further “kicking the can
down the road”
At the same time, we recognize that the process ahead prior to enactment of further change
may result in further refinement and adjustments to the specific approaches we outline as
Kentucky moves forward
© PFM 4
Overview
As the next phase of this important reform process
begins, it is our sincere hope that this Report #3 and
its recommended options will provide a sound
framework for the critical work just ahead, contributing
to an enduring resolution that sustains competitive
benefits on an affordable and sustainable basis for
Kentucky’s career public employees to retire with
security and dignity

© PFM 5
Key Policy Principles and Goals
The severely distressed condition of the KERS-NH plan, and the systemically high level of unfunded
liabilities across all of Kentucky’s plans in the aggregate, require strong action to reduce the risks of:
• Continued increases in funding that crowd out other vital public spending and/or reach levels that
cannot be sustained in the budget while keeping the state’s taxes at a competitive level to support
the Commonwealth’s growth
• Resorting to the payment of benefits on a pay-as-you-go cash basis, which would be fiscally
unsustainable
• Plan insolvency, jeopardizing the retirement security of tens of thousands of former state and local
government workers
To the extent possible, accrued benefits for service earned by employees and retirees should be
protected within a framework consistent with Inviolable Contract provisions and federal Employee
Retirement Income Security Act (“ERISA”) standards for private plans
• While legal challenges to any changes the Kentucky General Assembly may make are almost
inevitable, based upon advice of counsel who have studied KRS 61.692 and similar statutes
nationwide, it appears that the legislature has many options that would pass judicial scrutiny in light
of the extremely serious pension situation facing all Kentuckians
© PFM 6
Key Policy Principles and Goals
Long‐term solvency of the retirement system as a whole must be ensured so that current retirees and
future retirees can rely on secure retirement benefits
Risk levels systemically and for each individual plan should be reduced as much as possible to avoid
recurrence of the severe deterioration in the retirement systems’ health. Future liabilities should be
valued conservatively, and the future risk to the Commonwealth associated with changes in economic
conditions, investment returns, demographics, and actuarial methods and assumptions should be
minimized
The Commonwealth’s benefit structures should reduce future exposure to risk and the potential for
unfunded liabilities to reemerge, in order to safeguard plan sustainability for KRS, TRS, and KJFRS
participants, employers and the taxpayers
The Commonwealth’s overall approach as an employer should provide career state and local
employees and teachers a sufficient and sustainable benefit for a dignified retirement through a
combination of benefits from KRS, TRS, and KJFRS, Social Security, and personal savings, while
also accommodating and providing flexible and competitive options for workers who may spend only a
portion of their career in public service

© PFM 7
Approaches
In this Report #3, we present ideas and alternatives for improving the long-
term security, reliability, and affordability of Kentucky’s retirement programs
These recommended options build on our analysis of factors that have led to
the current conditions, addressing the full range of causes for the funding
shortfalls:
• Actuarial assumptions
• Benefit levels and risk exposure
• Funding
• Investment practices and approach

© PFM 8
Actuarial Assumptions
© PFM 9
Actuarial Assumption Recommendations
Modify Kentucky statute KRS 61.565 to convert the level percent of payroll
amortization method for KRS to a level dollar method
• This consistent approach to reducing the Commonwealth’s long-term pension
debt will substantially increase the likelihood of steady and meaningful
progress toward regaining healthy funded status
Modify Kentucky statutes KRS 161.550 and KRS 21.525 to apply a level dollar
amortization method to TRS and KJFRS
© PFM 10
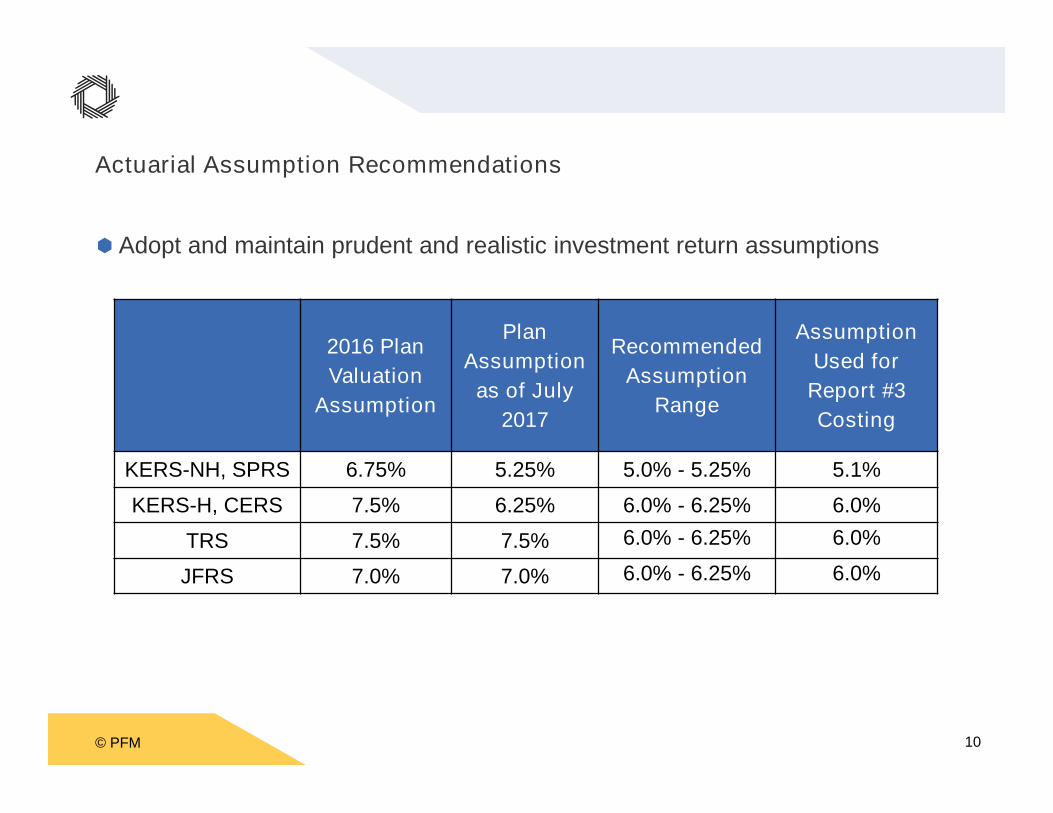
Actuarial Assumption Recommendations
Adopt and maintain prudent and realistic investment return assumptions
2016 Plan
Valuation
Assumption
Plan
Assumption
as of July
2017
Recommended
Assumption
Range
Assumption
Used for
Report #3
Costing
KERS-NH, SPRS 6.75% 5.25% 5.0% - 5.25% 5.1%
KERS-H, CERS 7.5% 6.25% 6.0% - 6.25% 6.0%
TRS 7.5% 7.5% 6.0% - 6.25% 6.0%
JFRS 7.0% 7.0% 6.0% - 6.25% 6.0%

© PFM 11
Actuarial Assumptions
The magnitude of the impact of the recommended actuarial assumptions on
the estimated FY2019 aggregate actuarially determined employer contribution
(ADEC) for all systems, employers and funds is illustrated below
FY2019 Impact of Revised Baseline / Recommended OptionActuarial Assumptions, Compared to Published 6/30/16
Actuarial Assumptions ($Millions)
KERS-NH $473.4
KERS-H 29.6
SPRS 25.7
CERS-NH 325.2
CERS-H 113.3
TRS 861.6
KJRP 5.5
KLRP 1.7
Total $1,836.0
Source: Cavanaugh Macdonald, BPSM, TRS figure from Cavanaugh Macdonald adjusted by PRM

© PFM 12
Actuarial Assumption Recommendations
Maintain the current 30-year amortization periods beginning June 30, 2013 and 2014 for
KRS and TRS, respectively
Apply a 30-year amortization period for the existing KJFRS unfunded liability, with 20-
year closed periods for future unfunded amounts
A reset period of 30 years under a new level dollar amortization might be considered to
modestly smooth the fiscal impact of the significant shift in assumptions approved in May
and July, and recommended in this Report for other plans, and the resulting escalation in
required contributions in the near term
• Resetting the amortization period with a level dollar amortization would not shift disproportionate
amounts of liability principal past the end of the current amortization period, as is the case when
level percent of payroll amortization periods are reset
• It is important to note, however, that resetting the amortization period is not an optimal practice, and
could generate unfavorable actuarial results. Accordingly, this option should only be considered if
necessary to affordably bridge the transition to a significant and comprehensive set of long-term
reforms

© PFM 13
Benefit Levels and Risk Exposure
© PFM 14
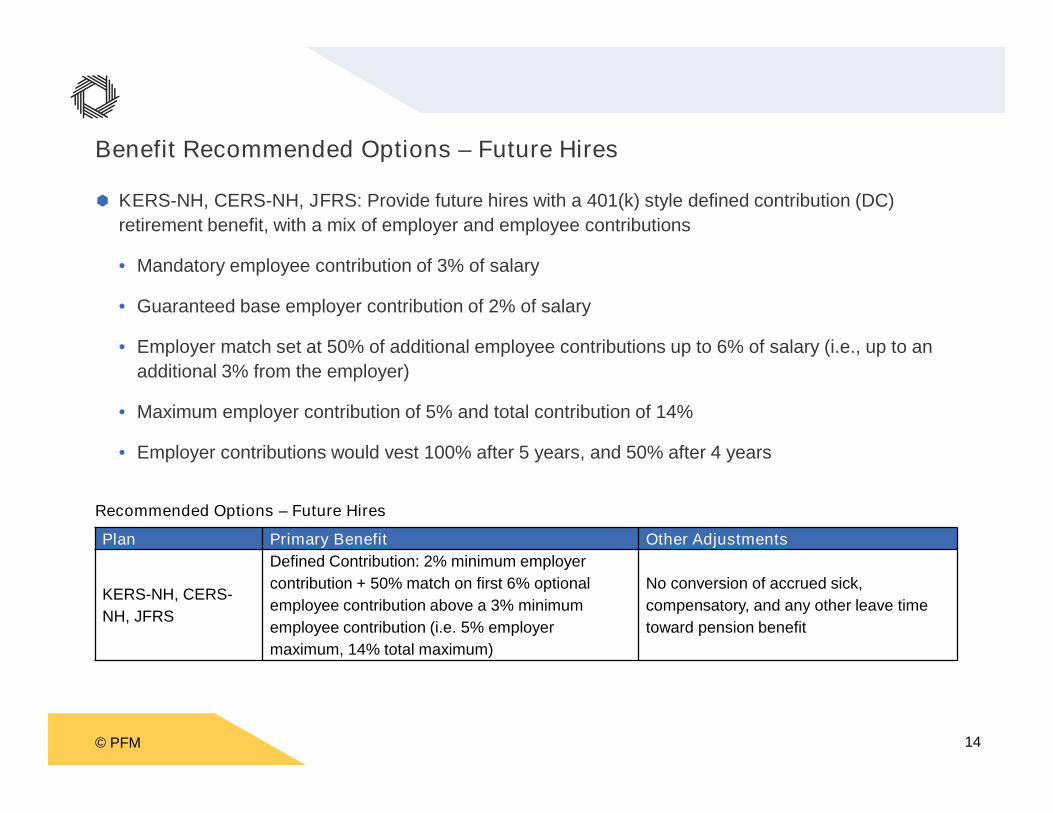
Benefit Recommended Options – Future Hires
KERS-NH, CERS-NH, JFRS: Provide future hires with a 401(k) style defined contribution (DC)
retirement benefit, with a mix of employer and employee contributions
• Mandatory employee contribution of 3% of salary
• Guaranteed base employer contribution of 2% of salary
• Employer match set at 50% of additional employee contributions up to 6% of salary (i.e., up to an
additional 3% from the employer)
• Maximum employer contribution of 5% and total contribution of 14%
• Employer contributions would vest 100% after 5 years, and 50% after 4 years
Recommended Options – Future Hires
Plan Primary Benefit Other Adjustments
KERS-NH, CERS-
NH, JFRS
Defined Contribution: 2% minimum employer
contribution + 50% match on first 6% optional
employee contribution above a 3% minimum
employee contribution (i.e. 5% employer
maximum, 14% total maximum)
No conversion of accrued sick,
compensatory, and any other leave time
toward pension benefit
© PFM 15
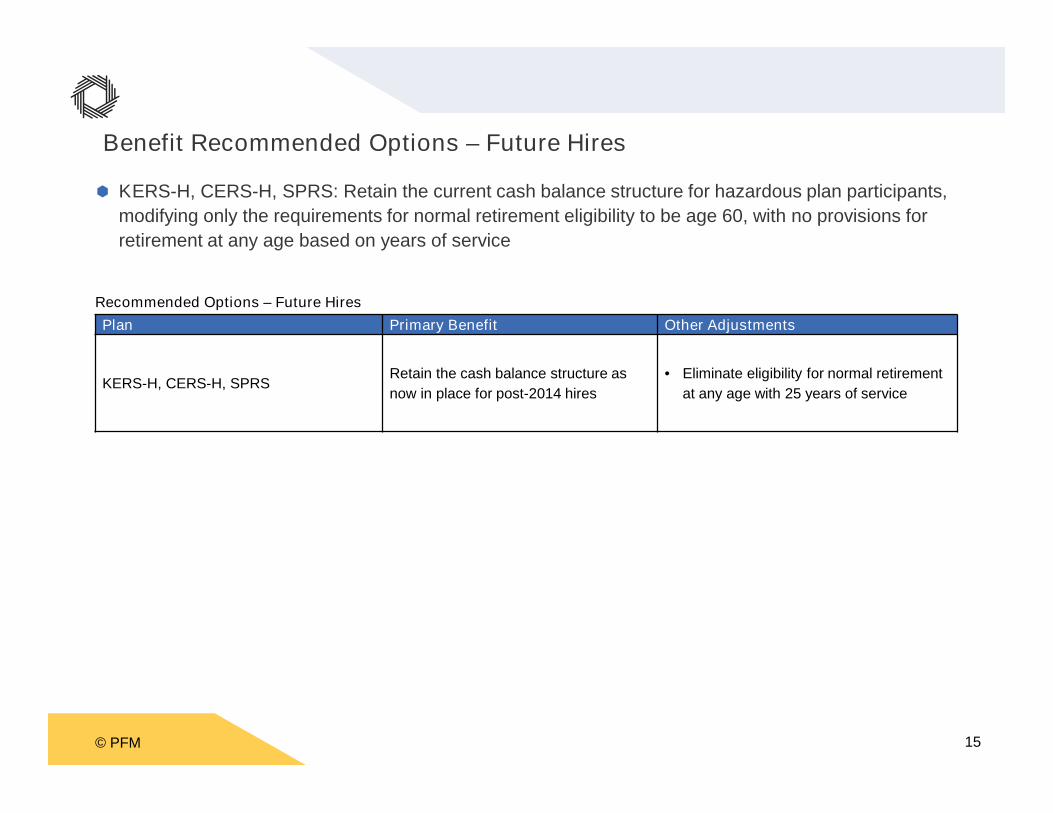
KERS-H, CERS-H, SPRS: Retain the current cash balance structure for hazardous plan participants,
modifying only the requirements for normal retirement eligibility to be age 60, with no provisions for
retirement at any age based on years of service
Recommended Options – Future Hires
Plan Primary Benefit Other Adjustments
KERS-H, CERS-H, SPRSRetain the cash balance structure as
now in place for post-2014 hires
• Eliminate eligibility for normal retirement
at any age with 25 years of service
Benefit Recommended Options – Future Hires

© PFM 16
Teachers Retirement System: A shift to a combination of Social Security participation and a DC
retirement benefit
• Mandatory employee contributions of 3%
• Guaranteed Base employer contribution of 2% of salary
• Additional employer match set at 50% of additional employee contributions up to 6% of salary (i.e.,
up to an additional 3% from the employer)
• Maximum employer contribution of 5% and total contribution of 14%
• The employer contributions would vest 100% after 5 years, and 50% after 4 years
• Participants would be eligible for retirement at age 65
Recommended Options – Future Hires
Plan Primary Benefit Other Adjustments
TRS – Non-University and
University members
• Social Security (generally not now provided for
non-University members)
• Defined Contribution: 2% minimum employer
contribution + 50% match on first 6% optional
employee contribution above a 3% minimum
employee contribution (i.e. 5% employer
maximum, 14% total maximum)
No conversion of accrued sick,
compensatory, and any other leave
time toward pension benefit
Benefit Recommended Options – Future Hires
© PFM 17
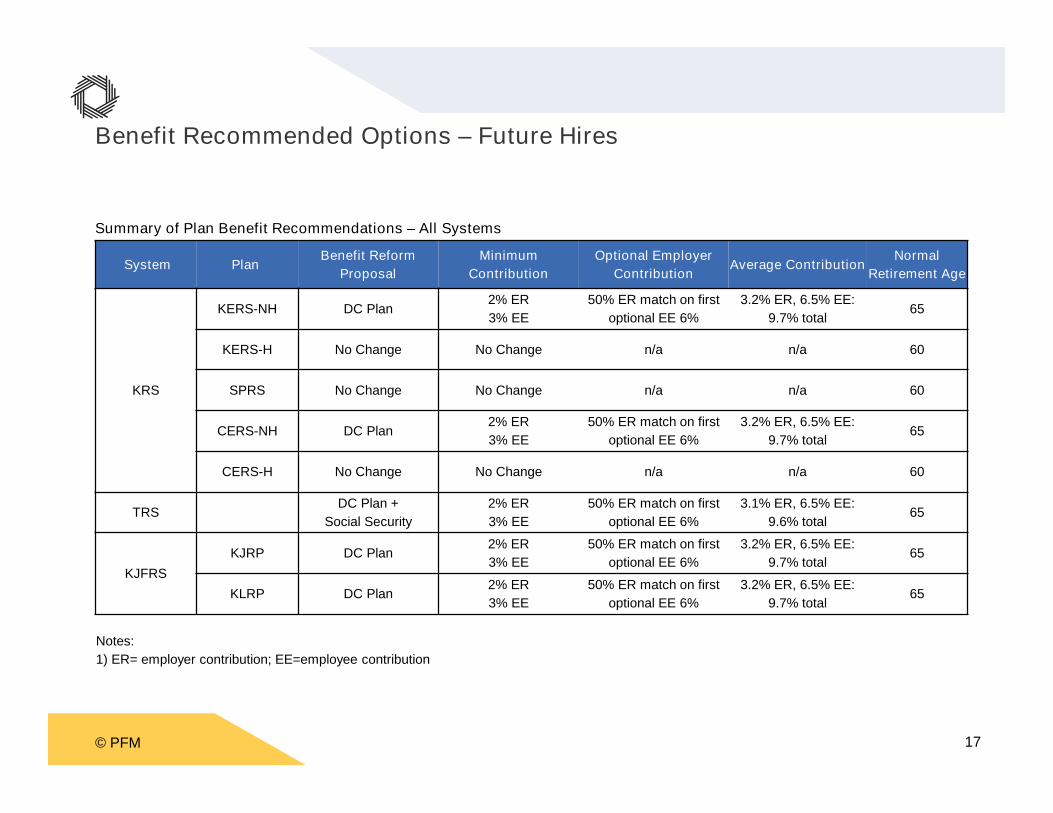
Benefit Recommended Options – Future Hires
System PlanBenefit Reform
Proposal
Minimum
Contribution
Optional Employer
ContributionAverage Contribution
Normal
Retirement Age
KRS
KERS-NH DC Plan2% ER
3% EE
50% ER match on first
optional EE 6%
3.2% ER, 6.5% EE:
9.7% total65
KERS-H No Change No Change n/a n/a 60
SPRS No Change No Change n/a n/a 60
CERS-NH DC Plan2% ER
3% EE
50% ER match on first
optional EE 6%
3.2% ER, 6.5% EE:
9.7% total65
CERS-H No Change No Change n/a n/a 60
TRSDC Plan +
Social Security
2% ER
3% EE
50% ER match on first
optional EE 6%
3.1% ER, 6.5% EE:
9.6% total65
KJFRS
KJRP DC Plan2% ER
3% EE
50% ER match on first
optional EE 6%
3.2% ER, 6.5% EE:
9.7% total65
KLRP DC Plan2% ER
3% EE
50% ER match on first
optional EE 6%
3.2% ER, 6.5% EE:
9.7% total65
Notes:
1) ER= employer contribution; EE=employee contribution
Summary of Plan Benefit Recommendations – All Systems

© PFM 18
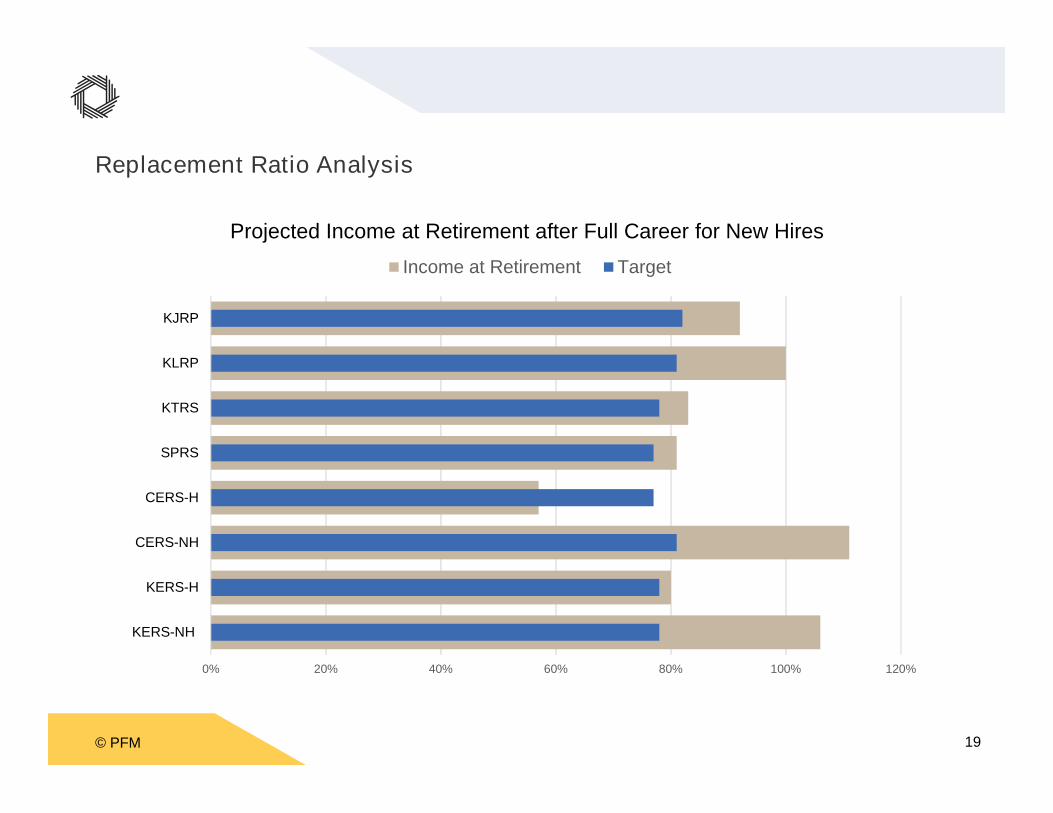
Replacement Ratio Analysis
To maintain the same standard of living in retirement, employees do not need to replace 100% of their
pre-retirement income as expenses after retirement are lower. After retirement contributions to Social
Security and retirement plans end and saving for retirement is no longer needed. Social Security
benefits and pensions are taxed at a lower rate than income and certain work-related expenses
decline
For a pre-retirement income of $70,000 published replacement income studies show that employees
will only need to replace about 77% of the income in retirement to maintain their pre-retirement
standard of living, with slightly larger “replacement ratios” for pre-retirement income below $50,000
The proposed plan design changes and benefit designs for new hires will provide replacement income
that, in combination with Social Security benefits meets or exceeds the target levels of 77% to 85% for
career employees
For those employees not in Social Security, an adequate retirement income can be achieved at a
target retirement age of 62 (or above) with a combination of the retirement plan benefit plus personal
saving equivalent to the 6.2% Social Security contributions
Employees are assumed to maximize the matching employer contributions. Defined contribution
accounts are assumed to earn a return of 5.25% during the employee’s career, and converted to
lifetime income amounts using annuity factors consistent with a 5.25% return rate
© PFM 19
Replacement Ratio Analysis
0% 20% 40% 60% 80% 100% 120%
KERS-NH
KERS-H
CERS-NH
CERS-H
SPRS
KTRS
KLRP
KJRP
Projected Income at Retirement after Full Career for New Hires
Income at Retirement Target

© PFM 20
Benefit Recommendations – Current Plan ParticipantsKERS-NH, CERS-NH, JFRS:
• Freeze accrued benefits under the applicable existing pension tiers
• An optional buyout for the actuarial value of accrued service, with the equivalent cash value to be
rolled over to the plan participant’s new DC account
• Eliminate the application of unused sick and compensatory leave to increase pension benefits
• Eliminate the portion of any pension benefit payments resulting from COLAs granted between
1996-2012 that were provided under statutes excluding such increases from any inviolable contract
provisions
Recommended Options – Current Employees and Retirees
Plan Primary Benefit Other Adjustments
KERS-NH,
CERS-NH, JFRS
• For Tiers 1 and 2, accrued benefit associated with prior service protected at levels
based on plan and date of hire, with no further accrual (although the benefit value will
increase as the final average salary component of the defined benefit formula
increases)
• Tier 3 members would see the account value of their accrued cash balance benefit
rolled over into the new defined contribution plan
• Future service earns a defined contribution benefit: 2% minimum employer
contribution + 50% match on first 6% optional employee contribution above a 3%
minimum employee contribution (i.e. 5% employer maximum, 14% total maximum)
• All benefit payments for retirees would continue in full at the level in place as of 1996
or any subsequent date of retirement; payment amounts due to COLAs granted from
1996 to 2012 would be eliminated prospectively
• Normal retirement age of 65
would apply (employees can
retire earlier with an
actuarially reduced benefit)
• No conversion of accrued
sick, compensatory, and any
other leave time toward
pension benefit
• Optional buyout to be
developed for accrued
pension service under Tiers 1
and 2, with rollover to the new
defined contribution plan
© PFM 21
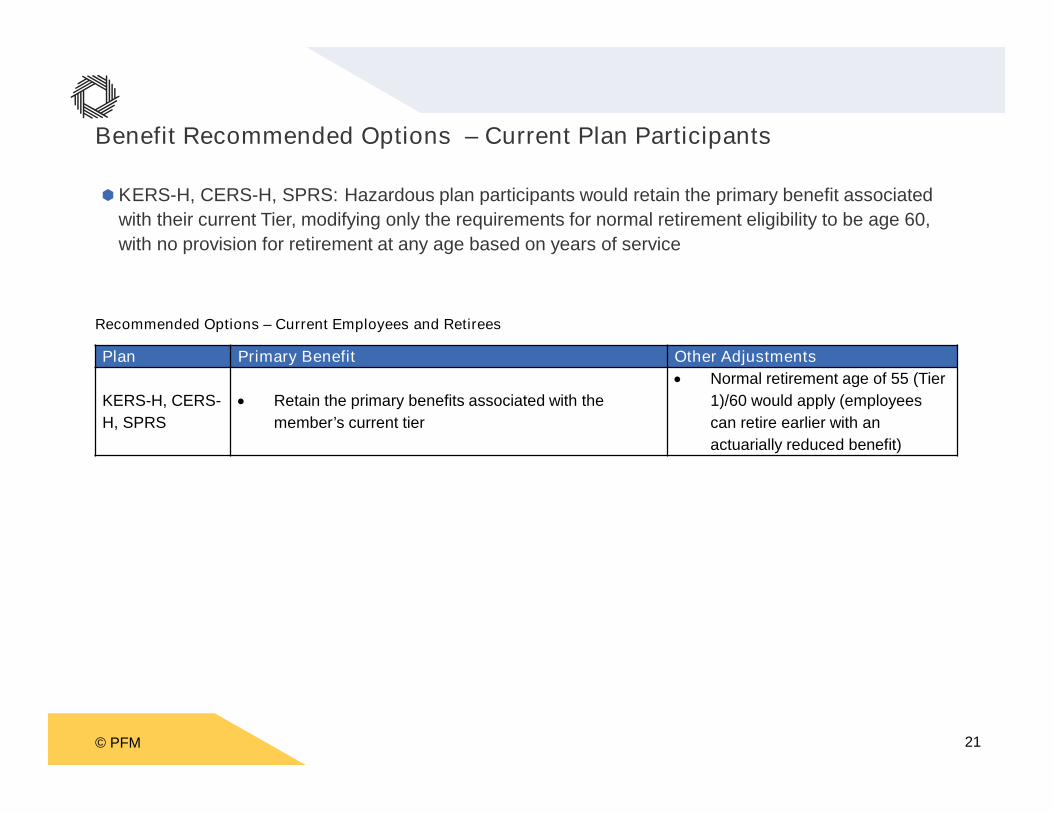
Benefit Recommended Options – Current Plan Participants
KERS-H, CERS-H, SPRS: Hazardous plan participants would retain the primary benefit associated
with their current Tier, modifying only the requirements for normal retirement eligibility to be age 60,
with no provision for retirement at any age based on years of service
Recommended Options – Current Employees and Retirees
Plan Primary Benefit Other Adjustments
KERS-H, CERS-
H, SPRS
• Retain the primary benefits associated with the
member’s current tier
• Normal retirement age of 55 (Tier
1)/60 would apply (employees
can retire earlier with an
actuarially reduced benefit)
© PFM 22
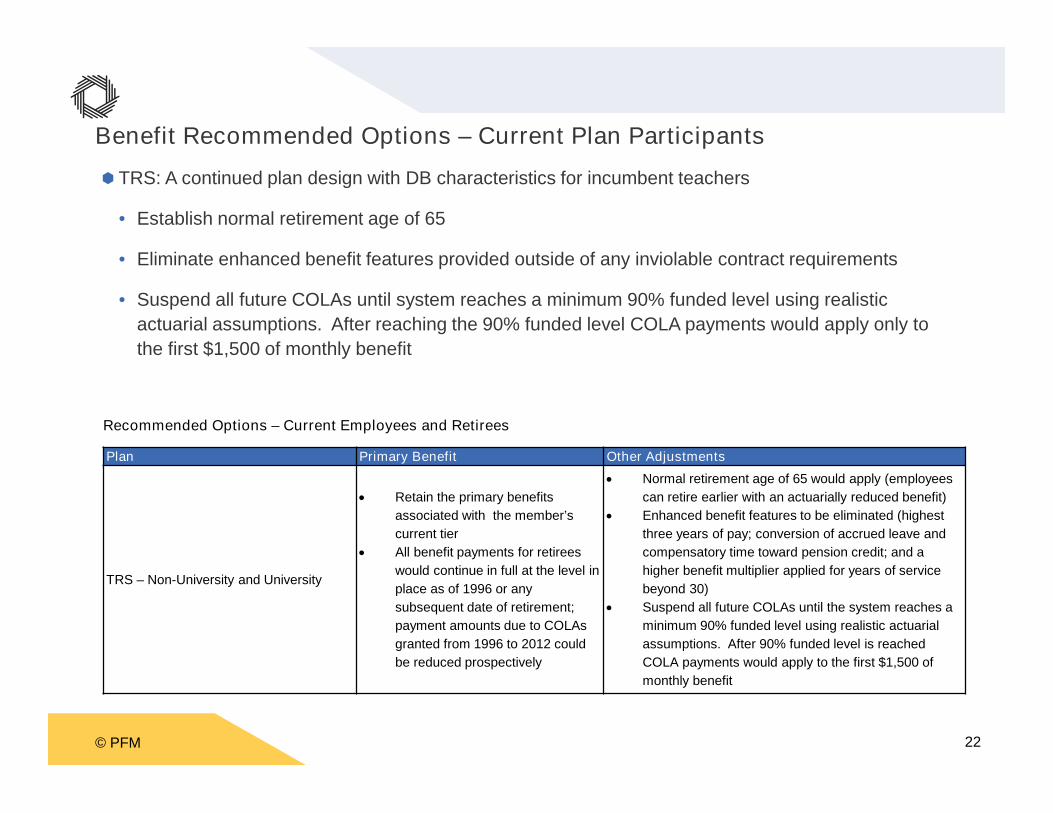
Benefit Recommended Options – Current Plan Participants
TRS: A continued plan design with DB characteristics for incumbent teachers
• Establish normal retirement age of 65
• Eliminate enhanced benefit features provided outside of any inviolable contract requirements
• Suspend all future COLAs until system reaches a minimum 90% funded level using realistic
actuarial assumptions. After reaching the 90% funded level COLA payments would apply only to
the first $1,500 of monthly benefit
Recommended Options – Current Employees and Retirees
Plan Primary Benefit Other Adjustments
TRS – Non-University and University
• Retain the primary benefits
associated with the member’s
current tier
• All benefit payments for retirees
would continue in full at the level in
place as of 1996 or any
subsequent date of retirement;
payment amounts due to COLAs
granted from 1996 to 2012 could
be reduced prospectively
• Normal retirement age of 65 would apply (employees
can retire earlier with an actuarially reduced benefit)
• Enhanced benefit features to be eliminated (highest
three years of pay; conversion of accrued leave and
compensatory time toward pension credit; and a
higher benefit multiplier applied for years of service
beyond 30)
• Suspend all future COLAs until the system reaches a
minimum 90% funded level using realistic actuarial
assumptions. After 90% funded level is reached
COLA payments would apply to the first $1,500 of
monthly benefit
© PFM 23
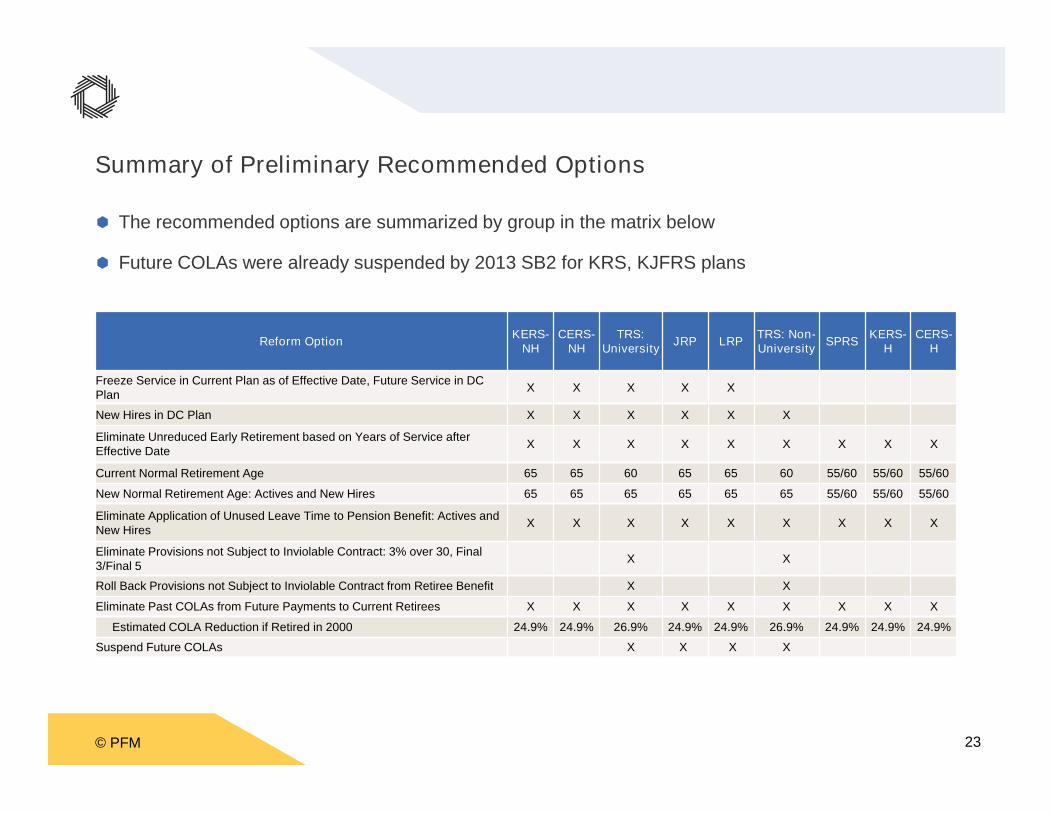
Summary of Preliminary Recommended Options
The recommended options are summarized by group in the matrix below
Future COLAs were already suspended by 2013 SB2 for KRS, KJFRS plans
Reform OptionKERS-
NHCERS-
NHTRS:
UniversityJRP LRP
TRS: Non-University
SPRSKERS-
HCERS-
H
Freeze Service in Current Plan as of Effective Date, Future Service in DCPlan
X X X X X
New Hires in DC Plan X X X X X X
Eliminate Unreduced Early Retirement based on Years of Service afterEffective Date
X X X X X X X X X
Current Normal Retirement Age 65 65 60 65 65 60 55/60 55/60 55/60
New Normal Retirement Age: Actives and New Hires 65 65 65 65 65 65 55/60 55/60 55/60
Eliminate Application of Unused Leave Time to Pension Benefit: Actives andNew Hires
X X X X X X X X X
Eliminate Provisions not Subject to Inviolable Contract: 3% over 30, Final3/Final 5
X X
Roll Back Provisions not Subject to Inviolable Contract from Retiree Benefit X X
Eliminate Past COLAs from Future Payments to Current Retirees X X X X X X X X X
Estimated COLA Reduction if Retired in 2000 24.9% 24.9% 26.9% 24.9% 24.9% 26.9% 24.9% 24.9% 24.9%
Suspend Future COLAs X X X X
© PFM 24
Retiree Medical/ Insurance Fund
Our review of the retiree medical benefit program, led by PRM Consulting
Group, found opportunities for reducing the cost of providing coverage by as
much as 25%
• Many Commonwealth retirees were found to receive significantly richer,
more costly coverage than their active and pre-Medicare retiree
counterparts.
• Could potentially eliminate the need for employer subsidy for Medicare-
eligible retirees
This opportunity would still provide quality benefits in retirement, consistent
with those received by active Commonwealth employees

© PFM 25
Retiree Medical/ Insurance Fund Recommendations
Pursue harmonization of the level of retiree healthcare benefits for KRS, LRP, and JRP non-Medicare
and Medicare retirees so that the basic plan and benefit provided to the retirees is consistent with the
Livingwell PPO coverage provided to active Commonwealth employees
Pursue harmonization of the level of benefits for TRS Medicare-eligible retirees so that the basic plan
and benefit provided to the retirees is consistent with the coverage provided to Commonwealth
employees. TRS retirees could further be offered a choice between this new lower cost plan and the
current, richer design – with retirees to be responsible for the full premium of the higher cost more
generous coverage
Harmonize the Medicare Advantage plan provided to members of the JFRS with the coverage
provided to KRS and TRS members. In addition, by pooling the coverage for purposes of obtaining
the premium, the JFRS will be able to leverage the additional scale of the other plans to obtain more
competitive premium rates
Limit retiree healthcare eligibility to employees retiring directly from Commonwealth service. This
requirement would eliminate the ability of former employees who left public service early in their
career (e.g. left at age 35 with 10 years of service), from collecting Commonwealth-subsidized retiree
healthcare when they eventually reach the age for beginning to draw down their public pension
© PFM 26
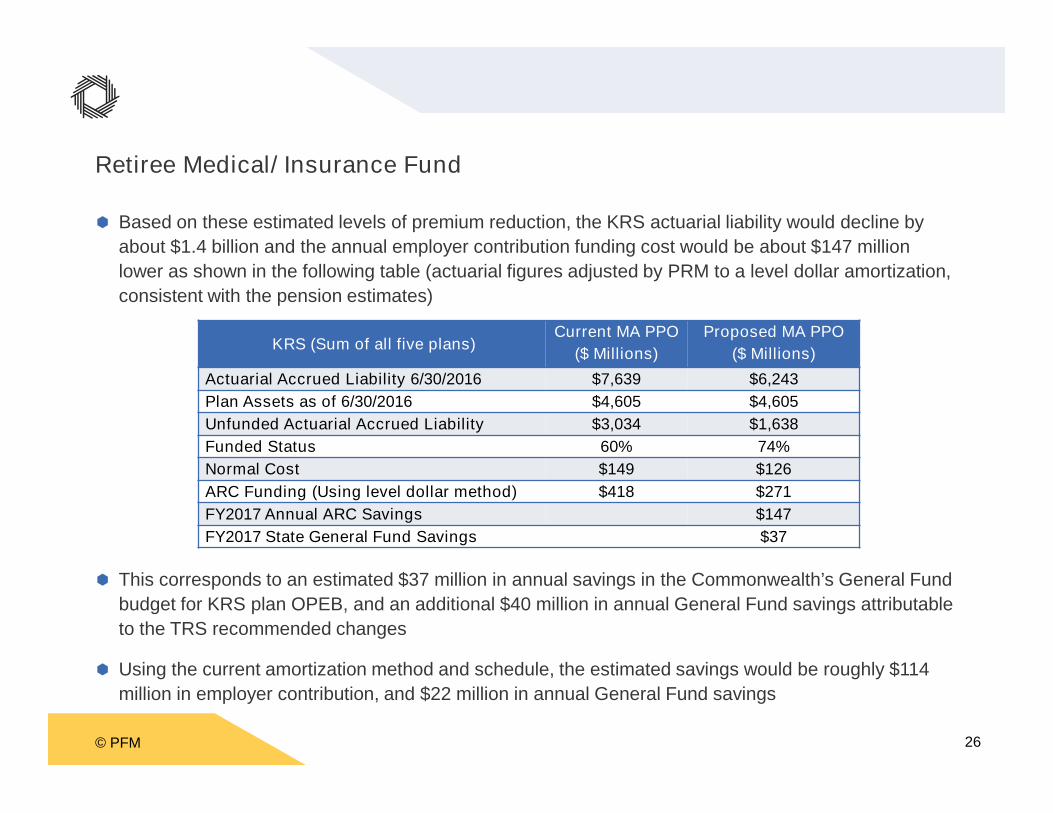
Retiree Medical/ Insurance Fund
Based on these estimated levels of premium reduction, the KRS actuarial liability would decline by
about $1.4 billion and the annual employer contribution funding cost would be about $147 million
lower as shown in the following table (actuarial figures adjusted by PRM to a level dollar amortization,
consistent with the pension estimates)
This corresponds to an estimated $37 million in annual savings in the Commonwealth’s General Fund
budget for KRS plan OPEB, and an additional $40 million in annual General Fund savings attributable
to the TRS recommended changes
Using the current amortization method and schedule, the estimated savings would be roughly $114
million in employer contribution, and $22 million in annual General Fund savings
KRS (Sum of all five plans)Current MA PPO
($ Millions)
Proposed MA PPO
($ Millions)
Actuarial Accrued Liability 6/30/2016 $7,639 $6,243
Plan Assets as of 6/30/2016 $4,605 $4,605
Unfunded Actuarial Accrued Liability $3,034 $1,638
Funded Status 60% 74%
Normal Cost $149 $126
ARC Funding (Using level dollar method) $418 $271
FY2017 Annual ARC Savings $147
FY2017 State General Fund Savings $37

© PFM 27
Local Boards of Education Impacts
While local school boards do not currently contribute any of the employer contribution for
teacher pensions, there is a local employer share for retiree medical
• The recommended changes to TRS may produce an estimated $55 million of retiree
medical savings for local school boards
• In addition, non-teaching staff of local school boards comprise 39% of the salary base
in CERS-NH, and would potentially save an additional estimated $18 million
collectively in retiree medical expenditures from recommended changes
This savings would offset the estimated initial costs to School Boards of enrolling TRS
new hires in Social Security
• Estimated initial $11 million statewide in first full year
• Increases roughly $10 million per year afterward
© PFM 28
Voluntary Buyouts
A voluntary buyout of accrued service would allow employees who would
prefer to manage their own assets in a DC plan to convert their benefit from the
fixed DB plan to a lump sum beginning account balance in the DC plan, on a
tax-exempt basis
• Voluntary on an employee-by-employee basis, except for Tier 3 of KERS-NH,
CERS-NH, and Tier 4 of KJRP/KLRP
• This conversion would remove the liability from the retirement system, value
the employee’s accrued service as of the date of the conversion – without
applying future pay increases to the frozen portion of the benefit – improve
the funded ratio, and reduce risk to the plan

© PFM 29
Voluntary Buyouts
This mechanism would be similar to what was offered in KRS 61.522, which provided for
nonprofit nonstock corporations participating in KERS to withdraw from the system by funding
their liability
• Employees had the option to leave their accrued service with KRS until retirement, or
withdraw their account balances, defined as the employee’s accumulated pension
contributions based on the 5% of pay contribution rather than the accrued benefit, and roll it
over to the new tax-deferred retirement program offered by the employer
Two employers to date, Kentucky Employers’ Mutual Insurance (KEMI) and the
Commonwealth Credit Union (CCU), have used KRS 61.522 to withdraw from KRS
• KRS provided KEMI employees with a 60-day notice period to declare their intent to transfer
to the new KEMI plan
• It is our understanding that, by offering in parallel both a DB plan that would maintain the
previous benefit structure and carry over the employee’s service credit from the KRS plan,
and by offering a DC plan with an employer match of 50% or 100% of the employee’s
account balance, KEMI incentivized all of its employees to transfer from KRS to KEMI
© PFM 30
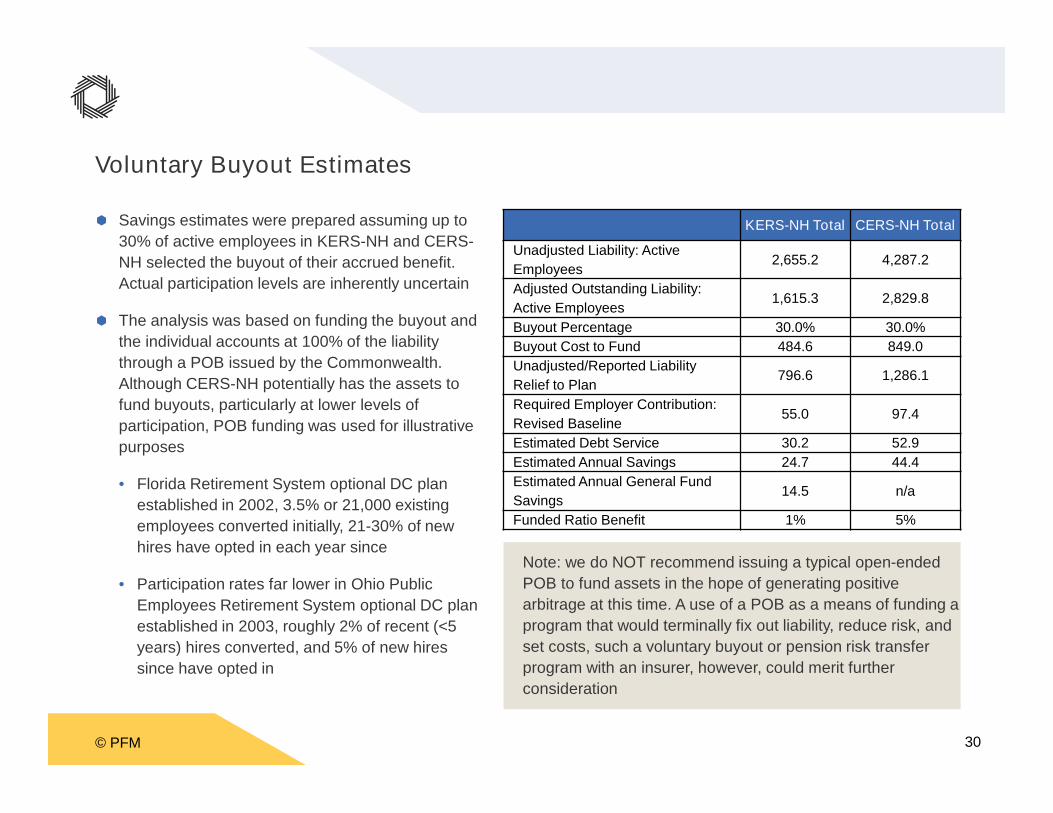
Voluntary Buyout Estimates
Savings estimates were prepared assuming up to
30% of active employees in KERS-NH and CERS-
NH selected the buyout of their accrued benefit.
Actual participation levels are inherently uncertain
The analysis was based on funding the buyout and
the individual accounts at 100% of the liability
through a POB issued by the Commonwealth.
Although CERS-NH potentially has the assets to
fund buyouts, particularly at lower levels of
participation, POB funding was used for illustrative
purposes
• Florida Retirement System optional DC plan
established in 2002, 3.5% or 21,000 existing
employees converted initially, 21-30% of new
hires have opted in each year since
• Participation rates far lower in Ohio Public
Employees Retirement System optional DC plan
established in 2003, roughly 2% of recent (<5
years) hires converted, and 5% of new hires
since have opted in
KERS-NH Total CERS-NH Total
Unadjusted Liability: Active
Employees2,655.2 4,287.2
Adjusted Outstanding Liability:
Active Employees1,615.3 2,829.8
Buyout Percentage 30.0% 30.0%
Buyout Cost to Fund 484.6 849.0
Unadjusted/Reported Liability
Relief to Plan796.6 1,286.1
Required Employer Contribution:
Revised Baseline55.0 97.4
Estimated Debt Service 30.2 52.9
Estimated Annual Savings 24.7 44.4
Estimated Annual General Fund
Savings14.5 n/a
Funded Ratio Benefit 1% 5%
Note: we do NOT recommend issuing a typical open-ended
POB to fund assets in the hope of generating positive
arbitrage at this time. A use of a POB as a means of funding a
program that would terminally fix out liability, reduce risk, and
set costs, such a voluntary buyout or pension risk transfer
program with an insurer, however, could merit further
consideration

© PFM 31
Funding
© PFM 32
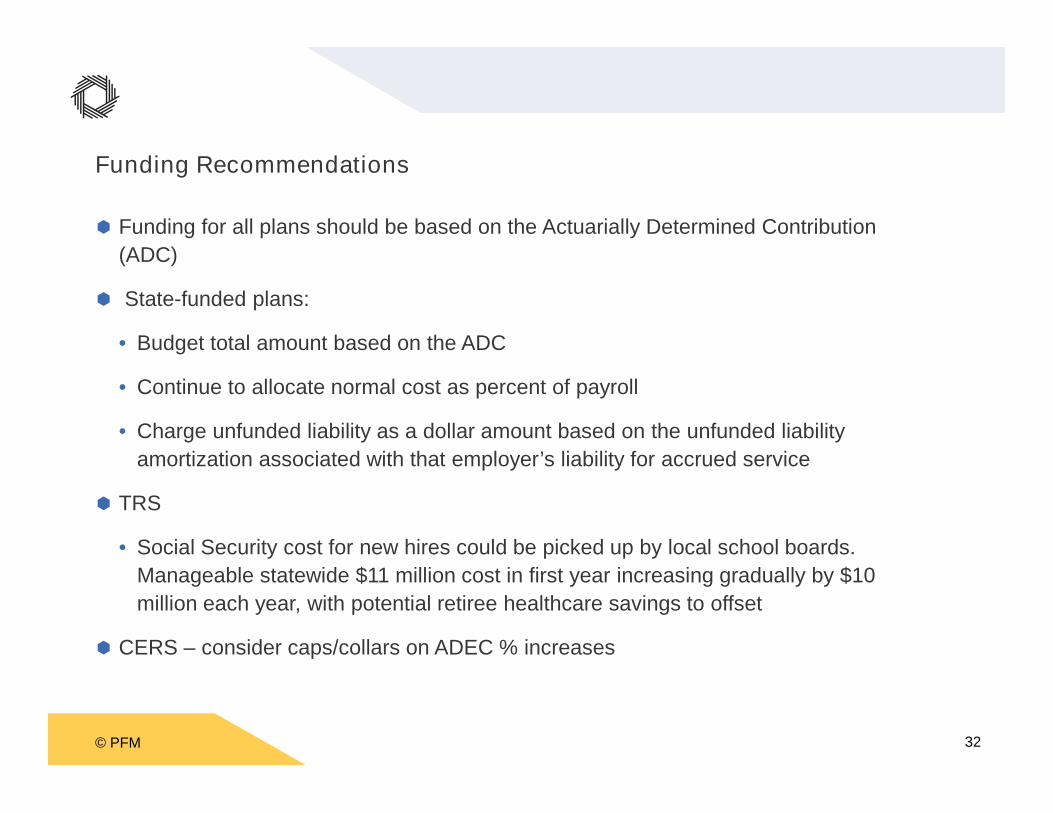
Funding Recommendations
Funding for all plans should be based on the Actuarially Determined Contribution
(ADC)
State-funded plans:
• Budget total amount based on the ADC
• Continue to allocate normal cost as percent of payroll
• Charge unfunded liability as a dollar amount based on the unfunded liability
amortization associated with that employer’s liability for accrued service
TRS
• Social Security cost for new hires could be picked up by local school boards.
Manageable statewide $11 million cost in first year increasing gradually by $10
million each year, with potential retiree healthcare savings to offset
CERS – consider caps/collars on ADEC % increases

© PFM 33
Funding Recommendations
Pension
PlanCurrent Funding Method Source
KERS-NH,
KERS-H,
SPRS
Employer contributes the full actuarial contribution (normal cost plus amortization of unfunded
liability) as a percentage of creditable compensation (payroll), based on level percent of payroll
amortization and entry age normal funding method. The board sets the percentage each biennium
based on the prior June 30 valuation. Effective July 1, 2014, the board cannot change rates for the
second year of the biennium.
KRS
61.565
CERS-NH,
CERS-H
Same as KERS-NH et al above, except that the board may change the percentage for the second
year of the biennium based on the updated valuation.
KRS
61.565
TRS
The Commonwealth pays employer contributions for non-university, board of education employee
pensions. The employer matches employee contributions of 9.105% of non-university salaries for
pension (7.625% for university salaries), and contributes an additional 3.25% for the system’s
unfunded obligations with interest and for the medical insurance (OPEB) fund. The amortization of
past COLAs, annuities, and sick leave allowances “may be funded by annual appropriations from the
state,” which was equivalent to a special appropriation rate of 2.94% of salaries for FY2018.
TRS annually requests additional appropriation to cover the shortfall between the statutory
contribution and the actuarial contribution. Unlike the other systems, the contribution is currently not
tied to the actuarial calculation of normal cost or unfunded liability, and the amortization method is
set by board policy.
KRS
161.550
KRS
161.553
JRP, LRP
The state contributes the normal cost plus interest on the unfunded liability plus 1% of the unfunded
liability per year. The board adopts the actuarial assumptions, including whether entry age normal or
projected unit credit funding method is used.
KRS
21.525

© PFM 34
Investment Practices and Approach

© PFM 35
Governance and Investment Practices
Indiana Public Retirement System
documented $347 million in NPV
savings from full consolidation of
systems like KRS and TRS through
FY2014
Aggregating all TRS and KRS assets
(investment centralization only) would
potentially generate more than $5
million of annual savings in investment
management fees based on current
KRS rates – without factoring in
additional negotiating leverage
PFM analysis of KRS investment
manager fee schedules indicates
increased annual fees for both
KERS/SPRS and CERS if split, due to
lower asset bases
• $1.1 million for KERS/SPRS
• $0.7 million for CERS
Potential benefits of a single investment team:
- Lower overall cost for staff, infrastructure – e.g.
KRS estimates increased costs of $3.6 million
per year from separating CERS from KRS
- Improved access and leverage with money
managers and third-party vendors
- Easier to hire talented investment professionals
- Simplified governance and monitoring
- Improved consistency in actuarial return
assumptions
- Coordinated & consistent investment
philosophy, process and outlook
- Larger plans have been shown to achieve
higher returns according to studies by the
Center for Retirement Research and others
- Improved transparency and monitoring for
legislators, taxpayers and other parties

© PFM 36
Summary
© PFM 37
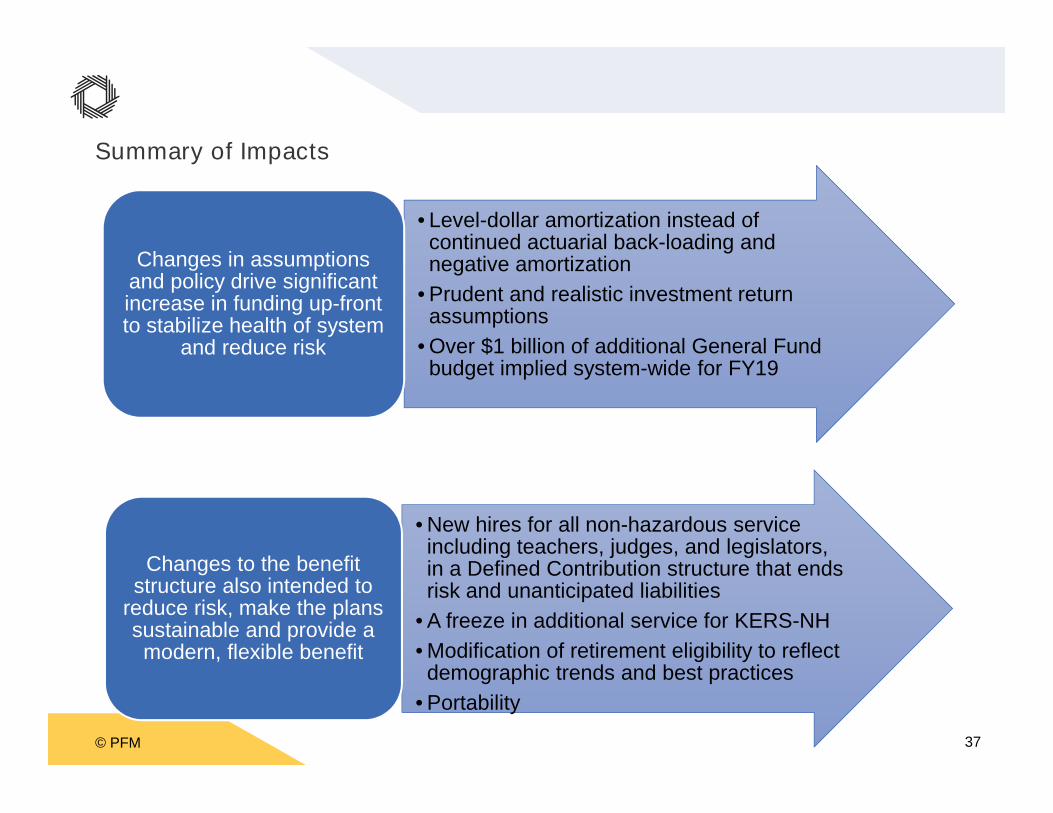
Summary of Impacts
• Level-dollar amortization instead ofcontinued actuarial back-loading andnegative amortization
• Prudent and realistic investment returnassumptions
• Over $1 billion of additional General Fundbudget implied system-wide for FY19
Changes in assumptionsand policy drive significantincrease in funding up-frontto stabilize health of system
and reduce risk
• New hires for all non-hazardous serviceincluding teachers, judges, and legislators,in a Defined Contribution structure that endsrisk and unanticipated liabilities
• A freeze in additional service for KERS-NH
• Modification of retirement eligibility to reflectdemographic trends and best practices
• Portability
Changes to the benefitstructure also intended to
reduce risk, make the planssustainable and provide amodern, flexible benefit

© PFM 38
Summary of Impacts
Initial impact on the
Commonwealth’s General Fund
of applying the more
conservative assumptions to all
state-funded plans is an
estimated increase to the
FY2019 budget of over $1
billion, further than the
significant added investments in
FY2017-18 budget
The combination of implementing
all the recommended benefit
options is estimated to offset the
impact of the assumptions
system-wide and reduce the
recommended employer
contribution by approximately
13% below the prior
published/current assumptions –
if all preliminary options are
included and fully realized
All State Plans
General Fund Contribution vs Baseline Increase/
(Savings) ($Millions)
#Scenario
DescriptionFY19 FY24 FY29 FY34
All
Plans
Current
Projections1,410.5 1,724.3 2,041.8 2,421.8
All
Plans
Impact of revised
baseline,
compared to
published actuarial
assumptions
1,063.2 747.8 317.8 (127.8)
Revised Baseline 2,473.7 2,472.2 2,359.7 2,294.0
All
Plans
Savings: net
reduction in ADC
from combination
of all scenarios.
(1,247.9) (1,237.6) (1,178.6) (1,148.1)
Revised ADC
after
implementation
of all proposed
changes, above.
1,225.8 1,234.5 1,181.0 1,145.9

© PFM 39
Summary
All future Kentucky state and local government employees would have access to a balanced set of
retirement benefits providing positive income replacement levels, including:
• Social Security participation (not now available to teachers and many local government public safety
employees)
• Additional defined contribution (401(k)-style) plans with significant minimum employer contributions
and additional employer matches
• Quality retiree healthcare coverage consistent with that provided to active employees
All current Kentucky state and local government employees would have the value of their accrued
benefits maintained, and receive benefits for future service as good as or better than those available for
future hires
All retired Kentucky former employees would receive at least the same benefit level they were
guaranteed upon retirement, and would see significant improvements to the funding of their benefits –
strengthening the solvency of these vital commitments
In addition, all Kentucky stakeholders would begin to see steady and meaningful restoration of fiscal
stability to the Commonwealth’s retirement systems, with greatly reduced risk of renewed pension crises
in the years ahead. In turn, this progress would ultimately lead to more resources available for critical
investments and services, or fair employee raises going forward, and for improved financial health and
credit strength
© PFM 40
Summary
As detailed in Interim Report #2, a status quo path is not sustainable
In this Report #3, we have sought to present a range of recommended options
to regain a more sustainable direction. In the weeks ahead, we look forward to
working with Kentucky’s leadership to help inform the specific decisions that
chart this future course
With prior reforms as recently as this year’s passage of 2017 Senate Bill 2,
important and positive steps have already been taken
While the next steps to come will be even more challenging, they are also that
much more critical to lead the Commonwealth forward