commonwealth international series trust 791 town & country ... · commonwealth international...
TRANSCRIPT

Commonwealth InternationalSeries Trust
791 Town & Country Blvd, Suite 250Houston, TX 77024-3925
888-345-1898www.commonwealthfunds.com
INVESTMENT ADVISORFCA Corp
791 Town & Country Blvd, Suite 250Houston, TX 77024-3925
713-781-2856
DISTRIBUTORUnified Financial Securities, LLC9465 Counselors Row, Suite 200
Indianapolis, IN 46240
TRANSFER AGENT & ADMINISTRATORUltimus Asset Services, LLC225 Pictoria Drive, Suite 450
Cincinnati, OH 45246
CUSTODIAN BANKFifth Third Bank N.A.
Fifth Third Center38 Fountain Square Plaza
Cincinnati, OH 45263
INDEPENDENT REGISTERED PUBLICACCOUNTING FIRM
BBD, LLP1835 Market Street, 26th Floor
Philadelphia, PA 19103
LEGAL COUNSELThe Law Offices of John H. Lively & Associates, Inc.
A member firm of The 1940 Act Law GroupTM
11300 Tomahawk Creek Parkway, Ste. 310Leawood, KS 66211
This report is intended for the shareholders of the family of fundsof the Commonwealth International Series Trust. It may not bedistributed to prospective investors unless it is preceded oraccompanied by the Funds’ current Prospectus. An additionalProspectus may be obtained at www.commonwealthfunds.com orfrom the principal underwriter of the Funds or your broker.
Distributed by Unified Financial Securities, LLCMember FINRA/SIPC
Commonwealth Australia/New Zealand FundAfrica Fund
Commonwealth Japan FundCommonwealth Global Fund
Commonwealth Real Estate Securities Fund
SEMI-ANNUAL REPORT
April 30, 2017

Table of Contents
Performance Overview . . . . . . . . . . . . . . . . . . . . . . . . . . . . . . . . . . . . . . . . . . . . . . . . . . . . . . . . . . . . . . . . . . . . . . . . . . . . . 1
Portfolio Composition . . . . . . . . . . . . . . . . . . . . . . . . . . . . . . . . . . . . . . . . . . . . . . . . . . . . . . . . . . . . . . . . . . . . . . . . . . . . . . 2
Schedules of Investments . . . . . . . . . . . . . . . . . . . . . . . . . . . . . . . . . . . . . . . . . . . . . . . . . . . . . . . . . . . . . . . . . . . . . . . . . . . . 4
Statements of Assets and Liabilities . . . . . . . . . . . . . . . . . . . . . . . . . . . . . . . . . . . . . . . . . . . . . . . . . . . . . . . . . . . . . . . . . . . . 15
Statements of Operations . . . . . . . . . . . . . . . . . . . . . . . . . . . . . . . . . . . . . . . . . . . . . . . . . . . . . . . . . . . . . . . . . . . . . . . . . . . . 16
Statements of Changes in Net Assets . . . . . . . . . . . . . . . . . . . . . . . . . . . . . . . . . . . . . . . . . . . . . . . . . . . . . . . . . . . . . . . . . . . 17
Financial Highlights . . . . . . . . . . . . . . . . . . . . . . . . . . . . . . . . . . . . . . . . . . . . . . . . . . . . . . . . . . . . . . . . . . . . . . . . . . . . . . . . 19
Notes to Financial Statements . . . . . . . . . . . . . . . . . . . . . . . . . . . . . . . . . . . . . . . . . . . . . . . . . . . . . . . . . . . . . . . . . . . . . . . . 24
Approval of the Renewal of the Investment Advisory Agreement . . . . . . . . . . . . . . . . . . . . . . . . . . . . . . . . . . . . . . . . . . . . 36
Additional Information . . . . . . . . . . . . . . . . . . . . . . . . . . . . . . . . . . . . . . . . . . . . . . . . . . . . . . . . . . . . . . . . . . . . . . . . . . . . . . 40
Notice of Privacy Policy & Practices . . . . . . . . . . . . . . . . . . . . . . . . . . . . . . . . . . . . . . . . . . . . . . . . . . . . . . . . . . . . . . . . . . . 42

SEMI-ANNUAL REPORT 2017
PERFORMANCE OVERVIEW – April 30, 2017 (Unaudited)
Average AnnualGross
ExpenseRatio1
NetExpense
Ratio1Inception
Date 6 Month 1 Year 5 Year 10 YearSince
Inception
Commonwealth Australia/New Zealand Fund 11/25/91 4.70% 14.96% 6.07% 3.11% 5.74% 2.84% 2.84%Africa Fund 11/07/11 6.28% 10.43% (2.50)% — (1.65)% 4.09% 1.95%Commonwealth Japan Fund 07/10/89 2.37% 5.49% 4.78% (0.96)% (3.17)% 3.24% 1.77%Commonwealth Global Fund 12/03/02 8.02% 9.35% 3.58% 0.88% 5.82% 2.93% 2.93%Commonwealth Real Estate Securities Fund 01/05/04 9.37% 10.52% 7.94% 1.58% 4.50% 2.95% 2.95%
Past performance does not guarantee future results. The performance data quoted represents past performance and current returns whichmay be lower or higher. The above table does not reflect the deduction of taxes that a shareholder would pay on the CommonwealthAustralia/New Zealand Fund, Africa Fund, Commonwealth Japan Fund, Commonwealth Global Fund and Commonwealth Real EstateSecurities Fund (each a “Fund” and collectively the “Funds”) distributions or the redemption of Fund shares. The investment return andprincipal value will fluctuate so that an investor’s shares, when redeemed may be worth more or less than the original cost. To obtainperformance information current to the most recent month end, please call 888-345-1898.
1 The above expense ratios are from the Funds’ Prospectus, dated February 28, 2017. FCA Corp has entered into a written expense limitationagreement under which it has agreed to limit the total operating expenses of the Africa Fund and Commonwealth Japan Fund (exclusive ofinterest, distribution fees pursuant to Rule 12b-1 Plans, taxes, acquired fund fees and expenses, brokerage commissions, extraordinary expensesand dividend expense on short sales) to an annual rate of 1.50% of the average daily net assets of each Fund. This expense limitation agreementmay be terminated by FCA Corp or the Trust at any time after February 28, 2018. FCA Corp may recoup any waived amount from the Fundspursuant to this agreement if such reimbursement does not cause the Funds to exceed the expense limitation in place at the time the fee waswaived and the expense reimbursement is made within three years after the year in which FCA Corp incurred the expense. Additionalinformation pertaining to the Funds’ expense ratios as of April 30, 2017, can be found in the financial highlights. Excluding the indirect costs ofinvesting in acquired funds, total fund operating expenses prior to any applicable fee waivers and/or reimbursements would be 2.84%, 3.89%,3.22%, 2.92% and 2.93% for the Commonwealth Australia/New Zealand Fund, Africa Fund, Commonwealth Japan Fund, CommonwealthGlobal Fund and Commonwealth Real Estate Securities Fund, respectively.
You should carefully consider the investment objectives, risks, charges and expenses of the Fund before investing. This and other informationcan be found in the Fund’s Prospectus, which can be obtained from www.commonwealthfunds.com, by calling the Funds directly at888-345-1898 or by contacting your investment representative. Please read it carefully before you invest or send money.
1

SEMI-ANNUAL REPORT 2017
PORTFOLIO COMPOSITION – April 30, 2017* (Unaudited)
COMMONWEALTH AUSTRALIA/NEW ZEALAND FUNDIndustry orSecurity Type
Percentage of TotalInvestments
Marine Ports & Services 22.2%Air Freight & Logistics 8.2%Specialized Finance 6.0%Health Care Facilities 5.4%Health Care Services 4.3%Electric Utilities 4.1%Industrial Machinery 4.1%Renewable Electricity 3.4%Education Services 3.4%Property & Casualty Insurance 3.4%Health Care Equipment 3.0%Reinsurance 3.0%Banks 2.8%Oil & Gas Refining, Marketing & Transportation 2.8%Multi-Utilities and Unregulated Power 2.7%Packaged Foods & Meats 2.5%Home Furnishing Retail 2.5%Biotechnology 2.4%Personal Products 2.1%Short-Term Investments 1.5%Human Resource & Employment Services 1.3%Diversified Support Services 1.0%Gas Utilities 1.0%Hotels, Resorts & Cruise Lines 1.0%Oil & Gas Exploration & Production 1.0%Wireless Telecommunication Services 1.0%Internet Software & Services 0.9%Specialty Stores 0.9%Home Furnishing 0.8%Electronic Equipment Manufacturers 0.6%Drug Retail 0.4%Airport Services 0.2%Diversified Chemicals 0.1%
100.0%
AFRICA FUNDCountry orSecurity Type
Percentage of TotalInvestments
South Africa 77.7%Exchange Traded Funds – Africa Region 8.7%Short-Term Investments 8.6%Exchange Traded Funds – Nigeria 3.6%Egypt 0.8%Zambia 0.6%
100.0%
COMMONWEALTH JAPAN FUNDIndustry orSecurity Type
Percentage of TotalInvestments
Railroads 13.5%Health Care Supplies 10.7%Construction & Engineering 6.4%Health Care Equipment 6.3%Life & Health Insurance 5.6%Industrial Machinery 5.0%Air Freight & Logistics 4.3%Leisure Products 3.9%Tires & Rubber 3.7%Diversified Real Estate Activities 3.5%Household Products 3.0%Brewers 2.8%Marine 2.7%Trucking 2.7%Auto Parts & Equipment 2.6%IT Consulting & Other Services 2.6%Drug Retail 2.5%Pharmaceuticals 2.5%Soft Drinks 2.4%Retail REITs 2.3%Trading Companies & Distributors 2.0%Electric Utilities 1.9%Specialized Finance 1.9%Electronic Equipment & Instruments 1.1%Food Retail 1.1%Specialty Chemicals 1.1%Distributors 1.0%Regional Banks 0.8%Short-Term Investments 0.1%
100.0%
* Portfolio composition is subject to change.
2

SEMI-ANNUAL REPORT 2017
PORTFOLIO COMPOSITION – April 30, 2017* (Unaudited)
COMMONWEALTH GLOBAL FUNDCountry orSecurity Type
Percentage of TotalInvestments
United States 38.6%United Kingdom 14.6%Japan 5.7%Short-Term Investments 5.4%Switzerland 5.2%Israel 3.9%Germany 3.1%France 2.7%South Africa 2.4%Chile 2.3%Mexico 2.3%India 2.0%Norway 2.0%Denmark 1.7%Exchange-Traded Funds – United Kingdom 1.6%Canada 1.5%Bermuda 1.5%Exchange-Traded Funds – Gold Miners 1.4%Panama 1.1%Call Options 1.0%
100.0%
COMMONWEALTH REAL ESTATE SECURITIES FUNDIndustry orSecurity Type
Percentage of TotalInvestments
Specialized REITs 16.9%Construction Materials 8.9%Office REITs 8.8%Diversified REITs 7.1%Retail REITs 5.6%Real Estate Operating Companies 4.6%Residential REITs 4.5%Home Improvement Retail 4.3%Thrifts & Mortgage Finance 4.3%Hotels, Resorts & Cruise Lines 4.1%Wireless Telecommunication Services 3.0%Industrial REITs 2.8%Mortgage REITs 2.8%Building Products 2.7%Homebuilding 2.7%Regional Banks 2.6%Airport Services 2.4%Construction & Engineering 2.4%Integrated Telecommunication Services 2.4%Exchange-Traded Funds – China 1.9%Diversified Real Estate Activities 1.4%Health Care REITs 1.1%Restaurants 0.9%Hotels, Resorts REITs 0.8%Real Estate Development 0.5%Short-Term Investments 0.3%Alternative Carriers 0.2%
100.0%
* Portfolio composition is subject to change.
3

SEMI-ANNUAL REPORT 2017
SCHEDULE OF INVESTMENTS – April 30, 2017 (Unaudited)Commonwealth Australia/New Zealand Fund
Shares Fair Value
COMMON STOCKS (92.9%)AUSTRALIA (18.5%)BIOTECHNOLOGY (2.3%)CSL Ltd. 2,500 $ 248,147Sirtex Medical Ltd. 20,000 232,739
480,886
DIVERSIFIED CHEMICALS (0.1%)Alexium International Group Ltd. * 50,000 18,721
DIVERSIFIED SUPPORT SERVICES (1.0%)Brambles Ltd. 25,205 195,162
EDUCATION SERVICES (0.8%)G8 Education Ltd. 62,143 172,180
GAS UTILITIES (1.0%)APA Group 30,000 205,781
HEALTH CARE EQUIPMENT (2.0%)Cochlear Ltd. 4,000 418,991
HEALTH CARE SERVICES (2.2%)Sonic Healthcare Ltd. 27,772 459,400
HUMAN RESOURCE & EMPLOYMENT SERVICES (1.2%)SEEK Ltd. 20,000 255,204
INTERNET SOFTWARE & SERVICES (0.9%)carsales.com Ltd. 20,167 177,296
MULTI-UTILITIES & UNREGULATED POWER (2.6%)AGL Energy Ltd. 26,949 540,029
OIL & GAS EXPLORATION & PRODUCTION (1.0%)Woodside Petroleum Ltd. 8,711 209,915
PROPERTY & CASUALTY INSURANCE (2.5%)QBE Insurance Group Ltd. 20,000 192,751Suncorp Group Ltd. 31,195 322,369
515,120
SPECIALTY STORES (0.9%)Michael Hill International Ltd. 200,000 181,219
3,829,904
NEW ZEALAND (74.4%)AIR FREIGHT & LOGISTICS (8.0%)Fliway Group Ltd. 200,000 145,564Freightways Ltd. 173,540 892,485Mainfreight Ltd. 40,000 606,976
1,645,025
AIRPORT SERVICES (0.2%)Airwork Holdings Ltd. 15,136 46,663
DRUG RETAIL (0.4%)Green Cross Health Ltd. 53,143 82,831
Shares Fair Value
COMMON STOCKS (92.9%) – ContinuedNEW ZEALAND (74.4%) – ContinuedEDUCATION SERVICES (2.4%)Evolve Education Group Ltd. 678,651 $ 503,257
ELECTRIC UTILITIES (4.0%)Genesis Energy Ltd. 200,000 293,189Infratil Ltd. 260,777 528,215
821,404
ELECTRONIC EQUIPMENT MANUFACTURERS (0.6%)ikeGPS Group Ltd. * 478,802 118,353
HEALTH CARE EQUIPMENT (0.9%)Fisher & Paykel Healthcare Corp. Ltd. 26,000 179,772
HEALTH CARE FACILITIES (5.2%)Arvida Group Ltd. 280,000 248,009Ryman Healthcare Ltd. 140,000 829,580
1,077,589
HEALTH CARE SERVICES (1.9%)Abano Healthcare Group Ltd. 67,163 398,901
HOME FURNISHING RETAIL (2.5%)Briscoe Group Ltd. 183,520 511,598
HOME FURNISHINGS (0.8%)Cavalier Corp. Ltd. * 400,000 156,550
HOTELS, RESORTS & CRUISE LINES (1.0%)Millennium & Copthorne Hotels New Zealand
Ltd. 100,000 198,434
INDUSTRIAL MACHINERY (4.0%)Scott Technology Ltd. 316,459 662,730Skellerup Holdings Ltd. 150,000 155,520
818,250
MARINE PORTS & SERVICES (21.5%)Marsden Maritime Holdings Ltd. 81,425 243,202Port of Tauranga Ltd. 75,000 211,652South Port New Zealand Ltd. 970,540 3,998,380
4,453,234
OIL & GAS REFINING, MARKETING & TRANSPORTATION (2.7%)New Zealand Refining Co., Ltd. 345,157 554,564
PACKAGED FOODS & MEATS (2.5%)Sanford Ltd. 53,406 266,957Tegel Group Holdings Ltd. 300,000 245,125
512,082
PERSONAL PRODUCTS (2.0%)Comvita Ltd. 50,000 240,319Trilogy International Ltd. 100,000 180,582
420,901
See accompanying notes to financial statements.
4

SEMI-ANNUAL REPORT 2017
SCHEDULE OF INVESTMENTS – April 30, 2017 (Unaudited)Commonwealth Australia/New Zealand Fund
Shares Fair Value
COMMON STOCKS (92.9%) – ContinuedNEW ZEALAND (74.4%) – ContinuedPROPERTY & CASUALTY INSURANCE (0.8%)TOWER Ltd. 200,000 $ 167,536
REINSURANCE (2.9%)CBL Corp. Ltd. 255,000 609,311
RENEWABLE ELECTRICITY (3.3%)Meridian Energy Ltd. 150,000 285,292Tilt Renewables Ltd. 275,000 407,855
693,147
SPECIALIZED FINANCE (5.8%)Heartland Bank Ltd. 1,052,706 1,199,871
WIRELESS TELECOMMUNICATION SERVICES (1.0%)TeamTalk Ltd. 415,473 199,692
15,368,965TOTAL COMMON STOCKS(Cost $12,670,728) 19,198,869
Principal
CORPORATE BONDS (2.7%)NEW ZEALAND (2.7%)BANKS (2.7%)Credit Agricole SA,
5.04%, 12/29/49 (1) (2) (3) 900,000 568,525TOTAL CORPORATE BONDS(Cost $469,105) 568,525
Shares Fair Value
SHORT-TERM INVESTMENTS (1.5%)Federated Government Obligations Fund,
Institutional Class, 0.65% (4) 305,701 $ 305,701TOTAL SHORT-TERM INVESTMENTS(Cost $305,701) 305,701
TOTAL INVESTMENTS (97.1%)(Cost $13,445,534) 20,073,095
OTHER ASSETS IN EXCESS OF LIABILITIES (2.9%) 593,755
NET ASSETS (100.0%) $20,666,850
* Non-income producing security.
(1) Callable.
(2) Variable rate security. The rate reflected in the Schedule of Investmentsis the rate in effect at April 30, 2017.
(3) Principal amount shown is in New Zealand Dollars; value shown inU.S. Dollars.
(4) Rate disclosed is the seven day effective yield as of April 30, 2017.
The industries shown on the schedule of investments are based on theGlobal Industry Classification Standard, or GICS® (“GICS”). The GICS wasdeveloped by and/or is the exclusive property of MSCI, Inc. and Standard &Poor’s Financial Services LLC (“S&P”). GICS is a service mark of MSCI,Inc. and S&P and has been licensed for use by the Administrator.
See accompanying notes to financial statements.
5

SEMI-ANNUAL REPORT 2017
SCHEDULE OF INVESTMENTS – April 30, 2017 (Unaudited)Africa Fund
Shares Fair Value
COMMON STOCKS (77.4%)EGYPT (0.8%)DIVERSIFIED BANKS (0.8%)Commercial International Bank Egypt SAE 5,000 $ 21,375
SOUTH AFRICA (76.1%)AGRICULTURAL PRODUCTS (1.5%)Crookes Brothers Ltd. 8,000 37,707
AIRLINES (0.5%)Comair Ltd. 35,000 13,066
APPAREL RETAIL (0.5%)Mr. Price Group Ltd. 1,000 11,753
ASSET MANAGEMENT & CUSTODY BANKS (1.2%)Coronation Fund Managers Ltd. 6,500 30,827
AUTOMOTIVE RETAIL (0.9%)Combined Motor Holdings Ltd. 15,000 24,128
CABLE & SATELLITE (5.2%)Naspers Ltd., N Shares 700 132,946
COAL & CONSUMABLE FUELS (0.7%)Exxaro Resources Ltd. 2,000 17,040
CONSTRUCTION & ENGINEERING (1.6%)Murray & Roberts Holdings Ltd. 9,000 9,427Wilson Bayly Holmes-Ovcon Ltd. 3,000 32,217
41,644
DEPARTMENT STORES (0.7%)Woolworths Holdings Ltd. 3,046 16,522
DISTRIBUTORS (1.2%)Imperial Holdings Ltd. ADR 2,400 30,600
DIVERSIFIED BANKS (10.4%)Capitec Bank Holdings Ltd. 2,850 162,592Nedbank Group Ltd. 3,000 50,601Standard Bank Group Ltd. ADR 4,800 52,800
265,993
DIVERSIFIED METALS & MINING (0.0%)eXtract Group Ltd. * 92,847 834
ENVIRONMENTAL & FACILITIES SERVICES (1.0%)Interwaste Holdings Ltd. * 400,000 25,737
FOOD DISTRIBUTORS (2.6%)Bid Corp. Ltd. 3,167 67,087
FOOD RETAIL (3.4%)Shoprite Holdings Ltd. ADR 5,400 85,644
GOLD (1.5%)AngloGold Ashanti Ltd. ADR 2,000 22,860Gold Fields Ltd. ADR 5,000 16,250
39,110
Shares Fair Value
COMMON STOCKS (77.4%) – ContinuedSOUTH AFRICA (76.1%) – ContinuedHEALTH CARE FACILITIES (1.5%)Mediclinic International Ltd. 3,562 $ 37,878
HUMAN RESOURCE & EMPLOYMENT SERVICES (0.8%)Adcorp Holdings Ltd. 20,000 20,499
INDUSTRIAL CONGLOMERATES (2.0%)Bidvest Group Ltd. 4,167 49,728
INDUSTRIAL MACHINERY (1.1%)Howden Africa Holdings Ltd. * 11,000 27,150
INTEGRATED OIL & GAS (1.9%)Sasol Ltd. ADR 1,600 48,832
LIFE & HEALTH INSURANCE (5.9%)Clientele Ltd. 50,000 61,536Discovery Ltd. 9,000 90,093
151,629
MARINE (1.2%)Grindrod Ltd. * 35,000 31,475
OTHER DIVERSIFIED FINANCIAL SERVICES (10.8%)African Phoenix Investments Ltd. * 18,666 810Alexander Forbes Group Holdings Ltd. 50,000 24,091FirstRand Ltd. 14,300 53,333PSG Group Ltd. 10,400 196,894
275,128
PACKAGED FOODS & MEATS (8.2%)Astral Foods Ltd. 4,000 46,386Pioneer Foods Group Ltd. 4,000 49,336RCL Foods Ltd. 27,559 29,649Sovereign Food Investments Ltd. * 60,000 41,523Tiger Brands Ltd. 1,400 42,310
209,204
PHARMACEUTICALS (0.8%)Aspen Pharmacare Holdings Ltd. 1,000 20,741
PRECIOUS METALS & MINERALS (1.8%)Anglo American Platinum Ltd. * 800 19,755Impala Platinum Holdings Ltd. * 8,000 25,707
45,462
TECHNOLOGY DISTRIBUTORS (1.3%)Alviva Holdings Ltd. 20,700 32,600
TRADING COMPANIES & DISTRIBUTORS (2.2%)Barloworld Ltd. 4,300 38,740Invicta Holdings Ltd. 4,000 16,370
55,110
See accompanying notes to financial statements.
6

SEMI-ANNUAL REPORT 2017
SCHEDULE OF INVESTMENTS – April 30, 2017 (Unaudited)Africa Fund
Shares Fair Value
COMMON STOCKS (77.4%) – ContinuedSOUTH AFRICA (76.1%) – ContinuedTRUCKING (0.9%)Value Group Ltd. 87,364 $ 23,073
WIRELESS TELECOMMUNICATION SERVICES (2.8%)MTN Group Ltd. ADR 4,000 37,800Vodacom Group Ltd. 3,000 33,939
71,739
1,940,886
ZAMBIA (0.5%)PACKAGED FOODS & MEATS (0.5%)Zambeef Products PLC * 60,000 14,280
TOTAL COMMON STOCKS(Cost $1,941,017) 1,976,541
EXCHANGE-TRADED FUNDS (12.1%)Global X MSCI Nigeria ETF 5,550 89,299VanEck Vectors Africa Index ETF 10,340 218,692
TOTAL EXCHANGE-TRADED FUNDS(Cost $521,532) 307,991
Principal
SOVERIGN BONDS (0.6%)SOUTH AFRICA (0.6%)South Africa Government Bond,
8.00%, 12/21/18 (1) 200,000 15,046TOTAL SOVERIGN BONDS(Cost $26,250) 15,046
Shares Fair Value
SHORT-TERM INVESTMENTS (8.5%)Federated Government Obligations Fund,
Institutional Class, 0.65% (2) 216,442 $ 216,442TOTAL SHORT-TERM INVESTMENTS(Cost $216,442) 216,442
TOTAL INVESTMENTS (98.6%)(Cost $2,705,241) 2,516,020
OTHER ASSETS IN EXCESS OF LIABILITIES (1.4%) 35,331
NET ASSETS (100.0%) $2,551,351
* Non-income producing security.
(1) Principal amount shown in South African Rand; value shown in U.S.Dollars.
(2) Rate disclosed is the seven day effective yield as of April 30, 2017.
ADR — American Depositary Receipt
ETF — Exchange-Traded Fund
The industries shown on the schedule of investments are based on theGlobal Industry Classification Standard, or GICS® (“GICS”). The GICS wasdeveloped by and/or is the exclusive property of MSCI, Inc. and Standard &Poor’s Financial Services LLC (“S&P”). GICS is a service mark of MSCI,Inc. and S&P and has been licensed for use by the Administrator.
See accompanying notes to financial statements.
7
SEMI-ANNUAL REPORT 2017
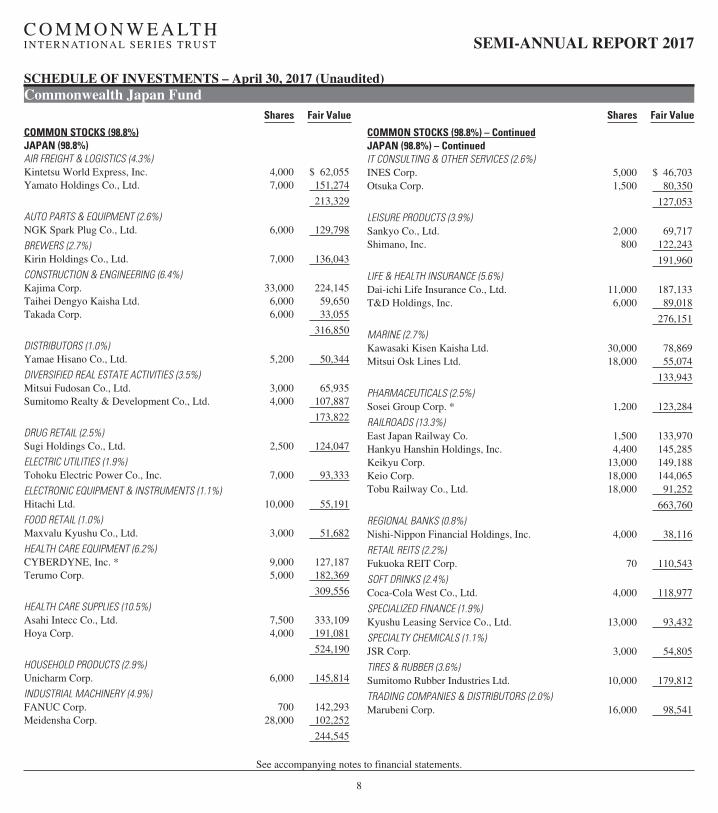
SCHEDULE OF INVESTMENTS – April 30, 2017 (Unaudited)Commonwealth Japan Fund
Shares Fair Value
COMMON STOCKS (98.8%)JAPAN (98.8%)AIR FREIGHT & LOGISTICS (4.3%)Kintetsu World Express, Inc. 4,000 $ 62,055Yamato Holdings Co., Ltd. 7,000 151,274
213,329
AUTO PARTS & EQUIPMENT (2.6%)NGK Spark Plug Co., Ltd. 6,000 129,798
BREWERS (2.7%)Kirin Holdings Co., Ltd. 7,000 136,043
CONSTRUCTION & ENGINEERING (6.4%)Kajima Corp. 33,000 224,145Taihei Dengyo Kaisha Ltd. 6,000 59,650Takada Corp. 6,000 33,055
316,850
DISTRIBUTORS (1.0%)Yamae Hisano Co., Ltd. 5,200 50,344
DIVERSIFIED REAL ESTATE ACTIVITIES (3.5%)Mitsui Fudosan Co., Ltd. 3,000 65,935Sumitomo Realty & Development Co., Ltd. 4,000 107,887
173,822
DRUG RETAIL (2.5%)Sugi Holdings Co., Ltd. 2,500 124,047
ELECTRIC UTILITIES (1.9%)Tohoku Electric Power Co., Inc. 7,000 93,333
ELECTRONIC EQUIPMENT & INSTRUMENTS (1.1%)Hitachi Ltd. 10,000 55,191
FOOD RETAIL (1.0%)Maxvalu Kyushu Co., Ltd. 3,000 51,682
HEALTH CARE EQUIPMENT (6.2%)CYBERDYNE, Inc. * 9,000 127,187Terumo Corp. 5,000 182,369
309,556
HEALTH CARE SUPPLIES (10.5%)Asahi Intecc Co., Ltd. 7,500 333,109Hoya Corp. 4,000 191,081
524,190
HOUSEHOLD PRODUCTS (2.9%)Unicharm Corp. 6,000 145,814
INDUSTRIAL MACHINERY (4.9%)FANUC Corp. 700 142,293Meidensha Corp. 28,000 102,252
244,545
Shares Fair Value
COMMON STOCKS (98.8%) – ContinuedJAPAN (98.8%) – ContinuedIT CONSULTING & OTHER SERVICES (2.6%)INES Corp. 5,000 $ 46,703Otsuka Corp. 1,500 80,350
127,053
LEISURE PRODUCTS (3.9%)Sankyo Co., Ltd. 2,000 69,717Shimano, Inc. 800 122,243
191,960
LIFE & HEALTH INSURANCE (5.6%)Dai-ichi Life Insurance Co., Ltd. 11,000 187,133T&D Holdings, Inc. 6,000 89,018
276,151
MARINE (2.7%)Kawasaki Kisen Kaisha Ltd. 30,000 78,869Mitsui Osk Lines Ltd. 18,000 55,074
133,943
PHARMACEUTICALS (2.5%)Sosei Group Corp. * 1,200 123,284
RAILROADS (13.3%)East Japan Railway Co. 1,500 133,970Hankyu Hanshin Holdings, Inc. 4,400 145,285Keikyu Corp. 13,000 149,188Keio Corp. 18,000 144,065Tobu Railway Co., Ltd. 18,000 91,252
663,760
REGIONAL BANKS (0.8%)Nishi-Nippon Financial Holdings, Inc. 4,000 38,116
RETAIL REITS (2.2%)Fukuoka REIT Corp. 70 110,543
SOFT DRINKS (2.4%)Coca-Cola West Co., Ltd. 4,000 118,977
SPECIALIZED FINANCE (1.9%)Kyushu Leasing Service Co., Ltd. 13,000 93,432
SPECIALTY CHEMICALS (1.1%)JSR Corp. 3,000 54,805
TIRES & RUBBER (3.6%)Sumitomo Rubber Industries Ltd. 10,000 179,812
TRADING COMPANIES & DISTRIBUTORS (2.0%)Marubeni Corp. 16,000 98,541
See accompanying notes to financial statements.
8

SEMI-ANNUAL REPORT 2017
SCHEDULE OF INVESTMENTS – April 30, 2017 (Unaudited)Commonwealth Japan Fund
Shares Fair Value
COMMON STOCKS (98.8%) – ContinuedJAPAN (98.8%) – ContinuedTRUCKING (2.7%)Daiichi Koutsu Sangyo Co., Ltd. 7,200 $ 52,005Nippon Express Co., Ltd. 15,000 82,369
134,374TOTAL COMMON STOCKS(Cost $3,065,392) 4,913,295
SHORT-TERM INVESTMENTS (0.1%)Federated Government Obligations Fund,
Institutional Class, 0.65% (1) 6,383 6,383TOTAL SHORT-TERM INVESTMENTS(Cost $6,383) 6,383
TOTAL INVESTMENTS (98.9%)(Cost $3,071,775) 4,919,678
OTHER ASSETS IN EXCESS OF LIABILITIES (1.1%) 53,042
NET ASSETS (100.0%) $4,972,720
* Non-income producing security.
(1) Rate disclosed is the seven day effective yield as of April 30, 2017.
REIT — Real Estate Investment Trust
The industries shown on the schedule of investments are based on theGlobal Industry Classification Standard, or GICS® (“GICS”). The GICS wasdeveloped by and/or is the exclusive property of MSCI, Inc. and Standard &Poor’s Financial Services LLC (“S&P”). GICS is a service mark of MSCI,Inc. and S&P and has been licensed for use by the Administrator.
See accompanying notes to financial statements.
9

SEMI-ANNUAL REPORT 2017
SCHEDULE OF INVESTMENTS – April 30, 2017 (Unaudited)Commonwealth Global Fund
Shares Fair Value
COMMON STOCKS (93.1%)BERMUDA (1.6%)REINSURANCE (1.6%)Maiden Holdings Ltd. 20,000 $247,000
CANADA (1.5%)OFFICE REITS (1.5%)Brookfield Canada Office Properties 10,000 238,100
CHILE (2.4%)BREWERS (2.4%)Cia Cervecerias Unidas SA ADR 14,401 371,114
DENMARK (1.8%)DIVERSIFIED BANKS (1.8%)Danske Bank A/S ADR 15,000 273,000
FRANCE (2.8%)DIVERSIFIED CHEMICALS (2.8%)Arkema SA ADR 4,130 438,813
GERMANY (3.2%)INDUSTRIAL CONGLOMERATES (3.2%)Siemens AG ADR 7,000 501,963
INDIA (2.0%)DIVERSIFIED BANKS (2.0%)HDFC Bank Ltd. ADR 4,000 318,440
ISRAEL (4.0%)APPLICATION SOFTWARE (2.4%)NICE-Systems Ltd. ADR 5,500 370,975
PHARMACEUTICALS (1.6%)Teva Pharmaceutical Industries Ltd. ADR 8,000 252,640
623,615
JAPAN (5.9%)CONSUMER ELECTRONICS (1.1%)Sony Corp. ADR 5,000 172,600
ELECTRICAL COMPONENTS & EQUIPMENT (2.2%)Nidec Corp. ADR 15,000 345,300
TIRES & RUBBER (2.6%)Bridgestone Corp. 19,000 395,580
913,480
MEXICO (2.3%)BROADCASTING & CABLE TV (2.3%)Grupo Televisa SA ADR 15,000 364,500
NORWAY (2.0%)MULTI-LINE INSURANCE (2.0%)Gjensidige Forsikring ASA ADR 20,000 313,200
Shares Fair Value
COMMON STOCKS (93.1%) – ContinuedPANAMA (1.1%)AIRLINES (1.1%)Copa Holdings SA, Class A 1,500 $ 174,630
SOUTH AFRICA (2.4%)FOOD RETAIL (2.4%)Shoprite Holdings Ltd. ADR 24,000 380,640
SWITZERLAND (5.4%)PACKAGED FOODS & MEATS (2.9%)Nestle SA ADR 5,750 442,744
PHARMACEUTICALS (2.5%)Roche Holding AG ADR 12,000 392,376
835,120
UNITED KINGDOM (15.0%)DISTILLERS & VINTNERS (2.1%)Diageo PLC ADR 2,800 328,804
INTEGRATED OIL & GAS (3.6%)BP PLC ADR 16,327 560,343
LIFE & HEALTH INSURANCE (1.9%)Old Mutual PLC ADR 15,125 303,693
PACKAGED FOODS & MEATS (3.0%)Unilever NV 9,000 470,160
PHARMACEUTICALS (3.3%)AstraZeneca PLC ADR 8,000 242,000GlaxoSmithKline PLC ADR 6,500 265,850
507,850
PUBLISHING (1.1%)Pearson PLC ADR 20,000 164,000
2,334,850
UNITED STATES (39.7%)BIOTECHNOLOGY (2.2%)United Therapeutics Corp. * 2,750 345,675
COMMUNICATIONS EQUIPMENT (1.5%)KVH Industries, Inc. * 30,000 240,000
CONSTRUCTION & ENGINEERING (0.3%)AECOM * 1,500 51,315
CONSTRUCTION MACHINERY & HEAVY TRUCKS (2.9%)Miller Industries, Inc. 18,000 457,200
DIVERSIFIED BANKS (2.8%)Wells Fargo & Co. (1) 8,161 439,388
GAS UTILITIES (1.2%)Northwest Natural Gas Co. 3,000 178,800
See accompanying notes to financial statements.
10

SEMI-ANNUAL REPORT 2017
SCHEDULE OF INVESTMENTS – April 30, 2017 (Unaudited)Commonwealth Global Fund
Shares Fair Value
COMMON STOCKS (93.1%) – ContinuedUNITED STATES (39.7%) – ContinuedHARDWARE, STORAGE & PERIPHERALS (2.3%)NetApp, Inc. 9,000 $ 358,650
HEALTH CARE FACILITIES (2.0%)LifePoint Health, Inc. * 5,000 310,750
HEALTH CARE SUPPLIES (2.0%)Dentsply Sirona, Inc. 5,000 316,200
HOUSEHOLD PRODUCTS (2.0%)Procter & Gamble Co./The 3,500 305,655
INDUSTRIAL MACHINERY (1.6%)Briggs & Stratton Corp. 10,000 249,900
INTEGRATED OIL & GAS (1.7%)Chevron Corp. 2,500 266,750
LIFE SCIENCES TOOLS & SERVICES (2.1%)Thermo Fisher Scientific, Inc. 2,000 330,660
MULTI-LINE UTILITIES & UNREGULATED POWER (2.3%)Public Service Enterprise Group, Inc. 8,000 352,400
OIL & GAS EQUIPMENT & SERVICES (1.8%)Halliburton Co. 6,000 275,280
PACKAGED FOODS & MEATS (2.2%)Cal-Maine Foods, Inc. 3,000 113,250Pilgrim’s Pride Corp. * 8,600 223,256
336,506
RAILROADS (3.6%)Genesee & Wyoming, Inc., Class A * 2,250 152,460Norfolk Southern Corp. 3,500 411,215
563,675
REGIONAL BANKS (0.9%)Umpqua Holdings Corp. 8,000 141,360
REINSURANCE (1.7%)Blue Capital Reinsurance Holdings Ltd. 14,000 264,600
SEMICONDUCTORS (2.6%)Skyworks Solutions, Inc. 4,000 398,960
6,183,724TOTAL COMMON STOCKS(Cost $10,938,667) 14,512,189
EXCHANGE-TRADED FUNDS (3.0%)iShares MSCI United Kingdom ETF 7,500 248,250VanEck Vectors Gold Miners ETF 10,000 222,300
TOTAL EXCHANGE-TRADED FUNDS(Cost $486,789) 470,550
Contracts Fair Value
CALL OPTIONS PURCHASED (1.1%)UNITED STATES (1.1%)Apple, Inc., Strike Price: $90,
Expiration 1/19/18 * 30 $ 161,190TOTAL CALL OPTIONS PURCHASED(Cost $67,441) 161,190
Shares
SHORT-TERM INVESTMENTS (5.5%)Federated Government Obligations Fund,
Institutional Class, 0.65% (2) 861,641 861,641TOTAL SHORT-TERM INVESTMENTS(Cost $861,641) 861,641
TOTAL INVESTMENTS (102.7%)(Cost $12,354,538) 16,005,570
LIABILITIES IN EXCESS OF OTHER ASSETS (-2.7%) (417,486)
NET ASSETS (100.0%) $15,588,084
* Non-income producing security.
(1) Subject to call options written.
(2) Rate disclosed is the seven day effective yield as of April 30, 2017.
ADR — American Depositary Receipt
ETF — Exchange-Traded Fund
PLC — Public Limited Company
The industries shown on the schedule of investments are based on theGlobal Industry Classification Standard, or GICS® (“GICS”). The GICS wasdeveloped by and/or is the exclusive property of MSCI, Inc. and Standard &Poor’s Financial Services LLC (“S&P”). GICS is a service mark of MSCI,Inc. and S&P and has been licensed for use by the Administrator.
SCHEDULE OF WRITTEN OPTIONS – April 30, 2017(Unaudited)
Contracts Fair Value
WRITTEN CALL OPTIONS (-0.0%)UNITED STATES (0.0%)Wells Fargo & Co., Strike Price: $62.50,
Expiration 1/19/18 (40) $(2,880)TOTAL WRITTEN CALL OPTIONS(Premiums Received $12,278) (2,880)
See accompanying notes to financial statements.
11

SEMI-ANNUAL REPORT 2017
SCHEDULE OF INVESTMENTS – April 30, 2017 (Unaudited)Commonwealth Real Estate Securities Fund
Shares Fair Value
COMMON STOCKS (98.1%)AIRPORT SERVICES (2.4%)Grupo Aeroportuario del Sureste SAB de CV ADR 1,300 $246,220
ALTERNATIVE CARRIERS (0.2%)Zayo Group Holdings, Inc. * 500 17,535
BUILDING PRODUCTS (2.7%)Lennox International, Inc. 1,700 281,163
CONSTRUCTION & ENGINEERING (2.4%)Kajima Corp. ADR 2,000 135,821Stuart Olson, Inc. 30,000 118,500
254,321
CONSTRUCTION MATERIALS (9.0%)Boral Ltd. ADR 1,650 30,405Cemex SAB de CV ADR * 27,669 255,108James Hardie Industries PLC ADR 25,000 426,500Summit Materials, Inc., Class A * 2,500 64,150Vulcan Materials Co. 1,300 157,144
933,307
DIVERSIFIED REAL ESTATE ACTIVITIES (1.4%)Lend Lease Group ADR 11,900 142,800
DIVERSIFIED REITS (7.1%)STORE Capital Corp. 6,500 155,935Vornado Realty Trust 1,207 116,162Washington Real Estate Investment Trust 6,000 190,020WP Carey, Inc. 4,470 279,822
741,939
HEALTH CARE REITS (1.1%)Care Capital Properties, Inc. 4,207 113,042
HOME IMPROVEMENT RETAIL (4.3%)Home Depot, Inc./The 325 50,733Kingfisher PLC ADR 20,000 180,100Lowe’s Cos., Inc. 2,600 220,688
451,521
HOMEBUILDING (2.7%)Gafisa SA ADR 1,483 16,877NVR, Inc. * 50 105,562Toll Brothers, Inc. 4,500 161,955
284,394
HOTEL & RESORT REITS (0.8%)Summit Hotel Properties, Inc. 5,200 85,956
HOTELS, RESORTS & CRUISE LINES (4.1%)InterContinental Hotels Group PLC ADR 4,511 238,136Ryman Hospitality Properties, Inc. 3,024 192,871
431,007
Shares Fair Value
COMMON STOCKS (98.1%) – ContinuedINDUSTRIAL REITS (2.8%)EastGroup Properties, Inc. 3,000 $234,750Monmouth Real Estate Investment Corp. 2,000 30,000STAG Industrial, Inc. 1,000 26,360
291,110
INTEGRATED TELECOMMUNICATION SERVICES (2.4%)SBA Communications Corp., Class A * 2,000 252,980
MORTGAGE REITS (2.8%)Annaly Capital Management, Inc. 13,500 159,435Hannon Armstrong Sustainable Infrastructure
Capital, Inc. 3,100 67,952Ladder Capital Corp. 4,534 66,332
293,719
OFFICE REITS (8.8%)Alexandria Real Estate Equities, Inc. 1,850 208,143Boston Properties, Inc. 2,450 310,170Douglas Emmett, Inc. 3,000 113,010SL Green Realty Corp. 2,720 285,410
916,733
REAL ESTATE DEVELOPMENT (0.5%)China Overseas Land & Investment Ltd. ADR 600 52,304
REAL ESTATE OPERATING COMPANIES (4.6%)Farmland Partners, Inc. 9,205 100,334Gladstone Land Corp. 9,700 107,961IRSA Inversiones y Representaciones SA ADR 5,046 127,260IRSA Propiedades Comerciales SA ADR 2,950 141,600
477,155
REGIONAL BANKS (2.6%)PacWest BanCorp 480 23,707Regions Financial Corp. 18,000 247,500
271,207
RESIDENTIAL REITS (4.5%)AvalonBay Communities, Inc. (1) 1,300 246,792Essex Property Trust, Inc. 900 220,023
466,815
RESTAURANTS (0.9%)Luby’s, Inc. * 32,994 97,002
RETAIL REITS (5.7%)Acadia Realty Trust 4,985 144,964Brixmor Property Group, Inc. 5,000 98,750National Retail Properties, Inc. 4,000 168,880Simon Property Group, Inc. (1) 500 82,630Tanger Factory Outlet Centers, Inc. 3,000 93,570
588,794
See accompanying notes to financial statements.
12

SEMI-ANNUAL REPORT 2017
SCHEDULE OF INVESTMENTS – April 30, 2017 (Unaudited)Commonwealth Real Estate Securities Fund
Shares Fair Value
COMMON STOCKS (98.1%) – ContinuedSPECIALIZED REITS (17.0%)CoreCivic, Inc. 350 $ 12,058Crown Castle International Corp. 2,000 189,200CyrusOne, Inc. 1,200 65,568DuPont Fabros Technology, Inc. 2,095 107,997Extra Space Storage, Inc. 5,100 385,203Global Self Storage, Inc. 6,000 29,760HCP, Inc. 2,000 62,700Host Hotels & Resorts, Inc. 7,717 138,520Pebblebrook Hotel Trust 5,000 148,800QTS Realty Trust, Inc., Class A 3,600 192,384Ventas, Inc. 2,750 176,027Welltower, Inc. 1,250 89,300Weyerhaeuser Co. 5,000 169,350
1,766,867
THRIFTS & MORTGAGE FINANCE (4.3%)Georgetown BanCorp, Inc. 10,002 259,552Harleysville Savings Financial Corp. 8,675 188,725
448,277
WIRELESS TELECOMMUNICATION SERVICES (3.0%)American Tower Corp., Class A 2,500 314,850
TOTAL COMMON STOCKS(Cost $7,184,746) 10,221,018
EXCHANGE-TRADED FUNDS (1.9%)Guggenheim China Real Estate ETF 8,500 201,110
TOTAL EXCHANGE-TRADED FUNDS(Cost $144,153) 201,110
SHORT-TERM INVESTMENTS (0.3%)Federated Government Obligations Fund,
Institutional Class, 0.65% (2) 27,253 27,253TOTAL SHORT-TERM INVESTMENTS(Cost $27,253) 27,253
TOTAL INVESTMENTS (100.3%)(Cost $7,356,152) 10,449,381
LIABILITIES IN EXCESS OF OTHER ASSETS (-0.3%) (26,311)
NET ASSETS (100.0%) $10,423,070
* Non-income producing security.
(1) Subject to call options written.
(2) Rate disclosed is the seven day effective yield as of April 30, 2017.
ADR — American Depositary Receipt
ETF — Exchange-Traded Fund
REIT — Real Estate Investment Trust
The industries shown on the schedule of investments are based on theGlobal Industry Classification Standard, or GICS® (“GICS”). The GICS wasdeveloped by and/or is the exclusive property of MSCI, Inc. and Standard &Poor’s Financial Services LLC (“S&P”). GICS is a service mark of MSCI,Inc. and S&P and has been licensed for use by the Administrator.
SCHEDULE OF WRITTEN OPTIONS – April 30, 2017(Unaudited)
Contracts Fair Value
WRITTEN CALL OPTIONS (-0.1%)AvalonBay Communities, Inc., Strike Price: $195,
Expiration 10/20/17 (13) $(7,410)Simon Property Group, Inc., Strike Price: $230,
Expiration 1/19/18 (5) (305)TOTAL WRITTEN CALL OPTIONS(Premiums Received $11,585) (7,715)
See accompanying notes to financial statements.
13

[THIS PAGE INTENTIONALLY LEFT BLANK]
14

SEMI-ANNUAL REPORT 2017
STATEMENTS OF ASSETS AND LIABILITIES – April 30, 2017 (Unaudited)
CommonwealthAustralia/NewZealand Fund Africa Fund
CommonwealthJapan Fund
CommonwealthGlobal Fund
CommonwealthReal Estate
Securities Fund
ASSETSInvestments in securities at value (cost $13,445,534,
$2,705,241, $3,071,775, $12,354,538 and $7,356,152,respectively) $20,073,095 $2,516,020 $4,919,678 $16,005,570 $10,449,381
Foreign currencies, at value (Cost $1,085,910, $26,409, $24,234,$- and $-, respectively) 1,064,556 26,549 24,105 — —
Receivable for fund shares sold — 250 — — —Receivable for investments sold 32,613 — — — —Dividends and interest receivable 3,838 547 30,181 51,538 3,882Tax reclaims receivable — — — 12,916 —Receivable from Advisor — 1,358 1,362 — —Prepaid expenses 16,686 11,907 10,989 15,260 15,150
Total Assets 21,190,788 2,556,631 4,986,315 16,085,284 10,468,413
LIABILITIESOptions written, at value (premium received $-, $-, $-, $12,278
and $11,585, respectively) — — — 2,880 7,715Payable for fund shares redeemed — — — 1,000 —Payable for investments purchased 466,570 — — 445,475 —Payable to Advisor 12,674 — — 9,493 6,427Payable to Administrator 10,208 1,167 2,445 7,261 4,856Payable to trustees 7,767 925 1,913 5,738 3,862Distribution (12b-1) fees accrued 7,632 985 3,360 8,465 11,977Other accrued expenses 19,087 2,203 5,877 16,888 10,506
Total Liabilities 523,938 5,280 13,595 497,200 45,343
NET ASSETS $20,666,850 $2,551,351 $4,972,720 $15,588,084 $10,423,070
NET ASSETS CONSIST OF:Paid-in capital $14,680,254 $2,849,951 $3,608,463 $12,036,119 $ 6,982,783Accumulated net investment income (loss) 42,725 6,140 (28,203) (47,517) 2,288Accumulated net realized gain (loss) from investments, option
contracts and foreign currency transactions (661,528) (115,657) (455,215) (60,946) 340,900Net unrealized appreciation (depreciation) on:
Investment securities 6,605,399 (189,083) 1,847,675 3,651,030 3,093,229Written option contracts — — — 9,398 3,870
NET ASSETS $20,666,850 $2,551,351 $4,972,720 $15,588,084 $10,423,070
Shares outstanding (unlimited number of shares authorized) 1,626,943 292,949 1,435,964 1,078,546 661,449
Net asset value, offering and redemption price per share (a) $ 12.70 $ 8.71 $ 3.46 $ 14.45 $ 15.76
(a) Subject to certain exceptions, a 2% redemption fee is imposed upon shares redeemed within 14 calendar days of their purchase. See Note 3 in the Notesto Financial Statements. Par value $0.01, unlimited shares authorized.
See accompanying notes to financial statements.
15

SEMI-ANNUAL REPORT 2017
STATEMENTS OF OPERATIONS – For the six months ended April 30, 2017 (Unaudited)
CommonwealthAustralia/NewZealand Fund Africa Fund
CommonwealthJapan Fund
CommonwealthGlobal Fund
CommonwealthReal Estate
Securities Fund
INVESTMENT INCOMEDividend income (net of foreign taxes withheld of $60,772,
$4,201, $6,220, $21,768 and $2,719, respectively) $ 289,883 $ 26,741 $ 34,698 $ 197,411 $152,009Interest income 15,890 543 — — —
Total investment income 305,773 27,284 34,698 197,411 152,009
EXPENSESInvestment Advisor 74,715 9,052 18,629 55,961 37,016Distribution (12b-1) 24,905 3,017 6,210 18,654 12,339Administrator 62,470 7,419 15,306 46,050 30,108Legal 20,998 2,498 5,191 15,561 10,227Registration 9,970 10,013 10,159 10,151 10,975Custodian 8,409 1,658 2,773 3,224 2,460Audit 13,641 1,620 3,267 9,741 6,481Trustee 15,788 1,876 3,869 11,616 7,557Insurance 8,620 1,024 2,128 6,460 4,260Printing 7,804 924 1,892 5,383 3,530CCO 14,459 1,712 3,543 10,629 6,961Miscellaneous 1,237 468 520 1,076 775Interest expense 31 — 63 — —
Total expenses 263,047 41,281 73,550 194,506 132,689Fees waived and expense reimbursed by Advisor — (20,137) (29,975) — —
Net operating expenses 263,047 21,144 43,575 194,506 132,689
Net investment income (loss) 42,726 6,140 (8,877) 2,905 19,320
NET REALIZED AND CHANGE IN UNREALIZED GAIN (LOSS)Net realized gain (loss) on:
Investment securities transactions (365,285) (44,214) 64,590 11,473 378,776Foreign currency translations (28,581) 4,177 (7,378) 4 94Purchased option contracts — — — (13,032) —Written option contracts — — — 8,595 10,994
Total net realized gain (loss) (393,866) (40,037) 57,212 7,040 389,864
Net change in unrealized appreciation (depreciation) on:Investments 1,317,594 182,296 78,948 1,073,528 466,327Foreign currency (21,244) (2,443) 2,775 (1) —Purchased option contracts — — — 89,818 11,128Written option contracts — — — (15,212) 4,837
Total net change in unrealized appreciation (depreciation) 1,296,350 179,853 81,723 1,148,133 482,292
Net realized and change in unrealized gain (loss) on investments 902,484 139,816 138,935 1,155,173 872,156
Net increase in net assets resulting from operations $ 945,210 $145,956 $130,058 $1,158,078 $891,476
See accompanying notes to financial statements.
16

SEMI-ANNUAL REPORT 2017
STATEMENTS OF CHANGES IN NET ASSETS
CommonwealthAustralia/New Zealand Fund Africa Fund
For the Six MonthsEnded
April 30, 2017(Unaudited)
For the YearEnded
October 31, 2016
For the Six MonthsEnded
April 30, 2017(Unaudited)
For the YearEnded
October 31, 2016
INCREASE (DECREASE) IN NET ASSETS DUE TO:OPERATIONS:
Net investment income (loss) $ 42,726 $ 340,062 $ 6,140 $ 13,872Net realized gain (loss) (393,866) 278,439 (40,037) (56,842)Net change in unrealized appreciation (depreciation) 1,296,350 2,941,221 179,853 26,481
Change in net assets resulting from operations 945,210 3,559,722 145,956 (16,489)
DISTRIBUTIONS TO SHAREHOLDERS:Net investment income (474,706) (504,861) (15,019) (13,033)Net realized gains — — — —
Change in net assets from distributions (474,706) (504,861) (15,019) (13,033)
CAPITAL TRANSACTIONS:Proceeds from shares sold 2,012,492 2,466,289 165,715 335,997Reinvestment of distributions 468,373 494,045 14,987 13,001Amount paid for shares redeemed (1,557,665) (4,140,438) (158,866) (135,942)Redemption fees 27 328 — —
Change in net assets resulting from capital transactions 923,227 (1,179,776) 21,836 213,056
Net increase (decrease) in net assets 1,393,731 1,875,085 152,773 183,534
NET ASSETS:Beginning of period 19,273,119 17,398,034 2,398,578 2,215,044
End of period $20,666,850 $19,273,119 $2,551,351 $2,398,578
Accumulated net investment income (loss) $ 42,725 $ 474,705 $ 6,140 $ 15,019
SHARE TRANSACTIONS:Shares sold 163,187 212,625 19,534 44,171Shares issued in reinvestment of distributions 39,031 48,152 1,921 1,868Shares redeemed (124,686) (374,650) (19,177) (17,468)
Change in shares outstanding 77,532 (113,873) 2,278 28,571
See accompanying notes to financial statements.
17

SEMI-ANNUAL REPORT 2017
STATEMENTS OF CHANGES IN NET ASSETS
CommonwealthJapan Fund
CommonwealthGlobal Fund
CommonwealthReal Estate Securities Fund
For the Six MonthsEnded
April 30, 2017(Unaudited)
For the YearEnded
October 31, 2016
For the Six MonthsEnded
April 30, 2017(Unaudited)
For the YearEnded
October 31, 2016
For the Six MonthsEnded
April 30, 2017(Unaudited)
For the YearEnded
October 31, 2016
$ (8,877) $ (27,205) $ 2,905 $ (69,223) $ 19,320 $ (1,069)57,212 165,457 7,040 958,352 389,864 (47,320)81,723 (20,820) 1,148,133 (868,079) 482,292 52,592
130,058 117,432 1,158,078 21,050 891,476 4,203
— — — — — —— — (627,731) — — (140,758)
— — (627,731) — — (140,758)
386,566 1,030,910 352,636 695,469 198,707 242,347— — 625,566 — — 139,503
(431,816) (1,596,370) (565,646) (1,281,386) (232,037) (399,645)— — — 65 — —
(45,250) (565,460) 412,556 (585,852) (33,330) (17,795)
84,808 (448,028) 942,903 (564,802) 858,146 (154,350)
4,887,912 5,335,940 14,645,181 15,209,983 9,564,924 9,719,274
$4,972,720 $ 4,887,912 $15,588,084 $14,645,181 $10,423,070 $9,564,924
$ (28,203) $ (19,326) $ (47,517) $ (50,422) $ 2,288 $ (17,032)
116,043 313,141 24,748 51,174 12,882 17,093— — 45,829 — — 10,080
(127,066) (481,700) (40,288) (93,520) (15,407) (28,219)
(11,023) (168,559) 30,289 (42,346) (2,525) (1,046)
See accompanying notes to financial statements.
18

SEMI-ANNUAL REPORT 2017
FINANCIAL HIGHLIGHTSCommonwealth Australia/New Zealand FundSelected data for a share outstanding throughout each of the periods indicated:
For the sixmonths ended
4/30/2017
For the yearended
10/31/2016
For the yearended
10/31/2015
For the yearended
10/31/2014
For the yearended
10/31/2013
For the yearended
10/31/2012(Unaudited)
Net Asset Value, Beginning of Period $ 12.44 $ 10.46 $ 12.54 $ 13.25 $ 12.05 $ 10.76
Change in net assets from operations:Net investment income 0.03 0.21 0.18 0.15 0.21 0.14Net realized and unrealized gain (loss) from investments 0.54 2.08 (1.38) (0.40) 1.15 1.27
Total from investment activities 0.57 2.29 (1.20) (0.25) 1.36 1.41
Distributions:Net investment income (0.31) (0.31) (0.11) (0.22) (0.16) (0.12)Net realized gains — — (0.77) (0.24) — —
Total distributions (0.31) (0.31) (0.88) (0.46) (0.16) (0.12)
Redemption fees —(a) —(a) — —(a) —(a) —(a)
Net Asset Value, End of Period $ 12.70 $ 12.44 $ 10.46 $ 12.54 $ 13.25 $ 12.05
Total Return 4.70%(b) 22.51% (10.15)% (1.74)% 11.40% 13.31%
Net assets at end of period (000’s) $20,667 $19,273 $17,398 $20,501 $23,766 $22,347
Ratios/Supplemental Data:Ratio of net expenses to average net assets 2.64%(c) 2.84% 3.29% 3.08% 3.17% 3.32%Ratio of gross expenses before waivers and/or reimbursements 2.64%(c) 2.84% 3.31% 3.08% 3.17% 3.32%Ratio of net investment income to average net assets 0.43%(c) 1.92% 1.55% 1.11% 1.59% 1.26%Portfolio turnover rate 20%(b) 26% 9% 16% 18% 8%
(a) Value is less than $0.005 per share.
(b) Not annualized for periods less than one year.
(c) Annualized for periods less than one year.
19
See accompanying notes to financial statements.

SEMI-ANNUAL REPORT 2017
FINANCIAL HIGHLIGHTSAfrica FundSelected data for a share outstanding throughout each of the periods indicated:
For the sixmonths ended
4/30/2017
For the yearended
10/31/2016
For the yearended
10/31/2015
For the yearended
10/31/2014
For the yearended
10/31/2013
For the periodended
10/31/2012(a)(Unaudited)
Net Asset Value, Beginning of Period $ 8.25 $ 8.45 $ 9.96 $10.38 $10.23 $10.00
Change in net assets from operations:Net investment income 0.02 0.05 0.07 0.01 0.22 0.08Net realized and unrealized gain (loss) from investments 0.49 (0.20) (1.58) (0.25) 0.09 0.15
Total from investment activities 0.51 (0.15) (1.51) (0.24) 0.31 0.23
Distributions:Net investment income (0.05) (0.05) — (0.14) (0.16) —Return of capital — — — (0.04) — —
Total distributions (0.05) (0.05) — (0.18) (0.16) —
Redemption fees — — — —(b) —(b) —
Net Asset Value, End of Period $ 8.71 $ 8.25 $ 8.45 $ 9.96 $10.38 $10.23
Total Return 6.28%(c) (1.67)% (15.16)% (2.32)% 3.02% 2.30%(c)
Net assets at end of period (000’s) $2,551 $2,399 $ 2,215 $2,478 $2,099 $1,356
Ratios/Supplemental Data:Ratio of net expenses to average net assets 1.75%(d) 1.75% 1.84%(e) 2.00% —% 0.70%(d)Ratio of gross expenses before waivers and/or
reimbursements 3.42%(d) 4.04% 5.99% 5.69% 6.13% 8.32%(d)Ratio of net investment income to average net assets 0.51%(d) 0.67% 0.75% 0.11% 2.28% 1.32%(d)Portfolio turnover rate 3%(c) 13% 1% 4% 7% —%(c)
(a) Reflects operations for the period from November 7, 2011 (inception date) to October 31, 2012.
(b) Value is less than $0.005 per share.
(c) Not annualized for periods less than one year.
(d) Annualized for periods less than one year.
(e) Effective March 1, 2015, the Fund’s Board approved a fee reduction agreement between the Trust and FCA Corp that limits Fund expenses to 1.50% ofaverage net assets, exclusive of the 0.25% distribution fee.
20
See accompanying notes to financial statements.

SEMI-ANNUAL REPORT 2017
FINANCIAL HIGHLIGHTSCommonwealth Japan FundSelected data for a share outstanding throughout each of the periods indicated:
For the sixmonths ended
4/30/2017
For the yearended
10/31/2016
For the yearended
10/31/2015
For the yearended
10/31/2014
For the yearended
10/31/2013
For the yearended
10/31/2012(Unaudited)
Net Asset Value, Beginning of Period $ 3.38 $ 3.30 $ 3.05 $ 3.08 $ 2.54 $ 2.70
Change in net assets from operations:Net investment loss (0.01) (0.03) (0.07) (0.05) (0.10) (0.07)Net realized and unrealized gain (loss) from investments 0.09 0.11 0.32 0.02 0.64 (0.09)
Total from investment activities 0.08 0.08 0.25 (0.03) 0.54 (0.16)
Redemption fees — — — —(a) —(a) —(a)
Net Asset Value, End of Period $ 3.46 $ 3.38 $ 3.30 $ 3.05 $ 3.08 $ 2.54
Total Return 2.37%(b) 2.42% 8.20% (0.97)% 21.26% (5.93)%
Net assets at end of period (000’s) $4,973 $4,888 $5,336 $4,902 $4,444 $4,017
Ratios/Supplemental Data:Ratio of net expenses to average net assets 1.75%(c) 2.03%(d) 3.55% 3.49% 4.40% 4.84%Ratio of gross expenses before waivers and/or reimbursements 2.96%(c) 3.22% 4.33% 4.24% 4.40% 4.84%Ratio of net investment loss to average net assets (0.36)%(c) (0.54)% (2.35)% (2.22)% (3.03)% (3.01)%Portfolio turnover rate 4%(b) 4% 10% 9% 23% 20%
(a) Value is less than $0.005 per share.
(b) Not annualized for periods less than one year.
(c) Annualized for periods less than one year.
(d) Effective March 1, 2016, the Fund’s Board approved a fee reduction agreement between the Trust and FCA Corp that limits Fund expenses to 1.50% ofaverage net assets, exclusive of the 0.25% distribution fee.
21
See accompanying notes to financial statements.

SEMI-ANNUAL REPORT 2017
FINANCIAL HIGHLIGHTSCommonwealth Global FundSelected data for a share outstanding throughout each of the periods indicated:
For the sixmonths ended
4/30/2017
For the yearended
10/31/2016
For the yearended
10/31/2015
For the yearended
10/31/2014
For the yearended
10/31/2013
For the yearended
10/31/2012(Unaudited)
Net Asset Value, Beginning of Period $ 13.97 $ 13.95 $ 16.78 $ 17.00 $ 14.13 $ 15.24
Change in net assets from operations:Net investment gain (loss) —(a) (0.07) (0.15) (0.08) (0.12) (0.12)Net realized and unrealized gain (loss) from investments 1.08 0.09 (1.35) 0.50 2.99 0.54
Total from investment activities 1.08 0.02 (1.50) 0.42 2.87 0.42
Distributions:Net realized gains (0.60) — (1.33) (0.64) — (1.53)
Total distributions (0.60) — (1.33) (0.64) — (1.53)
Redemption fees — —(a) —(a) — —(a) —(a)
Net Asset Value, End of Period $ 14.45 $ 13.97 $ 13.95 $ 16.78 $ 17.00 $ 14.13
Total Return 8.02%(b) 0.14% (9.42)% 2.56% 20.31% 3.47%
Net assets at end of period (000’s) $15,588 $14,645 $15,210 $16,637 $15,959 $13,311
Ratios/Supplemental Data:Ratio of net expenses to average net assets 2.60%(c) 2.92% 3.31% 3.08% 3.12% 3.31%Ratio of gross expenses before waivers and/or reimbursements 2.60%(c) 2.92% 3.34% 3.08% 3.12% 3.31%Ratio of net investment gain (loss) to average net assets 0.04%(c) (0.48)% (1.03)% (0.52)% (0.81)% (0.85)%Portfolio turnover rate 5%(b) 45% 45% 27% 14% 11%
(a) Value is less than $0.005 per share.
(b) Not annualized for periods less than one year.
(c) Annualized for periods less than one year.
22
See accompanying notes to financial statements.

SEMI-ANNUAL REPORT 2017
FINANCIAL HIGHLIGHTSCommonwealth Real Estate Securities FundSelected data for a share outstanding throughout each of the periods indicated:
For the sixmonths ended
4/30/2017
For the yearended
10/31/2016
For the yearended
10/31/2015
For the yearended
10/31/2014
For the yearended
10/31/2013
For the yearended
10/31/2012(Unaudited)
Net Asset Value, Beginning of Period $ 14.41 $14.62 $14.35 $12.55 $11.27 $ 9.72
Change in net assets from operations:Net investment income (loss) 0.03 —(a) (0.14) 0.02 (0.02) (0.13)Net realized and unrealized gain (loss) from investments 1.32 —(a) 0.41 1.78 1.30 1.68
Total from investment activities 1.35 — 0.27 1.80 1.28 1.55
Distributions:Net realized gains — (0.21) — — — —
Total distributions — (0.21) — — — —
Redemption fees — — — — —(a) —(a)
Net Asset Value, End of Period $ 15.76 $14.41 $14.62 $14.35 $12.55 $11.27
Total Return 9.37%(b) 0.07% 1.88% 14.34% 11.36% 15.95%
Net assets at end of period (000’s) $10,423 $9,565 $9,719 $9,537 $8,362 $7,824
Ratios/Supplemental Data:Ratio of net expenses to average net assets 2.68%(c) 2.93% 3.35% 3.20% 3.33% 3.53%Ratio of gross expenses before waivers and/or reimbursements 2.68%(c) 2.93% 3.38% 3.20% 3.33% 3.53%Ratio of net investment income (loss) to average net assets 0.39%(c) (0.01)% (0.93)% 0.10% (0.18)% (1.20)%Portfolio turnover rate 8%(b) 12% 10% 16% 4% 5%
(a) Value is less than $0.005 per share.
(b) Not annualized for periods less than one year.
(c) Annualized for periods less than one year.
23
See accompanying notes to financial statements.

SEMI-ANNUAL REPORT 2017
NOTES TO FINANCIAL STATEMENTS – April 30, 2017 (Unaudited)
Note 1 – Organization
Commonwealth International Series Trust (the ‘‘Trust’’) was organized as a Massachusetts business trust on May 2, 1986,and is registered under the Investment Company Act of 1940, as amended (the ‘‘1940 Act’’), as an open-end managementinvestment company. The Trust currently consists of five diversified series: the Commonwealth Australia/New Zealand Fund(the ‘‘Australia/New Zealand Fund’’), the Africa Fund, the Commonwealth Japan Fund (the ‘‘Japan Fund’’), theCommonwealth Global Fund (the ‘‘Global Fund’’) and the Commonwealth Real Estate Securities Fund (the ‘‘Real EstateSecurities Fund’’) (each a ‘‘Fund’’ and collectively the ‘‘Funds’’).
Note 2 – Investment Objectives
Each Fund’s investment objective is to provide long-term capital appreciation and current income. Under normal marketconditions, each Fund (other than the Global Fund) invests at least 80% of its assets in the country or asset class specified inits name (i.e., Australia/New Zealand, Africa, Japan or Real Estate).
Note 3 – Significant Accounting Policies
The Funds are investment companies and follow accounting and reporting guidance under Financial Accounting StandardsBoard Accounting Standards Codification (‘‘ASC’’) Topic 946, ‘‘Financial Services-Investment Companies.” The followingis a summary of significant accounting policies followed by the Funds in the preparation of their financial statements. Thesepolicies are in conformity with the generally accepted accounting principles in the United States of America (‘‘GAAP’’).
A) Valuation of Securities – Each Fund’s assets and liabilities are valued normally on the basis of market quotations orofficial closing prices or, if there is no recent last sales price available, reference is made to the last mean quotation in theprincipal market in which the securities are normally traded. Equity securities that are traded on the NASDAQ NationalMarket System, for which quotations are readily available, are valued at the official closing price. Options are valued at thelast quoted sales price. If there is no such reported sale on the valuation date, long positions are valued at the most recent bidprice, and short positions are valued at the most recent ask price. Debt securities are priced either by using a market quotationor an independent pricing service. The pricing service may use one or more pricing models. Short-term debt securities withremaining maturities of 60 days or less at the time of purchase may be valued at amortized cost only if the Trust canreasonably conclude, at each time it makes a valuation determination, that the amortized cost value of the portfolio security isapproximately the same as the fair value of the security as determined without the use of amortized cost valuation.Investments in open-end investment companies are valued at net asset value. If Fund management determines that marketquotations or official closing prices are not readily available or do not accurately reflect the fair value for a security, the fairvalue of the security or securities will be determined in accordance with procedures established by the Board of Trustees (the‘‘Board’’). Fair value prices are generally provided by an independent fair value pricing service. The Funds have instituted apolicy whereby the value of certain equity securities listed or traded on foreign security exchanges may be valued by anindependent fair value pricing service on any day when certain conditions are met. The Australia/New Zealand Fund, AfricaFund and Japan Fund have retained an independent fair value pricing service to assist in the fair valuing of these foreignsecurities. The service utilizes statistical data based on historical performance of securities, markets, and other data indeveloping factors used to estimate a fair value. In the Australia/New Zealand Fund and Japan Fund, the measure is based ona comparison between the S&P 500® Futures Index at the time of Tokyo market close to the S&P 500® Futures Index at thetime of the New York market close. In the Africa Fund, the measure is based on a comparison between the S&P 500®
Futures Index at the time of London market close to the S&P 500® Futures Index at the time of the New York market close.
24

SEMI-ANNUAL REPORT 2017
NOTES TO FINANCIAL STATEMENTS – April 30, 2017 (Unaudited) – (Continued)
B) Fair Value Measurements – The Funds’ investments have been categorized by tiers dependent upon the various ‘‘inputs’’used to determine the fair value of the Funds’ investments. These inputs are summarized in the three broad levels listedbelow:
• Level 1 – unadjusted quoted prices in active markets for identical investments and/or registered investmentcompanies where the value per share is determined and published and is the basis for current transactions foridentical assets or liabilities at the valuation date
• Level 2 – other significant observable inputs (including quoted prices for similar securities, interest rates,prepayments speeds, credit risk, etc.)
• Level 3 – significant unobservable inputs (including management’s own assumptions in determining the fair valueof investments)
A description of the valuation techniques applied to the Funds’ major categories of assets and liabilities measured at fairvalue on a recurring basis follows:
Common stocks, preferred stocks and exchange-traded funds. Securities traded on a national exchange (or reported on theNASDAQ national market) are stated at the last reported sales price on the day of valuation. Investments in other open-endregistered investment companies, including money market funds, are valued at net asset value. To the extent these securitiesare actively traded and valuation adjustments are not applied, they are generally categorized in Level 1 of the fair valuehierarchy. Securities traded on inactive markets, valued by reference to similar instruments or whose inputs are observableand timely would be categorized in Level 2 of the fair value hierarchy.
Corporate and Sovereign Bonds. The fair value of corporate bonds may be estimated using recently executed transactions,market price quotations (where observable), bond spreads, and/or credit default swap spreads adjusted for any basisdifference between cash and derivative instruments. Domestically held corporate bonds are generally categorized in Level 2of the fair value hierarchy; in instances where prices, spreads, or any of the other aforementioned key inputs areunobservable, they would be categorized in Level 3 of the fair value hierarchy.
Written/Purchased Options. Listed derivatives that are actively traded are valued based on quoted prices from the exchangeand are generally categorized in Level 1 of the fair value hierarchy.
The inputs or methodology used for valuing securities are not necessarily an indication of the risk associated with investingin those securities.
The following is a summary of the inputs used to value the Funds’ investments as of April 30, 2017:
Australia/New Zealand FundLevel 1 Level 2 Level 3 Total
Security TypeCommon Stocks(1) $15,200,489 $3,998,380(2) $ — $19,198,869Corporate Bonds 568,525 — — 568,525Short-Term Investments 305,701 — — 305,701
Total $16,074,715 $3,998,380 $ — $20,073,095
25

SEMI-ANNUAL REPORT 2017
NOTES TO FINANCIAL STATEMENTS – April 30, 2017 (Unaudited) – (Continued)
Africa FundLevel 1 Level 2 Level 3 Total
Security TypeCommon Stocks(1) $ 1,976,541 $ — $ — $ 1,976,541Exchange-Traded Funds 307,991 — — 307,991Sovereign Bonds — 15,046 — 15,046Short-Term Investments 216,442 — — 216,442
Total $ 2,500,974 $15,046 $ — $ 2,516,020
Japan FundLevel 1 Level 2 Level 3 Total
Security TypeCommon Stocks(1) $ 4,913,295 $ — $ 4,913,295Short-Term Investments 6,383 — — 6,383
Total $ 4,919,678 $ — $ — $ 4,919,678
Global FundLevel 1 Level 2 Level 3 Total
Security TypeCommon Stocks(1) $14,512,189 $ — $ — $14,512,189Exchange-Traded Funds 470,550 — — 470,550Call Options 161,190 — — 161,190Short-Term Investments 861,641 — — 861,641
Total $16,005,570 $ — $ — $16,005,570
Real Estate Securities FundLevel 1 Level 2 Level 3 Total
Security TypeCommon Stocks(1) $10,221,018 $ — $ — $10,221,018Exchange-Traded Funds 201,110 — — 201,110Short-Term Investments 27,253 — — 27,253
Total $10,449,381 $ — $ — $10,449,381
(1) All sub-categories within Common Stocks represent Level 1 or Level 2 evaluation status. For a detailed breakout by industry or country, please refer tothe Schedules of Investments.
(2) Consists of the holding: South Port New Zealand Ltd. listed under New Zealand.
The following is a summary of other financial instruments that are derivative instruments not reflected in the Schedules ofInvestments, such as futures, written options, forwards and swap contracts. Please refer to Note 6 – Financial Instrumentswith Off-Balance Sheet Risk for additional information.
Other Financial Instruments at ValueFund Level 1 Level 2 Level 3 TotalGlobal Fund
Written Options $(2,880) $ — $ — $(2,880)Real Estate Securities Fund
Written Options $(7,715) $ — $ — $(7,715)
26
SEMI-ANNUAL REPORT 2017
NOTES TO FINANCIAL STATEMENTS – April 30, 2017 (Unaudited) – (Continued)
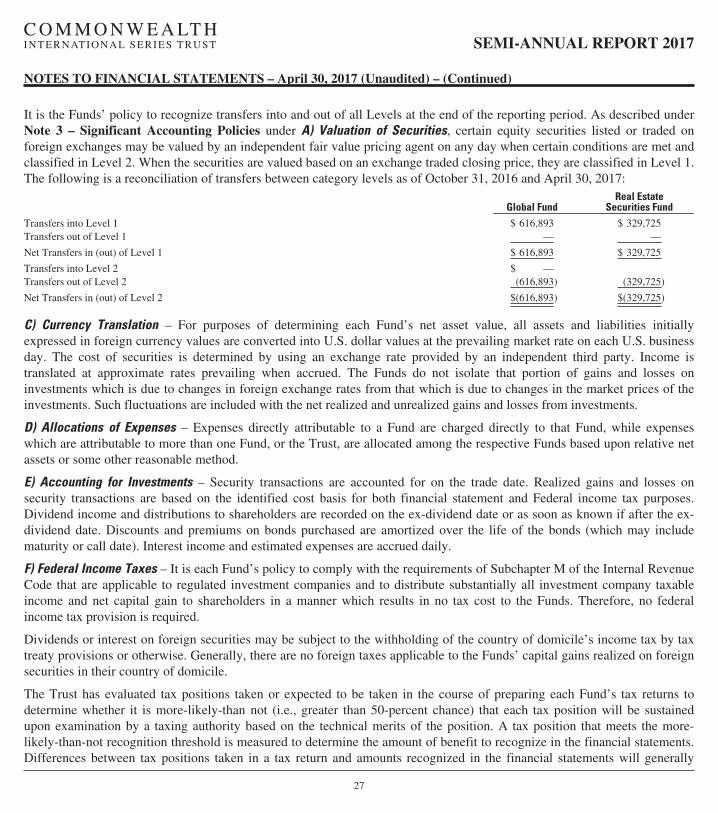
It is the Funds’ policy to recognize transfers into and out of all Levels at the end of the reporting period. As described underNote 3 – Significant Accounting Policies under A) Valuation of Securities, certain equity securities listed or traded onforeign exchanges may be valued by an independent fair value pricing agent on any day when certain conditions are met andclassified in Level 2. When the securities are valued based on an exchange traded closing price, they are classified in Level 1.The following is a reconciliation of transfers between category levels as of October 31, 2016 and April 30, 2017:
Global FundReal Estate
Securities FundTransfers into Level 1 $ 616,893 $ 329,725Transfers out of Level 1 — —
Net Transfers in (out) of Level 1 $ 616,893 $ 329,725
Transfers into Level 2 $ —Transfers out of Level 2 (616,893) (329,725)
Net Transfers in (out) of Level 2 $(616,893) $(329,725)
C) Currency Translation – For purposes of determining each Fund’s net asset value, all assets and liabilities initiallyexpressed in foreign currency values are converted into U.S. dollar values at the prevailing market rate on each U.S. businessday. The cost of securities is determined by using an exchange rate provided by an independent third party. Income istranslated at approximate rates prevailing when accrued. The Funds do not isolate that portion of gains and losses oninvestments which is due to changes in foreign exchange rates from that which is due to changes in the market prices of theinvestments. Such fluctuations are included with the net realized and unrealized gains and losses from investments.
D) Allocations of Expenses – Expenses directly attributable to a Fund are charged directly to that Fund, while expenseswhich are attributable to more than one Fund, or the Trust, are allocated among the respective Funds based upon relative netassets or some other reasonable method.
E) Accounting for Investments – Security transactions are accounted for on the trade date. Realized gains and losses onsecurity transactions are based on the identified cost basis for both financial statement and Federal income tax purposes.Dividend income and distributions to shareholders are recorded on the ex-dividend date or as soon as known if after the ex-dividend date. Discounts and premiums on bonds purchased are amortized over the life of the bonds (which may includematurity or call date). Interest income and estimated expenses are accrued daily.
F) Federal Income Taxes – It is each Fund’s policy to comply with the requirements of Subchapter M of the Internal RevenueCode that are applicable to regulated investment companies and to distribute substantially all investment company taxableincome and net capital gain to shareholders in a manner which results in no tax cost to the Funds. Therefore, no federalincome tax provision is required.
Dividends or interest on foreign securities may be subject to the withholding of the country of domicile’s income tax by taxtreaty provisions or otherwise. Generally, there are no foreign taxes applicable to the Funds’ capital gains realized on foreignsecurities in their country of domicile.
The Trust has evaluated tax positions taken or expected to be taken in the course of preparing each Fund’s tax returns todetermine whether it is more-likely-than not (i.e., greater than 50-percent chance) that each tax position will be sustainedupon examination by a taxing authority based on the technical merits of the position. A tax position that meets the more-likely-than-not recognition threshold is measured to determine the amount of benefit to recognize in the financial statements.Differences between tax positions taken in a tax return and amounts recognized in the financial statements will generally
27

SEMI-ANNUAL REPORT 2017
NOTES TO FINANCIAL STATEMENTS – April 30, 2017 (Unaudited) – (Continued)
result in an increase in a liability for taxes payable (or a reduction of a tax refund receivable), including the recognition ofany related interest and penalties as an operating expense. Tax positions taken in tax years remain subject to examination bytax authorities (generally three years plus the interim tax period since then for federal income tax purposes). Thedetermination has been made that there are not any uncertain tax positions that would require the Funds to record a taxliability and, therefore, there is no impact to the Funds’ financial statements.
G) Distributions to Shareholders – The Funds distribute net investment income, if any, and net realized gains (net of anycapital loss carryovers) annually. Income and capital gain distributions are determined in accordance with income taxregulations which may differ from GAAP. These differences are primarily due to differing treatments for foreign currencytransactions and deferrals of certain losses.
H) Redemption Fees – Redemption fees are applicable to certain redemptions of shares within fourteen calendar days ofpurchase. The redemption fee is imposed to discourage abusive trading activity, which can have disruptive effects on theFunds’ portfolio management and can increase the Funds’ expenses. The redemption fees are intended to offset, at leastpartially, portfolio transaction and administrative costs associated with short-term trading. The shareholder will be charged afee equal to 2.00% of the amount redeemed and will be charged when shares are sold, exchanged or involuntarily redeemed.In determining the applicability of the redemption fee, shares held for the longest period of time will be treated as being soldfirst and shares held for the shortest period of time as being sold last. For the six months ended April 30, 2017, the Australia/New Zealand Fund, had contributions to capital due to redemption fees in the amount of $27.
I) Option Accounting Principles – A Fund may purchase or write put or call options on futures contracts, individualsecurities, currencies or stock indices to hedge against fluctuations in securities prices and currency exchange rates and toadjust its risk exposure relative to the benchmark. The Fund may use these derivatives for any purpose consistent with itsinvestment objective, such as hedging, obtaining market exposure, and generating premium income.
When a Fund writes an option, the premium received is recorded as a liability. Each day the option contract liability is valuedin accordance with the procedures for security valuation discussed above. When an offsetting option is purchased (a closingtransaction) or the option contract expires, the Fund realizes a gain or loss and the liability related to such option contract iseliminated. When a call option is exercised, the Fund realizes a gain or loss from the sale of the underlying security and theproceeds of the sale are increased by the premiums originally received.
When a Fund purchases an option, the premium paid is recorded as an asset. Each day, the option contract is valued inaccordance with the procedures for security valuation discussed above. When an offsetting option is written (a closingtransaction) or the option contract expires, the Fund realizes a gain or loss and the asset representing such option contract iseliminated. When a call option is exercised, the Fund purchases the underlying security and the cost basis of such purchase isincreased by the premium originally paid.
J) Forward Currency Contracts – Forward currency transactions may be undertaken to hedge against possible variations inthe foreign exchange rates between the U.S. dollar and foreign currencies. A forward currency contract is an agreementbetween two parties to buy or sell a currency at a set price on a future date. Forward contracts are marked-to-market dailyand the change in the market value is recorded by the Fund as an unrealized gain or loss. When a contract is closed, the Fundrecords a realized gain or loss equal to the difference between the value of the contract at the time it was opened and thevalue at the time it was closed. The Funds could be exposed to risk if the counterparties are unable to meet the terms of thecontracts or if the value of the currency changes unfavorably. Other risks of forward currency transactions include failing to
28

SEMI-ANNUAL REPORT 2017
NOTES TO FINANCIAL STATEMENTS – April 30, 2017 (Unaudited) – (Continued)
achieve expected benefit, markets moving in a direction that the Funds did not expect, a Fund’s ability to close out itsposition in the hedging instrument, and political and social unrest and the possibility of negative governmental actions.During and as of the six months ended April 30, 2017, the Funds held no foreign currency contracts.
K) Use of Estimates – The preparation of the financial statements in conformity with GAAP requires management to makeestimates and assumptions that affect the reported amounts of assets and liabilities and the disclosure of contingent assets andliabilities at the date of the financial statements and the reported amounts of increases and decreases in net assets fromoperations during the reporting period. Actual results could differ from those estimates and these differences could bematerial.
Note 4 – Related Party Transactions and Other Arrangements
A) Investment Advisor – The Trust, on behalf of each Fund, has retained FCA Corp as the Funds’ investment advisor (the‘‘Advisor’’). Under each Fund’s Investment Advisory Agreement, the Advisor is paid a fee (the ‘‘Management Fee’’),calculated daily and payable monthly, equal to an annual rate of 0.75% of the average net assets of each Fund.
The Advisor entered into an expense limitation agreement through February 28, 2018, under which it has agreed to limit thetotal expenses of the Africa Fund and Japan Fund (exclusive of interest, distribution fees pursuant to Rule 12b-1 Plans, taxes,acquired fund fees and expenses, brokerage commissions, extraordinary expenses and dividend expense on short sales) to anannual rate of 1.50% and 1.50% of the average daily net assets of the Africa Fund and Japan Fund, respectively. The Advisormay not terminate this arrangement prior to February 28, 2018, unless the investment advisory agreement is terminated. TheAfrica Fund and Japan Fund each have agreed to repay the Advisor for amounts waived by the Advisor pursuant to the feewaiver agreement to the extent that such repayment occurs within three years of the date of any such waiver and suchrepayment does not cause the Fund to exceed the expense limitation in place at the time the fee was waived. For the sixmonths ended April 30, 2017, the Advisor waived and reimbursed a total of $20,137 and $29,975 in the Africa Fund andJapan Fund, respectively, which is subject to recoupment.
The amounts subject to recoupment by the Funds, pursuant to the aforementioned conditions are as follows:Fund Amount Recoupment Available Through
Africa Fund $28,775 October 31, 2017$78,909 October 31, 2018$47,361 October 31, 2019$20,137 October 31, 2020
Japan Fund $46,885 October 31, 2019$29,975 October 31, 2020
Certain officers of the Trust are also officers of the Advisor.
B) Administration, Fund Accounting and Transfer Agent – Ultimus Asset Services, LLC (the “Administrator”), serves as theadministrator, transfer agent and fund accountant to the Funds. For these services, the Administrator receives fees computedat an annual rate of the daily net assets of the Funds, subject to a minimum annual contractual fee. Certain officers of theTrust are also employees of the Administrator, but are paid no fees directly by the Funds for serving as an officer of theTrust.
C) Distribution – Unified Financial Securities, LLC (‘‘Unified’’), an affiliate of The Administrator, serves as the principalunderwriter for the shares of each Fund of the Trust and receives an annual contractual fee.
29

SEMI-ANNUAL REPORT 2017
NOTES TO FINANCIAL STATEMENTS – April 30, 2017 (Unaudited) – (Continued)
Each Fund has adopted a Service and Distribution Plan (each a ‘‘Plan’’) pursuant to Rule 12b-1 under the Act, whereby up to0.35% of the Funds’ assets may be used to reimburse the Distributor for costs and expenses incurred in connection with thedistribution and marketing of shares of the Funds and the servicing of the Funds shareholders. Distribution and marketingexpenses include, among other things, printing of prospectuses, marketing literature, and costs of personnel involved with thepromotion and distribution of the Funds’ shares. These amounts are disclosed on the Statements of Operations underDistribution (12b-1) fees. While the plans permit each Fund to pay up to 0.35% of its average daily net assets to reimbursefor certain expenses in connection with the distribution of its shares, the Board of Trustees has currently authorized eachFund to pay out only 0.25% under its Plan. If the Trustees’ intention changes on this matter, the Funds will amend orsupplement their prospectus. Out of the foregoing amount, each Fund is permitted to pay up to an aggregate of 0.25% of itsaverage daily net assets to reimburse for certain shareholder services.
D) Legal Counsel – The Law Offices of John H. Lively and Associates, Inc., a member firm of The 1940 Act Law GroupTM,serves as legal counsel to the Trust. John H. Lively, Secretary of the Trust, is the owner of the Law Offices of John H.Lively & Associates, Inc., but he receives no special compensation from the Trust or the Funds for serving as an officer ofthe Trust.
Note 5 – Purchases and Sales of Securities
Purchases and sales of investment securities (excluding short-term securities) by the Funds for the six months endedApril 30, 2017, were as follows:
Purchases Sales
Australia/New Zealand Fund $3,908,354 $4,077,366Africa Fund 70,328 146,965Japan Fund 173,142 209,094Global Fund 2,079,809 707,446Real Estate Securities Fund 941,589 751,105
Note 6 – Financial Instruments with Off-Balance Sheet Risk
In the ordinary course of trading activities, certain of the Funds may trade and hold certain derivative contracts. Suchcontracts include forward currency contracts, where the Funds would be obligated to buy currency at specified prices, andwritten put and call options, where the Funds would be obligated to purchase or sell securities at specified prices (i.e., theoptions are exercised by the counterparties). The maximum payout for the put option contracts is limited to the number ofcontracts written and the related strike prices, respectively. The maximum payout for uncovered written call option contractsis limited only by how high the underlying rises above the strike price. Maximum payout amounts could be offset by thesubsequent sale, if any, of assets obtained via the execution of a payout event.
These financial instruments contain varying degrees of off-balance sheet risk whereby changes in the market value ofsecurities underlying the financial instruments may be in excess of the amounts recognized in the Statements of Assets andLiabilities. A Fund, as writer of an option, bears the market risk of an unfavorable change in the price of the securityunderlying the written option. The risk associated with purchasing an option is that the Fund pays a premium whether or notthe option is exercised. Additionally, each Fund bears the risk of loss of premium and change in market value should thecounterparty not perform under the contract. A call option gives the holder the right to buy the underlying stock from thewriter at a specified price within a fixed period of time. Therefore, the securities held by the Fund against which options are
30

SEMI-ANNUAL REPORT 2017
NOTES TO FINANCIAL STATEMENTS – April 30, 2017 (Unaudited) – (Continued)
written may not be traded and are held in escrow by the custodian. In the ordinary course of trading activities, certain of theFunds trade and hold certain fair-valued derivative contracts. Such contracts include forward currency contracts, where theFunds would be obligated to buy currency at specified prices, and written put and call options, where the Funds would beobligated to purchase or sell securities at specified prices (i.e., the options are exercised by the counterparties). Themaximum payout for the put option contracts is limited to the number of contracts written and the related strike prices,respectively. The maximum payout for uncovered written call option contracts is limited only by how high the underlyingrises above the strike price. Maximum payout amounts could be offset by the subsequent sale, if any, of assets obtained viathe execution of a payout event.
The following is a summary of the written option activity:
Global Fund Real Estate Securities Fund
ContractsNumber ofContracts
PremiumsReceived
Number ofContracts
PremiumsReceived
Outstanding at 10/31/2016 98 $ 30,490 167 $ 48,598Call options written 40 12,278 22 9,523Call options expired (28) (8,596) (37) (17,079)Call options exercised (70) (21,894) (125) (26,784)Call options closed — — (9) (2,673)
Outstanding at 4/30/2017 40 $ 12,278 18 $ 11,585
Note 7 – Derivatives
The Funds’ use of derivatives for the six months ended April 30, 2017, was limited to options. The derivative instrumentsoutstanding as of April 30, 2017, as disclosed in the Statements of Assets and Liabilities, and the amounts of realized andchanges in unrealized gains and losses on derivative instruments during the period, as disclosed in the Statements ofOperations, serve as indicators of the volume of derivative activity for the Funds. Following is a summary of how thesederivatives are treated in the financial statements and their impact on the Funds.
Statements of Assets and Liabilities Statements of Operations
Fund/Financial Instrument Type
Location ofAsset/Liability
Derivatives ValueLocation of Gain (Loss) onDerivatives Recognized
Amount ofRealized
Gain (Loss)
Amount ofUnrealizedGain (Loss)
Global FundEquity Contracts Investments in securities at
value (purchased options)$161,190 Net realized loss from
purchased option contracts$(13,032)
Equity Contracts Options written, at value(written options)
(2,880) Net realized gain fromwritten option contracts
8,595
Equity Contracts Net change in unrealizedappreciation (depreciation) onpurchased option contracts
$ 89,818
Equity Contracts Net change in unrealizedappreciation (depreciation) onwritten option contracts
(15,212)
31

SEMI-ANNUAL REPORT 2017
NOTES TO FINANCIAL STATEMENTS – April 30, 2017 (Unaudited) – (Continued)
Statements of Assets and Liabilities Statements of Operations
Fund/Financial Instrument Type
Location ofAsset/Liability
Derivatives ValueLocation of Gain (Loss) onDerivatives Recognized
Amount ofRealized
Gain (Loss)
Amount ofUnrealizedGain (Loss)
Real Estate Securities FundEquity Contracts Options written, at value
(written options)$ (7,715) Net realized gain from
written option contracts$ 10,994
Equity Contracts Net change in unrealizedappreciation (depreciation) onpurchased option contracts
$ 11,128
Equity Contracts Net change in unrealizedappreciation (depreciation) onwritten option contracts
4,837
Balance Sheet Offsetting Information During the ordinary course of business, the Funds may enter into transactions subjectto enforceable netting agreements or other similar arrangements (‘‘netting agreements’’). Generally, the right to offset innetting agreements allows a Fund to offset any exposure to a specific counterparty with any collateral received or deliveredto that counterparty based on the terms of the agreement. Generally, a Fund manages its cash collateral and securitiescollateral on a counterparty basis. As of April 30, 2017, the Funds were not invested in any portfolio securities or derivativesthat could be netted subject to netting arrangements. The following table provides a summary of amounts related toderivative instruments and amounts related to financial instruments and cash collateral not offset in the Statements of Assetsand Liabilities as of April 30, 2017.
Gross AmountsPresented inStatements of
Assets andLiabilities
Amounts not Offset in Statementsof Assets and Liabilities
Fund/DerivativeFinancial
InstrumentsCash
CollateralNet
AmountGlobal Fund
Purchased options $161,190 $(161,190) $ — $ —Written options (2,880) 2,880
Real Estate Securities FundPurchased options — —Written options (7,715) 7,715 — —
Note 8 – Tax Matters
At April 30, 2017, the gross unrealized appreciation (depreciation) on investments, foreign currency translations and cost ofsecurities on a tax basis for federal income tax purposes were as follows:
Australia/NewZealand Fund Africa Fund Japan Fund Global Fund
Real EstateSecurities Fund
Gross unrealized appreciation $ 7,572,574 $ 372,244 $1,961,081 $ 3,793,185 $3,488,373Gross unrealized depreciation (945,013) (561,465) (129,762) (210,138) (398,849)
Net unrealized appreciation (depreciation) on investments $ 6,627,561 $ (189,221) $1,831,319 $ 3,583,047 $3,089,524
Tax cost of investments $13,445,534 $2,705,241 $3,088,359 $12,422,523 $7,359,857
32

SEMI-ANNUAL REPORT 2017
NOTES TO FINANCIAL STATEMENTS – April 30, 2017 (Unaudited) – (Continued)
The difference between cost amounts for financial statement and federal income tax purposes is due primarily to wash saleloss deferrals, foreign currency translations and passive foreign investment companies (‘‘PFICs’’).
As of October 31, 2016, the Funds’ most recent fiscal year end, the components of accumulated earnings (deficit) on a taxbasis were as follows:
Australia/NewZealand Fund Africa Fund Japan Fund Global Fund
Real EstateSecurities Fund
Undistributed ordinary income $ 474,705 $ 15,019 $ — $ — $ —Undistributed long-term capital gains — — — 627,730 —
Tax accumulated earnings 474,705 15,019 — 627,730 —Accumulated capital and other losses (267,662) (75,620) (515,169) (50,422) (62,291)Unrealized appreciation (depreciation) on investments 5,309,967 (371,517) 1,752,371 2,419,701 2,612,069Unrealized appreciation (depreciation) on options written — — — 24,610 (967)Unrealized appreciation (depreciation) on foreign currency (918) 2,581 (3,003) (1) —
Total accumulated earnings (deficit) $5,516,092 $(429,537) $1,234,199 $3,021,618 $2,548,811
The tax character of distributions paid during the tax period ended October 31, 2016, was as follows:
Australia/NewZealand Fund
AfricaFund
Real EstateSecurities Fund
YearEnded
October 31,2016
YearEnded
October 31,2016
YearEnded
October 31,2016
Distributions paid from:Ordinary income $504,861 $13,033 $ —Net long-term capital gains — — 138,753Tax return of capital — — 2,005
Total distributions paid $504,861 $13,033 $140,758
For the tax year ended October 31, 2016, the Japan Fund and Global Fund did not pay any distributions.
As of October 31, 2016, the following Funds had net capital loss carryforwards which are available to offset future netcapital gains, if any:
Australia/New Zealand Africa Fund Japan FundReal Estate Securities
FundShort-Term Long-Term Short-Term Long-Term Short-Term Long-Term Short-Term Long-Term
For losses expiring October 31,2017 $ — $ — $ — $ — $512,427 $ — $ — $ —2018 — — — — — — — —
Non-Expiring 190,766 76,896 8,865 66,755 — — — 45,258
$190,766 $76,896 $8,865 $66,755 $512,427 $ — $ — $45,258
Capital loss carryovers are available to offset future realized capital gains and thereby reduce further taxable gaindistributions. During the fiscal year ended October 31, 2016, the Japan Fund utilized $157,266 of its capital loss carryovers.
33

SEMI-ANNUAL REPORT 2017
NOTES TO FINANCIAL STATEMENTS – April 30, 2017 (Unaudited) – (Continued)
As of October 31, 2016, the Japan, Global and Real Estate Securities Funds, respectively, had $2,742, $50,422 and $17,033of qualified late-year ordinary losses, which were deferred until fiscal year 2016 for tax purposes. Net late-year lossesincurred after December 31 and within the taxable year are deemed to arise on the first day of the Funds’ next taxable year.
Note 9 – Revolving Credit Agreement
The Trust has in place an Amended and Restated Revolving Credit Agreement (the ‘‘Agreement’’) with its custodian, FifthThird Bank N.A. (the ‘‘Bank’’). Pursuant to the terms of the Agreement, the Bank makes available to the Trust, a line ofcredit facility under which the Bank may make loans to the Trust, on behalf of the Funds, from time to time. The Agreementprovides a line of credit in an amount of up to $2,000,000 (the ‘‘Committed Amount’’) for the Trust with respect to all of theFunds. The Agreement further limits the amount that any Fund may borrow subject to the requirements specified by the 1940Act, which generally permits a fund to borrow and pledge its shares to secure such borrowing, provided, that immediatelythereafter there is asset coverage of at least 300% for all borrowings by a fund from a bank. If borrowings exceed this 300%asset coverage requirement by reason of a decline in net assets of a fund, the fund will reduce its borrowings within threedays to the extent necessary to comply with the 300% asset coverage requirement. The 1940 Act also permits a fund toborrow for temporary purposes only in an amount not exceeding 5% of the value of its total assets at the time when the loanis made. The terms of the agreement include a non-refundable commitment fee annually in an amount equal to $2,000. Anyprincipal balance outstanding bears interest at the London Interbank Offered Rate in effect at that time plus 1.90% and anyamounts not drawn will be assessed unused fees at the rate 0.40%.
The average amount of borrowings for the days which the Funds borrowed and the average interest rate on those borrowingsby the Funds during the six months ended April 30, 2017, were as follows:
Average Principal Average Interest Rate
Australia/New Zealand Fund $74,009 2.49%Japan Fund $84,627 2.69%
During the six months ended April 30, 2017, the Australia/New Zealand Fund and Japan Fund paid $31and $63 in interest onborrowings, respectively. There were no borrowings outstanding under the Agreement as of April 30, 2017. The Funds onlyutilize the line of credit for draws greater than $50,000.
Note 10 – Contractual Obligations
Under the Funds’ organizational documents, its Trustees and Officers are indemnified against certain liabilities arising out ofthe performance of their duties to the Funds. In the normal course of business, the Funds enter into contracts that containvarious representations and warranties and provide general indemnifications. The Funds’ maximum exposure under thesearrangements is dependent on future claims against the Funds and is presently unknown. Currently however, the Fundsexpect the risk of loss to be remote.
Note 11 – Concentration of Market Risk
The Australia/New Zealand Fund has a majority of its investments in securities issued by Australian and New Zealandissuers, the Africa Fund invests primarily in securities issued by African issuers and the Japan Fund invests primarily insecurities of Japanese issuers. Investing in companies from specific geographic regions, such as Australia, New Zealand,Africa or Japan, may pose additional risks inherent to a region’s economic and political situation. These events will not
34

SEMI-ANNUAL REPORT 2017
NOTES TO FINANCIAL STATEMENTS – April 30, 2017 (Unaudited) – (Continued)
necessarily affect the U.S. economy or similar issuers located in the U.S. In addition, many of the investments in Australia,New Zealand, Africa or Japan are denominated in foreign currencies. As a result, changes in the values of these currenciescompared to the U.S. dollar may affect (positively or negatively) the value of the Funds’ investments. These events mayhappen separately from, and in response to, events that do not otherwise affect the values of the securities in the issuers’home countries.
The Africa Fund may be exposed to additional risks by focusing its investments on issuers in African countries to whichother funds invested in securities of issuers in a broader region may not be exposed. The Fund is highly dependent on thestate of economics of countries throughout Africa and, in particular Sub-Saharan countries. Changes in economics, taxpolicies, inflation rates, governmental instability, war or other political or economic factors may affect (positively ornegatively) the Fund’s investments.
A large portion of investments held by the Real Estate Securities Fund are considered investments in the real estate sector ofthe market, which may include REITs. Investing in REITs involves certain unique risks in addition to those risks associatedwith investing in the real estate industry in general. Equity REITs may be affected by changes in the value of the underlyingproperty owned by the REITs, while mortgage REITs may be affected by the quality of any credit extended. REITs aredependent upon management skills, are not diversified, are subject to heavy cash flow dependency, default by borrowers andself-liquidation. REITs are also subject to the possibilities of failing to qualify for tax-free pass through of income andmaintaining their exemption from registration under the 1940 Act. Investing in a single market sector may be riskier thaninvesting in a variety of market sectors.
Note 12 – Recent Accounting Pronouncements
In October 2016, the Securities and Exchange Commission (the ‘‘SEC’’) released its Final Rule on Investment CompanyReporting Modernization (the ‘‘Rule’’). The Rule which introduces two new regulatory reporting forms for investmentcompanies – Form N-PORT and Form N-CEN – also contains amendments to Regulation S-X which impact financialstatement presentation, particularly the presentation of derivative investments. Although still evaluating the impact of theRule, management believes that many of the Regulation S-X amendments are consistent with the Funds’ current financialstatement presentation and expects that the Funds will be able to comply with the Rule’s Regulation S-X amendments by theAugust 1, 2017 compliance date.
Note 13 – Subsequent Events
Management of the Funds has evaluated the need for disclosures resulting from subsequent events through the date thesefinancial statements were issued. Based upon this evaluation, management has determined there were no items requiringadjustment of the financial statements or additional disclosure.
35

SEMI-ANNUAL REPORT 2017
APPROVAL OF THE RENEWAL OF THE INVESTMENT ADVISORY AGREEMENT – April 30, 2017 (Unaudited)
FCA Corp (“FCA” or “Advisor”) supervises the investments of the following series portfolios (each may be referred toherein as a “Fund” or collectively as the “Funds”) of the Commonwealth International Series Trust (the “Trust”): theCommonwealth Australia/New Zealand Fund (the “Australia/New Zealand Fund”), the Africa Fund, (the “Africa Fund”) theCommonwealth Japan Fund (the “Japan Fund”), The Commonwealth Global Fund (the “Global Fund”) and theCommonwealth Real Estate Securities Fund (the “Real Estate Fund”) pursuant to the Investment Advisory Agreements (eachan “Agreement” and collectively, the “Agreements”) between the Advisor and the Trust with respect to each Fund. At thequarterly meeting of the Board of Trustees (the “Board”) of the Trust that was held on March 22, 2017, the Trustees,including a majority of the trustees who are not parties to the Agreements or interested persons of any party to any of theAgreements (the “Independent Trustees”), unanimously approved the renewal of the Agreements for another one year term.
Legal Counsel reviewed with the Board his memorandum dated February 17, 2017 and summarized to the Trustees, amongother things, the fiduciary duties and responsibilities of the Board in reviewing and approving the renewal of eachAgreement. Counsel discussed with the Trustees the types of information and factors that should be considered by the Boardin order to make an informed decision regarding the approval of the continuation of each Agreement, including the followingmaterial factors with respect to each of the Funds: (i) the nature, extent, and quality of the services provided by FCA; (ii) theinvestment performance of the Funds; (iii) the costs of the services to be provided and profits to be realized by FCA from therelationship with the Funds; (iv) the extent to which economies of scale would be realized if the Funds grow and whetheradvisory fee levels reflect those economies of scale for the benefit of the Funds’ investors; and (v) FCA’s practices regardingpossible conflicts of interest. Counsel noted that the continuation of the Agreements were discussed during meetings of theGovernance, Nomination and Compensation Committee (“GNC”) held on the following dates: (i) March 22, 2017 at ameeting of the GNC held prior to the Board meeting; (ii) January 26, 2017 at a special meeting of the GNC; and(iii) December 20, 2016 in preliminary discussions with FCA at the Board’s quarterly meeting. It was noted that membersmet individually on occasion as well at various times between the December 20, 2016 meeting of the Board and the meetingheld on March 22, 2017. Counsel and the Board recapped the discussions that had occurred in these earlier meetings.
In assessing these factors and reaching its decisions, the Board took into consideration information furnished for the Board’sreview and consideration throughout the year at regular Board meetings, as well as information specifically prepared and/orpresented in connection with the annual renewal process. The Board, acting directly or through its committees, requested andwas provided with information and reports relevant to the annual renewal of each Agreement, including: (i) reports regardingthe services and support provided to the Funds and their shareholders by FCA; (ii) quarterly assessments of the investmentperformance of the Funds by personnel of FCA; (iii) commentary on the reasons for each Fund’s performance;(iv) presentations by the Funds’ portfolio managers addressing FCA’s investment philosophy, investment strategy, personneland operations; (v) compliance and audit reports concerning the Funds and FCA; (vi) disclosure information contained in theregistration statement of the Trust and the Form ADV of FCA and (vii) a memorandum from Counsel that summarized thefiduciary duties and responsibilities of the Board in reviewing and approving each Agreement, including the material factorsset forth above and the types of information included in each factor that should be consider by the Board in order to make aninformed decision. The Board also requested and received various informational materials including, without limitation:(i) documents containing information about FCA, including financial information on FCA and the parent company of FCA(First Commonwealth Holdings), a description of personnel and the services provided to each Fund, information oninvestment advice, performance, summaries of fund expenses, compliance program, current legal matters, insurancecoverages and other general information; comparative expense and performance information for other mutual funds withstrategies similar to the Funds; (iii) the effect of size on the Funds’ performance and expenses; (iv) FCA’s efforts to promote
36

SEMI-ANNUAL REPORT 2017
APPROVAL OF THE RENEWAL OF THE INVESTMENT ADVISORY AGREEMENT – April 30, 2017 (Unaudited) – (Continued)
and market the Funds; and (v) benefits to be realized by FCA from its relationship with the Funds. In their deliberations, theBoard did not identify any particular factor that was most important in to its consideration to approve the continuation of theAgreements and each Trustee may have afforded different weight to the various factors that are specifically required to beconsidered for purposes of disclosure in the Funds’ next set of financial statements.
Nature, Extent and Quality of the Services Provided by FCA
In considering the nature, extent, and quality of the services provided by FCA, the Trustees reviewed the responsibilities ofFCA under each Agreement. The Trustees reviewed the services being provided by FCA to each Fund including, withoutlimitation: (i) the quality of its investment advisory services (including research and recommendations with respect toportfolio securities); (ii) its process for formulating investment recommendations and assuring compliance with each Fund’sinvestment objectives and limitations, as well as for ensuring compliance with regulatory requirements; (ii) its coordinationof services for the Funds among the service providers and the Independent Trustees; and (iii) its efforts to promote andmarket the Funds and grow each Fund’s assets. The Trustees noted FCA’s continuity of, and commitment to retain, qualifiedpersonnel and FCA’s commitment to maintain and enhance its resources and systems; the commitment of FCA’s personnelto finding alternatives and options that allow the Funds to maintain their goals; and FCA’s continued cooperation with theIndependent Trustees, the chief compliance officer and Counsel for the Funds. The Trustees evaluated FCA’s personnel,including the education and experience of FCA’s personnel. The Trustees noted that several of the officers of the Trust,including the principal executive officer and president for the Trust were employees of FCA, and they served the Trustwithout additional compensation. The Trustees noted the continued efforts of FCA in marketing the Funds, including theimplementation of a formal marketing plan. After reviewing the foregoing information and further information in thematerials provided by FCA (including FCA’s Form ADV), the Board concluded that, in light of all the facts andcircumstances, the nature, extent, and quality of the services provided by FCA were satisfactory and adequate for the Funds.
Investment Performance of the Funds and FCA
In considering the investment performance of the Funds and FCA, the Trustees compared the short and long-termperformance of each Fund with the performance of funds with similar objectives managed by other investment advisors, aswell as with aggregated peer group data. The Trustees also considered the consistency of FCA’s management of the Fundswith the investment objectives and policies. The Trustees considered that FCA did not have other accounts that weremanaged in a manner similar to any of the Funds.
With respect to the Australia/New Zealand Fund, the Trustees indicated their belief that the investment strategy of theAustralia/New Zealand Fund made it difficult to compare the investment performance of the Australia/New Zealand Fund toother mutual funds. The Trustees noted that there were no other registered investment companies that FCA was able toidentify that had the same investment objective and strategies as the Australia/New Zealand Fund. Nonetheless, the Trusteesnoted the overall relative performance that the Australia/New Zealand Fund had experienced on a short and long-term basisin comparison to two different indices and a Morningstar peer group category (“Morningstar Category”). The Trusteesobserved that the Australia/New Zealand Fund outperformed both indices for the six-month and one-year period endedDecember 31, 2016, underperformed one index and outperformed one index for the three-year and five-year periods andunderperformed both indices for the ten-year period ended December 31, 2016. The Trustees also noted that the Australia/New Zealand Fund outperformed the average and median of its Morningstar Category for the one-year, three-year, five-yearand ten-year periods ended December 31, 2016.
37

SEMI-ANNUAL REPORT 2017
APPROVAL OF THE RENEWAL OF THE INVESTMENT ADVISORY AGREEMENT – April 30, 2017 (Unaudited) – (Continued)
With respect to the Africa Fund, the Trustees reviewed the Africa Fund’s performance compared to two indices, aMorningstar Category and an alternative Morningstar peer group category provided by FCA (“Alternative Category”) on ashort and long-term basis. The Trustees observed that the Africa Fund outperformed both of its indices for the six-monthperiod ended December 31, 2016, outperformed one index and underperformed one index for the one-year and three-yearperiods ended December 31, 2016 and underperformed both indices for the five-year period ended December 31, 2016. TheTrustees observed that the Africa Fund outperformed the median and average of its Morningstar Category for the one-yearperiod ended December 31, 2016 and underperformed the median and average of its Morningstar Category for the three-yearand five-year periods ended December 31, 2016. Further, with respect to the Africa Fund’s Alternative Category, theTrustees noted that the Fund outperformed the median and average for the one-year period ended December 31, 2016 andunderperformed the median and average for the three-year and five-year periods ended December 31, 2016.
With respect to the Japan Fund, the Trustees noted the overall relative performance that the Fund had experienced on a shortand long-term basis in comparison to one index and a Morningstar Category. The Trustees noted that the Japan Fund hadunderperformed its comparative index for the six-month, one-year, three-year, five-year and ten-year periods endedDecember 31, 2016. It was also noted that the Japan Fund outperformed the average of its Morningstar Category for the one-year and three-year periods ended December 31, 2016, and underperformed the average of its Morningstar Category for thefive-year and ten-year periods ended December 31, 2016. In addition, it was noted that the Japan Fund outperformed themedian of its Morningstar Category for the three-year period ended and underperformed the median of its MorningstarCategory for the one-year, five-year and ten-year periods ended December 31, 2016.
With respect to the Global Fund, the Trustees reviewed the Global Fund’s performance compared to one index and aMorningstar Category on a short and long-term basis. The Trustees observed that the Fund had underperformed its index forthe short-term and longer-term periods, including the six-month, one-year, three-year, five-year and ten-year periods endedDecember 31, 2016. It was noted that the Global Fund outperformed its Morningstar Category for the one-year period andunderperformed its Morningstar Category for the three-year, five-year and ten-year periods ended December 31, 2016.
With respect to the Real Estate Fund, the Trustees reviewed the Real Estate Fund’s performance compared to one index and aMorningstar Category on a short and long-term basis. The Trustees noted that the Real Estate Fund had outperformed itscomparative index for the six-month period and underperformed its comparative index for the one-year, three-year, five-yearand ten-year periods ended December 31, 2016. It was noted that the Real Estate Fund outperformed the average and medianof its Morningstar Category for the one-year period and underperformed the average and median of its Morningstar Categoryfor the three-year, five-year and ten-year periods ended December 31, 2016.
After reviewing and discussing the short and long-term investment performance of the Funds further, FCA’s experiencemanaging the Funds, FCA’s historical investment performance, and other relevant factors, the Board concluded, in light ofall the facts and circumstances, that the investment performance of each of the Funds and FCA was satisfactory.
Costs of the Services to be Provided and Profits to be Realized by FCA
In considering the costs of the services to be provided and profits to be realized by FCA from the relationship with the Funds,the Trustees considered: (1) FCA’s financial condition (as reflected in the financial statements of its parent company) and thelevel of commitment to the Funds and FCA by the principals of FCA; (2) the asset level of each of the Funds; (3) the overallexpenses of the Funds; and (4) the nature and frequency of advisory fee payments. The Trustees reviewed informationprovided by FCA regarding its profits associated with managing the Funds. The Trustees also considered potential benefits
38

SEMI-ANNUAL REPORT 2017
APPROVAL OF THE RENEWAL OF THE INVESTMENT ADVISORY AGREEMENT – April 30, 2017 (Unaudited) – (Continued)
for FCA in managing the Funds. The Trustees noted that FCA continues to be unprofitable with regard to its relationshipwith the Funds. The Trustees then compared the advisory fees and net and/or gross operating expenses of the Funds to othercomparable mutual funds. The Trustees noted that while the Funds’ advisory fees were generally in line with other funds (inall cases lower or equal to the respective category average), the Australia/New Zealand Fund and the Real Estate Fund’s totalexpenses were above the expense levels of the other identified comparable funds (having the highest or near highest totalexpenses compared to their respective peer categories); while the Africa Fund, Japan Fund and Global Fund’s total expenseswere in line with or slightly above their respective peer categories. The Trustees noted that the relatively smaller asset levelsof the Funds limited meaningful comparisons with other funds. The Trustees considered the Africa Fund’s management feewaivers and certain contractual expense limitations that FCA had instituted since the Fund’s inception. The Trustees alsoconsidered the Japan Fund’s contractual fee waiver. The Trustees concluded that given the very small asset levels of theFunds, it would be difficult for any adviser to operate the Funds at average cost levels and that FCA had put forth significantand reasonable efforts to control the operating expenses of the Funds. The Trustees noted and discussed FCA’s efforts tomanage the expenses of the Funds. The Board concluded that although Fund expenses were higher than peer averages, suchexpenses were justified and unavoidable given the complex regulatory requirements, the unique composition of the Funds,and most importantly, the relatively small levels of assets in each of the Funds. Based on the foregoing, the Board concludedthat the fees to be paid to FCA by the Funds and the profits to be realized by FCA, in light of all the facts and circumstances,were fair and reasonable in relation to the nature and quality of the services provided by FCA.
Economies of Scale
The Board next considered the impact of economies of scale on the Funds’ size and whether advisory fee levels reflect thoseeconomies of scale for the benefit of the Funds’ investors. The Trustees noted that while the management fee for the Fundswould remain the same at all asset levels, the Funds’ shareholders could benefit from economies of scale under the Funds’agreements with service providers other than FCA if applicable asset levels are attained by the Funds. The Trusteesrecognized that FCA put in place a contractual fee waiver for the Africa Fund and the Japan Fund. The Trustees recognizedFCA’s prior negotiations with service providers to the Trust to reduce fees in the previous fiscal year and that suchreductions would be carried into the current fiscal year without further negotiations, as applicable. In light of its ongoingconsideration of the Funds’ asset levels, expectations for growth in the Funds, and fee levels, the Board determined that theFunds’ fee arrangements, in light of all the facts and circumstances, were fair and reasonable in relation to the nature andquality of the services provided by FCA.
Advisor’s Practices Regarding Possible Conflicts of Interest and Benefits to the Adviser
In considering FCA’s practices regarding conflicts of interest, the Trustees evaluated the potential for conflicts of interest andconsidered such matters as follows: (i) the experience and ability of the advisory personnel assigned to the Funds; (ii) the basisfor soft dollar payments with broker-dealers; (iii) the basis of decisions to buy or sell securities for the Funds and/or FCA’s otheraccounts, including other accounts that may invest in similar geographic areas in which the Funds invest; and (iv) the substanceand administration of FCA’s code of ethics. The Trustees also considered disclosure in the registration statement of the Trustrelated to FCA’s potential conflicts of interest. The Trustees also noted that FCA may enjoy some enhanced status as aninvestment adviser to a family of registered mutual funds. Based on the foregoing, the Board determined that FCA’s standardsand practices relating to the identification and mitigation of possible conflicts of interest were satisfactory.
Based upon all of the foregoing considerations, the Board, including a majority of the Independent Trustees, approved therenewal of the Agreements for the Funds for an additional one-year period.
39

SEMI-ANNUAL REPORT 2017
ADDITIONAL INFORMATION – April 30, 2017 (Unaudited)
Table of Shareholder Expenses
As a shareholder of the Funds, you incur ongoing costs, including management fees, distribution and service fees, and otherFund expenses. This example is intended to help you understand your ongoing costs (in dollars) of investing in the Funds andcompare these costs with the ongoing costs of investing in other mutual funds.
The example is based on an investment of $1,000 invested at the beginning of the period and held for the entire period fromNovember 1, 2016 through April 30, 2017.
Actual Expenses
The table below provides information about actual account values and actual expenses. You may use the information below,together with the amount you invested, to estimate the expenses that you paid over the period. Simply divide your accountvalue by $1,000 (for example, an $8,600 account value divided by $1,000 = 8.6), then multiply the result by the number inthe table under the heading entitled ‘‘Expenses Paid During Period’’ to estimate the expenses you paid on your accountduring this period.
BeginningAccount Value
11/1/2016
EndingAccount Value
4/30/2017
Expenses PaidDuring Period*11/1/16 – 4/30/17
Expense RatioDuring Period*11/1/16 – 4/30/17
Australia/New Zealand Fund $1,000.00 $1,047.00 $13.39 2.64%Africa Fund 1,000.00 1,062.80 8.95 1.75%Japan Fund 1,000.00 1,023.70 8.79 1.75%Global Fund 1,000.00 1,080.20 13.43 2.60%Real Estate Securities Fund 1,000.00 1,093.70 13.94 2.68%
Hypothetical Example for Comparison Purposes
The table below provides information about hypothetical account values and hypothetical expenses based on each Fund’sactual expense ratio and an assumed rate of return of 5% per year before expenses, which is not the Fund’s actual return. Thehypothetical account values and expenses may not be used to estimate the actual ending account balance or expenses youpaid for the period. You may use this information to compare this 5% hypothetical example with the 5% hypotheticalexamples that appear in the shareholder reports of other funds.
Please note that the expenses shown in the table are meant to highlight your ongoing costs only and do not reflect anytransactional costs, such as sales charges (loads), short-term redemption or exchange fees. Therefore, the table is useful incomparing ongoing costs only, and will not help you determine the relative total costs of owning different funds. In addition,if these transactional costs were included, your costs would have been higher.
BeginningAccount Value
11/1/2016
EndingAccount Value
4/30/2017
Expenses PaidDuring Period*11/1/16 – 4/30/17
Expense RatioDuring Period*11/1/16 – 4/30/17
Australia/New Zealand Fund $1,000.00 $1,011.72 $13.15 2.64%Africa Fund 1,000.00 1,016.12 8.75 1.75%Japan Fund 1,000.00 1,016.10 8.76 1.75%Global Fund 1,000.00 1,011.88 12.99 2.60%Real Estate Securities Fund 1,000.00 1,011.48 13.39 2.68%
* Expenses are equal to the average account value times the Fund’s annualized expense ratio multiplied by 181 (the number of days in the most recent fiscalhalf-year) divided by 365 (the number of days in the fiscal year) to reflect the one-half year period.
40

SEMI-ANNUAL REPORT 2017
ADDITIONAL INFORMATION – April 30, 2017 (Unaudited) – (Continued)
Disclosure of Portfolio Holdings
The Funds file their complete schedule of portfolio holdings with the Securities and Exchange Commission (the‘‘Commission’’) for the first and third quarters of each fiscal year on Form N-Q. The Funds’ Forms N-Q are available on theCommission’s website at http://www.sec.gov. The Funds’ Forms N-Q may be reviewed and copied at the Commission’sPublic Reference Room in Washington, DC. Information on the operation of the Commission’s Public Reference Room maybe obtained by calling 800-SEC-0330.
Proxy Voting
A description of the policies and procedures that the Funds use to determine how to vote proxies relating to portfoliosecurities is available without charge, upon request, by calling 888-345-1898, and on the Commissions website athttp://www.sec.gov.
Information regarding how the Funds voted proxies relating to portfolio securities during the most recent 12-month periodended June 30 is available without charge, upon request, by calling 888-345-1898, and on the Commission’s website athttp://www.sec.gov.
41

SEMI-ANNUAL REPORT 2017
NOTICE OF PRIVACY POLICY & PRACTICES (Unaudited)
Commonwealth International Series Trust (the ‘‘Trust’’) recognizes and respects the privacy expectations of our customers1.We provide this notice to you so that you will know what kinds of information we collect about our customers and thecircumstances in which that information may be disclosed to third parties who are not affiliated with the Trust.
Collection of Customer Information
We collect nonpublic personal information about our customers from the following sources:
• Account Applications and other forms, which may include a customer’s name, address, social security number,and information about a customer’s investment goals and risk tolerance;
• Account History, including information about the transactions and balances in a customer’s accounts; and
• Correspondence, including written, telephonic or electronic, between a customer and the Trust or serviceproviders to the Trust.
Disclosure of Customer Information
We may disclose all of the consumer information outlined above to third parties who are not affiliated with the Trust:
• as permitted by law – for example with service providers who maintain or service shareholder accounts for theTrust or to a shareholder’s broker or agent;
• to perform marketing services on our behalf or pursuant to a joint marketing agreement with another financialinstitution.
Security of Customer Information
We require service providers to the Trust:
• to maintain policies and procedures designed to assure only appropriate access to, and use of information aboutcustomers of the Trust; and
• to maintain physical, electronic and procedural safeguards that comply with federal standards to guard nonpublicpersonal information of customers of the Trust.
We will adhere to the policies and practices described in this notice regardless of whether you are a current or formercustomer of the Trust.
1 For purposes of this notice, the terms ‘‘customer’’ or ‘‘customers’’ includes both individual shareholders of the Trustand individuals who provide nonpublic personal information to the Trust, but do not invest in Trust shares.
42