commonwealth bank of australia david craig bank of australia acn 123 123 124 commonwealth bank of...
TRANSCRIPT

Commonwealth Bank of Australia ACN 123 123 124
Commonwealth Bank of Australia
David CraigChief Financial Officer
UBS Eighth Annual
Financial Services Conference24 June 2009

2
Disclaimer
The material that follows is a presentation of general background
information about the Bank’s activities current at the date of the
presentation, 24 June 2009. It is information given in summary form and
does not purport to be complete. It is not intended to be relied upon as
advice to investors or potential investors and does not take into account
the investment objectives, financial situation or needs of any particular
investor. These should be considered, with or without professional advice
when deciding if an investment is appropriate.

3
Operating conditions remain challenging
Household spending stimulus
GDP Growth 2009(evolution of forecasts)
Global slowdown/recession
-4.0%
-3.0%
-2.0%
-1.0%
0.0%
1.0%
Aus. Can. US UK EU Japan
Australian economy outperforming
Q1 2009 GDP Growth(% change)
-4
0
4
8
12
% pa
China
Industrial Countries
Asia (ex. Japan & China)
Jan 08 Jul 08 Jan 09 Jul 09
% of disposable income
0
2
4
6
Jul 08 tax
cut
Lower
petrol
Mortgage
rate cuts
Economic
Security pkg
Nation
Build & Job plans
July 09 tax
cut
Pension
increase
%
Unemployment trending higher
3
4
5
6
7
8
9
10
2002 2003 2004 2005 2006 2007 2008 2009
Euro area Japan United States Australia
%

4
Strong financial services sector
Effective regulatory regime
Major banks:
AA credit ratings
All rated in top 20 global safest banks*
Profitable
Well capitalised
Conservative/focus on core business
Continuing to lend
Effective rate pass-through
Credit Ratings of Largest 100 Banks
* Global Finance Magazine
-600
-400
-200
0
Australia US UK
Policy Rate
Rate on new home loans (variable)
Rates on oustanding home loans
Effective rate pass-through
bpts^
By assets, log scale. Holding company ratings
Sources : Bloomberg; The Banker
US$b
From start of easing cycle to end
December 2008. Source: RBA

5
Funding and
liquidity
Strategy
Capital
Risk
management
Financial
performance
Good income growth supported by strong market shares
Sound cash earnings, ROE maintained above 15%
Prudent provisioning - management overlay $1.3bn
Strengthened lending criteria
FY09 term funding completed in March
$87bn in liquid assets
On track and delivering
Strong improvements in Customer Satisfaction
Tier 1 capital ratio of 8.33% (FSA equivalent 10.8%)
Final dividend expected to be reduced 25%
CBA - Strength in uncertain times
Position as at March 2009Priority Areas

6
20.8%17.1%
23.7%21.5%
CBA / BankWest
Peer 1 Peer 2 Peer 3
18.7%16.3%
19.1%
16.2%
CBA / BankWest
Peer 1 Peer 2 Peer 3
CBA / BankWest
Peer 1 Peer 2 Peer 3
Source: APRA / RBA, April 2009.
Home Lending Household Deposits Credit Cards
Personal Lending Business Lending Business Deposits
CBA / BankWest
Peer 1 Peer 2 Peer 3
32.4%
12.6% 12.9%
22.4%24.6%
13.4% 12.9%
23.2%
CBA / BankWest
Peer 1 Peer 2 Peer 3
21.6%17.7%
11.9%
22.3%
CBA / BankWest
Peer 1 Peer 2 Peer 3
16.8%12.9%
26.2% 25.7%
Strong market share positions
7
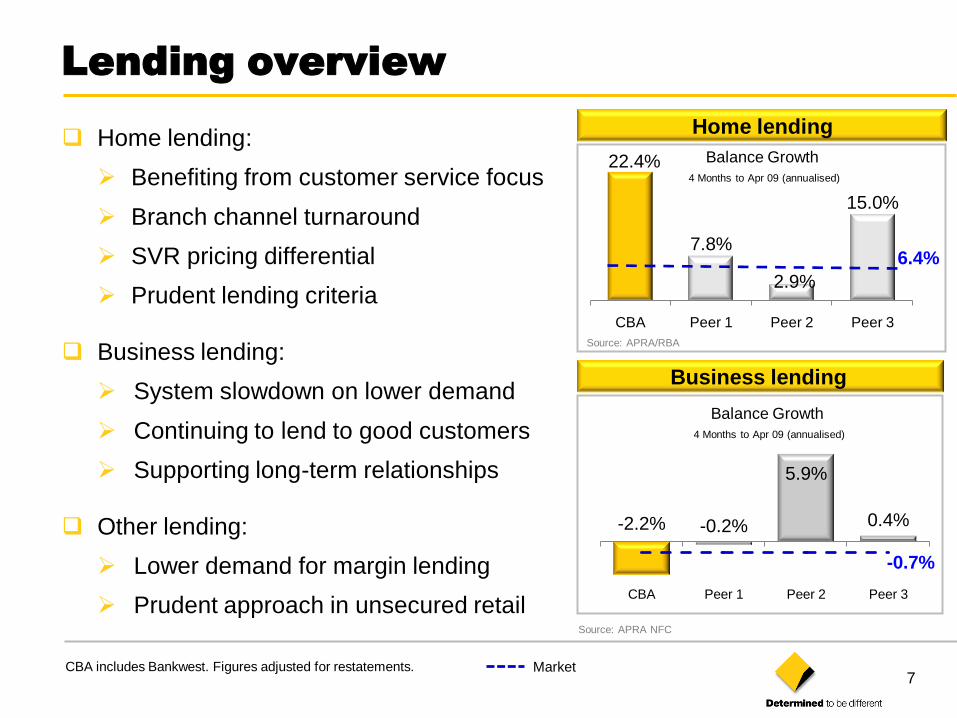
22.4%
7.8%
2.9%
15.0%
CBA Peer 1 Peer 2 Peer 3
-2.2% -0.2%
5.9%
0.4%
CBA Peer 1 Peer 2 Peer 3
MarketCBA includes Bankwest. Figures adjusted for restatements.
Source: APRA NFC
Business lending
Home lending
Source: APRA/RBA
Home lending:
Benefiting from customer service focus
Branch channel turnaround
SVR pricing differential
Prudent lending criteria
Business lending:
System slowdown on lower demand
Continuing to lend to good customers
Supporting long-term relationships
Other lending:
Lower demand for margin lending
Prudent approach in unsecured retail
6.4%
-0.7%
Lending overview
Balance Growth
4 Months to Apr 09 (annualised)
Balance Growth
4 Months to Apr 09 (annualised)
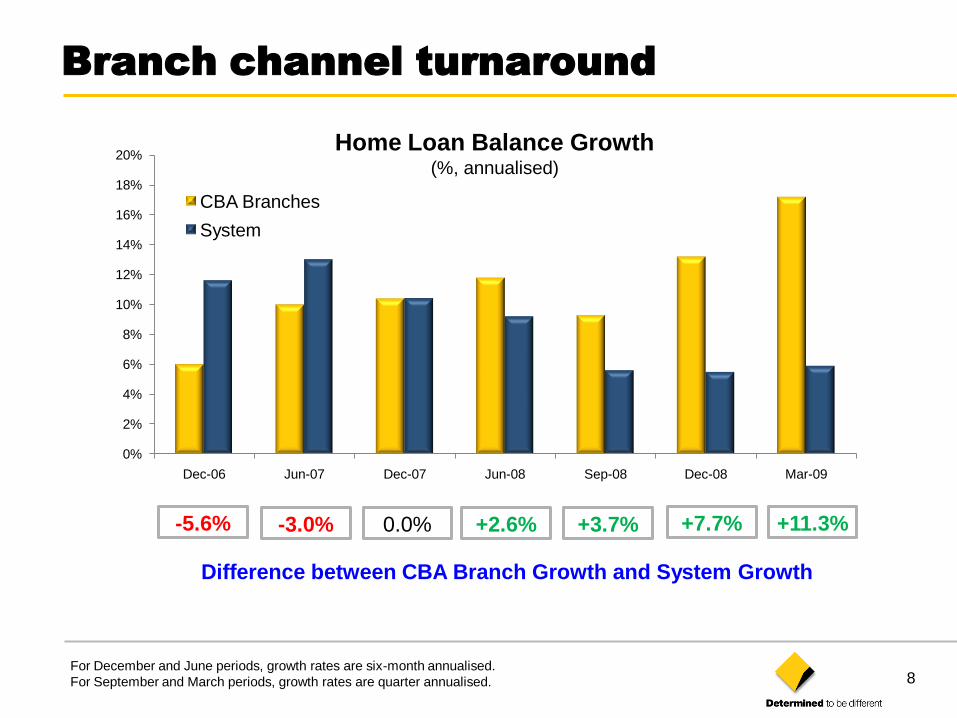
8
0%
2%
4%
6%
8%
10%
12%
14%
16%
18%
20%
Dec-06 Jun-07 Dec-07 Jun-08 Sep-08 Dec-08 Mar-09
CBA Branches
System
Home Loan Balance Growth (%, annualised)
+7.7% +11.3%
Difference between CBA Branch Growth and System Growth
+2.6% +3.7%-5.6% -3.0% 0.0%
Branch channel turnaround
For December and June periods, growth rates are six-month annualised.
For September and March periods, growth rates are quarter annualised.

9
157 151176
157181
212234
Quarterly
(No. ‘000’s)
Sep 07 Dec 07 Mar 08 Jun 08 Sep 08 Dec 08 Mar 09
New transaction accounts
Ex-Bankwest.
Balance Growth
4 Months to Apr 09 (annualised)
Household depositsSource: APRA/RBA
CBA includes Bankwest. Figures adjusted for restatements.
Strong market shares benefiting Group
funding position
Over 32% share of Household Deposits
Emphasis on profitable growth
Bankwest progressively re-pricing
Strong growth in personal transaction
accounts
10.7%15.0% 11.8%
9.8%
CBA Peer 1 Peer 2 Peer 3
11.9%
Market
Deposits overview

10
$1,239m
$647m$763m $751m
Jun 08 Sep 08 Dec 08 Mar 09
100%
67%
33%24%
100%
33%
86%100% 97%
67%76%
DomesticEquities
GlobalResource
PropertySec
FixedInterest
Cash Infrastructure
DirectProp'ty
ListedProp'ty
GEM/AP
GlobalEquities
Average
+ 9%Number of Funds in each Asset Class
Out Performing Benchmark (3 years)
$158bn$1bn ($1bn)
$158bn*
Dec 08 Netflows Investment Returns Mar 09
$1,378m$19m $21m
$20m
$66m $1,504m*
Dec 08 General
Insurance
Retail
life
Wholesale
life
Mar 09
10
Flat FUA Strong net flows
Solid Investment Performance Inforce premiums up 9%
* Includes St Andrews
St
Andrews
FirstChoice and Avanteos
Solid Wealth Management performance

11
0.0%
0.4%
0.8%
1.2%
1.6%
2.0%
Apr May Jun Jul Aug Sep Oct Nov Dec Jan Feb Mar
2005/06 2006/07 2007/08 2008/09
2.0%
3.0%
4.0%
Apr May Jun Jul Aug Sep Oct Nov Dec Jan Feb Mar
2005/06 2006/07 2007/08 2008/09
All graphs ex-Bankwest
Home loan arrears
30+ Days %
Credit card arrears
30+ Days %
Arrears trends consistent with slowdown
Strong home loan portfolio:
70% paid in advance – avg 7 months
Average LVR 37% on current values
Mortgage insurance above 80% LVR
Credit policies further strengthened:
Maximum LVR of 90%*
Genuine savings of 5% > 85% LVR
FHOG not genuine savings
Tightened policies and revised
scorecards for unsecured retail
* Except for best risk CBA customers
Credit quality – consumer

12
Australian housing market
Demand outstripping supply
Annual % change
-45
-8
29
66
-20
0
20
40
1990 1994 1998 2002 2006 Current
House prices(lhs)
Housing Affordability
(RHS)
%%
Improving affordability to assist prices
Underpinned by population growth
Orderly house price correction
150
250
350
450
150
250
350
450
Sep-79 Sep-86 Sep-93 Sep-00 Sep-07
POPULATION(rolling annual increase)'000 '000
100
150
200
100
150
200
Sep-90 Sep-94 Sep-98 Sep-02 Sep-06
HOUSING DEMAND & SUPPLY
Demand
Supply
'000'000‘000
1979 1986 1993 2000 2007
150
250
350
450Rolling annual increase
200
150
100
‘000
1990 1994 1998 2002 2006 Current
Demand
Supply
150
300
450
600
Mar-03 Mar-04 Mar-05 Mar-06 Mar-07 Mar-08 Mar-09
Sydney Melbourne Brisbane
Perth Adelaide Hobart
Established house prices‘000

13
Troublesome Exposures*
1.00%1.26%
1.51% 1.55%
Jun 08 Sep 08 Dec 08 Mar 09
Troublesome Defaulted/Well Secured
Ex-Bankwest
Total and New Impaired Assets
683
2,792
3,399
352
1,398
785
Jun 08 Dec 08 Mar 09
1,944
848
895
2,504
$m
Total Impaired Assets
Total Impaired Assets – Bankwest
New Impaired Assets
* Troublesome Exposures as a % of Total Committed Exposures. Includes defaulted/well secured exposures and exposures
where there is a potential for default within ~12 months if a sustained improvement in financial performance is not achieved
within the short term. Excludes impaired exposures.
Overall portfolio quality remains sound
69% investment grade
Some deterioration in SME portfolio
and certain market segments:
eg export industries, luxury
goods, media
Further prudent increase in provisions
consistent with economic outlook
Credit quality – commercial

14
245403 403
54434
39 39
46238401
443454
454
488
Individual provisions ($m)
1,134
Commercial
Single Names
Single Names
Consumer
Overlay ConsumerCommercial
Bankwest
Bankwest
1,521
Collective provisions ($m)
2,474 Bankwest
Granularity
Economic
Model and data
Commercial
Consumer
Bankwest
2,954
1,297
2,703
Dec 08
as reported
Mar 09Dec 08
pro-forma*
605 709 709 746
502568 568 631
359 115 267274
1,0821,159
1,303
1,466
Jun 08Dec 08
as reported
Mar 09Dec 08
pro-forma*
Jun 08
279
* Dec 08 pro-forma reflects changes to Bankwest related provisions allowing for adjustments included in Bankwest
31 December 2008 accounts
Further prudent increase in provisions
15
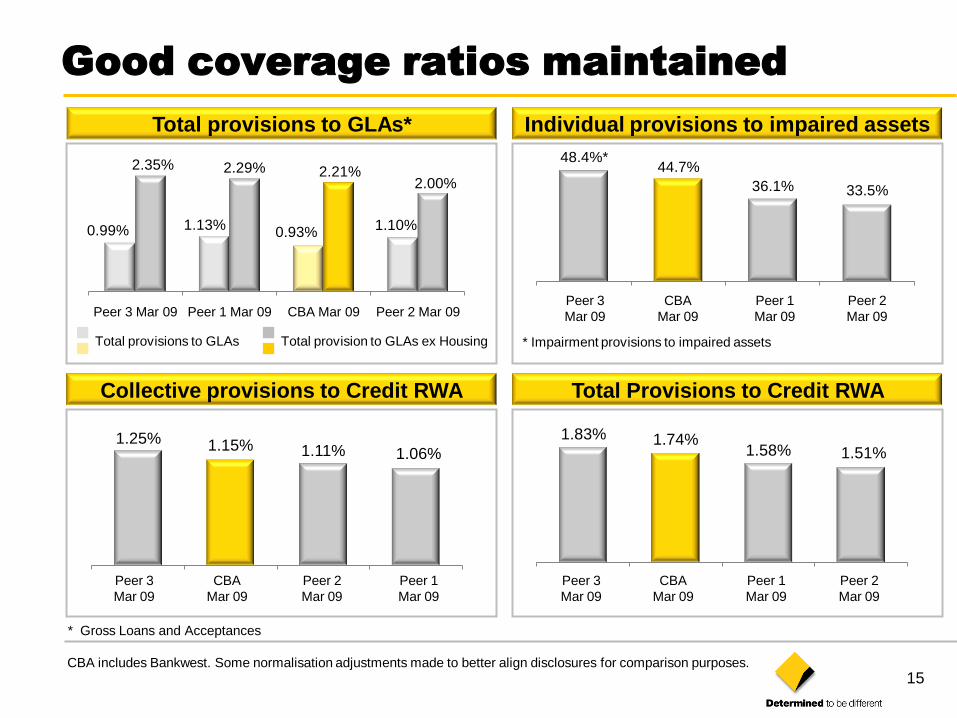
Total Provisions to Credit RWA
Total provisions to GLAs*
Collective provisions to Credit RWA
48.4%*44.7%
36.1% 33.5%
Individual provisions to impaired assets
1.83% 1.74%1.58% 1.51%
0.99% 1.13%0.93%
1.10%
2.35% 2.29% 2.21%2.00%
Peer 3 Mar 09 Peer 1 Mar 09 CBA Mar 09 Peer 2 Mar 09
Total provision to GLAs ex HousingTotal provisions to GLAs
CBA includes Bankwest. Some normalisation adjustments made to better align disclosures for comparison purposes.
* Gross Loans and Acceptances
1.25% 1.15% 1.11% 1.06%
Peer 3
Mar 09
CBA
Mar 09
Peer 2
Mar 09
Peer 1
Mar 09
Peer 3
Mar 09
CBA
Mar 09
Peer 2
Mar 09
Peer 1
Mar 09
Peer 3
Mar 09
CBA
Mar 09
Peer 1
Mar 09
Peer 2
Mar 09
* Impairment provisions to impaired assets
Good coverage ratios maintained

16
0
1
2
3
4
1982 1984 1986 1988 1990 1992 1994
Loss R
ate
(%
)
Small Business
Personal Loans
Credit cards
Business Banking
Home Loans
Institutional Banking
Loss rates - last recession
17
0
1
2
3
4
5
6
7
8
Jul 08 Aug 08 Sep 08 Oct 08 Nov 08 Dec 08 Jan 09 Feb 09 Mar 09
Unguaranteed Guaranteed
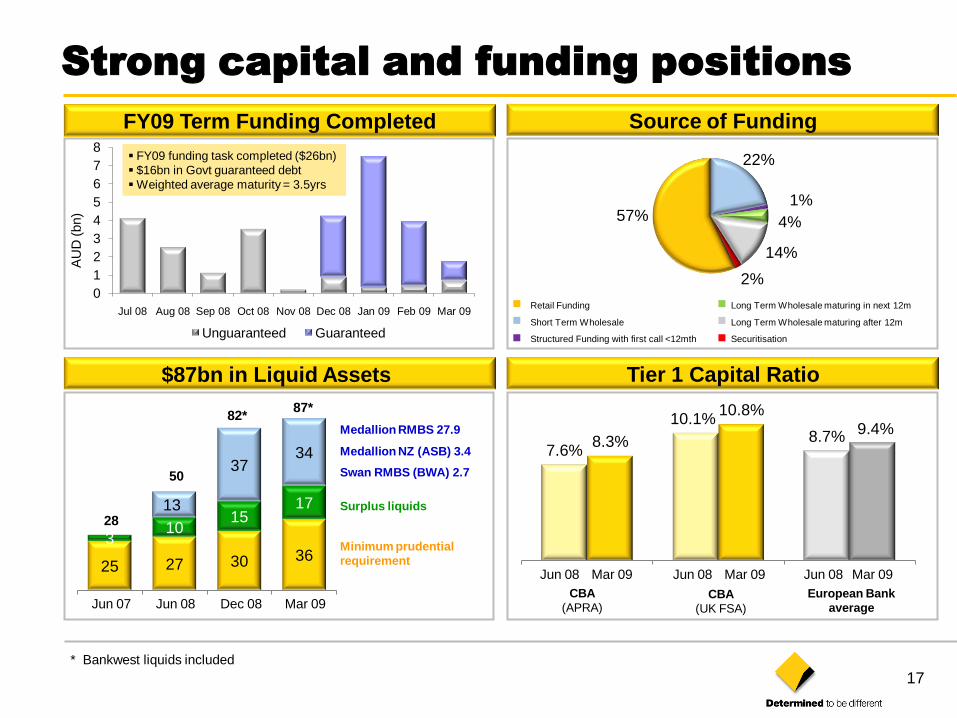
25 27 30 363
1015
1713
3734
* Bankwest liquids included
Minimum prudential
requirement
Medallion RMBS 27.9
Medallion NZ (ASB) 3.4
Surplus liquids
Swan RMBS (BWA) 2.7
AU
D (
bn)
FY09 funding task completed ($26bn)
$16bn in Govt guaranteed debt
Weighted average maturity = 3.5yrs
FY09 Term Funding Completed Source of Funding
$87bn in Liquid Assets Tier 1 Capital Ratio
22%
1%
4%
14%
2%
57%
Retail Funding
Short Term Wholesale
Structured Funding with first call <12mth
Long Term Wholesale maturing in next 12m
Long Term Wholesale maturing after 12m
Securitisation
Jun 07 Jun 08 Dec 08 Mar 09
28
50
82*87*
Strong capital and funding positions
7.6%
10.1%8.7%8.3%
10.8%
Jun 08 Mar 09 Jun 08 Mar 09 Jun 08 Mar 09
CBA
(APRA)CBA
(UK FSA)
European Bank
average
9.4%

18
65%
67%
69%
71%
73%
75%
77%
79%
81%
83%
Jun-07 Dec-07 Jun-08 Dec-08
9.7%
4.4%
Business Customer Satisfaction2Retail MFI Customer Satisfaction1
Products per Customer Employee Engagement
2007 2008 2009
69th
78th80th
CBA in top quartile of Gallup*
Worldwide Employee Survey
CBA Peers
Gap to top-rated peer
55.0%
60.0%
65.0%
70.0%
75.0%
80.0%
85.0%
90.0%
Mar-07 Sep-07 Mar-08 Sep-08 Mar-09
Gap to top-rated peer
1.8
1.9
2.0
2.1
2.2
2.3
2.4
2.5
2.6
Jun-07 Dec-07 Jun-08 Dec-08
Movement*
Peer 1: +11.1%
Peer 3: +7.4%
Peer 4: +7.2%
Peer 5: +3.1%
Average Number of Products per
Customer held at Financial Institution3
CBA Peers
20.1%6.5%
CBA: +15.4%
* From Jun-07 to Mar-09
Strategy on track and delivering
1 Source: Roy Morgan Research Customer Satisfaction. Aust MFI Population 14+, % “Very" or "Fairly Satisfied“. Six month rolling average.2 Source: TNS Business Finance Monitor. Customer satisfaction with MFI – businesses with annual turnover to $100m (ex Agribusinesses).
This is based on a 12 month rolling average. Percentage point change refers to the increase /decrease of each bank’s customers who are satisfied. Satisfaction is based on business customers who said they were Very or Fairly Satisfied with their relationship with their MFI.
3 Source: Roy Morgan Research Australian Population 14+ , Banking and Finance products per Banking and Finance customer. 6 month moving average.
CBA Peers
Apr-09 Apr-09
% S
atisfied (
‘Very
Satisfied’ or
‘Fair
ly S
atisfied’)
Avg
No.
of
Pro
ducts
Mar-09
2.40
Age 14+, 6mth rolling average
Age 14+, 6mth moving average * Source : The Gallup Organisation, Q12 Employee Engagement Worldwide Database
19
Summary
Operating conditions remain challenging
Australian economy slowing, but relatively well placed
CBA pursuing a cautious and conservative approach
March 2009 quarter outcomes consistent with this approach:
Core business performing well - unaudited cash earnings $1.15bn
Prudent increase in provisions - Management overlay $1.3bn
Strong capital position - 8.33% Tier 1 ratio (FSA 10.8%)
Well funded - FY09 funding completed

Commonwealth Bank of Australia ACN 123 123 124
Commonwealth Bank of Australia
David CraigChief Financial Officer
UBS Eighth Annual
Financial Services Conference24 June 2009