commonwealth bank of australia acn 123 123 124 annual … · introduction 3 the management...
TRANSCRIPT

Commonwealth Bank of AustraliaACN 123 123 124
Annual Report 2001
COMMONWEALTH BANK OF AUSTRALIA AND CONTROLLED ENTITIES
Table of Contents
2
Results Overview.............................................................................................................................................................................4
Group Performance Summary ........................................................................................................................................................6
Strategy............................................................................................................................................................................................9
Outlook Statement...........................................................................................................................................................................9
Main Financial Indicators...............................................................................................................................................................10
Banking Performance Summary ...................................................................................................................................................13
Banking – Business Analysis ........................................................................................................................................................15
Banking Analysis of Performance
Net Interest Income..............................................................................................................................................................18
Group Interest Margins and Spreads ..................................................................................................................................19
Other Banking Operating Income........................................................................................................................................20
Charge for Bad and Doubtful Debts ....................................................................................................................................21
Provisions for Impairment ....................................................................................................................................................21
Funds Management - Business Analysis .....................................................................................................................................22
Life Insurance - Business Analysis ...............................................................................................................................................25
Summary of Life Insurance and Funds Management Valuations................................................................................................27
Group Operating Expenses...........................................................................................................................................................28
Other Group Items.........................................................................................................................................................................29
Integrated Risk Management
Risk Management ................................................................................................................................................................31
Credit Risk ............................................................................................................................................................................31
Market Risk...........................................................................................................................................................................31
Operational Risk...................................................................................................................................................................32
Insurance Risk......................................................................................................................................................................33
Derivatives............................................................................................................................................................................33
Business Continuity Management.......................................................................................................................................33
Government Guarantee.................................................................................................................................................................33
Credit Rating ..................................................................................................................................................................................33
Capital Adequacy...........................................................................................................................................................................34
Description of Business Environment ...........................................................................................................................................35
Corporate Governance..................................................................................................................................................................38
Directors’ Report............................................................................................................................................................................41
Five Year Financial Summary.......................................................................................................................................................47
Financial Statements
Statements of Financial Performance .................................................................................................................................50
Statements of Financial Position .........................................................................................................................................51
Statements of Changes in Shareholders’ Equity ................................................................................................................52
Statements of Cash Flows...................................................................................................................................................53
Notes to the Financial Statements ......................................................................................................................................54
Directors’ Declaration ..................................................................................................................................................................151
Independent Audit Report ...........................................................................................................................................................152
Shareholding Information ............................................................................................................................................................153

Introduction
3
The Management Discussion and Analysis of the Group’s results for the year ended 30 June 2001 that followscompares the current year income and expenses to proforma 30 June 2000 information. The proforma data combinesColonial normalised results with Commonwealth actual results. It is considered that analysis on this basis is moremeaningful.
The statutory financial statements, that follow the Management Discussion and Analysis (on pages 4 to 30), are allactual results for the Commonwealth Bank Group for each of the years presented.

COMMONWEALTH BANK OF AUSTRALIA AND CONTROLLED ENTITIES
Results Overview
4
(Except where otherwise stated, all figures relate tothe year ended 30 June 2001 and comparatives for theprofit and loss are to the proforma combination of theCommonwealth Bank Group and Colonial Limited for theyear ended 30 June 2000.)
For the year ended 30 June 2001, theCommonwealth Bank Group recorded a net operatingprofit after income tax of $2,398 million.
The net operating profit (‘cash basis’) for the yearended 30 June 2001 after tax, and before goodwillamortisation and appraisal value uplift is $2,262 million.This is an increase of $194 million or 9% over the yearended 30 June 2000.
A fully franked dividend of 75 cents per ordinaryshare will be paid on 8 October 2001 to owners ofordinary shares at the close of business on 27 August2001.
On a cash basis, the dividend payout ratio for theyear is 75.5% down from 85.3% for the prior year. Theprior year ratio was inflated by the dividend payment toColonial shareholders with only 17 days of Colonialcontribution included in the Group result.
The Group result comprised:$M
Segment profit after tax- Banking- Funds Management- Life Insurance
1,793149320
up 12%up 34%
down 12%
Net operating profit after tax andbefore goodwill amortisationand appraisal value uplift 2,262 up 9%
BankingThe contribution to profit after tax from the Group’s
banking businesses increased to $1,793 million, 12%over the prior year, reflecting:� Net interest income growth of $318 million or 8%,
which was achieved through an 8% growth inaverage interest earning assets compared with theprior year and a stable net interest margin of 2.78%.
� Other banking income growth of $203 million or 9%,notwithstanding a reduction in lending fees asa result of discounted and nil home loanestablishment fee offers.
� Tax benefits totalling $84 million with $30 millionrelating to the effect of the reduction in thecorporate tax rate on current year income tax anddeferred tax balances, and the increasedrecoupment of prior year, unrecognised tax lossesof $54 million.
Funds ManagementThe contribution to profit after tax from the Group’s
funds management businesses increased to $149 million,34% over the prior year. Funds under management(FUM) (excluding life insurance FUM) have grown by18% to $77 billion, contributing to a 29% increase infunds management income, partly offset by increasedvolume related expenses such as sales and processingcosts. The funds management business also managesinternal funds of $24 billion on behalf of the life insurancebusinesses of the Group.
Life InsuranceThe contribution from life insurance to profit after
tax was down $43 million to $320 million, 12% less thanthe prior year. This result reflects lower investmentearnings on shareholders funds which have reduced theafter tax profit from life insurance by $17 million, togetherwith the effect of poor persistency and claims experiencein Asia and New Zealand.
Group ExpensesOperating expenses across the Group increased
7% or $348 million to $5,170 million. The increaseincludes the effect of GST of $111 million and expensesfrom acquired and developing businesses of $90 million.The merger of the Colonial and Commonwealth Groupbusinesses realised approximately $120 million ofexpense savings in the current year. Excluding theseitems, expenses increased by 5.5%, reflecting a 4% wageincrease as a result of a domestic enterprise bargainingarrangement and increased sales volume relatedexpenses in both the domestic and internationalbusiness.
Bad debt expense increased by $75 million to$385 million due to the stage of the credit cycle. Provisioncoverage ratios have remained strong.
Income TaxIncome tax expense has reduced by $190 million to
$993 million, 16% less than the prior year. Of thisreduction, $93 million relates to tax on behalf of lifeinsurance policyholders. The balance of $97 millionprimarily results from the 2 percentage points reduction inthe corporate tax rate to 34% and utilisation of previouslyunrecognised tax losses.
The components of the segment results are detailedbelow:
Banking(1) $MTotal operating income 6,855 up 8%Net interest income 4,474 up 8%Other operating income 2,381 up 9%Operating expenses 3,958 up 9%Bad debt charge 385 up 24%Income tax expense 705 down 6%Operating profit after tax 1,793 up 12%Net interest margin 2.78% down 1
basis pointLending assets(net of securitisation) (2)
$B150 up 3%
Average interest earning assets 161 up 8%
Funds Management $MOperating income (3) 739 up 29%Operating expenses 496 up 21%Income tax expense 94 up 81%Operating profit after tax 149 up 34%
$BFunds under management (4) 101 up 15%- Retail 34 up 38%- Wholesale 43 up 6%- Life insurance 24 up 7%
Life Insurance $MOperating margin- Australia and New Zealand- Asia
213(21)
down 4%down $17m
Investment earnings on assets inexcess of policyholder liabilities 126 down 12%Operating profit after tax 320 down 12%
$BLife insurance assets 39 up 18%

Results Overview
5
Appraisal Value Uplift(5)
For the year ended 30 June 2001, appraisal valuesof the life insurance and funds management businessesincreased by $1,267 million. Of the increase, $423 millioncomprised net profit of the businesses, $806 millionrepresented the appraisal value uplift and the balance of$38 million represented the net capital movements. Theappraisal value uplift comprises two elements. Firstly,$332 million arising from realised Colonial integrationsynergy benefits relating to the life insurance and fundsmanagement businesses which have been offset directlyagainst goodwill; and secondly, $474 million of operatingappraisal value uplift reflected in profit.
Goodwill AmortisationThe goodwill amortisation charged in determining
the result for the year was $338 million.
Key Performance MeasuresReturn on equity(before abnormals)
13.50% Refer Note (7)
Return on equity(cash basis)
12.83% up 0.37percentage
pointsEarnings per share(cents)(before abnormals)(6)
190 up 5 cents
Earnings per share(cents)(cash basis)(6)
179 down 2 cents
Total assets held andfunds undermanagement(6)
$307bn up 8.4%
As expected, the purchase of Colonial has resultedin a dilution of EPS (cash basis) during the first year. Withthe major integration milestones now achieved futureresults will benefit as the cost and revenue synergies arerealised.
Integration of ColonialSignificant progress has been made on the
integration of the Colonial businesses into the Group.Based on the work completed to date, cost and revenuesynergies are expected to exceed the business caseestimate of $380 million. The current forecast of theannualised synergies that will be realised when theintegration is completed (by 30 June 2003) is of the orderof $450 million.
Additional costs associated with the integrationwork were identified during the year resulting in a$145 million increase in the provision for integration costs(before tax), bringing total once off integration costs to$545 million (Refer page 29 for detail).
The major milestone achieved during the year wasthe integration of Colonial State Bank, which involvedcombining the distribution networks and the conversion ofthe Colonial product systems to equivalentCommonwealth Bank product systems.
A new network staffing structure was introduced inOctober 2000, integrating the most effective sales andservice elements of Commonwealth Bank and Colonialinto a single, streamlined and customer focussed deliverysystem. Along with this new structure, 367 Colonialbranches were amalgamated or absorbed into theCommonwealth Bank branch network and two new callcentres were established.
(1) Includes General Insurance.(2) Net of loans securitised of $6,773 million ($3,006 million at 30 June 2000).(3) Includes internal income.(4) Includes internal and external FUM.(5) AASB 1038 requires that all investments owned by a life company be recorded at market value. The ‘appraisal value
uplift’ is the periodic movement in the Balance Sheet asset ‘excess of market value over net assets’.(6) Comparison with actual 30 June 2000.(7) Proforma results have only been prepared on a cash basis.

COMMONWEALTH BANK OF AUSTRALIA AND CONTROLLED ENTITIES
Group Performance Summary
6
Full Year Ended ComparisonProforma 30/06/01
Group Actual vs 30/06/0030/06/01 30/06/00(4) 30/06/00 Proforma
$M $M $M %
Profit and Loss - SummaryOperating profit after tax (’cash basis (1) ’) 2,262 2,068 1,678 9Operating profit after tax and abnormal items 2,398 Refer note (5) 2,700
IncomeInterest income 11,900 10,402 8,842 14Interest expense 7,426 6,246 5,123 19Net interest income 4,474 4,156 3,719 8Other banking operating income 2,381 2,178 1,951 9Total banking income 6,855 6,334 5,670 8Life insurance income (6) 1,268 1,557 326 (19)Funds management income 701 541 143 30Total Income 8,824 8,432 6,139 5
ExpensesOperating expenses- existing operations 5,089 4,822 3,407 6- business acquisitions and GST, net of synergies (2) 81 - - -Total operating expenses 5,170 4,822 3,407 7Charge for bad and doubtful debts 385 310 196 24Total Expenses 5,555 5,132 3,603 8
Operating profit before goodwill amortisation,appraisal value uplift, abnormal items andincome tax 3,269 3,300 2,536 (1)Income tax expense (6) 993 1,183 820 (16)Operating profit after income tax 2,276 2,117 1,716 8Outside equity interests (3) (14) (49) (38) (71)Operating profit after income tax and beforegoodwill amortisation, appraisal value uplift andabnormal items 2,262 2,068 1,678 9Abnormal items - Refer note (5) 967Income tax credit on abnormal items - " 20Appraisal value uplift 474 " 92Goodwill amortisation (338) " (57)Operating profit after income tax attributable toshareholders of the Bank 2,398 " 2,700
Contributions to profit (after tax)Banking 1,793 1,594 1,513 12Life insurance 320 363 129 (12)Funds management 149 111 36 34Profit after tax from operations (’cash basis (1) ’) 2,262 2,068 1,678 9Goodwill amortisation (338) Refer note (5) (57)Appraisal value uplift 474 " 92Operating profit after income tax and before abnormal items 2,398 " 1,713Abnormal items after tax - " 987Operating profit after income tax 2,398 " 2,700
(1) ‘Cash basis’ for the purpose of this performance summary is defined as net profit after tax and before abnormal items,goodwill amortisation and life insurance and funds management appraisal value uplift.
(2) Business acquisitions include costs associated with acquisitions in the prior year including State Street Master custodyoperations, Trust Bank and the development of European Banking which increased expenses by $90 million, and netGST of $111 million. Offset against this figure are the Colonial integration expense synergies achieved to date of$120 million.
(3) Primarily includes 25% outside equity interest in the ASB Group. In August 2000 the Group purchased this 25%interest.
(4) Proforma Group represents the combined results of Commonwealth Bank and Colonial for the year ended 30 June2000. The Colonial results have been adjusted for abnormal items and other items not considered part of the ongoingoperations.
(5) Proforma results have only been prepared on a ‘cash basis’.(6) Included within life insurance income is $94 million of tax relating to policyholder income (30 June 2000: $187 million).
This item is also included in the income tax line in the above profit and loss. The net impact on the net profit after tax istherefore nil.

Group Performance Summary
7
Comparison30/06/01
As at 30/06/01 30/06/00 vs 30/06/00$M $M %
Balance Sheet - SummaryTotal Assets 230,411 218,259 6Total Liabilities 210,563 199,824 5Shareholders’ Equity 19,848 18,435 8
Assets held and Funds under managementOn Balance SheetBanking assets 191,333 185,108 3Life insurance funds under management 24,527 22,916 7Other life insurance and funds management assets 14,551 10,235 42
230,411 218,259 6Off Balance SheetFunds under management (1) 76,954 65,266 18
307,365 283,525 8
Banking Assets 191,333 185,108 3Life insurance and funds management assets 39,078 33,151 18External funds under management 76,954 65,266 18
307,365 283,525 8
Full Year Ended 30/06/0130/06/01 30/06/00 vs 30/06/00
%Shareholder SummaryDividends per share (cents) - fully franked 136 130 5Dividends provided for, reserved or paid ($million) 1,720 1,431 20Dividend cover (times - before abnormals) 1.4 1.2 17Dividend cover (times - cash) 1.3 1.4 (7)Earnings per share (cents) (2)
(basic & fully diluted) before abnormal items 190 185 after abnormal items 190 291 cash basis (4) 179 181Dividend payout ratio (%) (3)
before abnormal items 71.2 83.5 after abnormal items 71.2 53.0 cash basis (4) 75.5 85.3Net tangible assets per share ($) 10.19 9.18Weighted average number of shares (basic) 1,260m 927mShares at end of period 1,244m 1,260mNumber of shareholders 709,647 788,791Share prices for the period ($) Trading high 34.15 27.95 Trading low 26.18 22.54 End (closing price) 34.15 27.69
(1) In accordance with ASSIRT reporting requirements the funds management balances exclude $9.5 billion(2000: $8 billion) in funds under overlay management by Tactical Global Management.
(2) Calculated in accordance with AASB 1027: Earnings per Share.(3) Dividends paid divided by earnings. The comparative ratios have been amended to the same basis as the current year.
Previously this ratio was calculated as Dividend per share divided by Earnings per share. Excludes dividends onpreference shares of $9 million.
(4) ‘Cash basis’ for the purpose of this performance summary is defined as net profit after tax and before abnormal items,before goodwill amortisation and life insurance and funds management appraisal value uplift. The 30 June 2000dividend payout ratio was inflated by the payment of the final dividend to Colonial shareholders, but the Colonial Grouponly contributed 17 days profit to the 30 June 2000 result.

COMMONWEALTH BANK OF AUSTRALIA AND CONTROLLED ENTITIES
Group Performance Summary
8
Full Year EndedProforma
Group(6)
30/06/01 30/06/00 30/06/00% % %
Performance Ratios (%)Return on average shareholders’ equity (1)
before abnormal items 13.50 Refer note (7) 22.06after abnormal items 13.50 Refer note (7) 34.78cash basis 12.83 12.46 21.61
Return on average total assets (2)
before abnormal items 1.07 Refer note (7) 1.08after abnormal items 1.07 Refer note (7) 1.70cash basis 1.01 1.03 1.06
Capital adequacy - Tier 1 6.51 7.49 7.49Capital adequacy - Tier 2 4.18 4.75 4.75Deductions (1.53) (2.49) (2.49)Capital adequacy - Total 9.16 9.75 9.75
ProductivityCost to total average assets ratio (3) 2.30 2.40 2.15Cost to assets held and funds under management (3) 1.75 1.83 1.85Staff expense/Total operating income (4) 26.75 n/a 27.77Total operating income per FTE (5) $252,400 $227,088 $211,842
Cost to income ratios (%)Banking 57.70 57.40 55.80Funds management 67.10 71.60 67.30Life insurance 59.50 52.10 46.00
Other Information (numbers)Full time staff 31,976 34,154 34,154Part time staff 7,161 7,383 7,383Full time staff equivalent 34,960 37,131 37,131
(1) Ratio based on operating profit after tax and outside equity interest applied to average shareholders equity, excludingoutside equity interests.
(2) Based on operating profit after tax and outside equity interest. Averages are based on beginning and end of yearbalances. 30 June 2000 includes Colonial assets weighted for the 17 days from 13 June 2000 to 30 June 2000.
(3) 30 June 2000 includes Colonial assets weighted for the 17 days from 13 June 2000 to 30 June 2000.(4) The effect of lower investment earnings and MOS profits in the current year increased this ratio over the prior year.(5) 30 June 2000 includes Colonial FTE staff numbers weighted for the 17 days from 13 June 2000 to 30 June 2000.(6) Proforma Group represents the combined results of Commonwealth Bank and Colonial for the year ended 30 June
2000.(7) Proforma results have only been prepared on a cash basis.
Strategy and Outlook
9
Overview of GroupCommonwealth Bank of Australia provides a wide
range of banking, financial and related services primarilyin Australia and New Zealand. These services includepersonal, business and corporate banking, life insuranceand funds management. On 13 June 2000 the Groupacquired 100% of Colonial Limited (Colonial) a lifeinsurance, banking and funds management group.Colonial had operations in Australia, New Zealand, theUnited Kingdom and throughout Asia and the Pacific.
The Commonwealth Bank of Australia became thesuccessor in law to the State Bank of New South Wales(known as Colonial State Bank) and to all the assets andliabilities of State Bank of New South Wales effective on4 June 2001 pursuant to legislation.
Strategic InitiativesThe demand for banking and financial services is
being driven by three major forces:� The convergence of technology and information,
with the Internet a significant influence.� The need to provide relevant long term savings and
investment products for an ageing population.� The need to satisfy the day to day individual
requirements of personal and business customers.Changing customer needs is heightening the
demand for information and advice, but is alsoencouraging demands for more regulation.
A more challenging, uncertain environment,continuing pressure on margins and a weaker domesticcurrency, each pose significant challenges.
Within this globalising yet more customer focusedenvironment, the Group’s major assets are its domesticscale and management capabilities, a pre-eminent brandand a strong, diversified business mix.
Consistent with this context, the Group’s vision is tobe recognised as having the best brands in helpingcustomers manage and build wealth.
A set of business goals underpins the achievementof the Group’s vision. Each operating division in turn hasa series of strategies that are consistent with, anddirected at the collective achievement of those businessgoals, which are to:� Provide customised service to grow revenue per
customer.� Develop best team.� Develop offshore opportunities.� Achieve global best-practice costs.
The strategic emphasis is on wealth managementservices that are aligned to customers’ needs, and theuse of technology to improve both service andproductivity.
Outlook StatementRecovery in the major global economies continues
to be uncertain putting at risk the sustainability of currentgrowth rates in Australia, even with a historically lowexchange rate. Interest rates are expected to remain low,around the levels of the past six months. Equities marketswill continue to reflect uncertainty about the globaleconomy and corporate earnings.
Credit quality in the business sector is expected tocontinue to weaken reflecting the normal lag from aneconomic slow-down. However, low interest rates shouldmoderate the severity of the credit cycle.
Uncertainty in the equities markets may affectinvestment returns in the insurance businesses anddampen revenue on investment management activities;however, continued strong growth of retail funds shouldbe achieved in the light of the current momentum in thebusiness and Government policy on superannuation.Lending volumes are expected to continue at recentlyachieved growth rates, supported by low interest ratesand reasonable demand for credit. However, bankmargins are expected to continue to decline reflecting thecompetitive environment witnessed over recent years.
With the successful completion of the criticalphases of the Colonial integration, the Bank is positionedto achieve the benefits of integration synergies. The Bankalso expects that its strategic investments, including theColonial merger, will improve its competitive position byenhancing customer service, revenue and efficiency.
Directors expect that the Group will continue tomaintain a high ratio of dividends to cash earningsrelative to peer financial institutions.

COMMONWEALTH BANK OF AUSTRALIA AND CONTROLLED ENTITIES
Main Financial Indicators
10
Graphs presented in this section include half yearlycomparisons with prior years on a proforma basis wherethis information displays a more relevant trend.
Net Operating Profit (Cash basis)
� The Group recorded a net operating profit beforegoodwill amortisation and appraisal value uplift forthe year of $2,262 million. This result representsa 9% increase over last year.
� The result for the six months to 30 June 2001 of$1,153 million represents an increase of 11% overthe prior comparative period.
Operating Income
� Total operating income for the year was$8,824 million, an increase of 5% over last year.
� Net interest income of $4,474 represents anincrease of 8% over last year.
� Other banking operating income of $2,381 million,represents an increase of 9% over last year.
� External funds management income of $701 million(before $38 million of internal income) representsan increase of 30% over last year.
� Life insurance income of $1,268 million representsa decline of 19% over last year.
Cost Ratios
� The Banking cost income ratio has declined from59% for the half year ended June 2000 to 58% forthe current half year.
� The funds management cost income ratio hasdeclined from 70% in the half year ended June2000 to 68% for the current half year. The increasein the ratio over the past six months reflects one offcosts incurred in aligning Stewart Ivory with theColonial business in the United Kingdom.
� The life insurance cost income ratio has increasedfrom 53% for the half year ended June 2000 to 60%for the current half year due to lower investmentearnings and poor persistency and claimsexperience in Asia and New Zealand.
56%
52%53%
73%
70%
66%
59% 60%
58%
60%
58%
68%
40%
45%
50%
55%
60%
65%
70%
75%
Proforma Dec 99 Proforma Jun 00 Dec-00 Jun-01
Banking Life Insurance Funds Management
1,033 1,0351,109 1,153
0
200
400
600
800
1,000
1,200
Proforma Dec 99 Proforma Jun 00 Dec-00 Jun-01$M
illio
ns

Main Financial Indicators
11
Lending Assets Growth
Lending assets spot balances (net of securitisation)have increased by $5 billion or 3% over the prior financialyear. The majority of this growth has been achieved inhousing during the six months ending June 2001, andreflects improved market conditions and the effect ofGroup strategic initiatives.
Funds Under Management
� Total funds under management (FUM) at 30 June2001 were $101 billion, a 15% increase for the year.Total FUM consists of $77 billion in external FUMand $24 billion in FUM managed on behalf of thelife insurance business (Refer table on page 23).
� Retail FUM (including international funds) haveincreased by $10 billion or 42% for the year.
� Wholesale FUM (including international funds) haveincreased by $2 billion or 6% over the year.
� The Group’s custody business administers$74 billion of assets.
Note:
(1) Internal Managed Life FUM relates to the fundsmanaged for the Life Insurance businesses of theGroup.
(2) Total FUM as reported by ASSIRT is re``presentedby Retail, Wholesale and Internal FUM, excluding$3 billion of international funds.
(3) The Wholesale balance of FUM has been adjusteddue to the change in ASSIRT policy of reporting theTactical Global Management fund under overlaymanagement on a cash basis from March 2001, asopposed to reporting the total market exposure.As a result the wholesale balance has beenreduced by $9.5 billion (2000: $8 billion).

COMMONWEALTH BANK OF AUSTRALIA AND CONTROLLED ENTITIES
Main Financial Indicators
12
Shareholder Returns
Earnings Per ShareEarnings per share is up 3 cents in the half year
ended June 2001 compared with the first half. Thisreflects the progressive realisation of synergies from theColonial integration.
Return on Equity� Return on Equity (before abnormals) for the half
year ended June 2001 has increased by 1.52percentage points over the half year endedDecember 2000 from 12.74% to 14.26%. Theannual return on equity before abnormals was13.50%.
� Return on Equity (cash basis) for the half yearended 30 June 2001 has increased by 0.64percentage points over the half year ended31 December 2000 from 12.46% to 13.10%. Theannual return on equity (cash basis) was 12.83%.
Share Price PerformanceTotal Shareholder Return (TSR) is calculated using movements in the share price assuming all dividends are
reinvested. The five year return to 30 June 2001 is 34.2%.
10
20
30
40
50
Jun-97 Dec-97 Jun-98 Dec-98 Jun-99 Dec-99 Jun-00 Dec-00 Jun-01
%
Total Shareholder Return (TSR) for 5 years (%)
Average TSR (ANZ, NAB, Westpac)
91 88 9190
21.19%
13.10%12.46%
20.78%
22.58%
14.26%12.74%
23.07%
0
25
50
75
100
Dec-99 Jun-00 Dec-00 Jun-01
EPSc
0%
5%
10%
15%
20%
25%
ROE
Earning per share - cash basis ROE - cash basis ROE - before abnormals
Banking Performance Summary
13
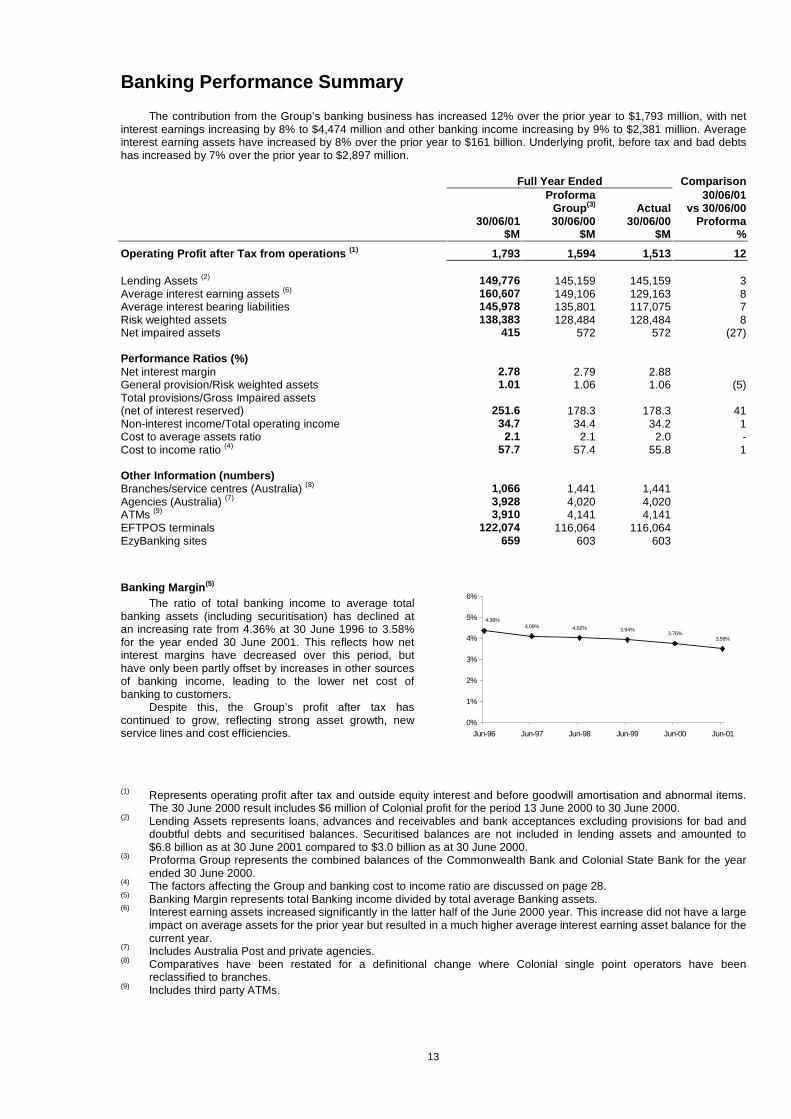
The contribution from the Group’s banking business has increased 12% over the prior year to $1,793 million, with netinterest earnings increasing by 8% to $4,474 million and other banking income increasing by 9% to $2,381 million. Averageinterest earning assets have increased by 8% over the prior year to $161 billion. Underlying profit, before tax and bad debtshas increased by 7% over the prior year to $2,897 million.
Full Year Ended ComparisonProforma 30/06/01
Group(3) Actual vs 30/06/0030/06/01 30/06/00 30/06/00 Proforma
$M $M $M %
Operating Profit after Tax from operations (1) 1,793 1,594 1,513 12
Lending Assets (2) 149,776 145,159 145,159 3Average interest earning assets (6) 160,607 149,106 129,163 8Average interest bearing liabilities 145,978 135,801 117,075 7Risk weighted assets 138,383 128,484 128,484 8Net impaired assets 415 572 572 (27)
Performance Ratios (%)Net interest margin 2.78 2.79 2.88General provision/Risk weighted assets 1.01 1.06 1.06 (5)Total provisions/Gross Impaired assets(net of interest reserved) 251.6 178.3 178.3 41Non-interest income/Total operating income 34.7 34.4 34.2 1Cost to average assets ratio 2.1 2.1 2.0 -Cost to income ratio (4) 57.7 57.4 55.8 1
Other Information (numbers)Branches/service centres (Australia) (8) 1,066 1,441 1,441Agencies (Australia) (7) 3,928 4,020 4,020ATMs (9) 3,910 4,141 4,141EFTPOS terminals 122,074 116,064 116,064EzyBanking sites 659 603 603
Banking Margin(5)
The ratio of total banking income to average totalbanking assets (including securitisation) has declined atan increasing rate from 4.36% at 30 June 1996 to 3.58%for the year ended 30 June 2001. This reflects how netinterest margins have decreased over this period, buthave only been partly offset by increases in other sourcesof banking income, leading to the lower net cost ofbanking to customers.
Despite this, the Group’s profit after tax hascontinued to grow, reflecting strong asset growth, newservice lines and cost efficiencies.
4.09% 4.02% 3.94%3.76%
3.58%
4.36%
0%
1%
2%
3%
4%
5%
6%
Jun-96 Jun-97 Jun-98 Jun-99 Jun-00 Jun-01
(1) Represents operating profit after tax and outside equity interest and before goodwill amortisation and abnormal items.The 30 June 2000 result includes $6 million of Colonial profit for the period 13 June 2000 to 30 June 2000.
(2) Lending Assets represents loans, advances and receivables and bank acceptances excluding provisions for bad anddoubtful debts and securitised balances. Securitised balances are not included in lending assets and amounted to$6.8 billion as at 30 June 2001 compared to $3.0 billion as at 30 June 2000.
(3) Proforma Group represents the combined balances of the Commonwealth Bank and Colonial State Bank for the yearended 30 June 2000.
(4) The factors affecting the Group and banking cost to income ratio are discussed on page 28.(5) Banking Margin represents total Banking income divided by total average Banking assets.(6) Interest earning assets increased significantly in the latter half of the June 2000 year. This increase did not have a large
impact on average assets for the prior year but resulted in a much higher average interest earning asset balance for thecurrent year.
(7) Includes Australia Post and private agencies.(8) Comparatives have been restated for a definitional change where Colonial single point operators have been
reclassified to branches.(9) Includes third party ATMs.

COMMONWEALTH BANK OF AUSTRALIA AND CONTROLLED ENTITIES
Banking Performance Summary
14
Major Balance Sheet ItemsComparison
30/06/01As at 30/06/01 30/06/00(3) vs 30/06/00
$M $M %
Loans, advances and other receivables (1)
Gross Housing 80,284 73,744 9Securitisation (6,773) (3,006) largeHousing (net of securitisation) 73,511 70,738 4Personal 7,768 8,533 (9)Business 32,224 32,437 (1)Corporate 24,198 22,343 8Bank acceptances 12,075 11,108 9Total lending assets 149,776 145,159 3
Trading securitiesCorporate 6,909 7,347 (6)
Deposits and other public borrowingsPersonal 58,620 56,337 4Business 16,351 14,056 16Corporate 42,384 42,201 0
117,355 112,594 4
Debt issuesCorporate 24,484 25,275 (3)
Detailed analysis of the above is provided in Banking - Business Analysis.
(1) Loan balances are before provisions for impairment.
Full Year Ended ComparisonProforma 30/06/01
Group(2) Actual vs 30/06/0030/06/01 30/06/00 30/06/00 Proforma
Operating Profit Summary $M $M $M %
Interest income 11,900 10,402 8,842 14Interest expense 7,426 6,246 5,123 19Net interest income 4,474 4,156 3,719 8Other operating income 2,381 2,178 1,951 9Total operating income 6,855 6,334 5,670 8Operating expenses 3,958 3,633 3,164 9Underlying profit 2,897 2,701 2,506 7Charge for bad and doubtful debts 385 310 196 24Operating profit before abnormal items,goodwill amortisation and income tax 2,512 2,391 2,310 5Income tax expense 705 748 759 (6)Outside equity interests 14 49 38 (71)Operating profit after income tax, beforeabnormal items and goodwill amortisation 1,793 1,594 1,513 12
Detailed analysis of the components of Banking Operating Profit is provided in Banking Analysis of Performance.
(2) Proforma Group represents the combined balances of the banking operations of Commonwealth Bank and Colonial forthe year ended 30 June 2000.
(3) Prior year figures have been adjusted to align with categories as at 30 June 2001 following the amalgamation ofColonial operations and product systems.
Banking - Business Analysis
15
(All figures relate to the year ended 30 June 2001.All comparisons are to 30 June 2000 unless otherwisestated. Market share statistics exclude ASB Bank.)
As shown in the Banking Performance Summary,total lending assets have grown by $4.6 billion to$149.8 billion during the year to 30 June 2001. As at 30June 2001, securitised home loan balances amounted to$6.8 billion, an increase of $3.8 billion over the year.Allowing for this, gross lending assets have increased by$8.4 billion or 6% since 30 June 2000.
Despite this growth, the market has remained verycompetitive and the Group has experienced a smalldecline in market share in the major product groups overthe year. During the early part of the year, while theGroup focussed on the more complex planning stages ofintegration, some business momentum was lost. Over thesecond half of the year the Group regained part of this.
An analysis of the areas of growth is detailed below.
Personal Products
Housing LoansThe Group’s home loan outstandings, including
securitisation, totalled $80.3 billion at 30 June 2001, a 9%increase over the year. Securitised balances were$6.8 billion as at 30 June 2001 compared to $3.0 billionas at 30 June 2000.
Growth in home loans was affected in the first halfby the impact of the GST, the Sydney Olympics andsignificant growth in non-traditional mortgage originationsuch as mortgage broker channels. However, campaignsundertaken to drive balance sheet growth resulted instronger sales in the second half, limiting the decline inthe Group’s total market share of home loans, which was20.3% at June 2001 (source: APRA 06/01).
Personal LendingPersonal Lending balances at 30 June 2001
amounted to $7.8 billion, a reduction of $0.8 billioncompared with the balance at 30 June 2000. Theprincipal balances included within Personal Lending arecredit card outstandings and personal loans. These arediscussed below.
Credit CardsCredit card outstandings for the Group totalled just
over $3.8 billion at 30 June 2001, a 9% increase from thebalance of $3.5 billion at 30 June 2000.
The Group has maintained strong new cardholderaccount growth for the year with the number ofcardholder accounts increasing to 2.8 million. Thenumber of merchants increased to over 146,000 from lastyear with growth encouraged through expanded Internetservices to merchants. The Group’s market share ofCredit Cards has declined marginally to 26.3% as at May2001 from 27.8% last year (Source: ABA).
Personal LoansPersonal loan outstandings for the Group totalled
$3.5 billion at 30 June 2001 compared with $4.2 billion asat 30 June 2000. During the half year to 31 December thereduction was due partly to $0.5 billion of loans toindividuals for infrastructure borrowings which matured.
The Group continues to hold the largest share ofthe personal loan market with 21.9% as at June 2001compared to 23.9% last year (Source: APRA 06/01).
Deposit ProductsAs at 30 June 2001, the Group’s retail deposit base
in Australia stood at approximately $58.6 billion, a 4%increase from June 2000. The Group is the largestacceptor of retail deposits in Australia with a marketshare of 24.0% at June 2001 compared with 25.3% atJune 2000 (Source: APRA All banks). However, therewas a planned reduction due to the non-renewal of somehigh cost Colonial certificates of deposit with consequentbenefits to interest margins.
Share TradingCommonwealth Securities maintained its position
as the leading broker in Australia in terms of the numberof transactions. The total number of clients increasedover the year from 537,000 to 652,000 at 30 June 2001.Over 80% of CommSec trades are now conducted onlinewith the balance by telephone. Service and efficiency hasbeen improved through the launch of initiatives such asVoice Broker, a speech recognition system and enhancedStraight Through Processing across all channels.
Business Products
Business LendingAt 30 June 2001, total Business Lending (excluding
bank acceptances) amounted to $32.2 billion,representing a marginal decline during the year.
Corporate ProductsCorporate Lending balances amounted to
$24.2 billion at 30 June 2001, representing an increase of8% or $2 billion during the year. Corporate Deposits haverisen slightly at 30 June 2001 to $42.4 billion (includingcertificates of deposit).
The Group’s Institutional Banking Division servicesthe Group’s corporate clients with turnover of more than$40 million per annum, Government entities and othermajor financial institutions. The products offered includefinancial markets, corporate finance, securitiesunderwriting, trading and distribution, equities, paymentsand transaction services, investment management andcustody. Many of these products are offered globally tomatch the international operations of the Group’s clients.Highlights during the year included the following:
Financial MarketsThere was a strong growth in the contribution of
Financial Markets with Trading income up 30% due toincreased volume of client transactions and underlyingmarket volatility.
Financial Markets continues to offer a wide range ofinnovative risk management solutions to clients. Newdevelopments this year included various energy riskmanagement transactions for clients using swaps andoptions, the development of products related to theenvironment including the creation of a consumeroriented labelling programme with the AustralianGreenhouse Office, and the continual development offinancial risk management products including Best of TwoAsset Options, Margin Locks, Floating Rate Par Forwardsand Average Strike Options.

COMMONWEALTH BANK OF AUSTRALIA AND CONTROLLED ENTITIES
Banking – Business Analysis
16
Corporate FinanceCorporate Finance undertook a number of
substantial transactions in the twelve months to 30 June2001 including:� An innovative non-recourse project financing
transaction in Victoria for Pulse Energy to fund theacquisition of retail gas and electricity customers inVictoria.
� Joint lead underwriter and arranger of financing forBilliton’s acquisition of the Worsley AluminaRefinery.
� Joint lead arranger for a syndicated facility for anacquisition by CSL Limited.
� A cross border leasing transaction in the UnitedKingdom on behalf of the Royal Mail.
� Co-arranger of a debt package to support anacquisition by Amatek Holdings.Over $17 billion of capital was raised for clients in
the year to 30 June 2001 which represents a 49% growthon that raised in the previous financial year. Of thisamount 39% was by originations, 36% financing by directlending and the balance by syndicated loans and equity.
Equity Capital MarketsThe Group established a position in the equity
capital markets during the year and participated ina number of raisings including managing the Initial PublicOffering of shares by Pan Pharmaceuticals andunderwriting and distributing the Resettable PreferenceShare Issue for Australand Holdings.
Transaction ServicesTransaction Services, which provides cash
management solutions for clients through corporateaccounts, payments and information services,experienced strong growth over the financial year. Thepayments business is now positioned as a leader in highvolume payment processing and the Group is the largestclearer in the domestic market.
Commonwealth Custodial ServicesCommonwealth Custodial Services has
consolidated its position in the market with $74 billion ofassets under administration at 30 June 2001.
Customer ServiceThe Group operates the largest financial services
distribution network in the country, with sales and serviceprovided through a wide range of direct customer contact,self-service and third party channels. The integration ofthe Colonial banking operations over 2000/01 has furtherexpanded the range of delivery options available to ourcustomers. Strategic emphasis is on generating customerservice, value and efficiency across the distributionnetwork, with a number of transformational changes tomanagement structures and systems over 2000/01providing a strong platform for future growth.
Direct contact service channelsThe combined branch network of Commonwealth
and Colonial was reduced by 375 over 2000/01, from1,441 as at June 2000 (1,074 Commonwealth,367 Colonial) to 1,066 as at June 2001. Included in thisreduction were 290 integration-related amalgamations.In addition, 536 branches were refurbished during theyear.
In integrating Colonial operations, a key priority wasto ensure that the particular skills and competencies ofboth organisations were effectively leveraged goingforward. A number of former Colonial franchisees havebeen retained in key network roles, including 15 inRegional and Rural locations.
Through integration, a wider range of branch typesis now available to customers, with further reconfigurationof the network planned to better meet the needs ofspecific locations and customer segments. A newnetwork structure introduced in October 2000 draws onthe best elements of both organisations to improvealignment and customer focus in key markets. Togetherwith the implementation of a new sales and serviceleadership system promoting greater ownership,accountability and reward for performance, thesechanges are translating into a more client focussed,efficient, effective and committed delivery network.
In addition to branches, there were importantdevelopments in a number of other direct customercontact channels over the year. A comprehensivetransformation was undertaken of managementstructures and systems across the Group’s BusinessBanking arm thereby allowing the number of BusinessBanking Centres to be reduced from 97 to 83.
The Group’s mobile banker sales force continues toplay an important role in the home loan market, meetingcustomer demand for greater convenience andaccessibility. In support of the Group’s strategy to bepositioned to meet the full financial needs of customers,insurance managers have been appointed, trained andaccredited to meet the insurance risk needs of theCommercial Business, Middle Market and PersonalSegments. As a result of the Colonial integration, thecombined Financial Advisor network of FinancialPlanners and Investment Consultants has expanded to670. This network is fully accredited to sell a suite ofinternal and external products.
The Group’s direct customer contact networkcontinues to be augmented by the alliance with AustraliaPost. Personal Banking services are available at 3,738Australia Post agencies across the country, and followinga successful trial, transactional banking services forbusiness clients has expanded to 112 Australia Postlocations.
Electronic and Direct BankingCustomer usage of direct and self-service banking
continues to gain pace. The total number of transactionsperformed in direct/electronic channels increased by 22%over the year while teller transactions continued todecline. As a result, the proportion of total transactionscarried out in-branch was further reduced, from 18.8% to15.6% this year. NetBank customer registrationssurpassed 1.0 million, up from 320,000 last year. Overthe year, NetBank processed some 152 milliontransactions, up from 49 million in the previous year. TheGroup’s total online customers numbered over 1.5 million(including Commonwealth Securities Ltd customers) at30 June 2001.
Telephone banking password customers nowexceed 5 million (up 33%). During the year, in excess of110 million calls were received on the 132221 customerservice line (up 11%), peaking at 2.5 million calls perweek. Two new call centres were established over theyear, designed to both meet public assurancecommitments arising from integration and to cater for ourexpanding requirements going forward.
Banking - Business Analysis
17
ATM and EFTPOS usage continue to grow strongly,with total transactions up 6% and 40% respectively over2000/01. The group retains the largest proprietary ATMand EFTPOS terminal networks in the country (2,910 and122,074 terminals respectively) plus acquired thetransactions of a further 1,000 third party ATMs.
Woolworths EzyBankingWoolworths EzyBanking is available through 659
Woolworths stores nationally. Sales of transactionaccounts (Ezy Action) and credit cards (Ezy Mastercard)during the year have been above expectations with morethan 425,000 account holders signed up as at 30 June2001. Approximately 35% of these customers are new tothe Commonwealth Bank Group.
Third PartyThrough the acquisition of Colonial Limited, the
Group has increased the range of distribution networkspreviously used to include:� Multi-agents and life brokers.� Authorised financial planners through wholly owned
businesses.� Independent financial planners.� Insurance franchisers.� Mortgage brokers.
Distributors in these new channels number over5,000.
United KingdomGiven the high level of competition, opportunities
are being explored to leverage the Group’s presence inthe UK flowing from the Colonial acquisition. This willinvolve merging the Newworld UK business with theexisting UK Wealth Management Business.
New Zealand Banking OperationsGrowth in ASB’s banking operations was
particularly strong in relation to personal, business andrural lending. This contributed to a total annual lendinggrowth for total loans of 10%, compared to the marketannual growth rate of 3.7% (Source: PSCR – ReserveBank of New Zealand). Customer retention and customeracquisition were important drivers of volume growth, withthe customer base increasing by 2.3% in the past year toreach over 880,000 customers.
At 30 June 2001, ASB Bank had total assets ofNZ$20.1 billion (2000: $17.3 billion), including totaladvances of NZ$16.2 billion (2000 $14.4 billion).

COMMONWEALTH BANK OF AUSTRALIA AND CONTROLLED ENTITIES
Banking Analysis of Performance
18
Net Interest IncomeFull Year Ended Comparison
Proforma 30/06/01Group(1) Actual vs 30/06/00
30/06/01 30/06/00 30/06/00 Proforma$M $M $M %
Interest IncomeLoans 10,246 9,031 7,663 13Other financial institutions 280 198 191 41Liquid assets 110 82 78 34Trading securities 548 465 295 18Investment securities 655 598 586 10Dividends on redeemable preference shares 54 24 24 largeOther 7 4 5 75Total Interest Income 11,900 10,402 8,842 14
Interest ExpenseDeposits 5,042 4,386 3,773 15Other financial institutions 328 300 297 9Short term debt issues 902 762 671 18Long term debt issues 759 560 171 36Loan capital 374 237 210 58Other 21 1 1 largeTotal Interest Expense 7,426 6,246 5,123 19Net Interest Income 4,474 4,156 3,719 8
Net Interest Income30/06/01 – Proforma 30/06/00 (up 8%)
Net interest income for the year increased by 8% or$318 million from $4,156 million to $4,474 million.
The increase in net interest income was the resultof the growth in net interest earning assets. As shown onpage 13, average interest earning assets grew by$12 billion or 8% from $149 billion at 30 June 2000 to$161 billion at 30 June 2001.
This generated additional net interest income of$334 million, offset by a small decline in the net interestmargin from 2.79% to 2.78% resulting in a reduction innet interest income of $5 million, and a one day variancein the accounting periods reducing net interest income by$11 million.
The table below highlights the effect of movementsin net interest earning assets and interest margin on netinterest income.
Financial Year 2001 Financial Year 2000Full Year vs Proforma Financial Year 2000 vs Financial Year 1999INCREASE/DECREASE $M $M
Due to changes in average volume ofinterest earning assets and interest bearing liabilities 334 424Due to changes in interest margin (5) (232)Due to days variance in periods (11) -Change in net interest income 318 192
The growth in average interest earning assetsreflects:
A strong growth in home loans in the latter half ofthe year ended June 2000 as the market anticipatedincreased prices following the introduction of the GST.The current financial year had a slow first quarter in homelending, where the introduction of the GST and postOlympic factors contributed to softer market conditions.This was compounded by unexpected growth in thevolume of originations through mortgage brokers. Homeloan volumes picked up strongly over the rest of the yearas a result of an extensive advertising campaignsupported by nil establishment fee offers, and animprovement in market conditions.
While market share declined across a number ofproducts, growth in balances over the final monthsreflected a strong level of home loan approvals.
Commercial lending had a slow first half, howeverduring the second half volumes improved providing clearindications that the extensive rebuilding programmeundertaken across the network during 2000/01 is drivingimproved results.
The acquisition of Trust Bank during the priorfinancial year contributed to the current year growth inaverage interest earning assets.
(1) Proforma Group represents the combined results of Commonwealth Bank and Colonial for the year ended 30 June2000.

Banking Analysis of Performance
19
Group Interest Margins and SpreadsThe following table shows both actual and proforma
margins and spreads for the Group for the June 2000 andJune 2001 financial years. Interest spread represents thedifference between the average interest rate earned andthe average interest rate paid on funds.
Interest margin represents net interest income asa percentage of average interest earning assets.
The calculations of margins and spreads forAustralia and Overseas include an allowance for transferof offshore funding used to finance onshore lending. Thelower overseas margins and spreads reflect the effect ofthe wholesale funding nature of that business.
Full Year EndedProforma
Group Actual30/06/01 30/06/00 30/06/00
% % %
AustraliaInterest spread (1) 2.56 2.58 2.71Benefit of interest free liabilities, provisions and equity (2) 0.43 0.40 0.42Net interest margin (3) 2.99 2.98 3.13
OverseasInterest spread (1) 1.06 1.10 1.22Benefit of interest free liabilities, provisions and equity (2) 0.55 0.42 0.30Net interest margin (3) 1.61 1.52 1.52
GroupInterest spread (1) 2.32 2.38 2.47Benefit of interest free liabilities, provisions and equity (2) 0.46 0.41 0.41Net interest margin (3) 2.78 2.79 2.88
(1) Difference between the average interest rate earned and the average interest rate paid on funds.(2) A portion of the Group’s interest earning assets is funded by interest free liabilities and shareholders’ equity. The
benefit to the Group of these interest free funds is the amount it would cost to replace them at the average cost offunds.
(3) Net interest income divided by average interest earning assets for the period.
Group Interest Margin30/06/01 – Proforma 30/06/00 (down 1 basis point)30/06/01 – Actual 30/06/00 (down 10 basis points)
The Group net interest margin for the year to30 June 2001 decreased slightly by 1 basis point from theprior year to 2.78%.
There was a number of factors which impacted theaverage rate. In addition to three cash rate increases inthe latter part of the June 2000 financial year there wasalso one cash rate increase and three reductions in theyear to June 2001. The net effect of the product repricingfollowing these changes was to put pressure on the netinterest margin.
Partly offsetting this was the benefit to net interestmargins from the difference of market driven short termwholesale rates being below official cash rates during theyear due to an expectation by the market that officialrates would fall. However, the market has started toanticipate the end of the easing cycle in official rates withthe next move more likely to be an increase.
Average deposit balances on low interest payingaccounts were higher over the year than the prior year,mainly as a result of businesses accumulating their GSTinstalments. This benefited the net interest margin byincreasing the amount of interest free liabilities.

COMMONWEALTH BANK OF AUSTRALIA AND CONTROLLED ENTITIES
Banking Analysis of Performance
20
Other Banking Operating IncomeThe following table sets forth the Group’s other banking operating income for the year ended 30 June 2001 together
with comparatives.Full Year Ended
Proforma 30/06/01Group Actual vs 30/06/00
30/06/01 30/06/00 30/06/00 Proforma$M $M $M %
Lending fees 602 623 554 (3)Commission and other fees 1,173 1,066 946 10Trading income 426 327 311 30Dividends 14 20 20 (30)Net gain on investment securities 56 12 12 largeNet profit on sale of property, plant and equipment 25 14 14 79General insurance premium income 107 104 104 3Less general insurance claims (57) (55) (55) 4Other 35 67 45 (48)Total Other Banking Operating Income 2,381 2,178 1,951 9
Other Banking Operating Income
30/06/01 – Proforma 30/06/00 (up 9%)
Other Operating Income increased by 9% or$203 million from $2,178 million to $2,381 million duringthe current year. The principal reasons for the overallincrease are set out below.
Lending Fees
30/06/01 – Proforma 30/06/00 (down 3%)
Lending fees have dropped by 3% or $21 million to$602 million over the prior year mainly due to a number ofnil entry and discounted home loan establishment feeoffers during the current year. This was part of theGroup’s strategy to build lending balances to improvefuture earnings potential.
The lower establishment fees were partly offset byincreases in other lending fees based on higher volumes.
Commission and Other Fees
30/06/01 – Proforma 30/06/00 (up 10%)
Growth in commission and other fees has beendriven by Credit Cards with increased sales activity fromboth merchants and cardholders, although growth hasslowed since last year. There has been a 27% increase inthe value of merchants sales and 20% increase in thevalue of credit cardholders sales.
Retail transaction fees for the year to 30 June 2001represent 12% of Other Banking Operating income (4% oftotal Banking Operating income) which is consistent withlast year.
Trading Income
30/06/01 – Proforma 30/06/00 (up 30%)
The Group’s Financial Markets operationscontributed $426 million of trading income, representinggrowth of 30% or $99 million on the previous year.Trading Income improved due to market volatility in theinterest rate and foreign exchange markets. Volumes ofclient transactions grew significantly as a result of thishigher level of underlying volatility. This growth in tradingincome did not result in significant additional riskexposure.
Dividends
30/06/01 – Proforma 30/06/00 (down 30%)
Dividend income represents dividends earned onthe Group’s strategic investments.
Net Gain on Investment Securities
30/06/01 – Proforma 30/06/00 (up $44 million)
Gains during the current year included the sale ofthe Brisbane Airport investment and the sale of theGroup’s interest in IPAC Securities.
Net Profit on Sale of Property Plant and Equipment
30/06/01 – Proforma 30/06/00 (up 79%)
The Group continued its sale and leasebackstrategy during the current year, with the sale of severalmajor properties within the Sydney CBD.
General Insurance Income (net of claims)
30/06/01 – Proforma 30/06/00 (up 3%)
General Insurance premium income less claims hasremained stable at $50 million during the current financialyear.

Banking Analysis of Performance
21
Charge for Bad and Doubtful DebtsThe following table sets out the charge for bad and doubtful debts for the year ending 30 June 2001 together with
comparatives.
Full Year EndedProforma
Group Actual30/06/01 30/06/00 30/06/00
$M $M $M
Specific ProvisioningNew and increased provisioning 495 n/a 236Less provisions no longer required (84) n/a (96)Net specific provisioning 411 246 140Provided from general provision (411) (246) (140)Charge to profit and loss - - -
General provisioningDirect write offs 35 34 34Recoveries of amounts previously written off (88) (54) (54)Movement in general provision 27 84 76Funding of specific provisions 411 246 140Charge to profit and loss 385 310 196Total Charge for Bad and Doubtful Debts 385 310 196
Total charge for bad and doubtful debts increased by 24% to $385 million during the year to 30 June 2001, primarilyrelating to a small number of large corporate and commercial lending exposures that became impaired during the year andwere provisioned for potential loss.
Provisions for Impairment30/06/01 30/06/00
As at $M $M
General Provisions 1,399 1,358Specific Provisions 234 432Total Provisions 1,633 1,790
Total provisions for impairment as a % of gross impaired assetsnet of interest reserved 251.6 178.3
Specific Provisions for impairment as a % of gross impaired assetsnet of interest reserved 36.06 43.03
General provisions as a % of risk weighted assets 1.01 1.06
Total Provisions for Impairment for the Group at30 June 2001 were $1,633 million, down 8.8% from 30June 2000. This level of provisioning is consideredadequate to cover any bad debt write offs from the currentlending portfolio having regard to the current outlook.
Specific provisions for impairment have decreased46% from $432 million to $234 million from 30 June 2000to 30 June 2001, primarily as a result of increased writeoffs of the impaired asset portfolio including the effect ofapplying the Commonwealth policy to Colonial portfolios.
The general provisions for impairment haveincreased to $1,399 million at 30 June 2001 from$1,358 million at 30 June 2000, an increase of 3%. Thegeneral provision as a percentage of Risk WeightedAssets is at 1.01%, down from 1.06% at 30 June 2000.This level is consistent with that of other major Australianbanks.
Gross impaired assets less interest reserved havedecreased 35% from $1,004 million to $649 million overthe year. This has been primarily due to additions to grossimpaired assets (including interest reserved) for the yearof $707 million which have been more than offset by writeoffs and realisations totalling $1,125 million.
This has resulted in a decrease in the coverage ratioof specific provisions to 36.06% from 43.03%, reflectingthe positive management of impaired assets, which weregenerally well provisioned, and have now been written off.

COMMONWEALTH BANK OF AUSTRALIA AND CONTROLLED ENTITIES
Funds Management – Business Analysis
22
The funds management businesses have contributed $149 million to the Group’s result for the year. This represents anincrease of $38 million or 34% over the prior year. The growth in operating profit reflects strong growth in external fundsunder management which have increased by $11.7 billion to $77 billion. Funds management income has increased by 29%partly offset by an increase in variable sales and processing expenses.
The following tables set forth the Group’s Funds Management result for the year ending 30 June 2001 together withcomparatives.
Full Year Ended ComparisonProforma 30/06/01
Group Actual vs 30/06/0030/06/01 30/06/00 30/06/00 Proforma
$M $M $M %
Funds ManagementOperating income - external 701 541 143 30Operating income - internal (1) 38 32 10 19Total operating income 739 573 153 29Operating expenses 496 410 103 21Operating profit before tax 243 163 50 49Income tax expense 94 52 14 81Operating profit after tax 149 111 36 34
The Funds Management business manages both internal funds (Life Insurance statutory fund assets) and externalfunds (wholesale and retail). The tables below show the split of each type of funds managed.
30/06/0130/06/01 30/06/00 vs 30/06/00
As at $M $M %
Assets held and funds under management (FUM) (2)
Funds management (4) (5) 76,954 65,266 18Internal life insurance funds 24,527 22,916 7Total FUM 101,481 88,182 15Other life and funds management assets (3) 14,551 10,235 42Total 116,032 98,417 18
Australia 91,810 72,456 27United Kingdom 14,953 19,202 (22)New Zealand 4,650 3,270 42Asia 4,619 3,489 32Total 116,032 98,417 18
Total expenses to funds under management (6) 0.5% 0.5% n/aTotal funds management expense to Income (7) 67.1% 71.6% n/a
(1) Income received from the life insurance business to manage statutory funds.(2) Excludes non-Group funds under trusteeship, custody and administration.(3) Includes life investment assets managed by parties other than the Group funds management businesses, and other
non-investment life assets (including excess of market value over net assets of life insurance subsidiaries).(4) Funds under management exclude funds under tactical overlay management. In accordance with revised ASSIRT
reporting requirements 30 June 2000 comparatives have been restated to exclude $8 billion in funds under tacticaloverlay management at 30 June 2000 and $9.5 billion from 30 June 2001.
(5) Represents total external funds under management of the Group. ASSIRT reporting includes external funds undermanagement, and funds managed on behalf of the life insurance companies in the Group which are included within lifeinsurance assets. ASB Group funds under management are not included in the ASSIRT reporting.
(6) The 30 June 2000 ratio is calculated on a proforma basis.(7) Total funds management expense to income ratio is calculated on a gross of commission basis due to the differing cost
structures of the funds management businesses across the Group. The 30 June 2000 ratio is calculated on a proformabasis.

Funds Management – Business Analysis
23
The analysis of the movement of funds by product category is as follows:
Year to Date June 2001Opening
Portfolioand Other Closing
Balance Inflows Outflows (9) Returns Balance
Funds Under Management $M (including Life Insurance)
Retail 24,554 20,616 (12,337) 1,115 33,948Wholesale (8) 40,712 13,228 (12,436) 1,502 43,006Internal managed life 22,916 4,964 (5,045) 1,692 24,527Total FUM 88,182 38,808 (29,818) 4,309 101,481Other Life assets (3) 10,235 3,051 - 1,265 14,551Total 98,417 41,859 (29,818) 5,574 116,032
(8) Wholesale opening balance has been reduced by $8 billion to exclude tactical overlay management (Refer Note 4).(9) Internal managed life outflows include the transfer of $2.5 billion of funds during the current financial year relating to
assets acquired by Winterthur as part of the sale of Colonial UK Life.

COMMONWEALTH BANK OF AUSTRALIA AND CONTROLLED ENTITIES
Funds Management – Business Analysis
24
Performance AnalysisThe result has been driven by a strong growth in
income, which has increased by $166 million from$573 million in the financial year ended 30 June 2000 to$739 million in the current financial year. This growth inincome is due to an increase of $13 billion or 15% infunds under management (FUM).
Expenses for the business reflect increasedvolumes; however, some one off expenses were incurredin integrating the Stewart Ivory acquisition into the FirstState business in the United Kingdom.
Tax expense has increased due to thenon-recognition of tax benefits in relation to certainoffshore tax losses.
Funds Under Management PerformanceThe combined Commonwealth and Colonial First
State funds management business rank first in terms ofboth retail and wholesale FUM (Source: ASSIRT March2001).
Total external FUM have increased by $11.7 billionor 18% to $77 billion over the year to 30 June 2001.Internally managed life FUM increased by 7% or$1.6 billion over the year to 30 June 2001. The combinedlife insurance assets and funds under managementtotalled $116 billion at 30 June 2001 (Refer page 22).
The growth in assets held and funds undermanagement of $18 billion to $116 billion was achievedacross retail ($9 billion), wholesale ($3 billion) and lifeinsurance assets ($6 billion).
Colonial First State InvestmentsColonial First State Investment’s (CFSI) FUM grew
23 % with strong growth recorded in both wholesale andretail funds. New business inflows remained strong duringthe year, particularly in Australia.
The number of active accounts in Australiaincreased from 565,000 at 30 June 2000 to 793,000 at30 June 2001, representing an increase of 40%. Thisenabled Colonial First State to improve its retail marketshare from 5.4% to 6.1% (Source: ASSIRT March 2001).Colonial First State continues to have a five star rating.
During the year, the property asset managementbusinesses of Commonwealth Property and Colonial FirstSate were merged, giving the combined groupapproximately $12 billion in property assets undermanagement.
Commonwealth Funds Management BusinessesCommonwealth Funds Management Businesses
total FUM grew by 6 % over the year mainly due to strongretail funds growth which increased 78% over the year to$12 billion at 30 June 2001. This included the transfer inof $2.3 billion of funds from Colonial life which werepreviously managed by CFSI. Excluding this transfer theincrease was 44% for the year. This growth reflectedstrong sales in retail unit trust (entry fee product) andretail cash management trusts. As at 30 June 2001$9 billion was managed on behalf of a diverse range ofwholesale clients, including state, local andsemi-government entities, corporations, investment fundsand superannuation funds.
New Products and InitiativesThe CFSI group continued to develop its
international business in the United Kingdom and Asia,which trade under the name of First State Investments. Inthe UK, the integration of the Stewart Ivory business(acquired in March 2000) was completed giving the UKbusiness a funds management and private client platformfor growth. In Hong Kong, a number of new productswere launched including the New China Fund, whichinvests in Chinese corporations through the Chinese andHong Kong stock markets.
A number of enhancements to CFSI’s onlineservices were made during the year including extensionsto FirstNet Adviser, an online service that allows advisorsenquiry access to their clients’ investment details. CFSIinvestors can transact online, with functionality allowingadditional investments to existing accounts, withdrawalsto a nominated bank account and switching of investmentmonies between a range of Managed Investment Funds.
In May 2001, CFSI launched the Diversified PrivateEquity Fund, a public offer fund that invests in a portfolioof quality unlisted companies.

Life Insurance – Business Analysis
25
The life insurance operations contributed$320 million to the Group’s result for the year, which isa decrease of $43 million from $363 million for the year to30 June 2000. The effect of the decline in world equitymarkets on investment earnings on life insurance funds,together with poor claims and persistency experiencewere the principal reasons for the reduction in the profitfrom life insurance operations.
As at 30 June 2001, life insurance assets totalled$39 billion, an increase of $6 billion or 18% over the year.The results from the Group’s life insurance operations aredetailed on the following pages. During the early part ofthe year while the Group focussed on the more complexplanning stages of integration, some business momentumwas lost. The Group is now starting to regain part of this.
The following table sets forth the Group’s Life Insurance Income result for the year ending 30 June 2001 together withcomparatives.
Full Year Ended ComparisonProforma 30/06/01
Group Actual vs 30/06/00Summary Profit and Loss 30/06/01 30/06/00 30/06/00 Proforma(excluding abnormal income and appraisal value uplift) $M $M $M %
Life InsuranceMargin on Services operating income - external 1,268 1,557 326 (19)Operating expenses - external (716) (779) (140) (8)Operating expenses - internal (1) (38) (32) (10) 19Total expenses (754) (811) (150) (7)Operating profit before tax 514 746 176 (31)Income tax expense 194 383 47 (49)Operating profit after tax 320 363 129 (12)
(1) Management charge paid to Funds Management.
The table above details the operating income,operating expenses and tax expense from the Group’slife insurance businesses, based on the disclosurerequired by Accounting Standard AASB 1038.
It should be noted that income, operating expensesand tax expense included in the table above includesboth policyholders’ and shareholders’ components.
Included within tax expense for the year is$94 million relating to policyholder earnings, comparedwith $187 million last year. The reduction is mainlyattributable to reduced investment earnings on behalf ofpolicyholders.
The operating profit after tax relates toshareholders. In order to gain a more informativeunderstanding of the shareholder profit after tax, thesources of profit are analysed in the table below.
The table below details the sources of after tax profit from the Group’s life insurance operations.
Full Year Ended ComparisonProforma 30/06/01
Group Actual vs 30/06/0030/06/01 30/06/00 30/06/00 Proforma
$M $M $M %
Sources of life insurance operating profit (excluding abnormal income)
The Margin on Services operating profit after income tax is represented by:
Planned profit margins 257 225 121 14Experience variation (63) (20) (8) largeNew business losses / reversal of capitalised losses (2) 13 1 largeOperating margins 192 218 114 (12)Investment earnings on assets in excess of policyholder liabilities (2) 126 143 13 (12)Other 2 2 2 -Operating profit after tax 320 363 129 (12)
(2) Includes a gain of $46 million in the current year resulting from the transfer of certain strategic investments to the lifeinsurance business.
COMMONWEALTH BANK OF AUSTRALIA AND CONTROLLED ENTITIES
Life Insurance – Business Analysis
26
Underlying results of life insurance businesses by geographical region.The table below details the underlying results of the Group’s life insurance businesses by geographical region.
Australia New Zealand AsiaProforma Proforma Proforma
Group Group GroupFull Year Ended 30/06/01 30/06/00 30/06/01 30/06/00 30/06/01 30/06/00
$M $M $M $M $M $M
Operating Margins 190 201 23 21 (21) (4)Investment earnings on assets in excess of policyholderliabilities 129 112 (5) 15 2 16Other - 1 1 - 1 1Operating profit after tax 319 314 19 36 (18) 13
Operating margins in Australia decreased to$190 million from $201 million in the prior year reflectinglower policyholder investment returns, and increasedclaims offset by growth in the investment-linked portfolio,particularly superannuation and allocated pensionproducts. The disability trends experienced in the first halfhave been controlled through improvements in claimsmanagement and repricing which should protect marginson this line of business in the future.
In addition experience variations in the prior year inAustralia reflected some positive one off items and lossreversals that have not been repeated in the current year,and hence operating margins are lower in the currentreporting period.
Expense integration synergies achieved to date arereflected in the current year operating margins. Theexpense synergies reflect the benefits of the integrationof the Colonial life companies which occurred in the firsthalf of the June 2000 financial year and the benefits ofthe progressive integration of the Colonial andCommonwealth life companies in the current reportingperiod.
The Australian life business has experienced salespressure on its master fund business, although acrossthe Group this was largely compensated by strong salesgrowth of complementary products by the fundsmanagement businesses. While this did not materially
impact the profit margin in the current year, it did impactthe life business appraisal value (Refer Summary of LifeInsurance and Funds Management Valuations – page27).
Margins on the Asian life insurance business havefallen by $17 million in the current year. The primarydriver of this is persistency rates in Hong Kong. Althoughpersistency rates are improving, the residual effect fromlarge acquisitions of agents in 1998/99 and continuedpoaching of staff continues to depress margins.
Investment returns on shareholders funds for theyear ended 30 June 2001 (assets in excess ofpolicyholder liabilities) were $126 million which was$17 million lower than in the prior year. Investmentreturns were lower in all regions due to the globaldownturn in equity markets and some investment writedowns within the New Zealand portfolio. As part ofa re-balancing of the Group’s exposure to equities, duringthe year certain strategic investments previously held bythe Bank, which were held at cost, were transferred to thelife insurance operations where assets are reported atmarket value. This resulted in a gain of $46 million aftertax being reported within investment earnings on assetsheld in excess of policyholder liabilities. Life insuranceassets in excess of liabilities amounted to approximately$2.6 billion as at 30 June 2001. The Group hasmaintained a balanced weighting between growth andfixed interest investments during the period.
Full Year Ended ComparisonProforma 30/06/01
New Business – Life Insurance and Superannuation Group Actual vs 30/06/0030/06/01 30/06/00 30/06/00 Proforma
$M $M $M %
Master Fund/Trusts 4,727 4,333 2,646 9Risk 295 253 46 17Annuities, bonds and other statutory fund products 901 1,153 348 (22)Total 5,923 5,739 3,040 3
Details of the Group’s new business mix for lifeinsurance products is set out in the above table.
On a pro-forma basis, sales of new business grewby 3% over the year. This reflects growth across allregions.
The growth within Australia represents an increasein masterfund/trust products and risk business offset bya decline in Annuities and Bonds.
The growth in masterfund/trust products has been inpersonal and corporate superannuation. Margins on theseproducts remain strong, and while there is some pressureon third party originated business overall there has beenno margin compression.
Sales of life insurance bonds and traditional forms oflife insurance investment business within Australia havefallen over the year. This is in line with expectations, asinvestors switch to masterfund/trust products.
Further growth in Australia is expected following theintroduction of a more comprehensive life insurance riskproduct range to the branch network and the introductionof specialist risk writers for both personal and businesslines. New member services are being developed tostrengthen the Group’s offerings to this market.
Asian new business sales are above the prior year.The largest areas of growth have been in Thailandfollowing expansion of its agency force, and Hong Kongfollowing the launch of the Mandatory Provident Fund(MPF).
The launch of the MPF funds is a one off event andthe impact that it had on the current year’s new businessis not expected to be repeated in future years.
New Zealand growth has primarily been within therisk products and the masterfund/trust product offerings.

Summary of Life Insurance and Funds Management Valuations
27
The following table sets out the components of the carrying values of the Group’s life insurance and funds managementbusinesses. These are Directors’ valuations based on appraisal values determined by independent actuaries TrowbridgeConsulting. The key actuarial assumptions that have been used by the independent actuaries are also summarised.
As at 30 June 2001 Life Insurance FundsAustralia New Zealand Asia(1) Management Total
$M $M $M $M $M
Shareholders net tangible assets 1,643 236 719 269 2,867Value of inforce business 706 135 101 618 1,560Embedded Value 2,349 371 820 887 4,427Value of future new business 786 265 123 2,402 3,576Carrying Value 3,135 636 943 3,289 8,003
30 June 2000 Carrying Value 3,015 604 875 2,242 6,736
Increase to 30 June 2000 120 32 68 1,047 1,267
Analysis of Movement since 30 June 2000 Life Insurance FundsAustralia New Zealand Asia Management Total
$M $M $M $M $M
Profits (2) 273 19 (18) 149 423Opening Fair Value Adjustments - - (30) - (30)Net Capital Movements (3) (269) 39 179 77 26Transfers / Acquisitions of Business (4) - - - 34 34Change in Shareholders NTA 4 58 131 260 453Synergies Credited to Goodwill (4) 332 - - - 332Transfers / Acquisitions of Business (5) (183) - - 191 8Net Appraisal Value Uplift (33) (26) (63) 596 474Increase to 30 June 2001 120 32 68 1,047 1,267(1) The Asian Life businesses are not held in the market value environment and are carried at net assets plus an excess
representing the difference between appraisal value and net assets at the time of acquisition. This excess whicheffectively represents goodwill is being amortised on a straight line basis over 20 years.
(2) Excluding the gain of $46 million resulting from the transfer of certain strategic investments to the life insurancebusiness.
(3) Includes dividends paid, capital injections and payments for investments in controlled entities.(4) Represents the inclusion of net assets for funds management businesses not held in a market value environment.(5) This item includes a transfer of business from the life insurance business to the funds management business
($183 million). Balance of $8 million represents goodwill on acquisition of State Street.
Change in Life Insurance and Funds ManagementValuations
The valuations adopted above have resulted in a totalvaluation increase of $1,267 million since 30 June 2000.
The main components of the increase comprise:� Total profits earned for the year of $423 million.� Opening fair value adjustments to the Asian life
operations totalling $30 million representing changedassumptions on tax and investment earnings in theopening valuation.
� Realisation of expense and revenue synergybenefits arising on the Colonial integration of$332 million. These have been credited againstgoodwill.
� Net appraisal value uplift of $474 million for the year.The net appraisal value uplift of $474 million includes
$596 million relating to the funds managementbusinesses. This reflects strong growth in funds undermanagement which have increased by 15% over the yearto 30 June 2001 and lower expense levels arising fromincreased scale in the businesses.
Offsetting this, the life insurance businessesappraisal values reduced by $122 million. This resultreflects lower than expected growth in sales volumes inthe Australian business and the impact of lower thanexpected investment returns during the year.
A partial write off of the ‘excess’ in relation to theAsian life businesses and lower than expected businesspersistency experience in the New Zealand business alsocontributed to the reduced uplift.
Further details on the movement in carrying value forthe year are included in Note 34.
Valuation AssumptionsThe key changes in assumptions used in the life
insurance appraisal valuations since 30 June 2000 are:� Investment earnings rates, discount rates and new
business growth rates have been reduced by 0.5%to reflect changes in long term interest rates.
� New business volumes for life insurance business inAustralia have been slightly reduced reflecting lowerthan expected growth in sales during the year (ReferLife Insurance Business Analysis).
� A slight increase in disability claims in Australia andNew Zealand.
� Business persistency in New Zealand has beenreduced in light of recent poor persistencyexperience.The key changes in assumptions used in the funds
management appraisal valuations since 30 June 2000 are:� Investment earnings rates, discount rates and new
business growth rates have been reduced by 0.5%to reflect changes in long term interest rates.
� New business volumes for the funds managementbusinesses have been increased based on improvedexperience during the year (Refer FundsManagement Business Analysis).
� Expense levels for the funds managementbusinesses have decreased slightly reflectingincreased scale in the businesses.Further details on actuarial assumptions can be
found in Note 34.

COMMONWEALTH BANK OF AUSTRALIA AND CONTROLLED ENTITIES
Group Operating Expenses
28
The following table sets forth the Group’s operating expenses for year ended 30 June 2001 together with comparatives.
Full Year Ended ComparisonProforma 30/06/01
Group Actual vs 30/06/0030/06/01 30/06/00 30/06/00 Proforma
$M $M $M %
Expenses from - Existing operations 5,089 4,822 3,407 6Expenses from - Business acquisitions and GST (net of synergies) 81 - - n/aTotal Operating Expenses 5,170 4,822 3,407 7
Expenses by category as follows:
Staff 2,360 Refer note (2) 1,705Occupancy and equipment 604 " 437Information technology services 748 " 571Other expenses 1,458 " 694Total Operating Expenses 5,170 " 3,407
Banking 3,958 3,633 3,164 9Life Insurance 716 779 140 (8)Funds Management 496 410 103 21Total Operating Expenses 5,170 4,822 3,407 7
Cost to average assets held and funds under management (1) 1.75 1.85 1.85 (5)
(1) The fall in cost to average assets held and funds under management reflects the strong growth in funds undermanagement (up $13 billion or 15% on a proforma basis) and on balance sheet assets, including life insurance (up$4 billion or 42%) over the past 12 months. In contrast operating expenses have risen 7%.
(2) Proforma is not available as Colonial Group did not prepare expense breakdown on this basis.
The Group’s operating expenses have increased$348 million or 7% from $4,822 million for the year ended30 June 2000 to $5,170 million for the current year.
Expenses from existing operations have increasedby $267 million or 5.5% from $4,822 million to$5,089 million in the current year. The increase inexpenses primarily relates to:� Volume related increases of $122 million,
predominantly relating to the Funds Managementbusinesses and increased loyalty costs in the Cardsbusiness.
� The finalisation of an enterprise bargainingagreement with staff resulted in a 4% increase insalaries effective from 1 July 2000. This added$97 million to costs.
� Asian expenses incurred in developing the lifeinsurance business.The introduction of the GST added $111 million to
expenses while the costs of developing Europeanbanking, the full year effect of the acquisition in the firsthalf of last year of Trust Bank of Tasmania and StateStreet Master Custody businesses has added a further$90 million. The above increases are partly offset by$120 million of Colonial integration savings made in thecurrent year.
Cost to Income RatiosProforma
30/06/01 30/06/00% %
Banking 57.7 57.4Funds Management 67.1 71.6Life Insurance 59.5 52.1Group 58.6 57.2
The Group’s cost to income ratio reflects thedifferent business mix, including policyholder items andinvestment returns on life insurance shareholder funds.
Accordingly, it is more appropriate to look at thecost to income ratio by line of business. The increase inthe Banking cost income ratio of 0.3% from 57.4% in theyear ended 30 June 2000 to 57.7% in the current year isattributable to the following:� The GST together with the impact of the 4% wage
rise increased the cost income ratio by 1.8%.� Expenditure in relation to the development of the
European banking operations and the full yeareffect of new businesses has increased the cost toincome ratio by 0.7%.
� Synergies achieved in relation to the Colonialintegration have decreased the cost to income ratioby 1.6%.
� The cost to income benefit from improved volumesof 0.3%.The improvement in the funds management ratio of
4.5% from 71.6% in the prior year to 67.1% in the currentyear is due to scale economies from the growth in fundsunder management, partly offset by some one offexpenses within Stewart Ivory during the second half ofthe financial year.
The increase in the life insurance cost income ratioreflects the impact of lower investment earnings andpolicyholder tax (4.8% impact).
The achievement of the integration of the Colonialbusiness ahead of schedule represented a significantmilestone for the Group. The current forecast of theannualised cost synergies that will be realised when theintegration is completed (by 30 June 2003) is $355 million(out of the total synergies forecast of $450 million).

Other Group Items
29
Staff NumbersThe table below details the Group’s staff numbers as at 30 June 2001. Staff number reductions related to the Colonial
integration were in excess of 2,700 with a net increase in other staff movements reflecting business growth.
30/06/01 30/06/00Staff Numbers as at Number Number
Full time staff 31,976 34,154Part time staff 7,161 7,383Full time staff equivalent 34,960 37,131
Australia 28,837 31,056New Zealand 3,872 3,731Other Overseas 2,251 2,344
34,960 37,131
Income Tax Expense
Full Year Ended ComparisonProforma 30/06/01
Group Actual vs 30/06/0030/06/01 30/06/00 30/06/00 Proforma
$M $M $M %
Banking 705 748 759 (6)Funds Management 94 52 14 81Life 194 383 47 (49)Total Income Tax Expense 993 1,183 820 (16)
Effective tax rateBanking 28% 31% 33%Funds Management 39% 32% 28%Life Insurance (Policyholder and Corporate) 38% 51% 27%
Income tax expense has decreased 16% from $1,183 million for 30 June 2000 to $993 million for 30 June 2001.The tax expense consists of corporate tax of $899 million (year to 30 June 2000 $996 million) and policyholder tax of
$94 million (year to 30 June 2000 $187 million).Corporate taxation has declined by $97 million, primarily reflecting the benefit from the drop in the corporate tax rate
from 36% to 34% which reduced the prima facie income tax expense by $65 million, the utilisation of previouslyunrecognised overseas tax losses of $54 million, offset by a $20 million adjustment for the effect of lower tax rates ondeferred tax balances when compared to the prior year.
The reduction in policyholder tax expense of $93 million is as a result of lower tax paid due to weaker investmentreturns on behalf of policyholders.
The funds management effective tax rate increased due to the non-recognition of overseas tax losses partly offset bythe benefits from the change in tax rate.
Restructuring Provisions and Fair Value AdjustmentsThe following table highlights the restructuring provisions and fair value adjustments raised as part of the acquisition of
Colonial Limited at 30 June 2000 and subsequent revisions at 30 June 2001.
Actual ExpenditureBalance Year Ended Revised Increase Reported30/06/01 30/06/01 30/06/01 30/06/00
$M $M $M $M $M
Restructuring Costs - Colonial 195 244 439 145 294 - Commonwealth Bank 6 100 106 - 106Total restructuring costs (pre tax) 201 344 545 145 400Net of Tax 142 275 417 87 330
ActualBalance Reported30/6/01 Revision 30/6/00
$M $M $M
Fair Value Adjustments 637 162 475Net of Tax 478 151 327

COMMONWEALTH BANK OF AUSTRALIA AND CONTROLLED ENTITIES
Other Group Items
30
Provisions for restructuring costs of $400 million($330 million after tax) were raised at 30 June 2000.These provisions covered the estimated costs, based oninformation then available, of integrating the Colonialoperations (acquired 13 June 2000) into the Group,including the rationalisation of processing andadministrative functions. The principal costs associatedwith this programme are in the area of redundancy,property and systems.
An additional $145 million ($87 million after tax) wasadded to the provision during the year to cover theforecast additional costs of integration. The additionalcosts are primarily in the area of staff redundancies andinformation technology contract termination costs.
Integration related synergies of $450 million areexpected to be achieved by 2003, an increase of$70 million on those previously forecast. This comprisesforecast cost synergies of $355 million revenue synergiesof $70 million and funding synergies of $25 million. Theincrease is the result of a more detailed understanding ofthe business together with the accelerated timeframesover which the integration will be completed.
During the current year, restructuring costs of$344 million were charged against the provision. Theseexpenses included redundancy and other staff paymentsof $100 million, occupancy costs of $45 million,information technology costs of $95 million and other staffcosts of $24 million.
Fair value adjustments of $475 million ($327 millionnet of tax) were raised at 30 June 2000. These fair valueadjustments principally related to write offs of capitalisedsystems costs in accordance with Commonwealth Bankaccounting policy and additional general provisioning forbad debts to bring Colonial onto a consistent provisioningmethodology.
Additional fair value adjustments of $151 million (netof tax) were taken during the year. These principally relateto asset and investment write downs, additional generalprovisioning as a result of aligning Colonial credit policieswith the Commonwealth Group and tax adjustments.
These revisions to the provision for restructuring andfair value adjustments result in an increase in goodwill onacquisition of $238 million.
DividendsDividends will continue to be based on Cash
Earnings Per Share, having regard to the following:� Rate of business growth;� Capital adequacy;� Investment requirements;� The cyclical nature of life insurance investment
returns; and� A range of other factors.
Subject to these factors, the group will continue tomaintain a high payout ratio relative to its peers. Thedividend payout ratio for the year was 75.5% on a cashbasis.

Integrated Risk Management
31
Risk Management The integrated risk management framework
identifies, assesses, manages and reports risks and riskadjusted returns on a consistent and reliable basis.
Independent review is carried out through the auditrole.
The Group’s risk profile is the difference betweencapital available to absorb loss and risk.
The measure of risk is economic equity, which isdefined as the potential risk of loss of one year’searnings, measured at a standard consistent with anAA credit rating.
Economic equity is derived from underlyingexposures to credit, market, operational and lifeinsurance risks in the banking, life insurance and fundsmanagement businesses of the Group. In the bankingbusiness, economic equity is a measure of the potentialrisk of loss of cash earnings, In the life insurance andfunds management businesses, economic equity isa measure of the potential risk of loss of the fair value ofthe business.
The composition of economic equity of the Groupduring the financial year ended 30 June 2001 was 49%credit risk, 20% market risk, 30% operational risk and 1%insurance risk.
The component measures of economic equity forthe banking, life insurance and funds managementbusinesses were as follows:� Banking; 68% credit risk, 7% market risk and 25%
operational risk� Life insurance; 54% market risk, 40% operational
risk, 4% credit risk and 2% insurance risk.� Funds Management; 51% market risk and 49%
operational risk.The following sections describe the integrated risk
management framework components.
Credit RiskCredit risk is the potential for loss arising from
failure of a debtor or counterparty to meet theircontractual obligations.
Credit risk arises in the banking business fromlending activities, the provision of guarantees includingletters of credit and commitments to lend, investment inbonds and notes and financial markets and otherassociated activities. In the life insurance business creditrisk arises from investment in bonds and notes, loans andfrom reliance on reinsurance. The funds managementbusiness generally involves minimal credit risk froma shareholder perspective.
The measurement of credit risk is based on aninternal credit risk rating system, and utilises analytictools to calculate expected and unexpected loss for thecredit portfolio.� The Group uses a diversified portfolio approach for
the management of credit risk comprised of thefollowing:
� a system of industry limits and targets for exposuresby industry;
� a large credit exposure policy for aggregateexposures to individual commercial and industrialclient groups tiered by credit risk rating and loanduration; and
� a system of country limits for geographicexposures.These policies assist in the diversification of the
credit portfolio.The credit portfolio is managed in two segments:
� Statistically Managed SegmentComprises exposures that are generally less than$250,000 and is dominated by the housing loanportfolio. Credit facilities are approved using scoringand check sheet techniques.
� Risk Rated Managed SegmentComprises all other credit exposures. Managementis based on the internal credit risk rating system,which makes an assessment of the potential fordefault for each exposure and the amount of loss ifdefault should occur.Allowance for expected credit loss in the banking
business commences when an exposure first arises. Theexpected loss is reassessed on a regular basis andprovisioning adjusted accordingly.
A centralised exposure management systemrecords all significant credit exposures of the Group.Customers, industry, geographic and other significantgroupings of exposure are monitored.
Market RiskMarket risk is the potential for change in the value
of on and off balance sheet positions caused by a changein the value, volatility or relationship between marketrates and prices.
Market risk arises from the mismatch betweenassets and liabilities in both the banking and insurancebusinesses. The Group is exposed to diverse financialinstruments including interest rates, foreign currencies,equities and commodities and transacts in both physicaland derivative instruments.
A discussion and analysis of the Group’s marketrisk is contained in Note 39 to the financial statements.Information on trading securities is further contained inNote 10 of the financial statements. Note 3 of thefinancial statements contains financial markets tradingincome contribution to the Group.
In the trading book of the banking business, marketrisk is measured by a Value at Risk (VaR) model. Thismodel uses the distribution of historical changes inmarket prices to assess the potential for future losses.The VaR model takes into account correlations betweenrisks and the potential for movements in one portfolio tooffset movements in another. Actual results arebacktested to check the veracity of the VaR model.In addition, because the VaR model cannot predict allpossible outcomes, tests covering a variety of stressscenarios are regularly performed to simulate the effectof extreme market conditions.

COMMONWEALTH BANK OF AUSTRALIA AND CONTROLLED ENTITIES
Integrated Risk Management
32
The following table provides a summary of VaR by product. This is one element of the total integrated risk model usedby the Group. Refer Note 39 of the financial statements for further details.
Average VaR Average VaR Average VaR Average VaRDuring During During During
June 2001 December 2000 June 2000 December 1999Half Half Half Half
Trading Book $M $M $M $M
Group (excluding ASB Bank)Interest rate risk 2.21 2.30 2.52 2.35Exchange risk 1.03 0.64 0.73 0.67Implied volatility risk 0.39 0.32 0.25 0.32Equities risk 0.42 0.42 0.32 0.13Commodities risk 0.34 0.33 0.29 0.47Prepayment risk 0.44 0.38 0.28 0.00ASB Bank 0.17 0.21 0.26 0.00Diversification benefit (1.99) (1.74) (1.59) (1.49)Total 3.00 2.86 3.06 2.45
Trading income for 30 June 2001 increased by 30%over 30 June 2000 without an increase in the VaR duringthe period.
In the non-traded book of the banking business,a range of techniques is adopted to measure market risk.These include simulation of the effects of market pricechanges on assets and liabilities for business activitieswhere there are no direct measures of the effects ofmarket prices on those activities.
Liquidity risk is the risk that assets cannot beliquidated in time to meet maturing obligations. Limits areset to ensure that holdings of liquid assets do not fallbelow prudent levels. The liquid assets held are assetsthat are available for repurchase by the Reserve Bank ofAustralia (over and above those required to meet theReal Time Gross Settlement obligations), certificates ofdeposits and bills of exchange accepted by other banksand overnight interbank loans. More detailed commentson the Group’s liquidity and funding risks are provided inNote 39.
Market risk in the life insurance business arisesfrom mismatches between assets and liabilitiesguaranteed returns offered on some classes of policy(which may not be capable of being hedged throughmatching assets), adverse movements in market pricesaffecting fee income on investment-linked policies andfrom the returns obtained from investing the shareholderscapital held in each life company.
Wherever possible, the Group segregatespolicyholder funds from shareholder funds and setsinvestment mandates that are appropriate for each. Theinvestment mandates for assets in policyholder fundsattempt to match asset characteristics with the nature ofpolicy obligations but it is not always possible to obtain aperfect match between assets and liabilities. The ability tomatch asset characteristics with policy obligations may beconstrained by promises made in policy and salesdocuments, by regulatory constraints and by the lack ofsuitable investments.
A large proportion of the policyholder assets is heldfor investment linked policies where the policyholdertakes the risk of falls in the market value of the assets.However, as the Group earns fees on investment linkedpolicies that are based on the amount of assets invested,it will receive lower fees should markets fall. Assetallocation for investment linked policies is decided by thepolicyholder. A smaller proportion of policyholder assetsis held to support policies where life companies haveguaranteed either the principal invested or the investment
return (‘guaranteed policies’). Investment mandates forthese classes of policies emphasise investment in lowervolatility assets such as cash and fixed interest. TheGroup no longer sells guaranteed policies in Australia orNew Zealand but they continue to be sold in Asia. TheAustralian and New Zealand books of in force businesscontain guaranteed policies sold in the past and on whichit continues to collect premiums.
Thus, it is likely to be several years before theAustralian and New Zealand in force book of guaranteedpolicies will decline significantly as the policy paymentson maturing policies continues to be offset by thepremium income on the remaining policies. Someguaranteed policies were sold on the basis of profitsbeing shared between policyholders and shareholders.Profits are allocated to policyholders by the declaration of‘bonuses’. Bonuses may be declared annually (‘annualbonuses’) or upon maturity of the policy (‘terminalbonuses’). Once declared, annual bonuses form part ofthe guaranteed sum assured.
Shareholders funds in the life insurance businessare on average invested 50% in income assets (cash andfixed interest) and 50% in growth assets (shares andproperty), although the asset mix may vary from companyto company. Policyholder funds are invested to meetpolicyholder reasonable expectations without putting theshareholder at undue risk.
Market risk in the funds management business isthe risk of an adverse movement in market prices whichleads to a reduction in the amount of funds undermanagement and a consequent reduction in fee income.
Liquidity risk is not a significant issue in lifeinsurance companies. The life insurance companies inthe Group hold substantial investments in highly liquidassets such as listed shares, government bonds andbank deposits and continue to receive substantialpremium income. Furthermore, processing time forclaims and redemptions enables each company toforecast and manage its liquidity needs with a highdegree of accuracy.
Operational RiskOperational Risk is defined broadly as risks, other
than those captured in credit, market and life insurancerisk definitions, due to:� business and strategic decisions;� processes, people or systems; and� external events.

Integrated Risk Management
33
Risks are identified, quantified and managed underthe Group’s operational risk framework by business unitowners, with risk management being a key result area forDivisions. Each risk owner quantifies individual risksaccording to their probability of occurrence, and theeconomic loss given occurrence, including the impact onshareholder value. The mitigating effects of preventativecontrols, impact controls and insurance are alsoassessed and quantified based on expert opinion,external events, risk incidents and indicators. Individualrisks are aggregated into one of eleven operational riskcategories.
The quantification and allocation of operational riskeconomic equity for the banking business is primarilybased on the aggregation of these individual risks, takinginto account any correlation of risks, through a MonteCarlo simulation. The resulting economic equity amount isalso validated using top down aggregate measures.
Operational risk economic equity for the lifeinsurance and funds management businesses is basedon worst case scenarios using volatility shocks forbusiness risks and top down measures using internal andexternal loss data for event risks.
Insurance RiskThis is the risk that the incidence of mortality (death)
and morbidity (illness and injury) claims is higher thanassumed when pricing life insurance policies, or is greaterthan best estimate assumptions used to determine thefair value of the business.
Insurance risk may arise through reassessment ofthe incidence of claims, the trend of future claims and theeffect of unforeseen diseases or epidemics. In addition, inthe case of morbidity, the time to recovery may be longerthan assumed. Insurance risk is controlled by ensuringunderwriting standards adequately identify potential risk,retaining the right to amend premiums on risk policieswhere appropriate and through the use of reinsurance.The experience of the Group’s life insurance businessand those of the industry as a whole are reviewedannually.
DerivativesDerivative instruments are contracts whose value is
derived from one or more underlying financial instrumentsor indices defined in the contract. The Group will enterinto derivatives transactions including swaps, forward rateagreements, futures, options and combinations of theseinstruments. The sale of derivatives to customers as riskmanagement products and their use for trading purposesis integral to the Group’s financial markets activities.Derivatives are also used to manage the Group’s ownexposure to market risk. The Group participates in bothexchange traded and OTC derivatives markets.
Exchange traded derivatives: Exchange tradedderivatives are executed through a registered exchange,for example the Sydney Futures Exchange and theAustralian Stock Exchange. The contracts havestandardised terms and require lodgment of initial andvariation margins in cash or other collateral at theExchange, which guarantees ultimate settlement.
OTC traded derivatives: The Group buys and sellsfinancial instruments that are traded ‘over-the-counter’,rather than on recognised exchanges. The terms andconditions of these transactions are negotiated betweenthe parties, although the majority conform to acceptedmarket conventions. Industry standard documentation isused, most commonly in the form of a master agreement
supported by individual transaction confirmations. Thedocumentation protects the Group’s interests should thecounterparty default, and provides the ability to netoutstanding balances in jurisdictions where the relevantlaw allows.
The Group’s exposure to derivatives is disclosed inNote 39 Market Risk.
Business Continuity ManagementBusiness Continuity Management (BCM) is defined
within the Group as the discipline for developing andmaintaining advance action plans to respond to a riskevent or disaster so that critical business processescontinue with minimal adverse impact on staff,customers, products, services and brand.
The Group’s BCM policy requires that appropriatesafeguards be established to minimise the impact ofdisruption to business processes and dependencies,services and products in the event of an impairment ofthe Group’s business, information and infrastructure.
BCM constitutes an essential component of theGroup’s risk management process by providinga controlled response to potential operational risks thathave a significant impact on the Group’s criticalprocesses and revenue streams. It includes bothcost-effective responses to mitigate the impact of riskevents or disasters and crisis management plans torespond to crisis events.
Each Division in the Group has developed, testedand maintained Business Continuity Plans.A comprehensive BCM education program is beingimplemented to further drive the BCM methodologiesthroughout the Group.
Government GuaranteeIn conjunction with the Government’s sale of its
remaining shareholding, transitional arrangements wereimplemented which provide that:� all demand and term deposits will be guaranteed for
a period of three years from 19 July 1996, with termdeposits outstanding at the end of that three-yearperiod being guaranteed until maturity; and
� all other amounts payable under a contract that wasentered into before or under an instrumentexecuted, issued, endorsed or accepted by theBank and outstanding at 19 July 1996 will beguaranteed until their maturity.Accordingly, demand deposits are no longer
guaranteed.Term deposits outstanding at 19 July 1999 remain
guaranteed until maturity. The run off of the Governmentguarantee has had no effect on the Bank’s access todeposit markets. The Bank’s credit ratings were alsomaintained.
Credit RatingThe Bank’s credit ratings have remained
unchanged for the year and at 30 June 2001 are:
ShortTerm
LongTerm
Standard & Poor’s Corporation A-1+ AA-Moody’s Investors Service, Inc. P-1 Aa3Fitch F1+ AAMoody’s Bank Financial StrengthRating BFitch Individual Rating A/B
COMMONWEALTH BANK OF AUSTRALIA AND CONTROLLED ENTITIES
Capital Adequacy
34
20012001 2000 vs 2000
$M $M %Tier One CapitalShareholders’ Equity (excluding asset revaluation reserve) 19,843 18,435 8Eligible Loan Capital 462 418 11Total Shareholders’ Equity and Loan Capital 20,305 18,853 8Less Goodwill (5,716) (5,905) (3)Less Preference shares - (86) largeLess Intangible component of investment in non-consolidated subsidiaries (4,116) (2,656) 55Less Outside equity interest in entities controlled by non-consolidated subsidiaries (1,458) (588) largeTotal Tier One Capital 9,015 9,618 (6)
Tier Two CapitalAsset revaluation reserve 5 - largeGeneral provision for bad and doubtful debts (1) 1,390 1,358 2FITB related to general provision (436) (420) 4Note and bond issues (2) 4,825 5,120 (6)Preference shares - 39 largeTotal Tier Two Capital 5,784 6,097 (5)Tier One and Tier Two Capital 14,799 15,715 (6)Less Investment in non-consolidated subsidiaries (net of intangible componentdeducted from Tier 1) (2,005) (2,528) (21)Less Other deductions (114) (669) (83)Capital Base 12,680 12,518 1(1) Excludes general provision for bad and doubtful debts relating to investments in non-consolidated subsidiaries.(2) Includes both upper and lower Tier 2 capital.
2001 2000% %
Risk Weighted Capital RatiosTier one 6.51 7.49Tier two 4.18 4.75Less deductions (1.53) (2.49)Total 9.16 9.75
The Australian Prudential Regulation Authority(APRA) sets minimum capital adequacy ratios for theGroup. These ratios compare the capital base of theGroup with on and off balance sheet assets, weighted forrisk. Capital base consists of shareholders equity plusother capital instruments acceptable to APRA (tier 1capital) and general provision for credit losses and otherhybrid and debt instruments acceptable to APRA (tier 2capital). The life insurance and funds managementbusinesses are not consolidated for capital adequacypurposes.
The decline from the capital ratios at 30 June 2000can be attributed to:� A change in the treatment of the investment in our
life insurance and funds management businessesannounced by APRA in February 2001. These newrules were applied to the 31 December 2000 capitaladequacy calculations. If this change had notoccurred the tier 1 ratio at 30 June 2001 would havebeen 0.39% higher and the total capital ratio wouldhave been 0.20% higher;
� An increase in goodwill associated with the mergerwith Colonial amounting to $238 million (refer to thediscussion on Restructuring Provision and FairValue Adjustment);
� A decrease in tier 1 capital of $464 million relatingto the acquisition of a 25% interest in ASB Group inAugust 2000;
� A decrease in the lower tier 2 dated notes and bondissues due to the regulatory limitation that thisamount does not exceed 50% of tier 1 capital; and
� A $9.9 billion (8%) increase in the amount of riskweighted assets.
The Group has continued its active capitalmanagement programme. During the year:� An on-market buyback programme in November
2000 resulted in the purchase of 0.8 million ordinaryshares for $23.5 million;
� An off-market buyback in March 2001 resulted inthe purchase of 25.1 million ordinary shares for$700 million;
� The issue of 3.5 million PERLS (PreferredExchangeable Resettable Listed Shares) in March2001 raised $687 million net of issue costs; and
� The shares needed to satisfy the DRP in respect ofthe interim dividend paid in March 2001 wereacquired on-market. This required the purchase of4.5 million ordinary shares for $143.6 million.In January 2001 the Basle Committee on Banking
Supervision issued proposals for changes to thecalculation of capital adequacy for banks. These changeswill not come into effect until 2005. The changes includea specific requirement for capital to cover operating riskand changes to the capital requirement for credit risk.Under the proposals, the deduction for investment in lifeinsurance and funds management companies currentlymade from total capital will be split 50% from tier 1 and50% from tier 2. There is insufficient information availableto ascertain whether overall the proposals will result in anincreased requirement for regulatory capital or not. TheBank continues to work closely with industry bodies andwith APRA to ensure that the changes, when finalised,will require a realistic level of capital. For further detail oncapital adequacy see Note 31.

Description of Business Environment
35
CompetitionThe Australian banking market is highly transparent
and competitive. The banks, life companies and non-bankfinancial institutions compete for customer deposits, theprovision of lending, funds management, life insuranceand other services.
In all there were 46 banking groups operating inAustralia at 30 June 2001. Banks in Australia can bedivided into the following categories: Australian ownedbanks, foreign bank subsidiaries and branches of foreignowned banks.
Among the Australian owned banks (of which thereare 12) the four largest (CBA, NAB, Westpac and ANZ)are typically referred to as Australia’s major banks. Eachof the major banks offers a full range of financial productsand services through branch networks across Australia.
Of the other Australian owned banks, there are5 regional banks. Each of these had their origins asa building society and their operations were initiallylargely state based. While the smaller of the regionalbanks have typically limited their activities to servicingcustomers in a particular state or region, they are nowtargeting interstate customers and expanding theiroperations across state borders. The larger regionalbanks now operate in several states, if not nationally.Over recent years the regional banking sector hasundergone substantial consolidation with several of theseinstitutions amalgamating with other regional banks orbeing acquired by major banks.
There are 13 foreign owned banks operating inAustralia through a locally incorporated subsidiary.An additional 25 banks conduct operations througha foreign bank branch. While many foreign banksoperating in Australia initially focussed their activities onthe provision of banking services to the Australian clientsof their overseas parent bank, most have now diversifiedtheir operations, offering local clients a broad range offinancial products and services. Foreign bank branches inAustralia are not able to offer retail deposit andtransaction accounts to customers. Several foreign banksare represented in Australia by both a locally incorporatedsubsidiary and a branch.
The Bank also faces competition from non-bankfinancial institutions, which compete vigorously forcustomer investments, deposits and the provision oflending and other services. Non-bank financialintermediaries such as building societies and creditunions compete strongly in the areas of acceptingdeposits and residential mortgage lending, mainly forowner-occupied housing. These state-based institutionsare making headway in achieving multi-state coveragepartly encouraged by a more conducive regulatoryenvironment. Specialist non-bank mortgage originatorsand brokers have acquired some prominence in theresidential lending market.
A development over recent years has been theestablishment of local single branch banks collectivelyreferred to as ‘community banks’. Under this model, thelocal community effectively purchases from a regionalbank the right to operate a franchise of the bank butwithin the auspices of the regional bank’s bankingauthority. The presence of community banks has addedanother dimension to the competitive dynamics of themarket.
The Bank operates in the life insurance and fundsmanagement markets in competition with a range ofnon-bank financial institutions. Similarly, non-bankfinancial institutions (including life companies) haveexpanded their operations into banking, with a view tooffering their customers a broad suite of financialservices. International fund managers (and globalinvestment banks) are also increasing their presence inAustralia.
Changes in the financial needs of consumers,deregulation, and technology developments have alsochanged the mode of competition. In particular, thedevelopment of electronic delivery channels and thereduced reliance on a physical network facilitate the entryof new players from related industries, such as retailers,telecommunication companies and utilities. Technologicalchange is encouraging new entrants with differingcombinations of expertise and an unbundling of the valuechain.
Deregulation has led to further disintermediation inthe Australian finance industry. Traditionally, the bankingindustry has been the major intermediary between theproviders of funds (depositors) and the users of funds(borrowers).
A significant factor in disintermediation in Australiahas been the substantial growth in funds undermanagement, especially within the superannuation(pension funds) industry.
The Australian Government’s continuedencouragement of long-term saving throughsuperannuation, by means of taxation concessions anda mandatory superannuation guarantee levy onemployers, is expected to underpin strong growth infunds under management. This growth potentialcontinues to attract new entrants to this market.
Growth in the funds management industry has alsocontributed to disintermediation through the direct use ofcapital markets by borrowers as an alternative to bankfinance. The corporate bond market in Australia hasbenefited from this growth with many of the majorAustralian corporates directly accessing capital marketsin Australia and around the world. The Bank, incompetition with numerous domestic and foreign banks,is actively involved as an originator of corporate debt inthe capital markets, especially in the Euro-AUD andEuro-NZD sector, and in the creation of new financingstructures including as arranger and underwriter in majorinfrastructure projects undertaken by the corporatesector.
Like Australia, the New Zealand banking system ischaracterised by strong competition. The Group’sactivities in New Zealand are conducted through ASBGroup Limited. Banks in New Zealand are free tocompete in almost any area of financial activity. As inAustralia, there is strong competition with non-bankfinancial institutions in the areas of funds managementand the provision of insurance.
New Zealand banking activities are led by fivefinancial services groups, all owned by UK orAustralian-based banks operating through nationwidebranch networks.

COMMONWEALTH BANK OF AUSTRALIA AND CONTROLLED ENTITIES
Description of Business Environment
36
The Group’s major competitors in New Zealand areANZ, Bank of New Zealand (a wholly-owned subsidiary ofNAB), National Bank of New Zealand (a wholly-ownedsubsidiary of Lloyds Bank plc) and Westpac Trust(a wholly-owned subsidiary of Westpac). In addition, thereare several financial institutions operating largely in thewholesale banking sector including Deutsche Bank andAMP (Australia’s largest insurance group).
Through its wholly-owned subsidiary SovereignGroup, ASB Group also competes in the New Zealandinsurance and investment market, where Royal SunAlliance and Tower Corporation are major competitors.
Following the acquisition of Colonial Ltd in June2000, the Group’s retail operations were extended intothe United Kingdom, numerous Asian markets and the FijiIslands; in these markets, the Bank competes directlywith established providers.
Financial System RegulationAustralia has a high quality system of financial
regulation by international standards. Followinga comprehensive inquiry into the Australian financialsystem (the ‘Wallis Inquiry’), the Australian Governmentintroduced a new framework for regulating the financialsystem. The previous framework, which appliedregulations according to the type of institution beingregulated, resulted in similar products being regulateddifferently. The new functional approach regulatesproducts equally regardless of the particular type ofinstitutions providing them.
Since July 1998, the new regulatory arrangementshave comprised four separate agencies: The ReserveBank of Australia, the Australian Prudential RegulationAuthority, the Australian Securities and InvestmentsCommission and the Australian Competition andConsumer Commission. Each of these agencies hassystem wide responsibilities for the different objectives ofgovernment oversight of the financial system.A description of these agencies and their generalresponsibilities and functions is set out below:� Reserve Bank of Australia (RBA) - responsible for
monetary policy, financial system stability andregulation of the payments system;
� Australian Prudential Regulation Authority (APRA) –has comprehensive powers to regulate prudentiallybanks and other deposit-taking institutions,insurance companies and superannuation (pensionfunds). Unless an institution is authorised under theBanking Act 1959 or exempted by APRA, it isprohibited from engaging in the general business ofdeposit-taking;
� Australian Securities and Investments Commission(ASIC) – has responsibility for market conduct,consumer protection and corporate regulationfunctions across the financial system including forinvestment, insurance and superannuation productsand the providers of these products.
� Australian Competition and Consumer Commission(ACCC) – has responsibility for competition policyand consumer protection across all sectors of theeconomy.
Financial market instability, particularly in variousemerging market economies, has led to intense scrutinyof global financial markets and highly leveragedinstitutions. There is some pressure for fundamentalreform of international financial architecture to avertfuture crises. Government officials and industrypractitioners in Australia are actively involved ininternational fora in furthering these reforms.
Supervisory ArrangementsThe Bank is an authorised deposit-taking institution
under the Banking Act and is subject to prudentialregulation by APRA as a bank. The prudential frameworkapplied by APRA is embodied in a series of prudentialstandards including:
Capital AdequacyUnder APRA capital adequacy guidelines,
Australian banks are required to maintain a ratio ofcapital (comprising Tier 1 and Tier 2 capital components)to risk weighted assets of at least 8%, of which at leasthalf must be Tier 1 capital. These guidelines aregenerally consistent with those agreed upon by the BasleCommittee on Banking Supervision. For information onthe capital position of the Bank, see – ‘Capital Adequacy’.
Funding and LiquidityAPRA exercises liquidity control by requiring each
bank to develop a liquidity management strategy that isappropriate for itself. Each policy is formally approved byAPRA. A key element of the Group’s liquidity policy is theholding of a stock of high quality liquid assets to meet dayto day fluctuations in liquidity. The liquid assets held areassets that are available for repurchase by the RBA (overand above those required to meet the Real Time GrossSettlement (RTGS) obligations, AUD CDs/Bills of otherbanks and AUD overnight interbank loans.) More detailedcomments on the Group’s liquidity and funding risks areprovided in Note 39.
Large Credit ExposuresAPRA requires banks to ensure that, other than in
exceptional circumstances, individual credit exposures tonon-bank, non-government clients do not exceed 30% ofTier 1 and Tier 2 capital. Prior notification must be givento APRA if a bank intends to exceed this limit. Forinformation on the Bank’s large exposures refer to Note14 to the Financial Statements.
Ownership and ControlIn pursuit of transparency and risk minimisation, the
Financial Sector (Shareholding) Act 1998 embodies theprinciple that regulated financial institutions shouldmaintain widespread ownership. The Act appliesa common 15 per cent shareholding limit for authoriseddeposit taking institutions, insurance companies and theirholding companies. The Treasurer has the power toapprove acquisitions exceeding 15 per cent where this isin the national interest, taking into account advice fromthe Australian Competition and Consumer Commission inrelation to competition considerations and APRA onprudential matters. The Treasurer may also delegateapproval powers to APRA where one financial institutionseeks to acquire another.

Description of Business Environment
37
The Government’s present policy is that mergersamong the four major banks will not be permitted until theGovernment is satisfied that competition from new andestablished participants in the financial industry,particularly in respect of small business lending, hasincreased sufficiently.
Proposals for foreign acquisition of Australian banksare subject to approval by the Treasurer under theForeign Acquisitions and Takeovers Act 1975.
Banks’ Association With Non-BanksThere are formal guidelines that control investments
and dealings with subsidiaries and associates. A bank’sequity associations with other institutions should normallybe in the field of finance. APRA has expressed anunwillingness to allow subsidiaries of a bank to exceed asize which would endanger the stability of the parent.No bank can enter into any agreements or arrangementsfor the sale or disposal of its business, or effecta reconstruction or carry on business in partnership withanother bank, without the consent of the CommonwealthTreasurer.
In carrying out its prudential responsibilities, APRAclosely monitors the operations of banks to ensure thatthey operate within the prudential framework it has laiddown and that they follow sound management practices.
APRA currently supervises banks by a system ofoff-site examination. It closely monitors the operations ofbanks through the collection of regular statistical returnsand regular prudential consultations with each bank’smanagement. APRA also conducts a program ofspecialised on-site visits to assess the adequacy ofindividual banks’ systems for identifying, measuring andcontrolling risks associated with the conduct of theseactivities.
In addition, APRA has established arrangementsunder which each bank’s external auditor reports toAPRA regarding observance of prudential standards andother supervisory requirements.
Supervision of non-bank group entitiesThe life insurance company and general insurance
company subsidiaries of the group also come within thesupervisory purview of APRA.
APRA’s prudential supervision of both life insuranceand general insurance companies is exercised throughthe setting of minimum standards for solvency andfinancial strength to ensure obligations to policy holderscan be met.
The financial condition of life insurance companiesis monitored through regular financial reporting, lodgmentof audited accounts and supervisory inspections.Compliance with APRA regulation for general insurancecompanies is monitored through regular returns andlodgment of an audited annual return.

COMMONWEALTH BANK OF AUSTRALIA AND CONTROLLED ENTITIES
Corporate Governance
38
Board of DirectorsThe Board of Directors assumes responsibility for
corporate governance of the Bank. It oversees thebusiness and the affairs of the Bank, establishes, withmanagement, the strategies and financial objectives to beimplemented by management and monitors the
performance of management directly and through theBoard committees.
The Board currently consists of eleven Directors.Membership of the Board and its Committees is set outbelow:
DIRECTOR BOARD MEMBERSHIP COMMITTEE MEMBERSHIP
Nominations Remuneration Audit Risk
J T Ralph, AC Non executive Chairman Chairman Chairman ChairmanJ M Schubert Non executive Deputy Chairman Member ChairmanD V Murray Executive Managing Director Member Member MemberN R Adler, AO Non executive MemberR J Clairs, AO Non executive MemberA B Daniels, OAM Non executive MemberC R Galbraith Non executive MemberW G Kent, AO Non executive MemberF D Ryan Non executive MemberF J Swan Non executive MemberB K Ward Non executive Member
Details of the experience, qualifications, specialresponsibilities and attendance at meetings of theDirectors are set out in the Directors’ Report onpages 41 to 46.
Ms A C Booth retired from the Board on31 December 2000 and Mr K E Cowley retired from theBoard on 29 March 2001.
The Constitution of the Bank specifies that:� the managing director and any other executive
directors shall not be eligible to stand for election asChairman of the Bank;
� the number of directors shall be not less than 9 normore than 13 (or such lower number as the Boardmay from time to time determine). The Board hasdetermined that for the time being the number ofdirectors shall be 11; and
� at each Annual General Meeting, one-third ofdirectors (other than the managing director) shallretire from office and may stand for re-election.The Board has adopted a policy that, with a phasing
in provision dealing with existing directors, the maximumterm of appointment of directors to the Board wouldnormally be limited to twelve years.
The Nominations Committee of the Board criticallyreviews, at least annually, the corporate governanceprocedures of the Bank and the composition andeffectiveness of the Commonwealth Bank Board and theboards of the major wholly owned subsidiaries. The policyof the Board is that the Committee shall consist ofa majority of non executive directors and that theChairman of the Bank shall be chairman of theCommittee.
The Nominations Committee has developed a set ofcriteria for director appointments which have beenadopted by the Board. The criteria set the objective of theBoard as being as effective, and preferably more effectivethan the best boards in the comparable peer group.These criteria, which are reviewed annually, ensure thatany new appointee is able to contribute to the ongoingeffectiveness of the Board, has the ability to exercisesound business judgment, to think strategically and hasdemonstrated leadership experience, high levels ofprofessional skill and appropriate personal qualities.
Candidates for appointment as directors areconsidered by the Nominations Committee,recommended for decision by the Board and, ifappointed, stand for election, in accordance with theConstitution, at the next general meeting of shareholders.
Remuneration ArrangementsThe Constitution and the ASX Listing Rules specify
that the aggregate remuneration of non executivedirectors shall be determined from time to time by ageneral meeting. An amount not exceeding the amountdetermined, is divided between the directors as theyagree. The policy of the Board is that the aggregateamount should be set at a level which provides the Bankwith the necessary degree of flexibility to enable it toattract and retain the services of directors of the highestcalibre. The latest determination was at the AnnualGeneral Meeting held on 28 October 1999 whenshareholders approved an aggregate remuneration of$1,500,000 per year. The Nominations Committeereviews the fees payable to non executive directors.Details of individual directors’ remuneration and thebands of remuneration are set out in Note 45. Directors’fees do not incorporate a bonus element related toperformance.
In August 2000, the Board approved theintroduction of the Non-Executive Directors’ Share Planwhich requires the acquisition of shares byNon-Executive Directors through the mandatory sacrificeof 20% of their annual fees. Details of this Plan were setout in the Notice of Meeting to the 2000 Annual GeneralMeeting.
The remuneration of Mr Murray (Managing Director)is fixed by the Board, pursuant to the Constitution, as partof the terms and conditions of his appointment. Thoseterms and conditions are subject to review, from time totime, by the Board.
There is in place a retirement scheme whichprovides for benefits to be paid to non executive directorsafter service of a qualifying period. The terms of thisscheme, which were approved by shareholders at the1997 Annual General Meeting, allow for a benefit on apro rata basis to a maximum of four years’ totalemoluments after twelve years’ service.

Corporate Governance
39
The Board has established a RemunerationCommittee to:� consider changes in remuneration policy likely to
have a material impact on the Group;� consider senior executive appointments; and� be informed of leadership performance, legislative
compliance in employment issues, industrialagreements and incentive plans operating acrossthe Group.The policy of the Board is that the Committee shall
consist of a majority of non executive directors.The Committee has an established work plan which
allows it to review all major human resource policies,strategies and outcomes.
The Bank’s remuneration policy in respect ofexecutives includes provisions that remuneration will becompetitively set so that the Bank can attract, motivateand retain high quality local and international executivestaff and that remuneration will incorporate, toa significant degree, variable pay for performanceelements. A full statement of the Bank’s remunerationpolicy for executives and details of the remuneration paidto the Managing Director and five highest paid othermembers of the senior executive team who were officersof the Bank at 30 June 2001 are set out in Note 46.
Audit ArrangementsErnst & Young was appointed as the auditor of the
Bank at the 1996 Annual General Meeting and continuesto fulfil that office.
The Board’s Audit Committee consists entirely ofnon executive Directors and the chairman of theCommittee is not Chairman of the Bank. This structurereflects the Board’s policy. The Managing Directorattends Committee meetings by invitation. TheCommittee oversees the adequacy of the overall internalcontrol functions and the internal audit functions withinthe Group and their relationship to external audit.
In carrying out these functions, the Committee:� reviews the financial statements and reports of the
Group;� reviews accounting policies to ensure compliance
with current laws, relevant regulations andaccounting standards; and
� conducts any investigations relating to financialmatters, records, accounts and reports which itconsiders appropriate.In addition, the Committee ratifies the Group’s
operational risk policies for approval by the Board andreviews and informs the Board of the measurement andmanagement of operational risk. Operational risk isa basic line management responsibility within the Groupconsistent with the policies established by the Committee.A range of insurance policies maintained by the Groupmitigates some operational risks.
The Committee regularly considers, in the absenceof management and the external auditor, the quality of theinformation received by the Committee and, inconsidering the financial statements, discusses withmanagement and the external auditor:� the financial statements and their conformity with
accounting standards, other mandatory reportingrequirements and statutory requirements; and
� the quality of the accounting policies applied andany other significant judgements made.The Committee periodically meets separately with
the Group Auditor and the external auditor in the absenceof management.
The Committee reviews the processes governingadvisory work undertaken by the external auditor toensure that the independence of the external auditor isnot affected by conflicts.
The scope of the audit is agreed between theCommittee and the auditor. The external audit partnerattends meetings of the Audit Committee by invitationand attends the Board meetings when the annual andhalf yearly accounts are signed.
Risk ManagementThe Risk Committee oversees credit and market
risks assumed by the Bank in the course of carrying onits business.
The Committee considers the Group’s creditpolicies and ensures that management maintains a set ofcredit underwriting standards designed to achieveportfolio outcomes consistent with the Group’s risk/returnexpectations. In addition, the Committee reviews theGroup’s credit portfolios and recommendations bymanagement for provisioning for bad and doubtful debts.
The Committee approves risk management policiesand procedures for market, funding and liquidity risksincurred or likely to be incurred in the Group’s business.The Committee reviews progress in implementingmanagement procedures and identifying new areas ofexposure relating to market, funding and liquidity risk.
Independent Professional AdviceThe Bank has in place a procedure whereby, after
appropriate consultation, directors are entitled to seekindependent professional advice, at the expense of theBank, to assist them to carry out their duties as directors.The policy of the Bank provides that any such advice ismade available to all directors.
Access to InformationThe Board has an agreed policy on the
circumstances in which directors are entitled to obtainaccess to company documents and information.
Ethical StandardsThe Bank has adopted a Statement of Professional
Practice which sets standards of behaviour requiredincluding:� to act properly and efficiently in pursuing the
objectives of the Bank;� to avoid situations which may give rise to a conflict
of interests;� to know and adhere to the Bank’s Equal
Employment Opportunity policy and programs;� to maintain confidentiality in the affairs of the Bank
and its customers; and� to be absolutely honest in all professional activities.
These standards are regularly communicated tostaff. In addition, the Bank has established insider tradingguidelines for staff to ensure that unpublished pricesensitive information about the Bank or any othercompany is not used in an illegal manner.
The restrictions imposed by law on dealings byDirectors in the securities of the Bank have beensupplemented by the Board of Directors adoptingguidelines which further limit any such dealings byDirectors, their spouses, any dependent child, familycompany and family trust.

COMMONWEALTH BANK OF AUSTRALIA AND CONTROLLED ENTITIES
Corporate Governance
40
The guidelines provide, that in addition to therequirement that Directors not deal in the securities of theBank or any related company when they have or may beperceived as having relevant unpublished price sensitiveinformation, Directors are only permitted to deal withincertain periods. These periods include between three and30 days after the announcement of half yearly and finalresults and from three days after release of the annualreport until 30 days after the Annual General Meeting.Further, the guidelines require that Directors not deal onthe basis of considerations of a short term nature or to theextent of trading in those securities. Similar restrictionsapply to executives of the Bank.
In accordance with the Constitution and theCorporations Act 2001, Directors disclose to the Boardany material contract in which they may have an interest.In compliance with section 195 of the Corporations Act2001 any Director with a material personal interest in amatter being considered by the Board will not be presentwhen the matter is being considered and will not vote onthe matter.
Continuous DisclosureThe Corporations Act 2001 and the ASX Listing
Rules require that a company disclose to the marketmatters which could be expected to have a material effecton the price or value of the company’s securities.Management processes are in place throughout theCommonwealth Bank Group to ensure that all materialmatters which may potentially require disclosure arepromptly reported to the Managing Director, throughestablished reporting lines, or as a part of thedeliberations of the Bank’s Executive Committee. Mattersreported are assessed and, where required by the ListingRules, advised to the market. The Company Secretary isresponsible for communications with the ASX and forensuring that such information is not released to anyperson until the ASX has confirmed its release to themarket.

Directors’ Report
41
The Directors of the Commonwealth Bank ofAustralia submit their report, together with the financialreport of the Commonwealth Bank of Australia (the‘Bank’) and of the Group, being the Bank and itscontrolled entities, for the year ended 30 June 2001.
The names of the Directors holding office during thefinancial year and until the date of this report are set outbelow together with details of Directors’ experience,qualifications, special responsibilities and organisations inwhich each of the Directors has declared an interest.
John T Ralph, AC, ChairmanMr Ralph has been a member of the Board since 1985and Chairman since 1999. He is also Chairman of theRisk, Remuneration and Nominations Committees. He isa Fellow of the Australian Society of Certified PractisingAccountants and has had over forty-seven years’experience in the mining and finance industries.Chairman: Pacific Dunlop Limited.Deputy Chairman: Telstra Corporation Limited.Director: BHP Billiton Limited and BHP Billiton Plc.Other Interests: Melbourne Business School (Board ofManagement), Foundation for Young Australians (DeputyNational Chairman), and Australian Foundation forScience (Chairman).Mr Ralph is a resident of Victoria. Age 68.
John M Schubert, Deputy ChairmanDr Schubert has been a member of the Board since 1991,he was appointed as Deputy Chairman on 31 December2000 and is Chairman of the Audit Committee anda member of the Nominations Committee. He holdsa Bachelor Degree and PhD in Chemical Engineering andhas experience in the petroleum, mining and buildingmaterials industries. Dr Schubert is the former ManagingDirector and Chief Executive Officer of PioneerInternational Limited.Chairman: G2 Therapies Limited and Worley Limited.Director: BHP Billiton Limited, BHP Billiton Plc, HansonPlc, Australian Graduate School of Management Ltd andQantas Limited.President: Business Council of Australia.Other Interests: Academy of Technological Science(Fellow), Salvation Army Territorial Headquarters andSydney Advisory Board (Member). He is also a Directorof the Great Barrier Reef Research Foundation anda Director and a Member of AGSM Consulting Ltd.Dr Schubert is a resident of New South Wales. Age 58.
David V Murray, Managing Director and ChiefExecutive OfficerMr Murray has been a member of the Board andManaging Director since June 1992. He holds a Bachelorof Business and Master of Business Administration andhas thirty-five years’ experience in banking. Mr Murray isa member of the Remuneration, Risk and NominationsCommittees.Director: Colonial Ltd, Colonial Holding Company Pty Ltd,Colonial Holding Company (No 2) Pty Ltd, EmeraldHolding Company Ltd, Colonial Finance (Australia) Ltd,Colonial International Holdings Pty Ltd and Colonial FirstState Investments Group Limited.
Other Interests: International Monetary Conference(Member), Art Gallery of NSW (Member), Asian Bankers’Association (Member), Australian Bankers’ Association(Chairman), Asian Pacific Bankers' Club (Member),Business Council of Australia (Member), World EconomicForum (Member), General Motors Australian AdvisoryCouncil (Member), APEC Business Advisory Council(Member), and the Financial Sector Advisory Council(Member).Mr Murray is a resident of New South Wales. Age 52.
N R (Ross) Adler, AOMr Adler has been a member of the Board since 1990and is a member of the Remuneration Committee. Heholds a Bachelor of Commerce and a Master of BusinessAdministration. Mr Adler was Managing Director ofSantos Limited for 16 years and retired on 30 September2000. He has experience in various commercialenterprises, more recently in the oil and gas industry.Chairman: Austrade.Director: Telstra Corporation Limited, QCT ResourcesLimited (until October 2000), Tereny Investments Pty Ltdand Shelrey Pty Ltd.Other Interests: Art Gallery of South Australia(Chairman), University of Adelaide (Council Member andChairman of the Finance Committee), Executive Memberof the Australian Japan Business Co-operationCommittee and Australian Institute of Company Directors(Member).Mr Adler is a resident of South Australia. Age 56.
Reg J Clairs, AOMr Clairs has been a member of the Board since 1 March1999 and is a member of the Audit Committee. As theformer Chief Executive Officer of Woolworths Limited, hehad thirty-three years’ experience in retailing, brandingand customer service.Chairman: Agri Chain Solutions Ltd and The PrimeMinister’s Supermarket to Asia Board.Deputy Chairman: Woolstock Australia Limited.Director: David Jones Ltd, Howard Smith Ltd andNational Australia Day Council.Other Interests: Foundation Member of the PrimeMinister’s Supermarket to Asia Council.Mr Clairs is a resident of Queensland. Age 63.
A B (Tony) Daniels, OAMMr Daniels has been a member of the Board since March2000 and is a member of the Remuneration Committee.He has extensive experience in manufacturing anddistribution, being Managing Director of Tubemakers ofAustralia for eight years to December 1995, during a longcareer with that company.Director: Australian Gas Light Company, Orica, andO'Connell St Associates.Managing Director: Pacific Dunlop Limited.Mr Daniels is a resident of New South Wales. Age 66.

COMMONWEALTH BANK OF AUSTRALIA AND CONTROLLED ENTITIES
Directors’ Report
42
Colin R GalbraithMr Galbraith has been a member of the Board since June2000 and is a member of the Risk Committee. He waspreviously a Director of Colonial Limited, having beenappointed in 1996. He is a partner of Allens ArthurRobinson, Lawyers.Chairman: BHP Community Trust.Director: OneSteel Limited.Other Interests: Council of Legal Education in Victoria(Honorary Secretary), Corporate Council of CAREAustralia (Member) and The Royal Melbourne HospitalNeuroscience Foundation (Trustee).Mr Galbraith is a resident of Victoria. Age 53.
Warwick G Kent AOMr Kent has been a member of the Board since June2000 and is a member of the Risk Committee. He waspreviously a Director of Colonial Limited, having beenappointed in 1998. He was Managing Director and ChiefExecutive Officer of BankWest until his retirement in1997. Prior to joining BankWest, Mr Kent had a long anddistinguished career with Westpac Banking Corporation.Director: Perpetual Trustees Australia Limited, WestAustralian Newspapers Holdings Limited and CoventryGroup Limited.Other Interests: Advisory Board of Blake DawsonWaldron (Member), Walter and Eliza Hall Trust (Trustee),Australian Institute of Company Directors (Fellow),Australian Society of CPAs (Fellow), Australian Instituteof Bankers (Fellow) and Chartered Institute of CompanySecretaries (Fellow).Mr Kent is a resident of Western Australia. Age 65.
Fergus D RyanMr Ryan has been a member of the Board since March2000 and is a member of the Audit Committee. He hasextensive experience in accounting, audit, finance andrisk management. He was a senior partner of ArthurAndersen until his retirement in August 1999 afterthirty-three years’ with that firm including five years asManaging Partner Australasia.Member: Prime Minister's Community BusinessPartnership.Other Interests: Strategic Investment Co-ordinator andMajor Projects Facilitator for the Federal Government,Committee for Melbourne (Counsellor) and PacificInstitute (Patron).Mr Ryan is a resident of Victoria. Age 58.
Frank J SwanMr Swan has been a member of the Board since July1997 and is a member of the Risk Committee. He holdsa Bachelor of Science degree and has twenty-threeyears’ senior management experience in the food andbeverage industries.Chairman: Fosters Group Limited.Director: National Foods Limited and Catholic LadiesCollege Eltham.Other Interests: Institute of Directors (Fellow), AustralianInstitute of Company Directors (Fellow), AustralianInstitute of Management (Fellow) and Institute ofManagement UK (Companion).Mr Swan is a resident of Victoria. Age 60.
Barbara K WardMs Ward has been a member of the Board since 1994and is a member of the Audit Committee. She holdsa Bachelor of Economics and Master of PoliticalEconomy and has six years’ experience in policydevelopment and public administration as a seniorministerial adviser and twelve years’ experience in thetransport and aviation industries, most recently as ChiefExecutive of Ansett Worldwide Aviation Services. Since1998, she has pursued a career as a company director.Chairperson: HWW Limited and Country Energy.Director: Rail Infrastructure Corporation and DataAdvantage Limited.Other Interests: Sydney Opera House Trust (Trustee),Australia Day Council of New South Wales (Member) andAllens Arthur Robinson (Director).Ms Ward is a resident of New South Wales. Age 47.
Anna C Booth – retired 31 December 2000Ms Booth had been a member of the Board since 1990and was a member of the Risk Committee. She holdsa Bachelor of Economics (Hons) and has had seventeenyears’ experience in the trade union movement.Director: Ausflag Limited and CoSolve Australasia PtyLtd.Other Interests: Shopping Centre Council of Australia(Special Advisor), Sydney Organising Committee for theOlympic Games (Member) and Labour ManagementStudies Foundation of Macquarie University (Fellow).Ms Booth is a resident of New South Wales. Age 44.
Ken E Cowley, AO – retired 29 March 2001Mr Cowley had been a member of the Board sinceSeptember 1997 and was a member of the RemunerationCommittee. He has thirty-three years’ experience in themedia industry, having been a Director of News Limitedsince 1976 and until July 1997, was Executive Chairmanof that company.Executive Chairman: Zazu Limited.Chairman: PMP Communications Limited, R M WilliamsHoldings Limited, Tasman Pacific Airways Limited, TowerLodge Pty Limited and Melbourne Storm Football ClubPty Ltd.Director: The News Corporation Limited, IndependentNewspapers Limited and The Foundation for Rural andRegional Renewal.Other Interests: Australian Stockman’s Hall of Fame andOutback Heritage Centre (Chairman) and RoyalAgricultural Society (Director).Mr Cowley is a resident of New South Wales. Age 65.
Directors’ Report
43
Directors’ MeetingsThe number of Directors’ meetings (including meetings of committees of Directors) and number of meetings attended
by each of the Directors of the Commonwealth Bank during the financial year were:
DIRECTOR DIRECTORS’ MEETINGSNo. of Meetings
Held*No. of Meetings
Attended
J T Ralph 10 10J M Schubert 10 10D V Murray 10 10N R Adler 10 10R J Clairs 10 10A B Daniels 10 10F D Ryan 10 10F J Swan 10 10B K Ward 10 10W G Kent 10 9C R Galbraith 10 10A C Booth ** 6 6K E Cowley *** 7 6
* The number of meetings held during the time the Director held office during the year.** Ms Booth retired on 31 December 2000.*** Mr Cowley retired on 29 March 2001.
COMMITTEE MEETINGSRisk Committee Audit Committee Remuneration Committee
No. ofMeetings Held
*
No. ofMeetingsAttended
No. ofMeetings Held
*
No. ofMeetingsAttended
No. ofMeetings Held
*
No. ofMeetingsAttended
J T Ralph 10 10 6 6J M Schubert Ø 4 3 5 5D V Murray 10 10 6 6N R Adler 6 6R J Clairs 5 4F D Ryan 5 5F J Swan 10 8B K Ward 5 5A B Daniels 6 6W G Kent **** 7 7C R Galbraith **** 7 6A C Booth ** 3 2K E Cowley *** 4 3
Nominations CommitteeNo. of
Meetings Held*
No. ofMeetingsAttended
J T Ralph 3 3J M Schubert 3 3D V Murray 3 3
* The number of meetings held during the time the Director was a member of the relevant committee.** Ms Booth retired on 31 December 2000.*** Mr Cowley retired on 29 March 2001.**** Mr Kent and Mr Galbraith were appointed to the Risk Committee on 31 December 2000.Ø Dr Schubert retired from the Risk Committee on 12 February 2001.

COMMONWEALTH BANK OF AUSTRALIA AND CONTROLLED ENTITIES
Directors’ Report
44
Principal ActivitiesThe Commonwealth Bank Group is one of
Australia’s leading providers of integrated financialservices including retail, business and institutionalbanking, superannuation, life insurance, generalinsurance, funds management, broking services andfinance company activities. The principal activities of theCommonwealth Bank Group during the financial yearwere:
BankingThe Group provides a full range of retail banking
services including housing loans, credit cards, personalloans, savings and cheque accounts and demand andterm deposits. The Group has leading domestic marketshares in home loans, personal loans, retail deposits anddiscount stockbroking and is one of Australia’s largestissuers of credit cards. The Group also offers a full rangeof commercial products including business loans,equipment and trade finance, and rural and agribusinessproducts.
The Institutional Banking operations focus on thetop 1,000 corporations, government entities and othermajor institutions operating in Australasia. Corporatecustomers have access to financial markets services,securities underwriting, trading and distribution, corporatefinance, equities, payments and transaction services,investment management and custody.
The Group also has full service banking operationsin New Zealand and Fiji
Funds ManagementThe Group is Australia’s largest fund manager and
largest retail funds manager in terms of its total value offunds under management. The Group has two main fundsmanagement businesses: Commonwealth InvestmentManagement and Colonial First State Investments. Thesebusinesses manage a wide range of wholesale and retailinvestment, superannuation and retirement funds.Investments are across all major asset classes includingAustralian and International shares, property, fixedinterest and cash.
The Group also has funds management businessesin New Zealand, UK and Asia.
Life InsuranceThe Group provides term insurance, disability
insurance, annuities, master trusts and investmentproducts.
The Group is Australia’s third largest insurer basedon life insurance assets held, and is Australia’s largestmanager in retail superannuation, allocated pensions andannuities by funds under management.
Life insurance operations are also conducted inNew Zealand, where the Group has the leading marketshare, and throughout Asia and the Pacific.
Consolidated ProfitConsolidated operating profit after tax and outside
equity interests for the financial year ended 30 June 2001was $2,398 million (2000: $2,700 million, including a netabnormal gain of $987 million).
The net operating profit for the year ended 30 June2001 after tax, and before goodwill amortisation andappraisal value uplift was $2,262 million. This is anincrease of $670 million or 42% over the year ended30 June 2000. Apart from a full year profit contributionfrom the Colonial acquired entities, the principalcontributing factors to this increase were a growth in netinterest income reflecting continued lending asset growthtogether with growth in commissions, funds managementincome and trading income, partly offset by increases ina range of expenses.
DividendsThe Directors have declared a fully franked (at
30%) final dividend of 75 cents per share amounting to$933 million. The dividend will be payable on 8 October2001. Dividends paid since the end of the previousfinancial year:� as provided for in last year’s report, a fully franked
final dividend of 72 cents per share amounting to$908 million was paid on 9 October 2000. Thepayment comprised cash disbursements of$739 million with $169 million being reinvested byparticipants through the Dividend ReinvestmentPlan; and
� in respect of the current year, a fully franked interimdividend of 61 cents per share amounting to$773 million was paid on 30 March 2001. Thepayment comprised cash disbursements of$629 million with $144 million being reinvested byparticipants through the Dividend ReinvestmentPlan.
Review of OperationsAn analysis of operations for the financial year is
set out in the Results Overview on pages 4 and 5 andBusiness Analysis on page 15 to 30.
Changes in State of AffairsThe Commonwealth Bank of Australia has become
the successor in law to State Bank of New South Wales(known as Colonial State Bank) effective on 4 June 2001pursuant to legislation. On that date State Bank of NewSouth Wales ceased to have a separate legal existenceand all its assets and liabilities became assets andliabilities of Commonwealth Bank of Australia.
The Bank’s shareholders’ equity was reduced by$700 million on 1 April 2001 pursuant to an off marketbuyback of 25.1 million shares.
There were no other significant changes in the stateof affairs of the Group during the financial year.
Events Subsequent to Balance DateThe Directors are not aware of any matter or
circumstance that has occurred since the end of thefinancial year that has significantly affected or maysignificantly affect the operations of the Group, the resultsof those operations or the state of affairs of the Group insubsequent financial years.

Directors’ Report
45
Future Developments and ResultsMajor developments which may affect the
operations of the Group in subsequent financial years arereferred to in the Strategy and Outlook on page 9. In theopinion of the Directors, disclosure of any furtherinformation on likely developments in operations would beunreasonably prejudicial to the interests of the Group.
Environmental RegulationThe Bank and its controlled entities are not subject
to any particular or significant environmental regulationunder a law of the Commonwealth or of a State orTerritory, but can incur environmental liabilities asa lender. The Bank has developed credit policies toensure this is managed appropriately.
Directors’ ShareholdingsParticulars of shares in the Commonwealth Bank or
in a related body corporate are set out in a separatesection at the end of the financial report titled‘Shareholding Information’ which is to be regarded ascontained in this report.
OptionsAn Executive Option Plan was approved by
shareholders at the Annual General Meeting on8 October 1996 and its continuation was further approvedby shareholders at the Annual General Meeting on29 October 1998. On 13 October 2000, the Bank grantedoptions over 2,002,500 unissued ordinary shares to50 executives under the Executive Option Plan. At the2000 Annual General Meeting, shareholders approvedthe establishment of the Equity Reward Plan and on7 February 2001, 577,500 options were granted to23 executives under this Plan. During the financial year2,435,000 shares were allotted consequent to an exerciseof options granted under the Executive Option Plan. Fulldetails of the Plan are disclosed in Note 29 to thefinancial statements.
The names of persons who currently hold options inthe Plan are entered in the register of options kept by theBank pursuant to Section 170 of the Corporations Act2001. The register may be inspected free of charge.
For details of the options granted to a director, referto the separate section at the end of the financial reporttitled ‘Shareholding Information’ which is to be regardedas contained in this report.
Directors’ Interests in ContractsA number of Directors have given written notices,
stating that they hold office in specified companies andaccordingly are to be regarded as having an interest inany contract or proposed contract that may be madebetween the Bank and any of those companies.
Directors’ and Officers’ IndemnityArticle 19 of the Commonwealth Bank’s Constitution
provides: “To the extent permitted by law, the companyindemnifies every director, officer and employee of thecompany against any liability incurred by that person(a) in his or her capacity as a director, officer or employeeof the company and (b) to a person other than thecompany or a related body corporate of the company.The company indemnifies every director, officer andemployee of the company against any liability for costsand expenses incurred by the person in his or hercapacity as a director, officer or employee of thecompany (a) in defending any proceedings, whether civilor criminal, in which judgment is given in favour of theperson or in which the person is acquitted or (b) inconnection with an application, in relation to suchproceedings, in which the Court grants relief to theperson under the Corporations Act 2001, provided thatthe director, officer or employee has obtained thecompany’s prior written approval (which shall not beunreasonably withheld) to incur the costs and expensesin relation to the proceedings”.
An indemnity for employees, who are not directors,secretaries or executive officers, is not expresslyrestricted in any way by the Corporations Act 2001.
The Directors, as named on pages 41 to 42 of thisreport, and the Secretaries of the Commonwealth Bank,being J D Hatton (Secretary) and K G Bourke (AssistantCompany Secretary) are indemnified under Article 19 asare all the executive officers and employees of theCommonwealth Bank.
Deeds of Indemnity have been executed byCommonwealth Bank in terms of Article 19 above infavour of each director.
Directors’ and Officers’ InsuranceThe Commonwealth Bank has, during the financial
year, paid an insurance premium in respect of aninsurance policy for the benefit of those named andreferred to above and the directors, secretaries,executive officers and employees of any related bodiescorporate as defined in the insurance policy. Theinsurance grants indemnity against liabilities permitted tobe indemnified by the company under Section 199B ofthe Corporations Act 2001. In accordance withcommercial practice, the insurance policy prohibitsdisclosure of the terms of the policy including the natureof the liability insured against and the amount of thepremium.
Directors’ and other Officers’ EmolumentsDetails of the Bank’s remuneration policy in respect
of the Directors and executives is set out under‘Remuneration Arrangements’ within the ‘CorporateGovernance’ section of this report.
Details on emoluments paid to each director aredetailed in Note 45 of the Financial Report. Details onemoluments paid to the executive director and the otherfive most highest paid executive officers of the Bank andthe Group are disclosed in Note 46 of the FinancialReport.

COMMONWEALTH BANK OF AUSTRALIA AND CONTROLLED ENTITIES
Directors’ Report
46
Incorporation of Additional MaterialThis report incorporates the Financial Highlights, Business Analysis, Corporate Governance and Shareholding
Information sections of this Annual Report.
RoundingsThe amounts contained in this report and the financial statements have been rounded to the nearest million dollars
unless otherwise stated, under the option available to the Company under ASIC Class Order 98/100.
Signed in accordance with a resolution of the Directors.
J T Ralph AC D V MurrayChairman Managing Director
22 August 2001

Five Year Financial Summary
47
2001 2000 1999 1998 1997$M $M $M $M $M
Profit and LossNet interest income 4,474 3,719 3,527 3,397 3,392Other operating income 4,350 2,420 1,997 1,833 1,489Total operating income 8,824 6,139 5,524 5,230 4,881Charge for bad and doubtful debts 385 196 247 233 98Total operating expenses 5,170 3,407 3,070 3,039 2,924Operating profit before goodwill amortisation, appraisalvalue uplift, abnormal items and income tax expense 3,269 2,536 2,207 1,958 1,859Income tax expense (993) (820) (714) (641) (588)Outside equity interests (14) (38) (24) (20) (22)Abnormal items - 967 - (570) (200)Income tax credit on abnormal items - 20 - 409 72Appraisal value uplift 474 92 - - -Goodwill amortisation (338) (57) (47) (46) (43)Operating profit after income tax attributable to members of the Bank 2,398 2,700 1,422 1,090 1,078
Contributions to profit (after tax)Banking 1,793 1,513 1,342 1,210 1,174Life insurance 320 129 103 76Funds management 149 36 24 11
}} 75 (1)
Profit on operations (cash basis) 2,262 1,678 1,469 1,297 1,249Goodwill amortisation (338) (57) (47) (46) (43)Appraisal value uplift 474 92 - - -Abnormal income (expense) after tax - 987 - (161) (128)Operating profit after income tax 2,398 2,700 1,422 1,090 1,078
Balance sheetLoans, advances and other receivables 136,059 132,263 101,837 89,816 81,632Total assets 230,411 218,259 138,096 130,544 120,103Deposits and other public borrowings 117,355 112,594 93,428 83,886 77,880Total liabilities 210,563 199,824 131,134 123,655 113,079Shareholders’ equity 18,393 17,472 6,735 6,712 6,846Net tangible assets 12,677 11,942 6,471 6,358 6,450Risk weighted assets 138,383 128,484 99,556 94,431 86,468Average interest earning assets 160,607 129,163 114,271 102,165 96,163Average interest bearing liabilities 145,978 117,075 103,130 91,650 85,296Assets (on balance sheet) Australia 196,918 187,452 115,510 110,120 101,202 New Zealand 20,208 16,661 13,046 10,846 9,994 Other 13,285 14,146 9,540 9,578 8,907Total Assets 230,411 218,259 138,096 130,544 120,103
(1) Figure is combined for 1997.

COMMONWEALTH BANK OF AUSTRALIA AND CONTROLLED ENTITIES
Five Year Financial Summary
48
2001 2000 1999 1998 1997
Shareholder SummaryDividends per share (cents) - fully franked 136 130 115 104 102Dividends provided for, reserved or paid ($million) 1,720 1,431 1,063 955 941Dividend cover (times - before abnormals) 1.4 1.2 1.3 1.3 1.3Dividend cover (times - cash) 1.3 1.6 1.3 1.1 1.1Earnings per share (cents) before abnormal items 190.1 184.8 153.4 134.5 131.2 after abnormal items 190.1 291.3 153.4 117.2 117.2 Cash basis (4) 179.4 181.0 158.5 139.4 136.2Dividend payout ratio (%) (1)
before abnormal items 71.2 83.5 74.7 76.3 78.0 after abnormal items 71.2 53.0 74.7 87.6 87.3 Cash basis (4) 75.5 85.3 72.4 73.7 75.3Net tangible assets per share ($) 10.2 9.2 6.8 6.7 6.7Weighted average number of shares (basic) 1,260m 927m 927m 930m 917mNumber of shareholders 709,647 788,791 404,728 419,926 426,229Share prices for the year ($) Trading high 34.15 27.95 28.76 19.66 16.00 Trading low 26.18 22.54 18.00 13.70 9.93 End (closing price) 34.15 27.69 24.05 18.84 16.00
Performance Ratios (%)Return on average shareholders’ equity (2)
before abnormal items 13.5 22.1 20.5 18.5 18.2 after abnormal items 13.5 34.8 20.5 16.1 16.4Return on average total assets (2)
before abnormal items 1.1 1.1 1.1 1.0 1.1 after abnormal items 1.1 1.7 1.1 0.9 0.9Capital adequacy - Tier 1 6.51 7.49 7.05 8.07 8.64Capital adequacy - Tier 2 4.18 4.75 3.12 2.82 2.82Deductions (1.53) (2.49) (0.79) (0.40) (0.57)Capital adequacy - Total 9.16 9.75 9.38 10.49 10.89Net interest margin 2.78 2.88 3.09 3.33 3.53
Other Information (numbers)Full time staff 31,976 34,154 26,394 28,034 30,566Part time staff 7,161 7,383 6,655 6,968 7,364Full time staff equivalent 34,960 37,131 28,964 30,743 33,543Branches/service centres (Australia) 1,066 1,441 1,162 1,218 1,334Agencies (Australia) 3,928 4,020 3,934 4,015 4,205ATMs 3,910 4,141 2,602 2,501 2,301EFTPOS terminals 122,074 116,064 90,152 83,038 63,370EzyBanking 659 603 n/a n/a n/a
ProductivityTotal Operating Income per full-time (equivalent) employee ($) 252,400 211,842 190,720 170,120 145,515Staff Expense/Total Operating Income (%) 26.7 27.8 29.0 31.0 34.0Total Operating Expenses (3) /Total Operating Income (%) 58.6 57.2 55.6 58.1 59.9
(1) Dividends paid divided by earnings. The comparative ratios have been amended to the same basis as the currentyear. Previously this ratio was calculated as Dividend per share divided by Earnings per share.
(2) Calculations based on operating profit after tax and outside equity interests applied to average shareholders’equity/average total assets.
(3) Total Operating Expenses excluding goodwill amortisation and charge for bad and doubtful debts. Note the differentbusiness mix following the Colonial acquisition impacts comparison with prior years.
(4) ‘Cash earnings’ for the purpose of these financial statements is defined as net profit after tax and before abnormalitems, goodwill amortisation and life insurance and funds management appraisal value uplift.

Financial Statements
49
Statements of Financial Performance ..................................................................................................................................... 50Statements of Financial Position.............................................................................................................................................. 51Statements of Changes in Shareholders’ Equity ................................................................................................................... 52Statements of Cash Flows......................................................................................................................................................... 53Notes to the Financial Statements ........................................................................................................................................... 541 Summary of Significant Accounting Policies........................................................................................................................ 542 Acquisition of Colonial........................................................................................................................................................... 633 Operating Profit ..................................................................................................................................................................... 644 Average Balance Sheet and Related Interest...................................................................................................................... 665 Income Tax Expense ............................................................................................................................................................ 706 Dividends, Provided For, Reserved or Paid......................................................................................................................... 717 Earnings Per Share............................................................................................................................................................... 728 Cash and Liquid Assets ........................................................................................................................................................ 729 Receivables from Other Financial Institutions .................................................................................................................... 7310 Trading Securities ................................................................................................................................................................ 7311 Investment Securities ........................................................................................................................................................... 7412 Loans, Advances and Other Receivables............................................................................................................................ 7713 Provisions for Impairment ..................................................................................................................................................... 7914 Credit Risk Concentrations................................................................................................................................................... 8315 Asset Quality ......................................................................................................................................................................... 9016 Life Insurance Investment Assets ........................................................................................................................................ 9517 Deposits with Regulatory Authorities ................................................................................................................................... 9518 Shares in and Loans to Controlled Entities.......................................................................................................................... 9519 Property, Plant and Equipment............................................................................................................................................. 9620 Intangible Assets................................................................................................................................................................... 9721 Other Assets.......................................................................................................................................................................... 9822 Deposits and Other Public Borrowings ................................................................................................................................ 9823 Payables to Other Financial Institutions............................................................................................................................... 9924 Income Tax Liability .............................................................................................................................................................. 9925 Other Provisions.................................................................................................................................................................. 10026 Debt Issues ......................................................................................................................................................................... 10027 Bills Payable and Other Liabilities...................................................................................................................................... 10228 Loan Capital ........................................................................................................................................................................ 10329 Share Capital....................................................................................................................................................................... 10530 Outside Equity Interests...................................................................................................................................................... 10831 Capital Adequacy................................................................................................................................................................ 10932 Maturity Analysis of Monetary Assets and Liabilities......................................................................................................... 11233 Financial Reporting by Segments ...................................................................................................................................... 11434 Life Insurance Business...................................................................................................................................................... 11735 Remuneration of Auditors ................................................................................................................................................... 12336 Commitments for Capital Expenditure Not Provided for in the Accounts ......................................................................... 12337 Lease Commitments - Property, Plant and Equipment ..................................................................................................... 12338 Contingent Liabilities........................................................................................................................................................... 12439 Market Risk ......................................................................................................................................................................... 12640 Superannuation Commitments........................................................................................................................................... 13641 Controlled Entities............................................................................................................................................................... 13742 Investments in Associated Entities and Joint Ventures..................................................................................................... 13943 Standby Arrangements and Unused Credit Facilities........................................................................................................ 14044 Related Party Disclosures .................................................................................................................................................. 14045 Remuneration of Directors.................................................................................................................................................. 14246 Remuneration of Executives............................................................................................................................................... 14447 Statements of Cash Flow.................................................................................................................................................... 14748 Disclosures about Fair Value of Financial Instruments ..................................................................................................... 149Directors’ Declaration .............................................................................................................................................................. 151Independent Audit Report ....................................................................................................................................................... 152Shareholding Information........................................................................................................................................................ 153

COMMONWEALTH BANK OF AUSTRALIA AND CONTROLLED ENTITIES
Statements of Financial PerformanceFor the Year ended 30 June 2001
50
GROUP BANK2001 2000 1999 2001 2000
Note $M $M $M $M $M
Interest income 3 11,900 8,842 7,745 8,560 7,239Interest expense 3 7,426 5,123 4,218 5,261 4,230Net interest income 4,474 3,719 3,527 3,299 3,009Other income:Proceeds from sale of assets 185 61 798 149 29Written down value of assets sold (104) (36) (695) (39) (8)Other 2,300 1,926 1,640 2,462 1,984Net banking operating income 6,855 5,670 5,270 5,871 5,014
Premiums and related revenue 3 958 337 236 - -Investment revenue 3 1,698 1,066 590 - -Claims and policyholder liability expense (1,388) (1,077) (669) - -Life insurance margin on services operating income 1,268 326 157 - -Funds management fee income 3 701 143 97 - -Net life insurance and funds management operating incomebefore appraisal value uplift 1,969 469 254 - -Total net operating income before appraisal value uplift 8,824 6,139 5,524 5,871 5,014
Charge for bad and doubtful debts 3,13 385 196 247 276 191Operating expenses:Staff expenses 3 2,360 1,705 1,604 1,672 1,510Occupancy and equipment expenses 3 604 437 455 392 371Information technology services 3 748 571 505 563 534Other expenses 3 1,458 694 506 671 536
5,170 3,407 3,070 3,298 2,951Profit from ordinary activities beforeappraisal value uplift, restructuring charge, goodwillamortisation and income tax 3,269 2,536 2,207 2,297 1,872Appraisal value uplift 34 474 1,165 (1) - - (26)Restructuring charge 1(aa) - (106) (1) - - (106)Goodwill amortisation (338) (57) (47) (49) (39)Profit from ordinary activities before income tax 3,405 3,538 2,160 2,248 1,701Income tax expense 5 993 800 (1) 714 549 585Net profit 2,412 2,738 1,446 1,699 1,116Outside equity interests in net profit (14) (38) (24) - -
Net profit attributable to members of the Bank 2,398 2,700 1,422 1,699 1,116
Foreign currency translation adjustment 98 (26) (33) 6 (15)Revaluation of investments and properties 5 - - - 589Total valuation adjustments 103 (26) (33) 6 574Total changes in equity other than those resulting fromtransactions with owners as owners 2,501 2,674 1,389 1,705 1,690
Cents per shareEarnings per share based on net profit distributable tomembers of the BankBasic and Fully Diluted 7 190 291 153Dividends provided for, reserved or paid per share attributableto members of the Bank: 6 136 130 115
(1) For comparative purposes it should be noted that these amounts included $987 million reported as a net abnormal gainat 30 June 2000, which is no longer disclosed as such due to the introduction of new accounting standard AASB 1018:Statement of Financial Performance. Refer Note 1 (pp) for details.

Statements of Financial PositionAs at 30 June 2001
51
GROUP BANK2001 2000 2001(1) 2000
Note $M $M $M $M
AssetsCash and liquid assets 8 3,709 2,575 3,286 2,103Receivables due from other financial institutions 9 4,622 5,154 3,795 4,329Trading securities 10 6,909 7,347 5,020 4,692Investment securities 11 9,705 9,149 6,873 7,169Loans, advances and other receivables 12 136,059 132,263 112,634 90,661Bank acceptances of customers 12,075 11,107 12,158 10,674Life insurance investment assets 16 31,213 27,036 - -Deposits with regulatory authorities 17 61 46 4 3Shares in and loans to controlled entities 18 - - 16,425 17,349Property, plant and equipment 19 919 1,073 688 739Investment in associates 42 400 403 258 297Intangible assets 20 10,852 10,227 3,151 412Other assets 21 13,887 11,879 11,876 8,255Total Assets 230,411 218,259 176,168 146,683
LiabilitiesDeposits and other public borrowings 22 117,355 112,594 103,475 88,240Payables due to other financial institutions 23 6,903 4,633 6,349 4,136Bank acceptances 12,075 11,107 12,158 10,674Due to controlled entities - - 8,225 4,326Provision for dividend 6 779 708 779 708Income tax liability 24 1,355 1,823 414 550Other provisions 25 1,007 1,554 837 808Life insurance policyholder liabilities 34 27,029 25,282 - -Debt issues 26 24,484 25,275 10,690 8,205Bills payable and other liabilities 27 13,872 11,549 11,547 8,428
204,859 194,525 154,474 126,075Loan Capital 28 5,704 5,299 5,624 4,803Total Liabilities 210,563 199,824 160,098 130,878Net Assets 19,848 18,435 16,070 15,805
Shareholders’ EquityShare CapitalOrdinary Share Capital 29 12,455 12,521 12,455 12,521Preference Share Capital 29 687 - 687 -Reserves 4,091 3,265 2,278 2,304Retained profits 1,160 1,686 650 980Shareholders’ equity attributable to members of the Bank 18,393 17,472 16,070 15,805Outside equity interests:Controlled entities 30 (3) 375 - -Life insurance statutory funds 30 1,458 588 - -Total outside equity interests 1,455 963 - -Total Shareholders’ Equity 19,848 18,435 16,070 15,805
(1) The Commonwealth Bank of Australia became the successor in law to all the assets and liabilities of State Bank of NewSouth Wales (known as Colonial State Bank) effective on 4 June 2001 pursuant to legislation.

COMMONWEALTH BANK OF AUSTRALIA AND CONTROLLED ENTITIES
Statements of Changes in Shareholders’ EquityFor the year ended 30 June 2001
52
GROUP BANK2001 2000 1999 2001 2000
Note $M $M $M $M $M
Ordinary Share Capital 29Opening balance 12,521 3,526 1,845 12,521 3,526Transfer from share premium reserve - - 1,499 - -Buyback (275) (553) (246) (275) (553)Buyback for dividend reinvestment plan (140) - - (140) -Dividend reinvestment plan 313 253 426 313 253Employee share ownership schemes 40 23 5 40 23Issue costs (4) (2) (3) (4) (2)Share issue to Colonial shareholders - 9,274 - - 9,274Closing balance 12,455 12,521 3,526 12,455 12,521Preference Share Capital 29Opening balance - - - - -Issue of shares 700 - - 700 -Issue costs (13) - - (13) -Closing balance 687 - - 687 -Retained profitsOpening balance 1,686 1,698 755 980 1,295Adjustment on adoption of new life insurance standard - 432 - - -Assumption of Colonial State Bank profits - - - 140 -Buyback (449) - (404) (449) -Transfers from reserves 125 - 1,087 - -Operating profit attributable to members of Bank 2,398 2,700 1,422 1,699 1,116Total available for appropriation 3,760 4,830 2,860 2,370 2,411Transfers to reserves (1) (880) (1,713) (99) - -Interim dividend - cash component (642) (405) (275) (642) -Interim dividend - appropriated to dividend reinvestment plan reserve (131) (118) (183) (131) (118)Provision for final dividend - cash component (765) (708) (472) (765) (1,113)Final dividend - appropriated to dividend reinvestment plan reserve (168) (200) (133) (168) (200)Other dividends (14) - - (14) -Closing balance 1,160 1,686 1,698 650 980ReservesGeneral ReserveOpening balance 2,793 1,080 2,069 570 570Appropriation from profits 880 1,713 99 - -Transfer to retained profits (125) - (1,088) - -Closing balance 3,548 2,793 1,080 570 570Capital ReserveOpening balance 289 289 289 1,531 942Transfers from reserves - - - - 589Closing balance 289 289 289 1,531 1,531Asset Revaluation ReserveOpening balance - - - - -Revaluation of investments and properties 5 - - - 589Transfers to capital reserve - - - - (589)Closing balance 5 - - - -Share Premium ReserveOpening balance - - 1,499 - -Transfer to Ordinary Share Capital - - (1,499) - -Closing balance - - - - -Dividend Reinvestment Plan ReserveOpening balance 200 133 214 200 133Conversion to ordinary share capital and cash dividend (331) (251) (397) (331) (251)Appropriation from profits 299 318 316 299 318Closing balance 168 200 133 168 200Foreign Currency Translation ReserveOpening balance (17) 9 41 3 18Currency translation adjustments 98 (26) (33) 6 (15)Transfer to retained profits - - 1 - -Closing balance 81 (17) 9 9 3
Total Reserves 4,091 3,265 1,511 2,278 2,304Shareholders’ equity attributable to members of the Bank 18,393 17,472 6,735 16,070 15,805(1) Undistributable profits in respect of life insurance businesses.

Statements of Cash FlowsFor the Year ended 30 June 2001
53
GROUP BANK2001 2000 1999 2001(1) 2000
$M $M $M $M $M
Cash Flows From Operating ActivitiesInterest received 12,059 7,949 7,796 8,567 7,314Dividends received 14 20 6 404 83Interest paid (7,704) (4,538) (4,071) (5,299) (4,027)Other operating income received 2,800 2,210 1,972 1,558 1,768Expenses paid (5,583) (3,215) (2,756) (3,296) (2,785)Income taxes paid (1,252) (976) (363) (947) (850)Net decrease (increase) in trading securities (262) (50) (408) 171 (892)Life insurance:Investment income 900 428 - - -Premiums received 6,286 2,771 - - -Policy payments (5,423) (2,112) - - -Net Cash provided by Operating Activities 1,835 2,487 2,176 1,158 611
Cash Flows from Investing ActivitiesPayments for acquisition of entities (414) (46) (196) (378) (46)Net movement in investment securities: Purchases (19,676) (16,852) (13,337) (17,937) (15,050) Proceeds from sale 28 17 146 84 7 Proceeds at or close to maturity 19,654 15,212 11,993 18,587 14,954Withdrawal (lodgement) of deposits with regulatory authorities 15 950 (121) 1 949Net increase in loans, advances and other receivables (4,181) (8,791) (11,819) (4,311) (7,789)Net amounts paid to controlled entities - - - 1,809 (1,011)Proceeds from sale of property, plant and equipment 157 44 652 65 22Purchase of property, plant and equipment (132) (94) (81) (41) (81)Net decrease (increase) in receivables due from other financialinstitutions not at call
(184) (3,697) 229 (190) (3,060)
Net decrease (increase) in securities purchased under agreementsto resell
(891) (433) (465) (891) (433)
Net decrease (increase) in other assets 1,504 (2,424) (423) 909 879Life insurance:Purchases of investment securities (21,229) (11,356) - - -Proceeds from sale/maturity of investment securities 20,556 10,863 - - -Net Cash used in Investing Activities (4,793) (16,607) (13,422) (2,293) (10,659)
Cash Flows from Financing ActivitiesBuy back of shares (724) (553) (650) (724) (553)Proceeds from issue of shares (net of costs) 723 4 6 723 4Net increase (decrease) in deposits and other borrowings 5,246 6,043 9,476 1,565 6,991Net movement in debt issues (2,099) 5,834 399 (1,137) 1,865Dividends paid (1,368) (882) (571) (1,368) (875)Net movements in other liabilities (1,010) 461 (138) (378) 44Net increase (decrease) in payables due to other financialinstitutions not at call
1,396 2,470 (477) 1,378 2,361
Net increase (decrease) in securities sold under agreements torepurchase
(485) 327 (43) (485) 327
Issue of loan capital - 2,053 (317) - 1,975Other (69) 306 1,041 293 (956)Net Cash provided by Financing Activities 1,610 16,063 8,726 (133) 11,183Net Increase (Decrease) in Cash and Cash Equivalents (1,348) 1,943 (2,520) (1,268) 1,135Cash and Cash Equivalents at beginning of period 1,386 (557) 1,963 848 (287)Cash and Cash Equivalents at end of period 38 1,386 (557) (420) 848
(1) There were no cash flows associated with the Commonwealth Bank of Australia becoming the successor in law to allthe assets and liabilities of State Bank of New South Wales (known as Colonial State Bank) effective on 4 June 2001pursuant to legislation.
Details of Reconciliation of Cash and Reconciliation of Operating Profit After Income Tax to Net Cash Provided byOperating Activities are provided in Note 47.
It should be noted that the Group does not use this accounting Statement of Cash Flows in the internal management ofits liquidity positions.

COMMONWEALTH BANK OF AUSTRALIA AND CONTROLLED ENTITIES
Notes to the financial statements
54
NOTE 1 Summary of Significant Accounting Policies
(a) Bases of accountingIn this financial report Commonwealth Bank of
Australia is referred to as the ‘Bank’ or ‘Company’, andthe ‘Group’ or the ‘Consolidated Entity’ consists of theBank and its controlled entities. The financial report isa general purpose financial report which complies withthe requirements of the Banking Act, Corporations Act2001, applicable Accounting Standards and othermandatory reporting requirements so far as therequirements are considered appropriate to a bankingcorporation.
The accounting policies applied are consistent withthose of the previous year, except as noted below.
The Group adopted the requirements ofAASB 1038: Life Insurance Business for the first timefrom 1 July 1999, refer note 1(jj). From 1 July 2000outside equity interests in managed investment fundscontrolled by the life insurance statutory funds have beenbrought to account. As a result life insurance investmentassets and outside equity interests have increased by$1,458 million at 30 June 2001 ($588 million at 30 June2000). This change has no impact on operating profitafter tax attributable to the Bank. Comparative figureshave been restated.
The Group has elected to apply revised accountingstandard AASB 1005: Segment Reporting prior to itsoperative date in accordance with Section 334(5) of theCorporations Act 2001, refer Note 33.
The Group has elected to apply revised accountingstandard AASB 1041: Revaluation of Non-Current Assetsprior to its operative date in accordance with Section334(5) of the Corporations Act 2001, refer Note 19.
Further, in accordance with revised InternationalAccounting Standard IAS 1: Presentation of FinancialStatements, certain income and expense items havebeen presented on a net basis. The principal itemsinvolved are the netting of card issuer reimbursementcosts against merchant service fees. There is no effect onprofit and loss.
The Statements of Cash Flows has been preparedin accordance with the International Accounting StandardIAS 7: Cash Flow Statements.
The preparation of the financial report in conformitywith generally accepted accounting principles requiresmanagement to make estimates and assumptions thataffect the amounts reported in the financial statementsand accompanying notes. Actual results could differ fromthese estimates although it is not anticipated that suchdifferences would be material.
Unless otherwise indicated, all amounts are shownin $ million and are expressed in Australian currency.
(b) Historical costThe financial statements of the Bank and the
consolidated financial statements have been prepared inaccordance with the historical cost convention and,except for AASB 1038: Life Insurance Businessrequirements and where indicated, do not reflect currentvaluations of non monetary assets. Domestic billsdiscounted which are included in loans, advances andother receivables and held by the Company andsecurities and derivatives held for trading purposes havebeen marked to market. The carrying amounts of all noncurrent assets are reviewed to determine whether theyare in excess of their recoverable amount at balancedate.
If the carrying amount of a non current assetexceeds the recoverable amount, the asset is writtendown to the lower amount. In assessing recoverableamounts for particular classes of assets the relevant cashflows have not been discounted to their present valueunless otherwise stated.
(c) ConsolidationThe consolidated financial statements include the
financial statements of the Bank and all entities where itis determined that there is a capacity to control as definedin AASB 1024: Consolidated Accounts. All balances andtransactions between Group entities have beeneliminated on consolidation.
The Commonwealth Bank of Australia became thesuccessor in law to State Bank of New South Wales(known as Colonial State Bank) effective on 4 June 2001pursuant to legislation. On that date State Bank of NewSouth Wales ceased to have a separate legal existenceand all its assets and liabilities became assets andliabilities of the parent entity Commonwealth Bank ofAustralia. This succession in law has no effect on theconsolidated Group. One outcome of this process is thatthe carrying amount of the Bank’s investment in ColonialGroup has been reduced to reflect the net tangible assetsand goodwill ($2,742 million, refer Note 20) now withinCommonwealth Bank of Australia. There is no effect onthe amount of goodwill in the consolidated financialstatements.
(d) Investments in associated companiesAssociated companies are defined as those entities
over which the Group has significant influence but thereis no capacity to control. Details of material associatedcompanies are shown in Note 42.
Investments in associates are carried at cost plusthe Group’s share of post-acquisition profit or loss. TheGroup’s share of profit or loss of associates is included inthe profit from ordinary activities.
(e) Foreign currency translationsAll foreign currency monetary assets and liabilities
are revalued at rates of exchange prevailing at balancedate. Foreign currency forward, futures, swaps and optionpositions are valued at the appropriate market ratesapplying at balance date. Unrealised gains and lossesarising from these revaluations and gains and lossesarising from foreign exchange dealings are included inresults.
The foreign currency assets and liabilities ofoverseas branches and overseas controlled entities areconverted to Australian currency at 30 June 2001 inaccordance with the current rate method. Profit and lossitems for overseas branches and overseas controlledentities are converted to Australian dollars progressivelythroughout the year at the exchange rate current at thelast calendar day of each month.
Translation differences arising from conversion ofopening balances of shareholders’ funds of overseascontrolled entities at year end exchange rates areexcluded from profit and loss and reflected in a ForeignCurrency Translation Reserve. The Group maintainsa substantially matched position in assets and liabilities inforeign currencies and the level of net foreign currencyexposure does not have a material effect on its financialcondition.

Notes to the financial statements
55
NOTE 1 Summary of Significant Accounting Policies continued
(f) RoundingsThe amounts contained in this report and the
financial statements have been rounded to the nearestmillion dollars unless otherwise stated, under the optionavailable to the Company under ASIC Class Order98/100.
(g) Financial instrumentsThe Group is a full service financial institution which
offers an extensive range of on balance sheet and offbalance sheet financial instruments.
For each class of financial instrument listed below,except for restructured facilities referred to in Note 1(m),financial instruments are transacted on a commercialbasis to derive an interest yield/cost with terms andconditions having due regard to the nature of thetransaction and the risks involved.
(h) Cash and liquid assetsCash and liquid assets includes cash at branches,
cash at bankers and money at short call.They are brought to account at the face value or the
gross value of the outstanding balance whereappropriate.
Interest is taken to profit when earned.
(i) Receivables due from other financialinstitutionsReceivables from other financial institutions
includes loans, nostro balances and settlement accountbalances due from other banks. They are brought toaccount at the gross value of the outstanding balance.Interest is taken to profit when earned.
(j) Trading securitiesTrading securities are short and long term public,
bank and other debt securities and equities which areacquired and held for trading purposes. They are broughtto account at net fair value based on quoted marketprices, broker or dealer price quotations. Realised gainsand losses on disposal and unrealised fair valueadjustments are reflected in ‘Other Income’. Interest ontrading securities is reported in net interest earnings.Trading securities are recorded on a trade date basis.
(k) Investment securitiesInvestment securities are securities purchased with
the intent of being held to maturity.Investment securities are short and long term
public, bank and other securities and include bonds, billsof exchange, commercial paper, certificates of depositand equities. These securities are recorded at cost oramortised cost. Premiums and discounts are amortisedthrough profit and loss each year from the date ofpurchase so that securities attain their redemption valuesby maturity date. Interest is reflected in profit whenearned. Dividends on equities are brought to account inprofit on declaration date. Any profits or losses arisingfrom disposal prior to maturity are taken to profit in theperiod in which they are realised. The cost of securitiessold is calculated on a specific identification basis.Unrealised losses related to permanent diminution in thevalue of investment securities are recognised in profit andthe recorded values of those securities adjustedaccordingly.
Investment securities are recorded on a trade datebasis. The relationship between book and net fair valuesof investment securities is shown in Note 11.
(l) Repurchase agreementsSecurities sold under agreements to repurchase are
retained within the investment or trading portfolios andaccounted for accordingly. Liability accounts are used torecord the obligation to repurchase and are disclosed asdeposits and other public borrowings. Securities heldunder reverse repurchase agreements are recorded asliquid assets.
(m) Loans, advances and other receivablesLoans, advances and other receivables include
overdrafts, home, credit card and other personal lending,term loans, leasing, bill financing, redeemable preferenceshares and leverage leases. They are carried at therecoverable amount represented by the gross value ofthe outstanding balance adjusted for provisions for badand doubtful debts, interest reserved and unearned taxremissions on leveraged leases. Interest and yield relatedfees are reflected in profit when earned. Yield relatedfees received in advance are deferred, included as part ofthe carrying value of the loan and amortised to profit as‘Interest Income’ over the term of the loan. Note 1(n)provides additional information with respect to leasingand leveraged leasing.
Non Accrual FacilitiesNon accrual facilities (primarily loans) are placed on
a cash basis for recognition of income. Uponclassification as non accrual, all interest charged in thecurrent financial period is reversed from profit andreserved if it has not been received in cash.
If necessary, a specific provision for impairment isrecognised so that the carrying amount of the facility doesnot exceed the expected future cash flows. In subsequentperiods, interest in arrears/due on non accrual facilities istaken to profit and loss when a cash payment isreceived/realised and the amount is not designated asa principal payment. Non accrual facilities are restored toan accrual basis when all principal and interest paymentsare current and full collection is probable.
Restructured FacilitiesWhen facilities (primarily loans) have the original
contractual terms modified, the accounts becomeclassified as restructured. Such accounts will haveinterest accrued to profit as long as the facility isperforming on the modified basis in accordance with therestructured terms. If performance is not maintained, orcollection of interest and/or principal is no longerprobable, the account will be returned to the non accrualclassification. Facilities are generally kept as non accrualuntil they are returned to performing basis.
Assets Acquired Through Securities Enforcement(AATSE)Assets acquired in satisfaction of facilities in default
(primarily loans) are recorded at net market value at thedate of acquisition. Any difference between the carryingamount of the facility and the net market value of theassets acquired is represented as a specific provision fordiminution of value or written off. AATSE are furtherclassified as Other Real Estate Owned (OREO) or OtherAssets Acquired Through Security Enforcement(OAATSE). Such assets are classified in the appropriateasset classifications in the balance sheet.

COMMONWEALTH BANK OF AUSTRALIA AND CONTROLLED ENTITIES
Notes to the financial statements
56
NOTE 1 Summary of Significant Accounting Policies continuedBad DebtsBad debts are written off in the period in which they
are recognised. Bad debts previously specificallyprovided for are written off against the related specificprovisions, while bad debts not provided for are written offthrough the general provision. Any subsequent cashrecovery is credited to the general provision.
(n) Leasing and leveraged leasingFinance leases are accounted for using the finance
method and are included in loans, advances and otherreceivables. Income, determined on an actuarial basis, istaken to account over the term of the lease in relation tothe outstanding investment balance.
The finance method also applies to leveragedleases but with income being brought to account at therate which yields a constant rate of return on theoutstanding investment balance over the life of thetransaction so as to reflect the underlying assets,liabilities, revenue and expenses that flow from thearrangements. Where a change occurs in the estimatedlease cash flows or available tax benefits at any stageduring the term of the lease, the total lease profit isrecalculated for the entire lease term and apportionedover the remaining lease term.
In accordance with amendments to AASB 1008:Leases, all leveraged leases with a lease term beginningfrom 1 July 1999 are accounted for as finance leases withincome brought to account progressively over the leaseterm.
Leveraged lease receivables are recorded underloans, advances and other receivables at amounts whichreflect the equity participation in the lease. The debtprovider in the transaction has no recourse other than tothe unremitted lease rentals and the equipment underlease.
Operating lease rental revenue and expense isrecognised in the profit in equal periodic amounts overthe effective lease term.
(o) Provisions for impairmentProvisions for credit losses are maintained at an
amount adequate to cover anticipated credit relatedlosses. Credit losses arise primarily from loans but alsofrom other credit instruments such as bank acceptances,contingent liabilities, financial instruments andinvestments and assets acquired through securityenforcement.
Specific provisions are established where fullrecovery of principal is considered doubtful. Specificprovisions are made against individual facilities in thecredit risk rated managed segment where exposureaggregates to $250,000 or more, and a loss of $10,000 ormore is expected. A specific provision is also establishedagainst each statistically managed portfolio in thestatistically managed segment to cover facilities whichare not well secured and past due 180 days or more,against the credit risk rated managed segment forexposures aggregating to less than $250,000 and 90days past due or more, and against emerging credit risksidentified in specific segments in the credit risk ratedmanaged portfolio. These provisions are funded primarilyby reference to historical ratios of write offs to balances indefault.
General provisions for bad and doubtful debts aremaintained to cover non identified probable losses andlatent risks inherent in the overall portfolio of advancesand other credit transactions. The provisions aredetermined having regard to the general risk profile of thecredit portfolio, historical loss experience, economicconditions and a range of other criteria.
The amounts required to bring the provisions forimpairment to their assessed levels are taken to profit.The balance of provisions for impairment and movementstherein are set out in Note 13.
All facilities subject to a specific provision areclassified as non accrual and interest is only taken toprofit when received in cash.
(p) Bank acceptances of customersThe exposure arising from the acceptance of bills of
exchange that are sold into the market is brought toaccount as a liability. An asset of equal value is raised toreflect the offsetting claim against the drawer of the bill.Bank acceptances generate fee income which is taken toprofit when earned.
(q) Deposits with regulatory authoritiesIn several countries in which the Group operates,
the law requires that the Group lodge regulatory depositswith the local central bank at a rate of interest below thatgenerally prevailing in that market. The amount of thedeposit and the interest rate receivable are calculated inaccordance with the requirements of the local centralbank. Interest is taken to profit when earned.
(r) Shares in and loans to controlled entitiesThese investments are recorded at the lower of cost
or recoverable amount.
(s) Property, plant and equipmentAt year end, independent market valuations,
reflecting current use, were obtained for all individualproperty holdings (other than leasehold improvements).Directors adopt a valuation based on independent advice.Adjustments arising from revaluation are reflected inAsset Revaluation Reserve, except to the extent theadjustment reverses a revaluation previously recognisedin profit and loss. For the current year the revaluation hadminimal effect on the level of the reserve.
Depreciation on owned buildings is based on theassessed useful life of each building. The book value ofbuildings demolished as part of the redevelopment of asite is written off in the financial year in which thebuildings are demolished. Leasehold improvements arecapitalised and depreciated over the unexpired term ofthe current lease.
Equipment is shown at cost less depreciationcalculated principally on a category basis at ratesapplicable to each category’s useful life. Depreciation iscalculated using the straight line method. It is treated asan operating expense and charged to profit. The amountscharged for the year are shown in Note 3.
Profit or loss on sale of property is treated asoperating income or expense. Realised amounts in AssetRevaluation Reserve are transferred to Capital Reserve.

Notes to the financial statements
57
NOTE 1 Summary of Significant Accounting Policies continued
(s) Property, plant and equipmentThe useful lives of major depreciable assets are as
follows:
Buildings- Shell Maximum 30 years- Integral plant and equipment
- carpets 10 years- all other (air-conditioning,
lifts)20 years
- Non integral plant andequipment- fixtures and fittings 10 years
Leasehold improvements Lesser of unexpiredlease term or lives asabove
Equipment- Security surveillance systems 10 years- Furniture 8 years- Office machinery 5 years- EFTPOS machines 3 years
The Bank has outsourced the majority of itsinformation processing and does not own any materialamounts of computer or communications equipment.
(t) GoodwillGoodwill, representing the excess of purchase
consideration plus incidental expenses over the fair valueof the identifiable net assets at the time of acquisition ofan entity, is capitalised and brought to account in thebalance sheet.
The goodwill so determined is amortised ona straight line basis over the period of expected benefitbut not exceeding 20 years. Purchased goodwill resultingfrom the acquisition of the Colonial Group in June 2000and the amortisation policy is set out in Note 2.Purchased goodwill arising from the merger with theState Bank of Victoria in 1991 is being amortised over20 years. Purchased goodwill arising from the acquisitionof the 25% minority interest in ASB Group in NewZealand in August 2000 is being amortised over 20 years.Goodwill on acquisition of Commonwealth FundsManagement in December 1996, Micropay in 1995 andLeaseway in April 1997 is being amortised over 10, 7 and5 years respectively. The periods of goodwill amortisationare subject to review annually by the Directors.
(u) Other assetsOther assets includes all other financial assets and
includes interest, fees, market revaluation of tradingderivatives and other unrealised income receivable andsecurities sold not delivered. These assets are recordedat the cash value to be realised when settled.
Capitalisation of Computer Software CostsIn accordance with the American Institute of
Certified Public Accountants Statement of Position 98-1‘Accounting for the Costs of Computer SoftwareDeveloped or Obtained for Internal Use’, the Groupcarries net unamortised capitalised computer softwarecosts of $77 million as at 30 June 2001. The amortisationperiod for software is 2½ years except for certain longerterm projects. Software maintenance costs continue to beexpensed as incurred.
(v) Deposits and other public borrowingsDeposits and other public borrowings includes
certificates of deposits, term deposits, savings deposits,cheque and other demand deposits, debentures andother funds raised publicly by borrowing corporations.They are brought to account at the gross value of theoutstanding balance. Interest is taken to profit whenincurred.
(w) Payables due to other financial institutionsPayables due to other financial institutions includes
deposits, vostro balances and settlement accountbalances due to other banks. They are brought toaccount at the gross value of the outstanding balance.Interest is taken to profit when incurred.
(x) Provision for dividendThe provision for dividend represents the maximum
expected cash component of the declared final dividend.The remaining portion of the dividend is appropriated tothe Dividend Reinvestment Plan Reserve where newshares are to be issued under the plan.
(y) Income taxesThe Group has adopted the liability method of tax
effect accounting. The tax effect of timing differenceswhich arise from items being brought to account indifferent periods for income tax and accounting purposesis disclosed as a future income tax benefit or a provisionfor deferred income tax. Amounts are offset where the taxpayable and realisable benefit are expected to occur inthe same financial period. The future income tax benefitrelating to tax losses and timing differences is not carriedforward as an asset unless the benefit is virtually certainof being utilised (Notes 5 and 21).
(z) Provisions for employee entitlementsThe provision for long service leave is subject to
actuarial review and is maintained at a level that accordswith actuarial advice.
The provision for annual leave represents theoutstanding liability as at balance date. Actual paymentsmade during the year are included in Salaries andWages.
The provision for other employee entitlementsrepresents liabilities for staff housing loan benefits anda subsidy to a registered health fund with respect toretired employees and current employees.
The level of these provisions has been determinedin accordance with the requirements of AASB 1028:Accounting for Employee Entitlements.
(aa) Provision for restructuringProvision for Restructuring (2000)In June 2000 the Group acquired a 100% interest in
the Colonial Limited Group of companies. This resulted inconsequent restructuring requirements withinCommonwealth Bank’s existing business. The provisionfor restructuring covers the integration of the Colonialoperations into the existing Group and rationalisation ofexisting processing and administrative functions. Theprincipal costs associated with this programme are in thearea of redundancy, property and systems. Refer Note 2for further details on the Colonial acquisition.

COMMONWEALTH BANK OF AUSTRALIA AND CONTROLLED ENTITIES
Notes to the financial statements
58
NOTE 1 Summary of Significant Accounting Policies continuedRestructuring Costs (2000)The integration of Colonial into the Group’s
structure resulted in an expense for restructuring of$106 million ($86 million after tax) being charged to theBank’s result in the year ending 30 June 2000 (ReferNote 25).
(bb) Provision for self insuranceThe provision for self insurance covers certain non
lending losses and non transferred insurance risks.Actuarial reviews are carried out at regular intervals withprovisioning effected in accordance with actuarial advice.
(cc) Debt issuesDebt issues are short and long term debt issues of
the Group including commercial paper, notes, term loansand medium term notes which are recorded at cost oramortised cost. Premiums, discounts and associatedissue expenses are amortised through profit and losseach year from the date of issue so that securities attaintheir redemption values by maturity date.
Interest is reflected in profit as incurred. Any profitsor losses arising from redemption prior to maturity aretaken to profit in the period in which they are realised.
Further details of the Group’s debt issues areshown in Note 26.
(dd) Bills payable and other liabilitiesBills payable and other liabilities includes all other
financial liabilities and includes interest, fees, marketrevaluation of trading derivatives and other unrealisedexpenses payable and securities purchased notdelivered.
These liabilities are recorded at the cash value tobe realised when settled.
(ee) Loan capitalLoan capital is debt issued by the Group with terms
and conditions, such as being undated or subordinated,which qualify the debt issue for inclusion as capital underAPRA. Loan capital debt issues are recorded at cost oramortised cost.
Premiums, discounts and associated issueexpenses are amortised through profit each year from thedate of issue so that securities attain their redemptionvalues by maturity date. Interest is reflected in profit asincurred. Any profits or losses arising from redemptionprior to maturity are taken to profit in the period in whichthey are realised.
Further details of the Group’s loan capital debtissues are shown in Note 28.
(ff) Shareholders’ equityOrdinary share capital is the amount of paid up
capital from the issue of ordinary shares.Preference Share Capital is the amount of paid up
capital from the issue of preference shares.General reserve is derived from revenue profits and
is available for dividend except for undistributable profitsin respect of the Group’s life insurance businesses of$2,699 million, including the appraisal value uplift(2000: $1,944 million, 1999: $231 million).
Capital reserve is derived from capital profits and isavailable for dividend.
Share premium reserve was derived from thepremium over par value received from the issue ofshares. It was not available for distribution toshareholders in the form of a cash dividend. Followingchanges to the Corporation Law on 1 July 1998, shareshave no par value and the related Share PremiumReserve became part of share capital.
Dividend reinvestment plan reserve is appropriatedfrom revenue profits when the Bank is expecting to satisfythe dividend reinvestment by the issue of new shares.The amount of the reserve represents the estimate of theminimum expected amount that will be reinvested in theBank’s dividend reinvestment plan. The allotment ofshares under the plan is subsequently applied against thereserve. This accounting treatment reflects the probabilitythat a fairly stable proportion of the Bank’s final dividendwill be reinvested in equity via the dividend reinvestmentplan. No entry is passed to this reserve when the Bankhas determined to satisfy the dividend reinvestment by anon market purchase of existing shares.
Further details of share capital, outside equityinterests and reserves are shown in Notes 29, 30 andStatements of Changes in Shareholders’ Equity.
(gg) Derivative financial instrumentsThe Group enters into a significant volume of
derivative financial instruments which include foreignexchange contracts, forward rate agreements, futures,options and interest rate, currency, equity and creditswaps. Derivative financial instruments are used as partof the Group’s trading activities and to hedge certainassets and liabilities.
Derivative financial instruments held or issued fortrading purposesTraded derivative financial instruments are recorded
at net fair value based on quoted market prices, broker ordealer price quotations. A positive revaluation amount ofa contract is reported as an asset and a negativerevaluation amount of a contract as a liability. Changes innet fair value are reflected in profit immediately theyoccur.
Derivative financial instruments held or issued forpurposes other than tradingThe principal objective in holding or issuing
derivative financial instruments for purposes other thantrading is to manage balance sheet interest rate,exchange rate and credit risk associated with certainassets and liabilities such as loans, investment securities,deposits and debt issues. To be effective as hedges, thederivatives are identified and allocated against theunderlying hedged item or class of items and generallymodify the interest rate, exchange rate or creditcharacteristics of the hedged asset or liability. Suchderivative financial instruments are purchased with theintent of being held to maturity. Derivatives that aredesignated and effective as hedges are accounted for onthe same basis as the instruments they are hedging.
SwapsInterest rate swap receipts and payments are
accrued to profit as interest of the hedged item or class ofitems being hedged over the term for which the swap iseffective as a hedge of that designated item. Premiums ordiscounts to market interest rates which are received ormade in advance are deferred and amortised to profitover the term for which the swap is effective as a hedgeof the underlying hedged item or class of items.

Notes to the financial statements
59
NOTE 1 Summary of Significant Accounting Policies continuedSimilarly with cross currency swaps, interest rate
receipts and payments are brought to account on thesame basis outlined in the previous paragraph. Inaddition, the initial principal flows are reported net andrevalued to market at the current market exchange rate.Revaluation gains and losses are taken to profit againstrevaluation losses and gains of the underlying hedgeditem or class of items.
Credit default swaps are utilised to manage creditrisk in the asset portfolio. Premiums are accrued to profitand loss as interest of the hedged item or class of itemsbeing hedged over the term for which the instrument iseffective as a hedge. Any principal cash flow on default isbrought to account on the same basis as the designateditem being hedged. Credit default swaps held at balancedate are immaterial.
Equity swaps are utilised to manage the riskassociated with both the capital investment in equitiesand the related yield. These swaps enable the incomestream to be reflected in profit and loss when earned. Anycapital gain or loss at maturity of the swap is brought toaccount on the same basis as the underlying equity beinghedged.
Forward rate agreements and futuresRealised gains and losses on forward rate
agreements and futures contracts are deferred andincluded as part of the carrying value of the hedged itemor class of items being hedged. The cash flow isamortised to profit as interest of the hedged item or classof items being hedged over the term for which theinstrument is effective as a hedge.
OptionsWhere options are utilised in the management of
balance sheet risk, premiums on options and any realisedgains and losses on exercise are deferred and includedas part of the carrying value of the hedged item or classof items being hedged. The cash flows are amortised toprofit as interest of the hedged item or class of itemsbeing hedged over the term for which the instrument iseffective as a hedge.
Early terminationWhere a derivative instrument hedge is terminated
prior to its ‘maturity date’, realised gains and losses aredeferred and included as part of the carrying value of thehedged item or class of items being hedged.
The cash flows are amortised to profit as interest ofthe hedged item or class of items being hedged over theperiod for which the hedge would have been effective.Where the underlying hedged item or class of items beinghedged ceases to exist, the derivative instrument hedgeis terminated and realised and unamortised gains orlosses taken to profit and loss.
Further information on derivative financialinstruments is shown in Note 39.
(hh) Commitments to extend credit, letters of credit,guarantees, warranties and indemnities issuedThese financial instruments generally relate to
credit risk and attract fees in line with market prices forsimilar arrangements. They are not sold or traded. Theitems generally do not involve cash payments other thanin the event of default. The fee pricing is set as part of thebroader customer credit process and reflects theprobability of default. They are recorded as contingentliabilities at their face value. Further information is shownin Note 38.
(ii) Revenue recognitionRevenue is recognised to the extent that it is
probable that the economic benefits will flow to the entityand the revenue can be reliably measured. The principalsources of revenue are interest income and fees andcommissions.
Interest incomeInterest income is reflected in profit when earned on
an accrual basis. Further information is included in Notes1(k) Investment securities, 1(m) Loans, advances andother receivables and 1(n) Leasing and leveragedleasing.
Lending feesMaterial non refundable front end loan fees that are
yield related and do not represent cost recovery, aretaken to profit over the period of the loan. Associatedcosts incurred in these lending transactions are deferredand netted against yield related loan fees. Where nonrefundable front end loan fees are received that representcost recovery or charges for services not directly relatedto the yield on a loan, they are taken to income in theperiod in which they are received. Where fees arereceived on an ongoing basis and represent therecoupment of the costs of maintaining and administeringexisting loans, these fees are taken to income on anaccrual basis.
Commission and other feesWhen commission charges and fees relate to
specific transactions or events, they are recognised asincome in the period in which they are received.However, when they are charged for services providedover a period, they are taken to income on an accrualbasis.
Other incomeTrading income is brought to account when earned
based on changes in net fair value of financialinstruments and recorded from trade date. Furtherinformation is included in Notes 1(e) Foreign currencytransactions, 1(j) Trading securities and 1(gg) Derivativefinancial instruments. Life insurance business incomerecognition is explained in Note 1(jj) below.
(jj) Life Insurance BusinessThe Group’s life insurance business is accounted
for in accordance with the requirements of AccountingStandard AASB 1038: Life Insurance Business which issummarised below:(i) All assets, liabilities, revenues, expenses and equity
are included in the financial report irrespective ofwhether they are designated as relating topolicyholders or to shareholders.
(ii) All assets are measured at net market values.(iii) All liabilities are measured at net present values.
Policy liabilities are calculated in accordance withthe principles of Margin on Services (MoS) profitreporting as set out in Actuarial Standard AS 1.02:Valuation of Policy Liabilities issued by the LifeInsurance Actuarial Standards Board. OtherLiabilities are measured at net present value atreporting date.
(iv) Any life insurers within the Group that are parententities recognise and disclose any excess ordeficiency of the net market values of interests insubsidiaries over the net assets of thosesubsidiaries as an item in the financial report of thelife insurer economic entity.

COMMONWEALTH BANK OF AUSTRALIA AND CONTROLLED ENTITIES
Notes to the financial statements
60
NOTE 1 Summary of Significant Accounting Policies continued(v) Premiums and claims are separated on a product
basis into their revenue, expense and change inliability components unless the separation is notpracticable or the components cannot be reliablymeasured.
(vi) Returns on all investments controlled by a lifeinsurer entity in the Group are recognised asrevenues.
(vii) Participating benefits vested in relation to thefinancial year, other than transfers from unvestedpolicyholder benefits liabilities, are recognised asexpenses.
(viii) Reinsurance contracts taken are recognised ona gross basis.The Group conducts life insurance business
through Commonwealth Insurance Holdings Limited(CIHL), Commonwealth Life Limited (CLL) and TheColonial Mutual Life Assurance Society Limited (CMLA)in Australia, ASB Life Assurance Limited (ASB Life),Sovereign Assurance Company, Metropolitan LifeAssurance Company of NZ Limited and Colonial HoldingCompany No2 (NZ) Limited in New Zealand and severalsubsidiaries and joint ventures throughout Asia. CIHL,CMLA and ASB Life are the top tier life insurancecompanies within the life insurance corporate structureand they market value their interests in their controlledentities at each reporting date.
Accounting policies and disclosures specific to lifeinsurance business are required under AASB 1038.These are provided in this note and Notes 16, 20 and 34.
Premiums and Claims(i) Investment linked business
Premiums received, which are in the nature ofinvestment deposits, have the fee portion of thepremium recognised as revenue and the depositportion recognised as an increase in policyliabilities. Premiums with no due date arerecognised on a cash received basis. Fees earnedby the Shareholder for managing the funds investedare recognised as revenue. Claims underinvestment linked businesses represent withdrawalsof investment deposits and are recognised asa reduction in policy liabilities.
(ii) Non-investment linked businessPremiums received for providing services and
bearing risks are recognised as revenue. Premiumswith a regular due date are recognised as revenueon an accruals basis. Non-investment linked claimsare recognised as an expense when a liability hasbeen established.Market Value AccountingAll assets are valued at net market value (NMV)
and all liabilities at net present value at balance date.Consistent with the principles of market value accounting,movements in the net market value of assets and netpresent value of liabilities during the period areimmediately recognised in profit.
Life insurance investment assetsInvestments are measured at net market values at
balance date. Listed securities are valued at the priceruling at balance date. Where no quoted market exists,the Directors adopt various methods determined byinternal and external valuers. In these cases the valuesare deemed equivalent to net market value. Details ofparticular methods adopted are as follows:
� Valuation of the investment in the life insurancecontrolled entities is based on the appraisal value.The appraisal value comprises the present value offuture profits from in force business, the estimatedvalue of profits from future business and theshareholders interest in the net worth of the lifeinsurance Statutory and Shareholder Funds.
� Non life insurance controlled entities are valuedusing a discounted cash flow method applied toanticipated future income streams, allowing forassumptions about future sales growth,redemptions, expenses, investment returns and feemargins. This method allows the values socalculated to be expressed in the form of appraisalvalues, consistent with those calculated for the lifeinsurance controlled entities. Valuation of theinvestment in the non life insurance controlledentities is then based on these calculated appraisalvalues as at reporting date.
� Properties are valued annually by qualifiedindependent valuers.Excess of Net Market Value over Net Assets ofControlled EntitiesInterests in controlled entities held by the life
insurance companies are subject to revaluation eachperiod, such that the investment in the controlled entity isrecorded at market value.
On consolidation the investment in controlledentities is eliminated and the excess of market value ofcontrolled entities over their underlying net assets isseparately recognised in Intangible Assets (Note 20) onthe balance sheet as ‘Excess of Net Market Value overNet Tangible Assets of Life Insurance Controlled Entities’.This amount is assessed periodically as part of thevaluation of investments with changes in value taken toprofit. This excess does not require amortisation in thefinancial statements.
Life insurance policy liabilities and margin onservices profitPolicy liabilities are calculated in accordance with
the principles of Margin on Services (MoS) profit reportingas set out in Actuarial standard AS 1.02: Valuation ofPolicy Liabilities issued by the Life Insurance ActuarialStandards Board. Policy liabilities are calculated in a waywhich allows for the systematic release of planned profitmargins as services are provided to policyowners and therevenues relating to those services are received.Selected profit carriers including premiums andanticipated annuity payments are used to determine profitrecognition.
ProfitLife insurance business operating under this profit
recognition methodology can be analysed as follows:(i) Emergence of planned profit margins:
In setting premium rates, life insurers willinclude planned margins of revenues overexpenses. When the life insurer has performed theservices necessary to establish a valid claim tothose margins and has received the revenuesrelating to those services, the planned margins arerecognised in profit. Where actual experiencereplicates planned margin assumptions, theplanned profit margin will be released over the lifeof the policy.

Notes to the financial statements
61
NOTE 1 Summary of Significant Accounting Policies continued(ii) Difference between actual and planned experience:
Experience profits/(losses) are realised whereactual experience differs from the expectedperformance used to determine planned margins.Circumstances giving rise to experienceprofits/(losses) include experience variations inclaims, expenses, mortality, discontinuance andinvestment returns. For example, an experienceprofit will emerge when the expenses of maintainingall in force business in a year are lower than thoseallowed for in the planned margin.
(iii) Loss recognition on groups of related products orreversals of previously recognised losses:
Where future expenses for a group of relatedproducts exceeds future revenues, the anticipatedloss is recognised immediately. If unprofitablebusiness becomes profitable, previously recognisedlosses are reversed immediately.
(iv) Investment earnings on assets in excess of policyliabilities:
Investment assets are held in excess of thoserequired to meet policy liabilities. Investmentearnings are directly influenced by marketconditions and as such this component of profit willvary from year to year.Participating PoliciesPolicy liabilities attributable to participating policies
include the value of future planned shareholder profitmargins and an allowance for future supportablebonuses. The value of supportable bonuses and plannedshareholder profit margins account for all profit onparticipating policies based on best estimateassumptions.
Under Margin on Services profit recognitionmethodology, the value of supportable bonuses and theshareholder profit margin relating to a reporting year willemerge as planned profits in that year.
Policy Acquisition CostsPolicy acquisition costs include the fixed and
variable costs of acquiring new business. These costs areeffectively deferred through the determination of policyliabilities at the balance date to the extent that they aredeemed recoverable from premium or policy charges.Deferred acquisition costs are effectively amortised overthe life of the policy.
Changes in Accounting Policy (2000)The Group adopted the requirements of AASB 1038
for the first time from 1 July 1999. AASB 1038 prescribesthe methods to be used in the reporting of life insurancebusiness and establishes disclosure requirements withrespect to that business in the financial report. Thefollowing accounting policy changes were implemented:� The consolidated financial report includes the
financial statements of controlled life insurancesubsidiaries, comprising both shareholders andpolicyholders entitlements to assets, liabilities,revenues, and expenses. Adoption of AASB 1038increased total assets and total liabilities by$26.5 billion and $25.3 billion respectively.
� Revenue and expense items of life insurancebusinesses are consolidated on a line by line basisin the consolidated profit and loss statement. Initialadoption of AASB 1038 had no effect on reportedprofits as shareholders entitlements to profitsemerging from the Statutory Funds were recognisedin the Group’s consolidated financial report inprevious periods.
� The retained earnings and other reservesattributable to policyholders have been disclosed aspart of life insurance policy liabilities. Profitattributable to policyholders is included in ‘increasein policy liabilities’. This approach recognises theseparate entitlements of policyholders andshareholders in the Statutory Funds of lifeinsurance entities as required by the Life InsuranceAct 1995.
� Controlled entities of Life Insurance companies,under AASB 1038, are required to be valued at netmarket value. AASB 1038 requires the differencesbetween the net market value of the controlledentities and the underlying net assets to berecognised as the ‘excess’ of net market value overnet assets of life insurance controlled entities (the‘excess’) in the consolidated financial report.Several internal Group restructurings have occurredplacing certain life insurance and fundsmanagement controlled entities under insurancecompanies, namely Commonwealth InsuranceHoldings Limited (CIHL) and The Colonial MutualLife Assurance Society Limited (CMLA). The impactof the restructuring that occurred during the year to30 June 2000 was:- Initial adoption of AASB 1038 required
Commonwealth Life Limited (CLL) to be markedto market. The resultant excess of $432 millionwas taken directly to retained earnings asrequired under the standard.
- Various Colonial Group companies weretransferred into CMLA and this resulted in anincrease in the excess by $551 million at30 June 2000. This includes $212 milliontransferred from goodwill into excess.
- Transfer of Commonwealth Funds Managementbusinesses under CIHL resulting in an increasein the excess by $537 million at 30 June 2000.
- Alignment of the valuation bases of CLL withthose used for the Colonial Group resulted in anincrease in the excess by $536 million at30 June 2000.
Consistent with the principles of market valueaccounting, the excess is not amortised. The movementin the excess is recognised in the consolidated statementof financial performance.
The financial effect increased earnings per share by126 cents to 291 cents per share.
(kk) Loan SecuritisationThe Group conducts a loan securitisation program
through which it packages and sells loans as securities toinvestors. For its services to the program, the Groupreceives fees such as loan servicing, programmanagement and trustee fees on an arms length basis.Fee income is recognised in income on an accruals basisin relation to the period in which the costs of providingthese services are incurred.
Interest rate swaps and liquidity facilities areprovided at arms length to the program by the Group inaccordance with APRA Prudential Guidelines.
The Group is entitled to any residual income of theprogram after all payments due to investors and costs ofthe program have been met.

COMMONWEALTH BANK OF AUSTRALIA AND CONTROLLED ENTITIES
Notes to the financial statements
62
NOTE 1 Summary of Significant Accounting Policies continuedDue to the significant uncertainties inherent in
estimating the underlying loan repayment rates andinterest margins, future cash flows cannot be reliablymeasured. Therefore, no asset/liability or gain/loss onsale of the loans has been recognised. The residualincome is recognised in Other Income when receivable.Interest rates swaps are recognised in income on anaccruals basis.
(ll) Fiduciary activitiesThe Bank and designated controlled entities act as
Trustee and/or Manager and/or Custodian for a numberof Wholesale, Superannuation and Investment Funds,Trusts and Approved Deposit Funds. Further details areshown in Note 38.
The assets and liabilities of these Trusts and Fundsare not included in the consolidated financial statementsas the Bank does not have direct or indirect control of theTrusts and Funds as defined by AASB 1024.Commissions and fees earned in respect of the activitiesare included in the profit of the Group and the designatedcontrolled entity.
(mm)Superannuation plansThe Group sponsors a range of superannuation
plans for its employees. The assets and liabilities of theseplans are not included in the consolidated financialstatements.
The superannuation contributions expenseprincipally represents the annual funding, determinedafter having regard to actuarial advice, to provide forfuture obligations of defined benefit plans. Contributionsto all superannuation plans are made in accordance withthe rules of the plans.
(nn) Comparative figuresWhere necessary, comparative figures have been
adjusted to conform with changes in presentation in thesefinancial statements.
(oo) Definitions‘Overseas’ represents amounts booked in branches
and controlled entities outside Australia.Borrowing Corporation’ as defined by Section 9 of
the Corporations Act 2001 is CBFC Limited, ColonialFinance Limited and their controlled entities.
‘Net Fair Value’ represents the fair or market valueadjusted for transaction costs.
‘Cash Basis’ is defined as net profit after tax andbefore abnormal items adjusted for goodwill amortisationand life insurance and funds management appraisalvalue uplift.
(pp) Abnormal Items (2000)With the introduction of new accounting standard
AASB 1018: Statement of Financial Performance,abnormal items are no longer included in this statement.For comparative purposes the details of the Group’sabnormal items disclosed at 30 June 2000 are set outbelow:
$MRestructuring costs (Note 1(aa)) (106)Net market valuation of funds managementbusinesses (Note 1 (jj))
537
Change of valuation bases of Commonwealth Lifeinsurance businesses (Note 1 (jj))
536
Total Abnormal Gains Before Tax 967Abnormal tax credit items:Restructuring costs (Note 1 (aa)) 20Total Abnormal Gains After Tax 987

Notes to the financial statements
63
NOTE 2 Acquisition of ColonialOn 13 June 2000, pursuant to a Scheme of
Arrangement, the Group acquired a 100% interest inColonial Limited, a life insurance, funds management andbanking group. Under the scheme, Colonial ordinaryshareholders accepted 7 new Commonwealth Bankshares for every 20 Colonial ordinary shares held. Asa result, 351,409,450 new Commonwealth Bank shareswere issued and allotted to Colonial shareholders andoption holders, and $800 million paid to Colonial incomesecurity holders.
The assets acquired and the liabilities assumedwere initially measured at their fair values at 13 June2000, including adjustments to bring accounting policiesonto a consistent basis. Provisions for restructuringcovering the planned integration of the Colonialoperations into the existing Group and rationalisation ofexisting processing and administrative functions werebooked as a pre-acquisition cost in Colonial or asa charge in Commonwealth Bank, as applicable.
The principal costs associated with thisrestructuring are staff redundancy payments, propertyand rental break costs, systems costs and supplycontract renegotiation costs. The fair value adjustmentsprincipally relate to write off of capitalised systems costsand additional general provisioning to bring Colonial ontoa consistent provisioning methodology.
In the 12 months subsequent to acquisition furtherinformation has been obtained in respect of the initialestimated costs of restructuring and fair valueadjustments which has resulted in the following revisions.The revisions to costs associated with the restructuringprincipally relate to additional staff redundancy paymentsand information technology contract termination and datacentre relocation costs driven by more extensiveconsolidation of IT services to EDSA. The revisions to fairvalue adjustments principally relate to asset write downs,additional general provisioning and tax adjustments.
These revisions to the provision for restructuringand fair value adjustments result in an increase togoodwill on acquisition of $238 million.
2000$M
Consideration351,409,450 new Commonwealth Bankshares @ $26.39 9,274Income securities payout 800Transaction costs 46Preacquisition dividend received (1,000)Cost of Acquisition 9,120
Fair value of net tangible assets acquiredAs at 30 June 2000 1,303Revisions to fair value adjustments and restructuring costs provisioned (238)Revised as at 30 June 2001 1,065Outside equity interests in net assets acquired (155)Excess of net market value overnet assets of life insurance controlled entities 2,548Goodwill on acquisition 5,662
9,120
2001 Revision 2000$M $M $M
The fair value adjustmentscomprised:- Write off of capitalised costs 299 24 275- Doubtful debt provisioning
- general 170 50 120- specific 29 - 29
- Investments write down 43 43 -- Legal 15 15 -- Asset write off 26 26 -- Other 55 4 51
637 162 475Income tax benefit - fair valueadjustments (159) (11) (148)
478 151 327
Restructuring costs provisionedcomprised- Staff 119 33 86- Occupancy and equipment 93 3 90- Information technology
services 123 70 53- Other 104 39 65
439 145 294Income tax benefit -restructuring costs (108) (58) (50)
331 87 244
Fair value adjustments andrestructuring costs after tax 809 238 571

COMMONWEALTH BANK OF AUSTRALIA AND CONTROLLED ENTITIES
Notes to the financial statements
64
NOTE 2 Acquisition of Colonial continuedExcess of net market value over net tangible assetsof life insurance controlled entities.An internal group restructuring of Colonial’s life and
funds management businesses was completed in June2000, whereby all these businesses, except for someAsian businesses, were transferred to The ColonialMutual Life Assurance Society Limited (CMLA), a lifeinsurance controlled entity. These life and fundsmanagement businesses are valued at market value byCMLA. Consistent with the principles of market valueaccounting, as specified by AASB 1038: Life InsuranceBusiness, the above resulting excess of net market valueover net tangible assets of life insurance controlledentities is not amortised.
GoodwillThe goodwill emerging on the acquisition amounts
to $5,662 million and is amortised over a period of20 years, representing the assessed life of the ongoingbusiness. Cost and revenue synergies, planned onacquisition of Colonial, are being achieved from theintegration of the Commonwealth and Colonial lifeinsurance businesses.
Changes in the excess of net market value over netassets of life insurance controlled entities that are directlyattributable to progressive recognition of these cost andrevenue synergies as they are implemented have beenrecorded as a realisation of goodwill. Refer Note 20.
NOTE 3 Operating ProfitOperating profit before income tax has been determined as follows:
GROUP BANK2001 2000 1999 2001 2000
$M $M $M $M $M
Interest Income Loans 10,246 7,663 6,806 7,072 6,126 Other financial institutions 280 191 165 252 176 Cash and liquid assets 110 78 58 99 76 Trading securities 548 295 246 369 224 Investment securities 655 586 425 423 437 Dividends on redeemable preference shares 54 24 42 (44) (39) Controlled entities - - - 386 238 Other 7 5 3 3 1Total Interest Income 11,900 8,842 7,745 8,560 7,239
Interest Expense Deposits 5,042 3,773 3,353 3,547 3,136 Other financial institutions 328 297 207 323 235 Short term debt issues 902 671 393 191 188 Long term debt issues 759 171 106 412 151 Controlled entities - - - 431 316 Loan capital 374 210 155 342 204 Other 21 1 4 15 -Total Interest Expense 7,426 5,123 4,218 5,261 4,230Net Interest Income 4,474 3,719 3,527 3,299 3,009
Other Operating Income Lending fees 602 554 474 525 517 Commission and other fees 1,173 946 807 888 768 Trading income Foreign exchange earnings 222 146 155 195 130 Trading securities 140 105 66 121 91 Other financial instruments (incl derivatives) 64 60 52 62 60 Dividends - controlled entities - - - 385 182 - other 14 20 6 19 13 Net gain (loss) on investment securities 56 12 79 84 7 Net profit on sale of property, plant and equipment 25 13 24 26 14 Life insurance income (refer note 34) 1,268 326 157 - - Funds management income 701 143 97 - - General insurance premium income 107 103 94 - - Less general insurance claims paid (57) (55) (63) - - Other 35 47 49 267 223Total Other Operating Income 4,350 2,420 1,997 2,572 2,005Total Net Operating Income 8,824 6,139 5,524 5,871 5,014
Charge for Bad and Doubtful Debts (Note 13) General provisions 385 196 247 276 191Total Charge for Bad and Doubtful Debts 385 196 247 276 191

Notes to the financial statements
65
NOTE 3 Operating Profit continued GROUP BANK2001 2000 1999 2001 2000
$M $M $M $M $M
Staff Expenses Salaries and wages 2,061 1,498 1,406 1,498 1,330 Superannuation contributions 12 2 1 - - Provision for long service leave 47 38 42 50 37 Provisions for other employee entitlements (10) 6 - (16) 4 Payroll tax 99 75 77 79 72 Fringe benefits tax 48 33 34 38 32 Other staff expenses 103 53 44 23 35Total Staff Expenses 2,360 1,705 1,604 1,672 1,510Occupancy and Equipment Expenses Operating lease rentals 329 208 158 211 191 Depreciation Buildings 29 31 51 26 28 Leasehold improvements 45 28 26 26 26 Equipment 76 58 68 26 34 Repairs and maintenance 60 46 64 52 42 Other 65 66 88 51 50Total Occupancy and Equipment Expenses 604 437 455 392 371Information Technology Services Projects and development 205 186 145 129 169 Data processing 219 144 141 180 133 Desktop 152 103 90 131 102 Communications 172 138 129 123 130Total Information Technology Services 748 571 505 563 534Other Expenses Postage 108 81 76 83 75 Stationery 107 75 69 67 63 Fees and commissions 535 176 112 186 136 Other 708 362 249 335 262Total Other Expenses 1,458 694 506 671 536Total Operating Expenses 5,170 3,407 3,070 3,298 2,951
Revenue from Operating Activities
BankingInterest income 11,900 8,842 7,745 8,560 7,239Fee and commissions 1,775 1,500 1,281 1,413 1,285Trading income 426 311 273 378 281Dividends 14 20 6 404 195Proceeds from sale of property, plant and equipment 157 44 652 65 22Proceeds from sale of investment securities 28 17 146 84 7Other income 85 95 80 267 223
14,385 10,829 10,183 11,171 9,252Life Insurance and Funds ManagementLife insurance- premium and related income 958 337 236 - -- investment revenue 1,698 1,066 590 - -Funds management fee income 701 143 97 - -
3,357 1,546 923 - -Appraisal value uplift --recurrent basis 474 92 - - --change of valuation basis of Commonwealth Life Insurance businesses - 536 - - --corporate restructure of funds management business - 537 - - -
474 1,165 - - -Total revenue from ordinary activities 18,216 13,540 11,106 11,171 9,252
There were no sources of revenue from non operating activities.Recurrent Restructuring
Operating Expenses – Year Ended 30 June 2000 Basis(1) Charge Total
Staff 1,705 20 1,725Occupancy and equipment 437 3 440Information technology services 571 32 603Other 694 51 745
3,407 106 3,513(1) Recurrent excludes exceptional items.

COMMONWEALTH BANK OF AUSTRALIA AND CONTROLLED ENTITIES
Notes to the financial statements
66
NOTE 4 Average Balance Sheet and Related InterestThe table lists the major categories of interest
earning assets and interest bearing liabilities of the Grouptogether with the respective interest earned or paid andthe average interest rates for each of, 1999, 2000 and2001. Averages used are predominantly daily averages.The overseas component comprises overseas branches
of the Bank and overseas domiciled controlled entities.Overseas intergroup borrowings have been adjusted inthe interest spread and margin calculations to moreappropriately reflect the overseas cost of funds.Non-accrual loans are included in Interest Earning Assetsunder loans, advances and other receivables.
2001 2000 1999Average Interest Average Average Interest Average Average Interest AverageBalance Rate Balance Rate Balance Rate
$M $M % $M $M % $M $M %
Average Assets and Interest IncomeInterest Earning AssetsCash and liquid assetsAustralia 2,428 107 4.4 1,860 78 4.2 1,468 58 4.0Overseas 273 3 1.1 42 - - 119 - -Receivables due from other financialinstitutionsAustralia 2,658 159 6.0 1,839 112 6.1 1,481 79 5.3Overseas 1,595 121 7.6 1,307 79 6.0 1,522 86 5.7Deposits with regulatory authoritiesAustralia - - n/a - - n/a 892 - -Overseas 29 - - 6 - - 2 - -Trading securitiesAustralia 5,616 387 6.9 3,754 196 5.2 2,720 149 5.5Overseas 2,587 161 6.2 1,929 99 5.1 1,700 97 5.7Investment securitiesAustralia 3,244 242 7.5 4,082 260 6.4 3,052 171 5.6Overseas 6,268 413 6.6 5,331 326 6.1 4,659 254 5.5Loans, advances and other receivablesAustralia 118,917 8,983 7.6 94,913 6,701 7.1 83,350 5,899 7.1Overseas 16,992 1,317 7.8 14,100 986 7.0 13,306 949 7.1Other interest earning assets - 7 n/a - 5 n/a - 3 n/aIntragroup loansAustralia - - n/a - - n/a 414 23 5.6Overseas 3,198 191 6.0 2,825 168 5.9 - - n/aAverage interest earning assets andinterest income including intragroup 163,805 12,091 7.4 131,988 9,010 6.8 114,685 7,768 6.8Intragroup eliminations (3,198) (191) 6.0 (2,825) (168) 5.9 (414) (23) 5.6Total average interest earningassets and interest income 160,607 11,900 7.4 129,163 8,842 6.8 114,271 7,745 6.8Non Interest Earning AssetsBank acceptancesAustralia 12,074 10,533 9,971Overseas 109 21 32Life insurance investment assetsAustralia 26,580 9,732 -Overseas 3,062 240 -Property, plant and equipmentAustralia 1,024 755 1,240Overseas 240 187 211Other assetsAustralia 21,676 9,309 9,739Overseas 1,835 1,158 2,085Provisions for impairmentAustralia (1,493) (1,213) (1,210)Overseas (84) (174) (158)Total average non interestearning assets 65,023 30,548 21,910Total Average Assets 225,630 159,711 136,181Percentage of total average assetsapplicable to overseas operations 16.0% 15.0% 17.2%

Notes to the financial statements
67
NOTE 4 Average Balance Sheet and Related Interest continued
2001 2000 1999Average Interest Average Average Interest Average Average Interest AverageBalance Rate Balance Rate Balance Rate
$M $M % $M $M % $M $M %
Average Liabilities andInterest ExpenseInterest Bearing Liabilities andLoan CapitalTime DepositsAustralia 42,226 2,519 6.0 38,176 2,022 5.3 31,119 1,597 5.1Overseas 9,882 711 7.2 8,665 484 5.6 9,201 591 6.4Savings DepositsAustralia 27,835 603 2.2 25,248 460 1.8 24,378 418 1.7Overseas 2,027 83 4.1 2,017 67 3.3 2,120 81 3.8Other demand depositsAustralia 23,813 1,064 4.5 17,662 696 3.9 17,247 626 3.6Overseas 1,911 62 3.2 1,954 44 2.3 1,682 40 2.4Payables due to otherfinancial institutionsAustralia 1,271 65 5.1 961 56 5.8 643 35 5.4Overseas 4,238 263 6.2 3,718 241 6.5 3,367 172 5.1Debt issuesAustralia 17,130 1,099 6.4 7,615 413 5.4 7,689 395 5.1Overseas 9,965 562 5.6 7,655 429 5.6 2,938 104 3.5Loan capitalAustralia 5,564 367 6.6 3,336 204 6.1 2,746 155 5.6Overseas 116 7 6.0 68 6 8.8 - - n/aOther interest bearing liabilities - 21 n/a - 1 n/a - 4 n/aIntragroup borrowingsAustralia 3,198 191 6.0 2,825 168 5.9 - - n/aOverseas - - n/a - - n/a 414 23 5.6Average interest bearing liabilitiesand loan capital and interest expenseincluding intragroup 149,176 7,617 5.1 119,900 5,291 4.4 103,544 4,241 4.1Intragroup eliminations (3,198) (191) 6.0 (2,825) (168) 5.9 (414) (23) 5.6Total average interest bearingliabilities and loan capital andinterest expense 145,978 7,426 5.1 117,075 5,123 4.4 103,130 4,218 4.1Non Interest Bearing LiabilitiesDeposits not bearing interestAustralia 6,034 4,698 3,952Overseas 608 72 76Liability on acceptancesAustralia 12,077 10,533 9,971Overseas 109 21 32Life insurance policy liabilitiesAustralia 23,584 9,458 -Overseas 2,617 201 -Other liabilitiesAustralia 13,536 5,964 9,632Overseas 2,890 4,005 2,383Total average non interestbearing liabilities 61,455 34,952 26,046Total average liabilities and loan capital 207,433 152,027 129,176Shareholders’ equity 18,197 7,684 7,005Total average liabilities, loan capitaland shareholders’ equity 225,630 159,711 136,181Percentage of total average liabilitiesapplicable to overseas operations 16.6% 18.7% 16.9%

COMMONWEALTH BANK OF AUSTRALIA AND CONTROLLED ENTITIES
Notes to the financial statements
68
NOTE 4 Average Balance Sheet and Related Interest continued
30/06/01 vs 30/06/00 30/06/00 vs 30/06/99Changes in Net Interest Income:Volume and Rate Analysis Changes due to Changes due to
Volume Rate Total Volume Rate Total$M $M $M $M $M $M
Interest Earning AssetsCash and liquid assetsAustralia 24 5 29 16 4 20Overseas 1 2 3 - - -Receivables due from other financial institutionsAustralia 49 (2) 47 20 13 33Overseas 20 22 42 (13) 6 (7)Deposits with regulatory authoritiesAustralia - - - - - -Overseas - - - - - -Trading securitiesAustralia 113 79 192 55 (8) 47Overseas 37 25 62 12 (10) 2Investment securitiesAustralia (58) 41 (17) 62 27 89Overseas 59 29 88 39 33 72Loans, advances and other receivablesAustralia 1,752 548 2,300 817 (15) 802Overseas 213 121 334 56 (19) 37Other interest earning assets - 2 2 - 2 2Intragroup loansAustralia - - - - - -Overseas 22 1 24 139 6 145Change in interest income including intragroup 2,257 848 3,106 1,177 65 1,242Intragroup eliminations (22) (1) (24) (139) (6) (145)Change in interest income 2,238 844 3,082 1,014 83 1,097Interest Bearing Liabilities and Loan CapitalTime DepositsAustralia 228 275 503 368 57 425Overseas 78 150 228 (32) (75) (107)Savings DepositsAustralia 52 92 144 15 27 42Overseas - 16 16 (4) (10) (14)Other demand depositsAustralia 258 112 370 16 54 70Overseas (1) 19 18 6 (2) 4Payables due to otherfinancial institutionsAustralia 17 (8) 9 18 3 21Overseas 33 (10) 23 20 49 69Debt issuesAustralia 563 125 687 (4) 22 18Overseas 130 4 134 216 109 325Loan capitalAustralia 141 23 164 35 14 49Overseas 4 (3) 1 3 3 6Other interest bearing liabilities - 20 20 - (3) (3)Intragroup borrowingsAustralia 22 2 24 139 6 145Overseas - - - - - -Change in interest expense including intragroup 1,392 949 2,341 696 354 1,050Intragroup eliminations (22) (1) (24) (139) (6) (145)Change in interest expense 1,366 951 2,317 590 315 905Change in net interest income 872 (107) 765 424 (232) 192Change due to variation in time periods (10)

Notes to the financial statements
69
NOTE 4 Average Balance Sheet and Related Interest continued
Changes in Net Interest Income: Volume and Rate AnalysisThe preceding table shows the movement in
interest income and expense due to changes in volumeand changes in interest rates. Volume variances reflectthe change in interest from the prior period due tomovement in the average balance. Rate variance reflects
the change in interest from the prior year due to changesin interest rates.
Volume and rate variance for total interest earningassets and liabilities have been calculated separately(rather than being the sum of the individual categories).
GROUP2001 2000 1999
$M $M $M
Net interest income 4,474 3,719 3,527Average interest earning assets 160,607 129,163 114,271
Interest Margins and SpreadsInterest spread represents the difference between the average interest rate earned and the average interest rate paid
on funds.Interest margin represents net interest income as a percentage of average interest earning assets. The calculations for
Australia and Overseas include intragroup cross border loans/borrowings and associated interest.
% % %AustraliaInterest spread adjusted for interest forgone on non accrual and restructured loans (1) 2.56 2.71 3.00Interest forgone on non accrual and restructured loans - - (0.02)Interest Spread (2) 2.56 2.71 2.98Benefit of net free liabilities, provisions and equity (3) 0.43 0.42 0.39Australia Interest Margin (4) 2.99 3.13 3.37
OverseasInterest spread adjusted for interest forgone on non accrual and restructured loans (1) 1.06 1.24 1.45Interest forgone on non accrual and restructured loans - (0.02) (0.06)Interest Spread (2) 1.06 1.22 1.39Benefit of net free liabilities, provisions and equity (3) 0.55 0.30 0.38Overseas Interest Margin (4) 1.61 1.52 1.77
GroupInterest spread adjusted for interest forgone on non accrual and restructured loans (1) 2.32 2.48 2.71Interest forgone on non accrual and restructured loans - (0.01) (0.02)Interest Spread (2) 2.32 2.47 2.69Benefit of net free liabilities, provisions and equity (3) 0.46 0.41 0.40Group Interest Margin (4) 2.78 2.88 3.09
(1) Represents interest forgone on loans on which the Group earns no interest or interest at below market rates.(2) Difference between the average interest rate earned and the average interest rate paid on funds.(3) A portion of the Group’s interest earning assets is funded by net interest free liabilities and shareholders’ equity. The
benefit to the Group of these interest free funds is the amount it would cost to replace them at the average cost offunds.
(4) Net interest income divided by average interest earning assets for the period.

COMMONWEALTH BANK OF AUSTRALIA AND CONTROLLED ENTITIES
Notes to the financial statements
70
NOTE 5 Income Tax ExpenseIncome tax expense shown in the financial statements differs from the prima facie tax charge calculated at current
taxation rates on operating profit.GROUP BANK
2001 2000 1999 2001 2000$M $M $M $M $M
Operating profit from ordinary activities before income taxBanking 2,174 2,147 2,033 2,248 1,701Life insurance 988 1,341 99 - -Funds Management 243 50 28
3,405 3,538 2,160 2,248 1,701Prima facie income tax at 34% (30 June 2000 and prior 36%)Banking 739 773 732 764 612Life insurance 336 483 36 - -Funds Management 83 18 9 - -
1,158 1,274 777 764 612
Add (or deduct) permanent differences expressed ona tax effect basis:Current PeriodTax rate change 3 23 - (11) 38Specific provisions for offshore bad and doubtful debts not tax effected 8 (22) 1 7 (24)Taxation rebates (net of accruals) (35) (38) (27) (138) (75)Tax adjustment referable to policy holder income (1) 62 28 - - -Non assessable income - life insurance surplus (1) (43) (62) (36) - -Change in excess of net market value over net assets oflife insurance controlled entities (1) (161) (402) - - -Non deductible goodwill amortisation 115 21 17 17 14Non-assessable capital gains (38) - - (38) -Tax losses recognised (65) (11) (10) (64) (11)Employee share acquisition plan (8) (9) - (8) (9)Other 26 (3) (2) 38 40
(136) (475) (57) (197) (27)Prior PeriodsOther (29) 1 (6) (18) -Total income tax expense 993 800 714 549 585
Income tax attributable to operating profitBanking 705 739 704 549 585Life insurance 194 47 1 - -Funds management 94 14 9 - -
993 800 714 549 585
Income tax expense comprises:Current taxation provision 820 730 744 416 536Deferred income (benefit)/tax provision 193 137 (24) 184 128Future income tax benefit (35) (109) (34) (63) (115)Notional tax expense - leveraged leases 11 34 8 7 29Other 4 8 20 5 7Total Income Tax Expense 993 800 714 549 585The components of income tax expense consist of the following:Current Australia 765 677 710 416 535 Overseas 55 52 34 - -
820 729 744 416 535Deferred Australia 168 73 (46) 133 50 Overseas 5 (2) 16 - -
173 71 (30) 133 50
(1) The prima facie life insurance income tax of $336 million less these permanent differences equals the life insurance taxexpense of $194 million for 30 June 2001.

Notes to the financial statements
71
NOTE 5 Income Tax Expense continuedGROUP BANK
2001 2000 1999 2001 2000$M $M $M $M $M
The significant temporary differences are as follows:Deferred income tax assets arising from:Provisions not tax deductible until expense incurred 488 743 255 296 282Other 206 156 78 62 (45)Future income tax benefits (Note 21) 694 899 333 358 237Deferred income tax liabilities arising from:Leveraged leasing 108 383 461 71 139Lease financing 369 247 209 42 50Accelerated tax depreciation 12 28 41 8 28Other 613 541 222 256 147Total deferred income tax liabilities (Note 24) 1,102 1,199 933 377 364Future income tax benefits attributable to tax lossescarried forward as an asset - 181 - - -
Future income tax benefits not taken to accountValuation allowanceOpening balance 173 146 132 167 140Prior year adjustments (2) 7 (12) 4 7Benefits now taken to account (65) (11) (10) (64) (11)Benefits arising during the year not recognised 40 31 36 14 31Closing balance (Note 21) 146 173 146 121 167
NOTE 6 Dividends Provided For, Reserved or Paid
Ordinary SharesInterim ordinary dividend (fully franked) of 61 cents per share(2000: 58 cents, 1999: 49 cents) Provision for interim ordinary dividend - cash component only 642 405 275 642 405Declared final ordinary dividend (fully franked) of 75 cents per share(2000: 72 cents, 1999: 66 cents) Provision for final ordinary dividend - cash component only 765 708 472 765 708 Other provision 5 - - 5 -Preference Shares Provision for preference dividend 9 - - 9 -Dividends provided for payments in cash or paid 1,421 1,113 747 1,421 1,113Appropriations to Dividend Reinvestment Plan Reserve Interim ordinary dividend 131 118 183 131 118 Final ordinary dividend 168 200 133 168 200Dividends appropriated to Dividend Reinvestment Plan Reserve 299 318 316 299 318Total Dividends Provided for, Reserved or Paid 1,720 1,431 1,063 1,720 1,431
The Bank changed its dividend policy for the year ended 30 June 2000. The amount of dividend to be paid is nowbased on profit after tax before goodwill amortisation and appraisal value uplift. Previously it was based on profit after tax.
Dividend Franking AccountAfter fully franking the final dividend to be paid for
the year ended 30 June 2001 the amount of frankingcredits available as at 30 June 2001 to frank dividendsfor subsequent financial years is nil (30 June 2000:$450 million). The 30 June 2000 franking accountbalance was fully utilised by the March 2001 sharebuyback which was in part paid out of retained earnings.
This figure is based on the combined frankingaccounts of the Group at 30 June 2001 and has beenadjusted for franking credits that will arise from the
payment of income tax payable on profits of the yearended 30 June 2001, franking debits that will arise fromthe payment of dividends proposed as at 30 June 2001and franking credits that the Group may be preventedfrom distributing. The Bank expects that future taxpayments will generate sufficient franking credits for theBank to be able to continue to fully frank future dividendpayments. Dividend payments on or after 1 July 2001 willbe franked at the 30% tax rate.

COMMONWEALTH BANK OF AUSTRALIA AND CONTROLLED ENTITIES
Notes to the financial statements
72
NOTE 6 Dividends Provided For, Reserved or Paid continued
Dividend HistoryCents Half Year Full Year Full Year DRP DRP
Half Year Ended Per Payout Payout Payout Ratio Price ParticipationShare Ratio(1) Ratio(1) Cash Basis(2) $ Rate(3)
31 December 1998 49 64.3% - - 24.50 43.6%30 June 1999 66 85.3% 74.7% 72.4% 24.75 22.3% (4)
31 December 1999 58 62.3% - - 24.42 22.6%30 June 2000 72 48.8% 53.0% 85.3% 27.31 18.6%31 December 2000 61 68.2% - - 30.82 18.6%30 June 2001 75 74.0% 71.2% 75.5% - -
(1) Dividend Payout Ratio: dividends provided for, reserved or paid divided by earnings after abnormals.(2) Payout ratio based on net profit after tax before goodwill amortisation and appraisal value uplift.(3) DRP Participation Rate: the percentage of total issued share capital participating in the Dividend Reinvestment Plan.(4) The decline in the participation rate from 43.6% to 22.3% in 1999 was due to the introduction of the cap on the
participation in the DRP.
NOTE 7 Earnings Per ShareGROUP
2001 2000 1999c c c
Earnings Per Ordinary Share- Basic and Fully Diluted 190 291 153
$M $M $MReconciliation of earnings used in the calculation of earnings per shareOperating profit after income tax 2,412 2,738 1,446Less: Preference share dividend (9) - -Less: Outside equity interests (14) (38) (24)Earnings used in calculation of earnings per share 2,389 2,700 1,422
Number of SharesM M M
Weighted average number of ordinary shares usedin the calculation of earnings per share 1,260 927 927
Cash Basis Earnings Per Ordinary Share (basic and fully diluted) c c c- Before abnormal items (1) 179 181 159
(1) Abnormal income of net $987 million after tax was recorded in the year ended 30 June 2000.
NOTE 8 Cash and Liquid AssetsGROUP BANK
2001 2000 2001 2000$M $M $M $M
AustraliaNotes, coins and cash at bankers 850 944 830 680Money at short call 86 147 - -Securities purchased under agreements to resell 1,979 1,226 1,979 1,226Bills receivable and remittances in transit 282 189 282 189Total Australia 3,197 2,506 3,091 2,095
OverseasNotes, coins and cash at bankers 198 35 - -Money at short call 175 32 57 8Bills receivable and remittances in transit 1 2 - -Agreements to resell 138 - 138 -Total Overseas 512 69 195 8Total Cash and Liquid Assets 3,709 2,575 3,286 2,103

Notes to the financial statements
73
NOTE 9 Receivables from Other Financial InstitutionsGROUP BANK
2001 2000 2001 2000$M $M $M $M
Australia 2,858 4,159 2,724 3,697Overseas 1,764 995 1,071 632Total Receivables from Other Financial Institutions 4,622 5,154 3,795 4,329
NOTE 10 Trading Securities
AustraliaListed:Australian Public Securities Commonwealth and States 99 168 99 90 Local and semi-government 340 590 340 309Bills of exchange 1,588 2,771 1,588 1,444Other Securities 36 340 1,039 204Unlisted:Commercial paper 187 121 187 121Certificates of deposit 745 885 736 1,599Medium term notes 1,100 605 296 488Total Australia 4,095 (1) 5,480 4,285 4,255
OverseasListed:Government securities 356 20 5 17Eurobonds 617 322 617 322Bills of exchange 950 763 - -Other securities 53 77 53 77Unlisted:Commercial paper 375 349 - -Other securities 463 336 60 21Total Overseas 2,814 1,867 735 437Total Trading Securities 6,909 7,347 5,020 4,692
(1) This reduction reflects the run-off of the Colonial State Bank trading portfolio.

COMMONWEALTH BANK OF AUSTRALIA AND CONTROLLED ENTITIES
Notes to the financial statements
74
NOTE 11 Investment SecuritiesGROUP BANK
2001 2000 1999 2001 2000$M $M $M $M $M
AustraliaListedAustralian Public Securities Commonwealth and States 1,919 2,670 2,635 1,913 2,665Other securities and equity investments 354 285 282 349 278UnlistedBills of exchange 85 30 - - -Medium term notes 976 1,050 160 90 163Other securities and equity investments 2 111 70 - 25Total Australia 3,336 4,146 3,147 2,352 3,131
OverseasListedGovernment securities 252 287 234 252 287Treasury notes - - 5 - -Eurobonds 1,118 951 583 1,118 951Other securities 666 767 484 215 712Unlisted:Government securities 116 - 1 - -Treasury notes 6 5 - 6 5Certificates of deposit 1,417 1,181 1,228 1,417 1,181Eurobonds 212 141 317 212 141Medium term notes 174 171 27 174 171Commercial paper 29 159 228 29 159Floating rate notes 1,422 578 470 823 126Other securities and equity investments 957 763 463 275 305Total Overseas 6,369 5,003 4,040 4,521 4,038Total Investment Securities 9,705 9,149 7,187 6,873 7,169

Notes to the financial statements
75
NOTE 11 Investment Securities continuedGROUP
Market Value At 30 June2001 2000 1999
$M $M $M
Market ValueAustraliaAustralian Public Securities Commonwealth and States 1,926 2,672 2,637Bills of exchange 85 30 -Medium term notes 982 1,057 171Other securities and equity investment 463 407 333Total Australia 3,456 4,166 3,141
OverseasGovernment securities 379 295 243Treasury notes 6 5 5Certificates of deposit 1,416 1,181 1,236Eurobonds 1,343 1,094 924Medium Term Notes 172 153 20Floating rate notes 1,422 578 470Other securities and equity investments 1,627 1,677 1,157Total Overseas 6,365 4,983 4,055Total Investment Securities 9,821 9,149 7,196Net Unrealised Surplus/(Deficit) 116 - 9
Gross Unrealised Gains and Losses of GroupThe following table sets out the gross unrealised gains and losses of the Group’s Investment Securities.
At 30 June 2001 At 30 June 2000Amortised Gross Unrealised Fair Amortised Gross Unrealised Fair
Cost Gains Losses Value Cost Gains Losses Value$M $M $M $M $M $M $M $M
AustraliaAustralian Public Securities Commonwealth and States 1,919 24 17 1,926 2,670 13 11 2,672Bills of exchange 85 - - 85 30 - - 30Medium term notes 976 6 - 982 1,050 8 1 1,057Other securities andequity investments (1) 356 107 - 463 396 11 - 407Total Australia 3,336 137 17 3,456 4,146 32 12 4,166
OverseasGovernment securities 368 11 - 379 287 9 1 295Treasury notes 6 - - 6 5 - - 5Certificates of deposit 1,417 - 1 1,416 1,181 - - 1,181Eurobonds 1,330 43 30 1,343 1,092 40 38 1,094Medium term notes 174 1 3 172 171 - 18 153Floating rate notes 1,422 5 5 1,422 578 1 1 578Other securities andequity investments 1,652 8 33 1,627 1,689 20 32 1,677Total Overseas 6,369 68 72 6,365 5,003 70 90 4,983Total Investment Securities 9,705 205 89 9,821 9,149 102 102 9,149
Investment securities are carried at cost or amortised cost and are purchased with the intent of being held to maturity.The investment portfolio is managed in the context of the full balance sheet of the Bank.
(1) Equity derivatives are in place to hedge equity market risk in respect of structured equity products for customers. Thereare $107 million of net deferred losses on these contracts (2000: $11 million net deferred losses) which offset theabove unrealised gains and these are disclosed within Note 39. At the end of the financial year $21 million of netdeferred gains (2000: $71 million of deferred losses) are included in the amortised cost value.

COMMONWEALTH BANK OF AUSTRALIA AND CONTROLLED ENTITIES
Notes to the financial statements
76
NOTE 11 Investment Securities continued
Maturity Distribution and Average YieldThe table analyses the maturities and weighted average yields of the Group’s holdings of investment securities.
Maturity Period at 30 June 20011 to 12 months 1 to 5 years 5 to 10 years 10 years or more Total
$M % $M % $M % $M % $M
AustraliaAustralian Public Securities Commonwealth and States 90 5.91 717 5.76 1,112 6.32 - - 1,919Bank Bills 85 5.25 - - - - - - 85Medium Term Notes 20 6.35 956 13.17 - - - - 976Other securities, commercialpaper and equity investments 277 5.17 37 6.67 42 7.09 - - 356Total Australia 472 1,710 1,154 - 3,336
OverseasGovernment securities 116 17.81 174 3.86 78 1.15 - - 368Treasury Notes 6 1.99 - - - - - - 6Certificates of Deposit 1,417 4.21 - - - - - - 1,417Eurobonds 101 8.16 771 5.45 458 5.54 - - 1,330Medium Term Notes 35 6.52 139 5.75 - - - - 174Floating rate notes 59 5.36 598 5.27 607 5.07 158 5.19 1,422Other securities, commercialpaper and equity investments 717 5.30 625 5.32 241 5.41 69 5.77 1,652Total Overseas 2,451 2,307 1,384 227 6,369Total Investment Securities 2,923 4,017 2,538 227 9,705Maturities at Fair Value 3,022 3,899 2,674 226 9,821
Additional DisclosureProceeds at or close to maturity of investment
securities were $19,697 million (2000: $15,212 million,1999: $12,431 million).
Proceeds from sale of investment securities were$28 million (2000: $17 million, 1999: $146 million).
Realised capital gains were $3 million and realisedcapital losses were $1 million (2000: realised capitalgains $12 million, 1999: realised capital gains $85 millionand realised capital losses $6 million).

Notes to the financial statements
77
NOTE 12 Loans, Advances and Other ReceivablesGROUP BANK
2001 2000 2001 2000$M $M $M $M
AustraliaOverdrafts 2,785 2,816 2,785 2,435Housing loans 65,466 63,471 65,300 51,761Credit card outstandings 3,962 3,501 3,962 3,033Lease financing 4,497 4,863 (1) 2,421 1,706Bills discounted 1,556 991 1,556 991Term loans 40,650 40,281 (1) 34,604 27,779Redeemable preference share financing 306 641 6 50Equity participation in leveraged leases 1,536 1,659 543 617Other lending 1,301 1,708 785 942Total Australia 122,059 119,931 111,962 89,314
OverseasOverdrafts 1,304 1,080 - -Housing loans 8,045 7,266 55 65Credit card outstandings 232 208 - -Lease financing 256 228 94 73Term loans 6,790 6,837 2,390 2,703Other Lending 509 218 - -Total Overseas 17,136 15,837 2,539 2,841Gross Loans, Advances and Other Receivables 139,195 135,768 114,501 92,155
Less -Provisions for impairment (Note 13) General provision (1,399) (1,358) (1,240) (1,004) Specific provision against loans and advances (233) (431) (190) (175)Unearned income Term loans (643) (558) (64) - Lease financing (514) (691) (282) (226) Leveraged leases (186) (216) (22) (37)Interest reserved (68) (131) (60) (34)Unearned tax remissions on leveraged leases (93) (120) (9) (18)
(3,136) (3,505) (1,867) (1,494)Net Loans, Advances and Other Receivables 136,059 132,263 112,634 90,661
Lease receivables, net of unearned income(included above)Current 1,419 1,695 727 507Non current 2,820 3,407 1,505 1,046
4,239 5,102 2,232 1,553(1) Prior year figures have been adjusted to align with categories as at 30 June 2001 following the amalgamation of
Colonial operations and product systems.
Leasing arrangementsRetail Financial Services provides vehicle and
equipment lease finance to a broad range of industriesincluding transport, service, earthmoving, construction,manufacturing and mining. Most lease financearrangements are for terms between 3 and 5 years andrentals are generally payable monthly in advance.
Institutional Banking provides leasing services andhire purchase to corporate clients for a range ofequipment. They also arrange off balance sheet financefor large scale long life plant and equipment acrossdifferent tax jurisdictions.
GROUP BANK2001 2000 2001 2000
$M $M $M $M
Finance LeasesMinimum lease payments receivable:No later than one year 1,696 1,704 838 562Later than one year but not later than five years 2,786 3,276 1,506 1,179Later than five years 271 111 171 38Lease financing 4,753 5,091 2,515 1,779
Leverage LeasesMinimum lease payments receivable:No later than one year 246 119 221 67Later than one year but not later than five years 640 697 279 426Later than five years 650 843 43 124Equity participation in leveraged lease 1,536 1,659 543 617

COMMONWEALTH BANK OF AUSTRALIA AND CONTROLLED ENTITIES
Notes to the financial statements
78
NOTE 12 Loans, Advances and Other Receivables continued
Maturity Distribution of LoansThe following table sets forth the contractual maturity distribution of the Group’s loans, advances and other receivables
(excluding bank acceptances) at 30 June 2001.GROUP
Maturity Period at 30 June 2001Maturing
Maturing Between MaturingOne Year One & Five After Five
or Less Years Years Total$M $M $M $M
AustraliaGovernment and Public Authorities 385 757 513 1,655Agriculture, Forestry and Fishing 1,618 2,036 1,080 4,734Financial, Investment and Insurance 3,038 1,029 603 4,670Real Estate Mortgage (1) 933 13,711 50,822 65,466 Construction (2) 1,432 872 244 2,548Personal 4,076 6,317 183 10,576Lease Financing 2,497 3,508 623 6,628Other Commercial and Industrial 13,476 9,022 3,284 25,782Total Australia 27,455 37,252 57,352 122,059
OverseasGovernment and Public Authorities 21 138 6 165Agriculture, Forestry and Fishing 193 544 521 1,258Financial, Investment and Insurance 703 1,797 324 2,824Real Estate Mortgage (1) 1,277 2,795 3,973 8,045 Construction (2) 52 71 54 177Personal 332 45 63 440Lease Financing 146 - - 146Other Commercial and Industrial 1,944 972 1,165 4,081Total Overseas 4,668 6,362 6,106 17,136Gross Loans, Advances and Other Receivables 32,123 43,614 63,458 139,195
Interest Rate Sensitivity of Lending
Australia 21,029 19,731 35,738 76,498 Overseas 3,784 3,278 2,451 9,513Total Variable Interest Rates 24,813 23,009 38,189 86,011 Australia 6,426 17,521 21,614 45,561 Overseas 884 3,084 3,655 7,623Total Fixed Interest Rates 7,310 20,605 25,269 53,184Gross Loans, Advances and Other Receivables 32,123 43,614 63,458 139,195
(1) Principally owner occupied housing. While most of these loans would have a contractual term of 20 years or more, theactual average term of the portfolio is less than 5 years.
(2) Financing real estate and land development projects.

Notes to the financial statements
79
NOTE 13 Provisions For ImpairmentGROUP BANK
2001 2000 1999 1998 1997 2001 2000$M $M $M $M $M $M $M
Provisions for ImpairmentGeneral ProvisionsOpening balance 1,358 1,081 1,076 690 613 1,004 932Abnormal charge - - - 370 - - -Charge against profit 385 196 247 165 36 276 191Acquired provisions, including fair value adjustments 51 214 - - - 229 -Transfer to specific provisions (411) (140) (239) (155) - (291) (137)Bad debts recovered 88 54 51 48 80 54 45Adjustments for exchange rate fluctuations and other items (29) (3) (7) - 2 (6) 1
1,442 1,402 1,128 1,118 731 1,266 1,032Bad debts written off (43) (44) (47) (42) (41) (26) (28)Closing balance 1,399 1,358 1,081 1,076 690 1,240 1,004
Specific ProvisionsOpening balance 432 275 279 241 318 175 209Charge against profit New and increased provisions - - - 105 152 - - Write-back of provisions no longer required - - - (37) (90) - -Acquired provisions, including fair value adjustments 6 219 - - - 28 -Transfer from general provision for New and increased provisioning 495 236 284 175 - 312 208 Less write-back of provisions no longer required (84) (96) (45) (20) - (21) (71)Net transfer 411 140 239 155 - 291 137
Adjustments for exchange rate fluctuations and other items (17) 5 (8) (6) 6 21 (3)832 639 510 458 386 515 343
Bad debts written off (598) (207) (235) (179) (145) (325) (168)Closing balance 234 432 275 279 241 190 175Total Provisions for Impairment 1,633 1,790 1,356 1,355 931 1,430 1,179
Specific provisions for impairment comprise thefollowing segments:Provisions against loans and advances 233 431 275 279 241 190 175Provisions for diminution 1 1 - - - - -Total 234 432 275 279 241 190 175
% % % % % % %Provision Ratios (1)
Specific provisions for impairment as % of gross impairedassets net of interest reserved 36.06 43.03 46.69 37.60 30.24 36.19 34.93Total provisions for impairment as % of gross impairedassets net of interest reserved 251.62 178.29 230.22 182.61 116.81 272.38 235.14General provisions as % of risk weighted assets 1.01 1.06 1.09 1.14 0.79 0.94 0.92
$M $M $M $M $M $M $MCharge to profit and loss for bad and doubtful debtscomprises:General provisions 385 196 247 165 36 276 191Specific provisions - - - 68 62 - -Total Charge for Bad and Doubtful Debts 385 196 247 233 98 276 191
Ratio of net charge-offs during the period to Average 0.28% 0.16% 0.25% 0.26% 0.11% 0.27% 0.22%gross loans, advances and other receivablesoutstanding during the period
(1) Ratios have been restated for 1998 based on the amended definition of non accruals introduced with effect from31 December 1998.

COMMONWEALTH BANK OF AUSTRALIA AND CONTROLLED ENTITIES
Notes to the financial statements
80
NOTE 13 Provisions For Impairment continuedGROUP BANK
2001 2000 2001 2000$M $M $M $M
Total charge for bad and doubtful debts 385 196 276 191
The charge is required for
Specific Provisioning New and increased provisioning 495 236 312 208 Less provisions no longer required (84) (96) (21) (71)Net specific provisioning 411 140 291 137Provided from general provision (411) (140) (291) (137)Charge to profit and loss - - - -
General Provisioning Direct write offs 35 34 26 28 Recoveries of amounts previously written off (88) (54) (54) (45) Movement in general provision 27 76 13 71 Funding of specific provisions 411 140 291 137Charge to profit and loss 385 196 276 191Total Charge for Bad and Doubtful Debts 385 196 276 191
Specific Provisions for Impairment by Industry CategoryThe following table sets forth the Group’s specific provisions for impairment by industry category as at 30 June 1997,
1998, 1999, 2000 and 2001.
At 30 June2001 2000 1999 1998 1997
$M $M $M $M $M
AustraliaGovernment andPublic Authorities - - - - -Agriculture, Forestryand Fishing 8 35 15 20 21Financial, Investmentand Insurance 24 23 23 16 22Real Estate Mortgage (1) 4 8 4 3 4 Construction (2) 6 6 35 8 11Personal 28 17 15 14 12Lease Financing 7 6 4 - -Other Commercialand Industrial 77 110 82 113 152Total Australia 154 205 178 174 222
OverseasGovernment andPublic Authorities 15 13 - - -Agriculture, Forestryand Fishing - - - 1 1Financial, Investmentand Insurance 4 1 - - 2Real Estate Mortgage (1) 7 3 3 5 - Construction (2) - - - 10 -Personal 3 69 2 - -Lease Financing - - - - -Other Commercialand Industrial 51 141 92 89 16Total Overseas 80 227 97 105 19Total Specific Provisions 234 432 275 279 241
(1) Principally owner occupied housing.(2) Financing real estate and land development projects.

Notes to the financial statements
81
NOTE 13 Provisions For Impairment continued
Bad Debts Written Off by Industry CategoryThe following table sets forth the Group’s bad debts written-off and bad debts recovered for Financial Years 1997,
1998, 1999, 2000 and 2001.Year ended 30 June
2001 2000 1999 1998 1997$M $M $M $M $M
AustraliaGovernment andPublic Authorities - - - - -Agriculture, Forestryand Fishing 10 6 7 9 15Financial, Investmentand Insurance 1 2 4 4 4Real Estate Mortgage (1) 10 8 9 11 9 Construction (2) 14 24 7 6 14Personal 142 104 94 86 58Lease Financing 16 11 11 6 5Other Commercialand Industrial 301 90 71 79 69Total Australia 494 245 203 201 174
OverseasGovernment andPublic Authorities - - - - -Agriculture, Forestryand Fishing - - - - -Financial, Investmentand Insurance 6 - - 3 -Real Estate Mortgage (1) 1 1 1 1 1 Construction (2) - - 14 - 2Personal 38 4 - 6 3Lease Financing - - 3 - -Other Commercialand Industrial 102 1 61 10 6Total Overseas 147 6 79 20 12
Gross Bad Debts Written Off 641 251 282 221 186
Bad Debts RecoveredAustralia 59 46 48 46 63Overseas 29 8 3 2 17 Bad Debts Recovered 88 54 51 48 80Net Bad Debts Written Off 553 197 231 173 106
(1) Principally owner occupied housing.(2) Financing real estate and land development projects.

COMMONWEALTH BANK OF AUSTRALIA AND CONTROLLED ENTITIES
Notes to the financial statements
82
NOTE 13 Provisions For Impairment continued
Bad Debts Recovered by Industry CategoryThe following table sets forth the Group’s bad debts recovered by industry category for Financial Years 1997, 1998,
1999, 2000 and 2001.
Year ended 30 June2001 2000 1999 1998 1997
$M $M $M $M $M
AustraliaGovernment andPublic Authorities - - - - -Agriculture, Forestryand Fishing - 2 2 4 5Financial, Investmentand Insurance 9 1 2 6 8Real Estate Mortgage (1) 1 1 - - - Construction (2) 1 2 1 1 1Personal 30 28 27 21 16Lease Financing 1 2 2 2 2Other Commercialand Industrial 17 10 14 12 31Total Australia 59 46 48 46 63
OverseasGovernment andPublic Authorities - - - - -Agriculture, Forestryand Fishing - - - - -Financial, Investmentand Insurance - 2 - - 2Real Estate Mortgage (1) - - - - - Construction (2) 1 1 - - 2Personal 3 3 3 2 1Lease Financing - - - - -Other Commercialand Industrial 25 2 - - 12Total Overseas 29 8 3 2 17
Bad Debts Recovered 88 54 51 48 80
(1) Principally owner occupied housing.(2) Financing real estate and land development projects.

Notes to the financial statements
83
NOTE 14 Credit Risk Concentrations
Management of the Credit BusinessThe Group has clearly defined credit policies for the
approval and management of credit risk. Creditunderwriting standards, which incorporateincome/repayment capacity, acceptable terms andsecurity and loan documentation tests exist for allproducts.
The Group relies, in the first instance, on theassessed integrity and ability of the debtor orcounterparty to meet its contracted financial obligationsfor repayment. Collateral security, in the form of realproperty or a floating charge is generally taken forbusiness credit except for major government, bank andcorporate counterparties of strong financial standing.Longer term consumer finance is generally securedagainst real estate while short term revolving consumercredit is generally unsecured.
The credit risk portfolio is divided into twosegments, statistically managed and credit risk ratedmanaged.
Statistically managed exposures generally compriseconsumer facilities of less than $250,000. Statisticallymanaged exposures are generally not individuallyreviewed unless arrears occur. Statistically managedportfolios are reviewed by business unit Credit Supportand Monitoring Units with an overview by the Risk AssetReview unit.
Facilities in the statistically managed segmentbecome classified for remedial management bycentralised units based on arrears status. Impairedassets in this segment are those ‘classified’ facilitieswhich are not well secured and past due 180 days ormore. Most of these facilities are written off immediatelyon becoming past due 180 days or more.
Credit risk rated managed exposures generallycomprise business and corporate exposures, includingbank and government exposures. Credit risk ratedmanaged exposures are required to be reviewed at leastannually. The risk rated segment is subject to inspectionby the Risk Asset Review unit, which is independent ofthe business units and which reports quarterly on itsfindings to the Board Risk Committee.
Most risk rated portfolios are reviewed on a randombasis, usually within a period of twenty four months, bythe Risk Asset Review unit. High risk portfolios arereviewed more frequently. Credit processes, includingcompliance with policy and underwriting standards, andapplication of risk ratings, are examined and reported onwhere cases of non compliance are observed.
Facilities in the credit risk rated managed segmentbecome classified for remedial management bycentralised units based on assessment in the risk ratingsystem, which for each exposure makes an assessmentof the risk of default, and then the risk of loss if defaultshould occur. These facilities are generally thoseclassified as troublesome (which equate to the APRAclassifications of special mention and substandard) andimpaired assets. Impaired assets in this segment arethose classified’ facilities where either a specific provisionfor impairment has been raised, the facility is maintainedon a cash basis, a loss of principal or interest isanticipated, facilities have been restructured or otherassets have been accepted in satisfaction of anoutstanding debt. Loans are generally classified asnon-accrual when receivership, insolvency or bankruptcyoccurs. Provisions for impairment are raised for anamount equal to the difference between the exposure andthe estimated realisable market value of the security netof estimated realisation costs.
A centralised exposure management systemrecords all significant credit risks borne by the Group.
The Risk Committee of the Board operates undera charter of the Board in terms of which the Committeeoversees the Bank’s credit management policies andpractices. The Committee usually meets every twomonths, and more often if required.
The Group uses a portfolio approach to themanagement of its credit risk. A key element is a welldiversified portfolio. The Group is using various portfoliomanagement tools to assist in diversifying the creditportfolio. The Bank is involved in credit derivativetransactions, has purchased various assets in the marketand has carried out various asset securitisations anda Collateralised Loan Obligation issue.

COMMONWEALTH BANK OF AUSTRALIA AND CONTROLLED ENTITIES
Notes to the financial statements
84
NOTE 14 Credit Risk Concentrations continued
Total Gross Credit Risk by IndustryThe following table sets out the Group’s Total Gross Credit Risk by industry as at 30 June 1997, 1998, 1999, 2000 and
2001. The industry profile of the loans, advances and other receivables content for the five financial years to 30 June 2001is shown on page 89.
At 30 June2001 2000 1999 1998 1997
$M $M $M $M $M
IndustryAustraliaGovernment and Public Authorities 6,012 6,195 6,162 5,200 6,686Agriculture, Forestry and Fishing 6,308 6,141 5,303 4,791 3,743Financial, Investment and Insurance 22,490 20,908 15,430 17,654 14,878Real Estate Mortgage 73,800 63,696 49,150 41,231 37,498 Construction 4,547 4,205 3,830 2,790 2,705Personal 10,979 12,911 10,688 8,659 7,183Lease Financing 6,628 6,937 3,100 1,940 4,277Other Commercial and Industrial 42,893 47,297 34,955 34,145 29,116Total Australia 173,657 168,290 128,618 116,410 106,086
OverseasGovernment and Public Authorities 385 1,152 493 819 1,048Agriculture, Forestry and Fishing 1,564 1,017 833 640 595Financial, Investment and Insurance 11,897 8,008 5,631 7,012 7,147Real Estate Mortgage 8,085 7,268 7,152 6,275 5,983 Construction 198 152 579 505 166Personal 449 1,487 542 290 412Lease Financing 146 217 191 173 -Other Commercial and Industrial 10,359 10,300 7,945 8,091 6,759Total Overseas 33,083 29,601 23,366 23,805 22,110Total Gross Credit Risk 206,740 197,891 151,984 140,215 128,196Less unearned income (1,343) (1,465) (1,169) (1,193) (1,019)Total Credit Risk 205,397 196,426 150,815 139,022 127,177
Charge for Bad and Doubtful Debts 385 196 247 233 98Loss Rate (1) 0.19 0.11 0.16 0.17 0.08
(1) The loss rate is the charge as a percentage of the credit risk.
The Group has a well diversified credit portfolio in Australia of good quality, with 42% of the exposure in mortgageloans and a further 13% to finance, investment and insurance (primarily banks). 16% of exposure is overseas, of which 24%is in mortgage loans. Overall over 60% of individually rated exposures in the commercial portfolio (including government andfinance) are of investment grade or equivalent quality.

Notes to the financial statements
85
NOTE 14 Credit Risk Concentrations continuedThe following tables set out the credit risk concentrations of the Group.
Risk Concentration of the Group By Asset Class 30 June 2001Loans
Advances BankIndustry Trading Investment and Other Acceptances Contingent
Securities Securities Receivables of Customers Liabilities Derivatives Total$M $M $M $M $M $M $M
AustraliaGovernment and Public Authorities 439 2,837 1,655 295 618 168 6,012Agriculture, Forestry and Fishing - - 4,734 1,384 105 85 6,308Financial, Investment and Insurance 2,397 86 4,670 2,929 3,512 6,038 19,632Real Estate Mortgage - - 65,466 137 8,197 - 73,800 Construction - - 2,548 1,191 648 160 4,547Personal - - 10,576 167 229 7 10,979Lease Financing 6,628 6,628Other Commercial and Industrial 1,259 413 25,782 5,858 6,306 3,275 42,893Total Australia 4,095 3,336 122,059 11,961 19,615 9,733 170,799
OverseasGovernment and Public Authorities 45 142 165 - 32 1 385Agriculture, Forestry and Fishing - - 1,258 - 306 - 1,564Financial, Investment and Insurance 1,820 2,512 2,824 17 803 2,096 10,072Real Estate Mortgage - - 8,045 - 40 - 8,085 Construction - - 177 - 21 - 198Personal - - 440 - 9 - 449Lease Financing - - 146 - - - 146Other Commercial and Industrial 949 3,715 4,081 97 1,411 106 10,359Total Overseas 2,814 6,369 17,136 114 2,622 2,203 31,258Gross Balances 6,909 9,705 139,195 12,075 22,237 11,936 202,057Other Risk Concentrations Receivables due from other financial institutions 4,622 Deposits with regulatory authorities 61Total Gross Credit Risk 206,740
Risk concentrations for contingent liabilities and derivatives are based on the credit equivalent balance in Note 38,Contingent Liabilities and Note 39, Market Risk respectively.

COMMONWEALTH BANK OF AUSTRALIA AND CONTROLLED ENTITIES
Notes to the financial statements
86
NOTE 14 Credit Risk Concentrations continued
Risk Concentration of the Group by Asset Class 30 June 2000Loans
Advances BankIndustry Trading Investment and Other Acceptances Contingent
Securities Securities Receivables of Customers Liabilities Derivatives Total$M $M $M $M $M $M $M
AustraliaGovernment and Public Authorities 857 2,674 1,681 376 144 463 6,195Agriculture, Forestry and Fishing - - 4,686 1,113 151 191 6,141Financial, Investment and Insurance 2,380 125 5,167 2,633 1,868 4,576 16,749Real Estate Mortgage - - 63,471 117 108 - 63,696 Construction - - 2,627 962 532 84 4,205Personal - - 11,759 189 962 1 12,911Lease Financing - - 6,937 - - - 6,937Other Commercial and Industrial 2,243 1,347 23,603 5,717 11,197 3,190 47,297Total Australia 5,480 4,146 119,931 11,107 14,962 8,505 164,131
OverseasGovernment and Public Authorities 351 290 204 - 304 3 1,152Agriculture, Forestry and Fishing 21 - 996 - - - 1,017Financial, Investment and Insurance 935 1,561 2,278 - 598 1,595 6,967Real Estate Mortgage - - 7,266 - 2 - 7,268 Construction - - 152 - - - 152Personal 16 - 1,470 - 1 - 1,487Lease Financing - - 217 - - - 217Other Commercial and Industrial 544 3,152 3,254 - 3,171 179 10,300Total Overseas 1,867 5,003 15,837 - 4,076 1,777 28,560Gross Balances 7,347 9,149 135,768 11,107 19,038 10,282 192,691Other Risk Concentrations Receivables due from other financial institutions 5,154 Deposits with regulatory authorities 46Total Gross Credit Risk 197,891

Notes to the financial statements
87
NOTE 14 Credit Risk Concentrations continued
Risk Concentration of the Group’s Impaired Assets 30 June 2001Total Impaired Provisions for Net
Industry Risk Assets Impairment Write offs Recoveries Write offs$M $M $M $M $M $M
AustraliaGovernment and Public Authorities 6,012 - - - - -Agriculture, Forestry and Fishing 6,308 68 8 10 - 10Financial, Investment and Insurance 19,632 69 24 1 (9) (8)Real Estate Mortgage 73,800 - 4 10 (1) 9 Construction 4,547 23 6 14 (1) 13Personal 10,979 14 28 142 (30) 112Lease Financing 6,628 13 7 16 (1) 15Other Commercial and Industrial 42,893 332 77 301 (17) 284Total Australia 170,799 519 154 494 (59) 435
OverseasGovernment and Public Authorities 385 62 15 - - -Agriculture, Forestry and Fishing 1,564 - - - - -Financial, Investment and Insurance 10,072 14 4 6 - 6Real Estate Mortgage 8,085 - 7 1 - 1 Construction 198 - - - (1) (1)Personal 449 1 3 38 (3) 35Lease Financing 146 - - - - -Other Commercial and Industrial 10,359 121 51 102 (25) 77Total Overseas 31,258 198 80 147 (29) 118Gross Balances 202,057 717 234 641 (88) 553Receivables due from other financialinstitutions 4,622Deposits with regulatory authorities 61Total Gross Credit Risk 206,740

COMMONWEALTH BANK OF AUSTRALIA AND CONTROLLED ENTITIES
Notes to the financial statements
88
NOTE 14 Credit Risk Concentrations continued
Risk Concentration of the Group’s Impaired Assets 30 June 2000Total Impaired Provisions for Net
Industry Risk Assets Impairment Write offs Recoveries Write offs$M $M $M $M $M $M
AustraliaGovernment and Public Authorities 6,195 - - - - -Agriculture, Forestry and Fishing 6,141 101 35 6 (2) 4Financial, Investment and Insurance 16,749 53 23 2 (1) 1Real Estate Mortgage 63,696 37 8 8 (1) 7 Construction 4,205 60 6 24 (2) 22Personal 12,911 10 17 104 (28) 76Lease Financing 6,937 18 6 11 (2) 9Other Commercial and Industrial 47,297 445 110 90 (10) 80Total Australia 164,131 724 205 245 (46) 199
OverseasGovernment and Public Authorities 1,152 55 13 - - -Agriculture, Forestry and Fishing 1,017 1 - - - -Financial, Investment and Insurance 6,967 85 1 - (2) (2)Real Estate Mortgage 7,268 - 3 1 - 1 Construction 152 - - - (1) (1)Personal 1,487 53 69 4 (3) 1Lease Financing 217 - - - - -Other Commercial and Industrial 10,300 217 141 1 (2) (1)Total Overseas 28,560 411 227 6 (8) (2)Gross Balances 192,691 1,135 432 251 (54) 197Receivables due from other financialinstitutions 5,154Deposits with regulatory authorities 46Total Gross Credit Risk 197,891
Large ExposuresConcentration of exposure to any debtor or
counterparty is controlled by the Large Credit ExposurePolicy. All exposures outside the policy are approved bythe Board Risk Committee.
The following table shows the aggregate number ofthe Group’s corporate exposures (including direct andcontingent exposure) which individually were greater than5% of the Group’s capital resources (Tier 1 and Tier 2capital):
2001 2000 1999 1998 1997Number Number Number Number Number
10% to less than 15% of Group's capital resources - - 1 1 15% to less than 10% of Group's capital resources 2 1 7 7 4

Notes to the financial statements
89
NOTE 14 Credit Risk Concentrations continued
Credit Portfolio
Industry ProfileThe following table sets forth the distribution of the Group’s loans, advances and other receivables (excluding bank
acceptances) classified by industry category at 30 June 1997, 1998, 1999, 2000 and 2001.
At 30 June2001 2000 1999 1998 1997
$M $M $M $M $M
AustraliaGovernment andPublic Authorities 1,655 1,681 1,727 1,216 1,955Agriculture, Forestryand Fishing 4,734 4,686 4,203 4,128 3,185Financial, Investmentand Insurance 4,670 5,167 4,048 2,490 1,859Real Estate Mortgage (1) 65,466 63,471 45,495 41,137 37,400 Construction (2) 2,548 2,627 2,105 1,197 1,138Personal 10,576 11,759 10,144 8,360 6,863Lease Financing 6,628 6,937 3,100 1,940 4,277Other Commercialand Industrial 25,782 23,603 20,253 19,559 16,044Total Australia 122,059 119,931 91,075 80,027 72,721
OverseasGovernment andPublic Authorities 165 204 157 105 28Agriculture, Forestryand Fishing 1,258 996 833 640 547Financial, Investmentand Insurance 2,824 2,278 1,507 1,449 1,494Real Estate Mortgage (1) 8,045 7,266 7,151 6,273 5,983 Construction (2) 177 152 427 318 151Personal 440 1,470 539 248 397Lease Financing 146 217 191 173 -Other Commercialand Industrial 4,081 3,254 2,686 3,342 2,469Total Overseas 17,136 15,837 13,491 12,548 11,069Gross Loans, Advancesand Other Receivables 139,195 135,768 104,566 92,575 83,790Provisions for badand doubtful debts,unearned income,interest reservedand unearned taxremissions onleverage leases (3,136) (3,504) (2,729) (2,759) (2,158)Net Loans, Advancesand Other Receivables 136,059 132,264 101,837 89,816 81,632
(1) Principally owner occupied housing.(2) Financing real estate and land development projects.

COMMONWEALTH BANK OF AUSTRALIA AND CONTROLLED ENTITIES
Notes to the financial statements
90
NOTE 15 Asset Quality
Impaired AssetsThe Group adopted the Australian disclosure
requirements for Impaired Assets contained inAASB 1032: Specific Disclosures by Financial Institutionswith effect from Financial Year 1997.
There are three classifications of Impaired Assets:(a) Non accruals, comprising:
� any credit risk facility against which a specificprovision for impairment has been raised;
� any credit risk facility maintained on a cashbasis because of significant deterioration inthe financial position of the borrower; and
� any credit risk facility where loss of principal orinterest is anticipated.
At 31 December 1998 the definition of non accrualswas amended to align more closely with APRA (formerlyRBA) guidelines and industry practice. When a client isexperiencing difficulties the account is classified as a nonaccrual only where a loss is expected, taking into accountthe level of security held. To provide comparableprovisioning and asset quality ratios impaired assets at30 June 1998 have been disclosed under the amendeddefinition.
All interest charged in the relevant financial periodthat has not been received in cash is reversed from profitand loss when facilities become classified as non accrual.Interest on these facilities is then only taken to profit ifreceived in cash.(b) Restructured Facilities
Credit risk facilities on which the original contractualterms have been modified due to financialdifficulties of the borrower. Interest on thesefacilities is taken to profit and loss. Failure to complyfully with the modified terms will result in immediatereclassification to non accrual.
(c) Assets Acquired Through Security Enforcement(AATSE), comprising:� Other Real Estate Owned (OREO),
comprising real estate where the Bank hasassumed ownership or foreclosed insettlement of a debt; and
� Other Assets Acquired Through SecurityEnforcement (OAATSE), comprising assetsother than real estate where the Bank hasassumed ownership or foreclosed insettlement of a debt.
GROUP2001 2000 1999
% % %
Impaired Asset RatiosGross impaired assets net of interest reserved as % ofcredit risk net of unearned income 0.32 0.51 0.39Net impaired assets as % of: Risk weighted assets 0.30 0.44 0.32 Total shareholders’ equity 2.09 3.10 4.52
Accounting by Creditors for Impairment of Loans(US GAAP definitions) Year ended 30 June
2001 2000 1999 (1)
$M $M $M
Impaired Loans (non accrual) 699 1,123 636
Impaired Loans with allowance for credit losses 514 760 505 - allowance for credit losses 203 411 255
Impaired Loans with no allowance for credit loss 185 363 131
Average investment in Impaired Loans 911 880 778
Income recognised on Impaired Loans 51 51 (1) 33 (1)
(1) Excluding Colonial

Notes to the financial statements
91
NOTE 15 Asset Quality continued
Impaired AssetsThe following table sets forth the Group’s impaired assets as at 30 June 1997, 1998, 1999, 2000 and 2001.
At 30 June2001 2000 1999 1998(1) 1997
$M $M $M $M $M
AustraliaNon-accrual loans: Gross balances 518 722 495 616 831 Less interest reserved (63) (128) (66) (85) (100) Gross balance (net of interest reserved) 455 594 429 531 731 Less provisions for impairment (154) (205) (178) (174) (222) Net non-accrual loans 301 389 251 357 509
Restructured loans: Gross balances 1 1 1 - - Less interest reserved - - - - - Gross balance (net of interest reserved) 1 1 1 - - Less specific provisions - - - - - Net restructured loans 1 1 1 - -
Assets Acquired Through SecurityEnforcement (AATSE): Gross balances - 1 - - - Less provisions for impairment - - - - - Net AATSE - 1 - - - Net Australian impaired assets 302 391 252 357 509
OverseasNon-accrual loans: Gross balances 197 410 147 310 75 Less interest reserved (5) (3) (2) (17) (9) Gross balance (net of interest reserved) 192 407 145 293 66 Less provisions for impairment (79) (226) (97) (105) (19) Net non-accrual loans 113 181 48 188 47
Restructured loans: Gross balances - - - - - Less interest reserved - - - - - Gross balance (net of interest reserved) - - - - - Less specific provisions - - - - - Net restructured loans - - - - -
Asset Acquired ThroughSecurity Enforcement 1 1 14 - - Less provisions for impairment (1) (1) - - - Net AATSE - - 14 - - Net overseas impaired assets 113 181 62 188 47Total net impaired assets 415 572 314 545 556
(1) Under revised definition of non accrual assets introduced 31 December 1998 net impaired assets at 30 June 1998would have been $466 million.
The Group has improved its asset quality position. Ongoing management of impaired assets has resulted in a significantreduction in impaired assets, both through write off and realisation or return to performing status.

COMMONWEALTH BANK OF AUSTRALIA AND CONTROLLED ENTITIES
Notes to the financial statements
92
NOTE 15 Asset Quality continued
Movement in Impaired Asset BalancesThe following table provides an analysis of the movement in the gross impaired asset balances for Financial Years
1997, 1998, 1999, 2000 and 2001.
Year Ended 30 June2001 2000 1999 1998 1997
$M $M $M $M $M
Gross impaired assets at period beginning 1,135 657 926 906 1,185New and increased 707 414 415 689 487Balances written off (666) (226) (280) (216) (190)Returned to performing or repaid (459) (194) (404) (1) (453) (576)
717 651 657 926 906Colonial impaired assets - 484 - - -Gross impaired assets at period end 717 1,135 657 926 906
(1) Includes $99 million reduction due to revised definition of non accruals introduced 31 December 1998.
Loans Accruing But Past Due 90 Days or More at 30 June2001 2000 1999 1998 1997
$M $M $M $M $M
Accruing loans past due 90 days or moreHousing loans 218 211 182 249 267Other loans 90 64 23 41 37Total 308 275 205 290 304
Interest Income Forgone on Impaired Assets Year Ended 30 June2001 2000(2) 1999 1998 1997
$M $M $M $M $M
Interest income forgoneAustralia Non Accrual Facilities 8 4 17 34 52Overseas Non Accrual Facilities 8 5 10 7 3Total 16 9 27 41 55
Interest Taken to Profit on Impaired Assets Year Ended 30 June2001 2000(2) 1999 1998 1997
$M $M $M $M $M
AustraliaNon Accrual Facilities 37 45 33 34 50Restructured Facilities - - - - -OverseasNon Accrual Facilities 14 6 - - -OREO - - - - 5Total Interest taken to Profit 51 51 33 34 55
(2) Excluding Colonial

Notes to the financial statements
93
NOTE 15 Asset Quality continued
Impaired AssetsGROUP GROUP
Australia Overseas Total Australia Overseas Total2001 2001 2001 2000 2000 2000
$M $M $M $M $M $M
Non Accrual Loans With provisions 334 196 530 378 391 769 Without provisions 184 1 185 344 19 363Gross Balances 518 197 715 722 410 1,132Less interest reserved (63) (5) (68) (128) (3) (131)Net Balances 455 192 647 594 407 1,001Less provisions for impairment (154) (79) (233) (205) (226) (431)Net Non Accrual Loans 301 113 414 389 181 570
Restructured LoansGross Balances 1 - 1 1 - 1Less interest reserved - - - - - -Net Balances 1 - 1 1 - 1Less provisions for impairment - - - - - -Net Restructured Loans 1 - 1 1 - 1
Other Real Estate Owned (OREO)Gross Balances - - - 1 - 1Less provisions for impairment - - - - - -Net OREO - - - 1 - 1
Other Assets Acquired Through SecurityEnforcement (OAATSE)Gross Balances - 1 1 - 1 1Less provisions for impairment - (1) (1) - (1) (1)Net OAATSE - - - - - -
Total Impaired AssetsGross Balances 519 198 717 724 411 1,135Less interest reserved (63) (5) (68) (128) (3) (131)Net Balances 456 193 649 596 408 1,004Less provisions for impairment (154) (80) (234) (205) (227) (432)Net Impaired Assets 302 113 415 391 181 572
Non Accrual Loans by Size of LoanLess than $1 million 146 3 149 324 54 378$1 million to $10 million 196 37 233 217 35 252Greater than $10 million 176 157 333 181 321 502Total 518 197 715 722 410 1,132
Accruing Loans 90 days past due or more 292 16 308 262 13 275These are loans which are well secured andnot classified as impaired assets but whichare in arrears 90 days or more. Interest onthese loans continues to be taken to profit.

COMMONWEALTH BANK OF AUSTRALIA AND CONTROLLED ENTITIES
Notes to the financial statements
94
NOTE 15 Asset Quality continued
Colonial State BankIndemnified loan bookPursuant to the Sale Agreement between Colonial
and the New South Wales Government, Colonial StateBank’s loan book as at 31 December 1994 and anyfurther loan losses (including interest) arising areindemnified by the NSW Government. This indemnity is tothe extent of 90% of the losses after an initial $60 million(which was provided for by Colonial State Bank as at31 December 1994). All loans (other than impaired loans)are covered for a period of three years from 31 December1994 and for the duration of the loan in the case ofimpaired loans so classified as at 31 December 1997.The Sale Agreement also allows for loans to bewithdrawn from the indemnity provided the withdrawal is
approved by Colonial State Bank and the NSWGovernment and the due processes are followed.
Pursuant to the Sale Agreement, the costs offunding and managing Non-Performing loans which arecovered by the loan indemnities are reimbursed by theNSW Government on a quarterly basis.
Selected Regional ExposuresAsiaOver 48% of total exposures relate to financial
institutions. Exposures to Indonesia, Thailand and Koreahave reduced by 10% in the Financial Year 2001 andrepresent approximately 19% of the Bank’s Asian creditrisk.
The Group’s credit risk exposure to Asian countries as at 30 June 2001 is set out below. The exposures exclude Groupequity investments.
CUSTOMER TYPE2001 2000
Country Finance Corporate/ Government Project APL/NZPL Total TotalMultinational Finance Exposure Exposure
$M $M $M $M $M $M $M
China 65 171 - - 1 237 75Hong Kong 472 662 - - 186 1,320 861
537 833 - - 187 1,557 936
Japan 1,259 241 161 - - 1,661 1,309Malaysia 6 116 41 - 2 165 74Singapore 123 152 19 - 27 321 768Taiwan 8 - - - - 8 37Other 4 3 - - - 7 7
1,400 512 221 - 29 2,162 2,195
Indonesia 8 107 62 139 32 348 420South Korea 262 140 - - - 402 402Thailand 3 95 25 - - 123 151
273 342 87 139 32 873 973Total 2,210 1,687 308 139 248 4,592 4,104
Other Regional ExposuresCUSTOMER TYPE
2001 2000Region Finance Corporate/ Government Project APL/NZPL Total Total
Multinational Finance Exposure Exposure$M $M $M $M $M $M $M
Eastern Europe 22 - 41 - - 63 50Latin America - - - - - - 5Middle East 108 - - - - 108 100
Total Exposure - The maximum of the limit orbalance utilised for committed facilities, whichever ishighest, and the balance utilised for uncommittedfacilities. For derivative facilities, balances are reportedon a ‘mark to market plus potential exposure’ basis.
Project Finance - Long term lending for large scaleprojects (such as mining, infrastructure) where repaymentis primarily reliant on the cash flow from the project.

Notes to the financial statements
95
NOTE 16 Life Insurance Investment AssetsGROUP
2001 2000$M $M
Equity Security InvestmentsDirect 9,349 7,754Indirect 5,024 3,530
14,373 11,284Debt Security InvestmentsDirect 8,815 8,525Indirect 5,224 4,160
14,039 12,685Property InvestmentsDirect 1,085 1,276Indirect 1,354 1,048
2,439 2,324Cash on Deposit 362 743Total Life Insurance Investment Assets 31,213 27,036
Direct investments refer to investments that aredirectly with the issuer of the investment. Indirectinvestments refer to investments that are held throughunit trusts or similar investment vehicles.
Disclosure on Asset RestrictionInvestments held in the Statutory Funds can only be
used within the restrictions imposed under the LifeInsurance Act 1995. The main restrictions are that assetsin a Fund can only be used to meet the liabilities andexpense of the Fund, to acquire investments to further
the business of the Fund or as distributions whensolvency and capital adequacy requirements are met.Participating policyholders can receive a distributionwhen solvency requirements are met, whilst shareholderscan only receive a distribution when the higher level ofcapital adequacy requirements are met.
These investment assets held in the StatutoryFunds are not available for use by the CommonwealthBank’s operating businesses.
NOTE 17 Deposits With Regulatory AuthoritiesGROUP BANK
2001 2000 2001 2000$M $M $M $M
Central Banks Overseas 61 46 4 3Total Deposits with Regulatory Authorities 61 46 4 3
NOTE 18 Shares in and Loans to Controlled Entities
Shares in controlled entities - - 9,847 12,198Loans to controlled entities - - 6,578 5,151Total Shares in and Loans to Controlled Entities - - 16,425 17,349

COMMONWEALTH BANK OF AUSTRALIA AND CONTROLLED ENTITIES
Notes to the financial statements
96
NOTE 19 Property, Plant and EquipmentGROUP BANK
2001 2000 2001 2000$M $M $M $M
(a) Land and Buildings Land At 30 June 2001 valuation 191 - 179 - At 30 June 2000 valuation - 222 - 208 Closing balance 191 222 179 208 Buildings At 30 June 2001 valuation 389 - 312 - At 30 June 2000 valuation - 508 - 334 Closing balance 389 508 312 334 Total Land and Buildings 580 730 491 542
These valuations were established by the Directors and are lower than valuations prepared by independent valuers.
(b) Leasehold Improvements At cost 444 532 388 321 Provision for depreciation (275) (336) (251) (195) Closing balance 169 196 137 126
(c) Equipment At cost 574 670 329 351 Provision for depreciation (404) (523) (269) (280) Closing balance 170 147 60 71 Total Property, Plant and Equipment 919 1,073 688 739
GROUP BANK2001 2000 2001 2000
Reconciliation $M $M $M $M
Reconciliation of the carrying amount of property plant and equipment at the beginning and end of the 2001 and 2000financial years.
LandOpening balance 222 239 208 216Disposals (36) (17) (29) (8)Net revaluations 5 - - -Closing balance 191 222 179 208
BuildingsOpening balance 508 470 334 358Acquisitions 42 112 41 13Disposals (132) (43) (37) (9)Depreciation (29) (31) (26) (28)Closing balance 389 508 312 334
Leasehold ImprovementsOpening balance 196 153 126 135Acquisitions 46 73 26 50Disposals (2) (2) (2) (1)Transfers - - 13 (32)Asset writedown (26) - - -Depreciation (45) (28) (26) (26)Closing balance 169 196 137 126
EquipmentOpening balance 147 139 71 87Acquisitions 99 77 15 18Disposals - (11) - -Depreciation (76) (58) (26) (34)Closing balance 170 147 60 71

Notes to the financial statements
97
NOTE 20 Intangible Assets GROUP BANK2001 2000 2001 2000
$M $M $M $M
Purchased goodwill - Colonial (refer note 2) 5,662 5,424 2,742 (2) -Purchased goodwill - Other (1) 1,132 888 835 784Realisation of life insurance synergy benefits (refer note 2) (332) - - -Accumulated amortisation (746) (407) (426) (372)Total Goodwill 5,716 5,905 3,151 412Excess of net market value over net assets of life insurance controlled entities 5,136 4,322 (3) - -Total Intangibles 10,852 10,227 3,151 412
(1) Increase in other goodwill principally relates to acquisition of remaining 25% interest in ASB Group in August 2000.(2) Colonial State Bank goodwill arising on Commonwealth Bank of Australia becoming successor in law to all assets and
liabilities of Colonial State Bank, refer Note 1(c).
Excess of net market value over net assets of controlled entities of the life insurance businesses:GROUP
At 30 June 2001Excess of
Market Net Market ValueValue Assets Over Net Assets
$M $M $M
Commonwealth entities 2,675 540 2,135ASB entities 320 136 184Colonial entities 5,008 2,191 2,817
8,003 2,867 5,136
GROUPAt 30 June 2000(3)
Excess ofMarket Net Market Value
Value Assets Over Net Assets$M $M $M
Commonwealth entities 1,978 407 1,571ASB entities 286 83 203Colonial entities 4,472 1,924 2,548
6,736 2,414 4,322
Further detail is provided in Note 34.
(3) Balances at 30 June 2000 include some minor adjustments. Excess disclosed at 30 June 2000 was $4,352 million,which has been restated to $4,322 million. Such adjustments have no effect on the appraisal value uplift for the year.These adjustments were reflected in the published results at 31 December 2000.

COMMONWEALTH BANK OF AUSTRALIA AND CONTROLLED ENTITIES
Notes to the financial statements
98
NOTE 21 Other AssetsGROUP BANK
2001 2000 2001 2000$M $M $M $M
Accrued interest receivable 1,155 1,314 1,118 1,004Shares in other companies 68 127 40 41Accrued fees/reimbursements receivable 381 187 400 63Securities sold not delivered 1,035 656 781 429Future income tax benefits 694 899 358 237Unrealised gains on trading derivatives (Note 39) (1) 9,592 6,252 8,962 5,764Other 962 2,444 217 717Total Other Assets 13,887 11,879 11,876 8,255
(1) The increases in unrealised gains on trading derivatives reflects increased volumes of derivative transactions and fallsin interest rates in Australia and the United States and the AUD/USD exchange rate.
Potential future income tax benefits of the Companyarising from tax losses in offshore centres and timingdifferences have not been recognised as assets becauserecovery is not virtually certain. These benefits, whichcould amount to $146 million (2000: $173 million) will onlybe obtained if:� The Company derives future assessable income of
a nature and of an amount sufficient to enable thebenefit from the deductions for the losses to berealised;
� The Company continues to comply with theconditions for deductibility imposed by taxlegislation; and
� No changes in tax legislation adversely affect theCompany in realising the benefit from thedeductions for the losses.
NOTE 22 Deposits and Other Public BorrowingsGROUP BANK
2001 2000 2001 2000$M $M $M $M
AustraliaCertificates of deposit 12,927 14,136 12,927 12,686Term deposits 28,102 29,677 25,529 22,788On demand and short term deposits 54,601 48,975 54,854 43,223Deposits not bearing interest 6,350 6,075 6,380 5,803Securities sold under agreements to repurchase 435 946 434 946Other 6 7 - -Total Australia 102,421 99,816 100,124 85,446
OverseasCertificates of deposit 2,294 2,686 1,108 1,269Term deposits 7,849 6,144 2,171 1,423On demand and short term deposits 4,130 3,419 39 98Deposits not bearing interest 635 529 7 4Agreements to repurchase 26 - 26 -Total Overseas 14,934 12,778 3,351 2,794Total Deposits and Other Public Borrowings 117,355 112,594 103,475 88,240
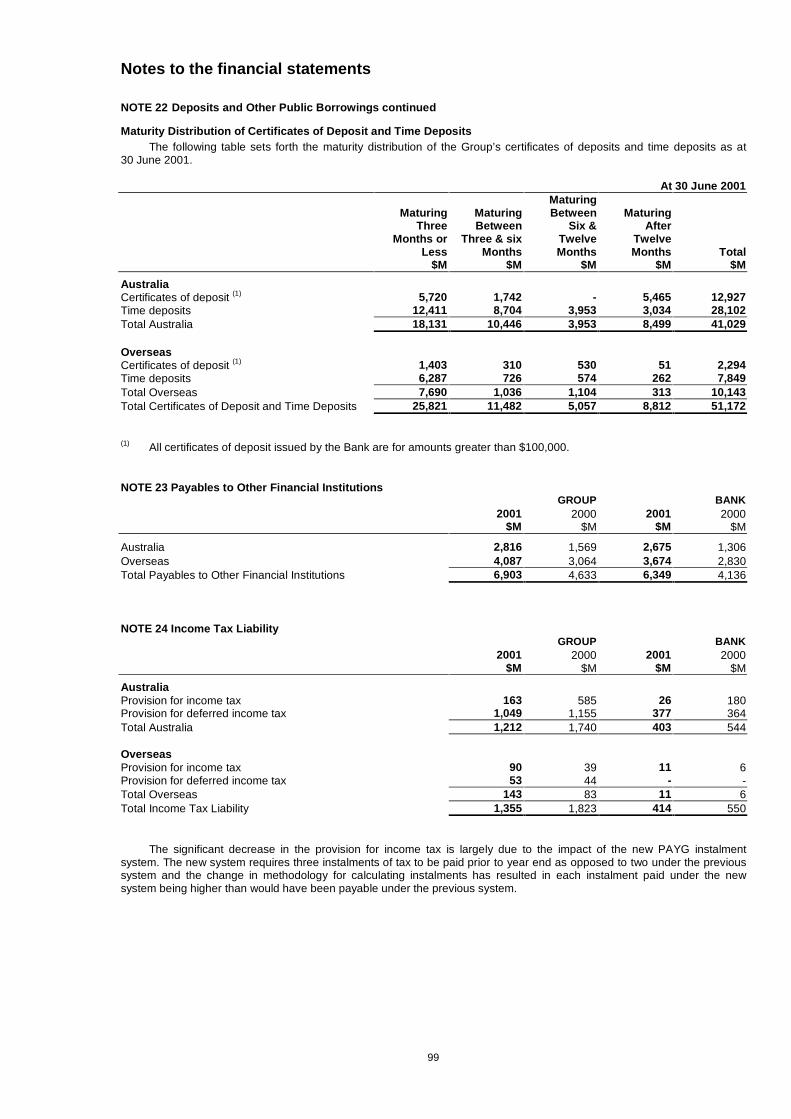
Notes to the financial statements
99
NOTE 22 Deposits and Other Public Borrowings continued
Maturity Distribution of Certificates of Deposit and Time DepositsThe following table sets forth the maturity distribution of the Group’s certificates of deposits and time deposits as at
30 June 2001.
At 30 June 2001Maturing
Maturing Maturing Between MaturingThree Between Six & After
Months or Three & six Twelve TwelveLess Months Months Months Total
$M $M $M $M $M
AustraliaCertificates of deposit (1) 5,720 1,742 - 5,465 12,927Time deposits 12,411 8,704 3,953 3,034 28,102Total Australia 18,131 10,446 3,953 8,499 41,029
OverseasCertificates of deposit (1) 1,403 310 530 51 2,294Time deposits 6,287 726 574 262 7,849Total Overseas 7,690 1,036 1,104 313 10,143Total Certificates of Deposit and Time Deposits 25,821 11,482 5,057 8,812 51,172
(1) All certificates of deposit issued by the Bank are for amounts greater than $100,000.
NOTE 23 Payables to Other Financial InstitutionsGROUP BANK
2001 2000 2001 2000$M $M $M $M
Australia 2,816 1,569 2,675 1,306Overseas 4,087 3,064 3,674 2,830Total Payables to Other Financial Institutions 6,903 4,633 6,349 4,136
NOTE 24 Income Tax LiabilityGROUP BANK
2001 2000 2001 2000$M $M $M $M
AustraliaProvision for income tax 163 585 26 180Provision for deferred income tax 1,049 1,155 377 364Total Australia 1,212 1,740 403 544
OverseasProvision for income tax 90 39 11 6Provision for deferred income tax 53 44 - -Total Overseas 143 83 11 6Total Income Tax Liability 1,355 1,823 414 550
The significant decrease in the provision for income tax is largely due to the impact of the new PAYG instalmentsystem. The new system requires three instalments of tax to be paid prior to year end as opposed to two under the previoussystem and the change in methodology for calculating instalments has resulted in each instalment paid under the newsystem being higher than would have been payable under the previous system.

COMMONWEALTH BANK OF AUSTRALIA AND CONTROLLED ENTITIES
Notes to the financial statements
100
NOTE 25 Other ProvisionsGROUP BANK
2001 2000 2001 2000$M $M $M $M
Provision for:Long service leave 304 312 289 287Annual leave 159 163 134 124Other employee entitlements 158 188 150 188Restructuring costs 204 485 174 124General insurance claims 52 45 - -Self insurance/non lending losses 46 33 44 33Other 84 328 46 52Total Other Provisions 1,007 1,554 837 808
NOTE 26 Debt Issues
Short term debt issues 16,620 16,249 4,318 5,406Long term debt issues 7,864 9,026 6,372 2,799Total Debt Issues 24,484 25,275 10,690 8,205
Short Term Debt IssuesAUD Bill Reliquification 639 2,547 639 2,547AUD Promissory Notes 3,150 2,418 - -AUD Bank Bills 679 546 - -NZD Promissory Notes - 251 - -US Commercial Paper 6,111 3,814 - -Euro Commercial Paper 4,200 3,150 1,838 1,647Long Term Debt Issues with less thanOne Year to Maturity 1,841 3,523 1,841 1,212Total Short Term Debt Issues 16,620 16,249 4,318 5,406
Long Term Debt IssuesUSD Medium Term Notes 2,937 2,286 2,346 986AUD Medium Term Notes 2,312 1,719 1,748 494JPY Medium Term Notes 255 197 255 197Other Currencies Medium Term Notes 338 981 179 482Offshore Loans (all JPY) 841 540 841 540Eurobonds 1,181 3,144 1,003 100Develop Australia Bonds (all AUD) - 159 - -Total Long Term Debt Issues 7,864 9,026 6,372 2,799
Maturity Distribution of Debt IssuesLess than 3 months 11,349 11,618 2,404 4,6153 months to 12 months 5,271 4,631 1,914 791Between 1 and 5 years 7,208 7,839 5,848 2,109Greater than 5 years 656 1,187 524 690Total Debt Issues 24,484 25,275 10,690 8,205

Notes to the financial statements
101
NOTE 26 Debt Issues continuedThe Bank has a Euro Medium Term Note
programme under which it may issue notes (Euro MTN’s)up to an aggregate amount of USD5 billion. Notes issuedunder the programmes are both fixed and variable rate.
Interest rate risk associated with the notes isincorporated within the Bank’s interest rate riskframework.
Subsequent to 30 June 2001, the Bank has issuedHKD500 million Euro MTN’s due July 2003(AUD125 million):
Where any debt issue is booked in an offshorebranch or subsidiary, the amounts have first beenconverted into the base currency of the branch ata branch defined exchange rate, before being convertedinto the AUD equivalent.
Where proceeds have been employed in currenciesother than that of the ultimate repayment liability, swap orother hedge arrangements have been entered into.
Short Term BorrowingsThe following table analyses the Group’s short term borrowings for the Financial Years ended 30 June 1999, 2000 and
2001.
Year Ended 30 June2001 2000 1999
($ millions, except where indicated)
US Commercial PaperOutstanding at period end (1) 6,111 3,814 4,491Maximum amount outstanding at any month end (2) 7,850 7,890 5,408Approximate average amount outstanding (2) 6,571 6,130 4,419Approximate weighted average rate on: Average amount outstanding 5.6% 5.7% 5.2% Outstanding at period end 4.0% 6.6% 5.0%
Euro Commercial PaperOutstanding at period end (1) 4,200 3,150 1,582Maximum amount outstanding at any month end (2) 5,579 4,788 2,267Approximate average amount outstanding (2) 4,533 2,855 1,714Approximate weighted average rate on: Average amount outstanding 4.3% 4.8% 4.5% Outstanding at period end 2.3% 3.7% 4.4%
Bill Reliquification (3)
Outstanding at period end (1) 639 2,547 -Maximum amount outstanding at any month end (2) 2,180 2,599 -Approximate average amount outstanding (2) 1,097 1,972 -Approximate weighted-average rate on: Average amount outstanding 6.0% 5.8% - Outstanding at period end 5.0% 6.2% -
Other Commercial PaperOutstanding at period end (1) 3,829 3,215 695Maximum amount outstanding at any month end (2) 5,117 3,304 781Approximate average amount outstanding (2) 3,637 2,231 324Approximate weighted average rate on: Average amount outstanding 5.7% 5.5% 4.6% Outstanding at period end 5.0% 5.1% 4.9%
(1) The amount outstanding at period end is reported on a book value basis (amortised cost).(2) The maximum and average amounts over the period are reported on a face value basis because the book values of
these amounts are not available. Any difference between face value and book value would not be material given theshort term nature of the borrowings.
(3) Commercial bills sold under non recourse arrangements.

COMMONWEALTH BANK OF AUSTRALIA AND CONTROLLED ENTITIES
Notes to the financial statements
102
NOTE 26 Debt Issues continued
Exchange Rates Utilised
30 June 2001 30 June 2000AUD 1.00 = USD 0.5080 0.5982
GBP 0.3612 0.3943JPY 63.071 63.155NZD 1.256 1.278HKD 3.962 4.664DEM 1.175 1.229CHF 0.913 0.979IDR 5,796 5,230
Guarantee ArrangementsCommonwealth Bank of AustraliaThe due payment of all monies payable by the Bank
was guaranteed by the Commonwealth of Australia undersection 117 of the Commonwealth Bank’s Act 1959(as amended) at 30 June 1996. This guarantee has beenprogressively phased out following the sale of theCommonwealth of Australia’s shareholding in the Bankon 19 July 1996.
The transitional arrangements for phasing out theCommonwealth of Australia’s guarantee are contained inthe Commonwealth Bank Sale Act 1995.
In relation to the Commonwealth of Australia’sguarantee of the Bank’s liabilities, transitionalarrangements provided that:� all demand deposits and term deposits were
guaranteed for a period of three years from 19 July1996, with term deposits outstanding at the end ofthat three year period being guaranteed untilmaturity; and
� all other amounts payable under a contract that wasentered into, or under an instrument executed,issued, endorsed or accepted by the Bank at19 July 1996 will be guaranteed until their maturity.Accordingly, demand deposits are no longer
guaranteed. Term deposits outstanding at 19 July 1999remain guaranteed until maturity. The run off of theGovernment guarantee has no effect on the Bank’saccess to deposit markets.
Commonwealth Development BankOn 24 July 1996, the Commonwealth of Australia
sold its 8.1% shareholding in the CommonwealthDevelopment Bank Limited (CDBL) to the Bank for$12.5 million.
Under the arrangements relating to the purchase bythe Bank of the Commonwealth of Australia’sshareholding in the CDBL:
� all lending assets as at 30 June 1996 have beenquarantined in CDBL, consistent with the Charterterms on which they were written;
� the CDBL’s liabilities continue to remain guaranteedby the Commonwealth; and
� CDBL ceased to write new business or incuradditional liabilities from 1 July 1996. From thatdate, new business that would have previouslybeen written by CDBL is being written by the ruralarm of the Bank.The due payment of all monies payable by CDBL is
guaranteed by the Commonwealth of Australia underSection 117 of the Commonwealth Banks Act 1959 (asamended). This guarantee will continue to be provided bythe Commonwealth whilst quarantined assets are held.The value of the liabilities under the guarantee willdiminish as quarantined assets reach maturity and arerepaid.
State Bank of NSW (known as Colonial State Bank)The enabling legislation for the sale of the State
Bank of New South Wales Limited (SBNSW), the StateBank (Privatisation) Act 1994 – Section 12 and the StateBank (Corporatisation) Act 1989 – Section 12(as amended), provides in general terms for a guaranteeby the NSW Government in respect of all fundingliabilities and off balance sheet products (other thandemand deposits) incurred or issued prior to 31December 1997 by SBNSW until maturity and aguarantee for demand deposits accepted by SBNSW upto 31 December 1997. Other obligations incurred before31 December 1994 are also guaranteed to their maturity.On 4 June 2001 Commonwealth Bank of Australiabecame the successor in law to SBNSW pursuant to theFinancial Sector (Transfers of Business) Act 1999. TheNSW Government guarantee of the liabilities andproducts as described above continues unchanged by thesuccession.
NOTE 27 Bills Payable and Other LiabilitiesGROUP BANK
2001 2000 2001 2000$M $M $M $M
Bills payable 886 825 818 754Accrued interest payable 1,062 1,340 900 815Accrued fees and other items payable 896 760 712 558Securities purchased not delivered 1,124 803 875 693Unrealised losses on trading derivatives (Note 39) (1) 8,759 5,605 8,105 5,284Other liabilities 1,145 2,216 137 324Total Bills Payable and Other Liabilities 13,872 11,549 11,547 8,428
(1) The increase in unrealised losses on trading derivatives reflects increased volumes of derivative transactions and fallsin interest rates in Australia and the United States and the AUD/USD exchange rate.

Notes to the financial statements
103
NOTE 28 Loan CapitalGROUP BANK
2001 2000 1999 2001 2000 1999$M $M $M $M $M $M
Tier 1 Capital CurrencyAmount (M)
Exchangeable FRNs USD300 (1) 78 92 113 78 92 113Exchangeable FRNs USD400 (2) 187 159 330 187 159 330Undated FRNs USD100 (3) 197 167 152 197 167 152
462 418 595 462 418 595Tier 2 CapitalExtendible FRNs AUD300 (4) 300 300 300 300 300 300Subordinated MTNs AUD185 (5) 185 185 185 185 185 185Subordinated FRNs AUD115 (5) 115 115 115 115 115 115Subordinated FRNs AUD25 (6) 25 25 25 25 25 25Subordinated MTNs AUD200 (7) 200 200 - 200 200 -Subordinated FRNs AUD50 (7) 50 50 - 50 50 -Subordinated Notes USD300 (8) 591 502 - 591 502 -Subordinated FRNs USD450 (8) 882 746 - 882 746 -Subordinated EMTN’s JPY20,000 (9) 326 277 251 325 277 251Subordinated EMTN’s USD200 (10) 314 314 - 314 314 -Subordinated EMTN’s USD75 (11) 115 115 - 115 115 -Subordinated EMTN’s USD100 (12) 152 152 - 152 152 -Subordinated EMTN’s USD400 (13) 501 501 501 501 501 501Subordinated EMTN’s GBP200 (14) 408 408 408 408 408 408Subordinated EMTN’s JPY30,000 (15) 582 495 448 582 495 448Subordinated Loan NZD100 (16) 79 79 - - - -Subordinated FRNs AUD210 (17) 210 210 - 210 - -Subordinated FRNs AUD38 (18) 38 38 - 38 - -Subordinated Notes AUD130 (19) 130 130 - 130 - -Subordinated Other AUD39 (20) 39 39 - 39 - -
5,242 4,881 2,233 5,162 4,385 2,233Total Loan Capital 5,704 5,299 2,828 5,624 4,803 2,828
Where a foreign currency hedge is in place to utilisea loan capital issue in a currency other than that of itsoriginal issue, the AUD equivalent value is shown net ofthe hedge.
(1) USD 300 million Undated Floating Rate Notes(FRNs) issued 11 July 1988 exchangeable intoDated FRNs.
Outstanding notes at 30 June 2001 were:Due July 2003 : USD1.5 millionDue July 2004 : USD0.5 millionundated : USD37.5 million
(2) USD 400 million Undated FRNs issued 22 February1989 exchangeable into Dated FRNs.
Outstanding notes at 30 June 2001 were:Due February 2005 : USD64 millionundated : USD31 million
(3) USD 100 million Undated Capital Notes issued on15 October 1986.The Bank has entered into separate agreements
with the Commonwealth of Australia relating to each ofthe above issues (the Agreements’) which qualify theissues as Tier 1 capital.
The Agreements provide that, upon the occurrenceof certain events listed below, the Bank may issue eitherfully paid ordinary shares to the Commonwealth ofAustralia or (with the consent of the Commonwealth ofAustralia) rights to all shareholders to subscribe for fullypaid ordinary shares up to an amount equal to theoutstanding principal value of the relevant note issue orissues plus any interest paid in respect of the notes forthe most recent financial year and accrued interest. Theissue price of such shares will be determined byreference to the prevailing market price for the Bank’sshares.
Any one or more of the following events may triggerthe issue of shares to the Commonwealth of Australia ora rights issue:� a relevant event of default (discussed below) occurs
in respect of a note issue and the Trustee of therelevant notes gives notice to the Bank that thenotes are immediately due and payable;
� the most recent audited annual financial statementsof the Group show a loss (as defined in theAgreements);

COMMONWEALTH BANK OF AUSTRALIA AND CONTROLLED ENTITIES
Notes to the financial statements
104
NOTE 28 Loan Capital continued� the Bank does not declare a dividend in respect of
its ordinary shares;� the Bank, if required by the Commonwealth of
Australia and subject to the agreement of theAPRA, exercises its option to redeem a note issue;or
� in respect of Undated FRNs which have beenexchanged to Dated FRNs, the Dated FRNsmature.Any payment made by the Commonwealth of
Australia pursuant to its guarantee in respect of therelevant notes will trigger the issue of shares to theCommonwealth of Australia to the value of such payment.
The relevant events of default differ depending onthe relevant Agreement. In summary, they cover eventssuch as failure of the Bank to meet its monetaryobligation in respect of the relevant notes; the insolvencyof the Bank; any law being passed to dissolve the Bankor the Bank ceasing to carry on general banking businessin Australia; and the Commonwealth of Australia ceasingto guarantee the relevant notes. In relation to DatedFRN’s which have matured to date, the Bank and theCommonwealth agreed to amend the relevant Agreementto reflect that the Commonwealth of Australia was notcalled upon to subscribe for fully paid ordinary shares upto an amount equal to the principal value of the maturingFRNs.(4) AUD 300 million Extendible Floating Rate Stock
issued December 1989:due December 2004 : AUD25 milliondue December 2009 : AUD275 millionThe Bank has entered into a separate agreement
with the Commonwealth of Australia relating to the aboveissue (the ‘Agreement’) which qualifies the issue as Tier 2capital. For capital adequacy purposes Tier 2 debt basedcapital is reduced each year by 20% of the originalamount during the last 5 years to maturity.
The Agreement provides for the Bank to issueeither fully paid ordinary shares to the Commonwealth ofAustralia or (with the consent of the Commonwealth ofAustralia) rights to all shareholders to subscribe for fullypaid ordinary shares up to an amount equal to theoutstanding principal value of the note issue plus anyinterest paid in respect of the notes for the most recentfinancial year and accrued interest. The issue price willbe determined by reference to the prevailing market pricefor the Bank’s shares.
Any one or more of the following events will triggerthe issue of shares to the Commonwealth of Australia ora rights issue:� a relevant event of default occurs in respect of the
note issue and, where applicable, the Trustee of thenotes gives notice of such to the Bank; or
� the Bank, if required by the Commonwealth ofAustralia and subject to the agreement of theAPRA, exercises its option to redeem such issue.
Any payment made by the Commonwealth ofAustralia pursuant to its guarantee in respect of the issuewill trigger the issue of shares to the Commonwealth ofAustralia to the value of such payment.(5) AUD300 million Subordinated Notes, issued
February 1999; due February 2009, split into$185 million fixed rate notes and $115 millionfloating rate notes.
(6) AUD25 million Subordinated FRN, issued April1999, due April 2029.
(7) AUD 250 million Subordinated FRN, issuedNovember 1999, due November 2009; split into$200 million fixed rate notes and $50 million floatingrate notes.
(8) USD 750 million Subordinated Notes, issued June2000, due June 2010; split into USD 300 millionfixed rate notes and USD 450 million floating ratenotes.
(9) JPY20 billion Perpetual Subordinated Euro MTN,issued February 1999.
(10) USD 200 million Subordinated EMTN, issuedNovember 1999, due November 2009.
(11) USD 75 million Subordinated EMTN, issuedJanuary 2000, due January 2010.
(12) USD 100 million Subordinated EMTN, issuedJanuary 2000, due January 2010.
(13) USD400 million Subordinated Euro MTN issuedJune 1996; due July 2006.
(14) GBP200 million Subordinated Euro MTN issuedMarch 1996; due December 2006.
(15) JPY30 billion Subordinated Euro MTN issuedOctober 1995; due October 2015.
(16) NZD100 million Subordinated matures15 December 2009.
(17) AUD210 million Euro FRN issued 3 September1996, maturing 10 September 2004.
(18) AUD38 million FRN issued 15 December 1997,maturing 15 December 2004.
(19) AUD130 million Subordinated Notes comprised asfollows:AUD10 million fixed rate notes issued 12 December1995, maturing 12 December 2005.AUD110 million floating rate notes issued12 December 1995, maturing 12 December 2005.AUD5 million fixed rate notes issued 17 December1996, maturing 12 December 2005.AUD5 million floating rate notes issued17 December 1996, maturing 12 December 2005.
(20) Comprises 16 subordinated Notes and FRN issues.The face value amounts are less than $10 millioneach and are all in Australian Dollars. The maturityranges from October 2001 to October 2009.

Notes to the financial statements
105
NOTE 29 Share CapitalBANK
2001 2000$M $M
Ordinary Share CapitalOpening balance 12,521 3,526Buyback (275) (553)Dividend reinvestment plan: 1999/2000 Final Dividend 169 -Buyback for DRP: 2000/2001 Interim Dividend (144) -Dividend Reinvestment Plan: 2000/2001 Interim Dividend 144 253Sell down of remaining shares from DRP: 2000/2001 Interim Dividend 4 -Employee Share Subscription Plan 3 4Exercise of Executive Options 37 19Issue costs (4) (2)7 for 20 Issue to Colonial Shareholders - 9,274Closing balance 12,455 12,521
Shares on Issue Number NumberOpening balance 1,260,201,978 915,968,625Buyback (25,927,367) (20,486,618)Dividend reinvestment plan issues:1999 Final Dividend fully paid ordinary shares at $24.75 - 5,545,9902000 Interim Dividend fully paid ordinary shares at $24.42 - 4,931,7822000 Final Dividend fully paid ordinary shares at $27.31 6,324,869 -Buyback for 2001 Interim Dividend (4,652,665) -2001Interim Dividend fully paid ordinary shares at $30.82 4,514,948 -Sell down of remaining shares not issued in DRP 137,717 -Exercise under Executive Option Plan 2,435,000 1,609,000Employee Share Subscription Plan issues 107,550 170,550Employee Share Acquisition Plan issues 873,425 1,053,1997 for 20 Issue to Colonial Shareholders - 351,409,450Closing balance 1,244,015,455 1,260,201,978
Terms and Conditions of Ordinary Share CapitalOrdinary shares have the right to receive dividends as declared and, in the event of winding up the company, to
participate in the proceeds from sale of surplus assets in proportion to the number of and amounts paid up on shares held.Ordinary shares entitle their holder to one vote, either in person or by proxy, at a meeting of the company.
Preference Share Capital BANK2001 2000
$M $M
Issued and Paid Up PERLS CapitalOpening balance - -PERLS issued 700 -Issue costs (13) -Closing balance 687 -
PERLS in Issue Number NumberOpening balance - -PERLS issued 3,500,000 -Closing balance 3,500,000 -
Commonwealth Bank PERLS (‘PERLS’) are perpetual preference shares that offer a quarterly, floating rate dividend.The issue of PERLS formed part of the continuing capital management strategy of the Bank with proceeds from the issuebeing used to buyback ordinary share capital, resulting in a more efficient capital structure. PERLS represent a lessexpensive form of equity funding than ordinary shares and increase the diversity and flexibility of the Bank’s capital base.The issue has also attracted new investors to the Bank. PERLS are listed and traded on the Australian Stock Exchange.
Terms and Conditions of Preferred Exchangeable Resettable Listed Shares (Commonwealth Bank PERLS)A holder of PERLS on the relevant record date is entitled to receive on each relevant Dividend Payment Date, if
determined by the Directors to be payable, a Dividend. Holders of Commonwealth Bank PERLS will rank ahead of holders ofordinary shares in a winding up to the extent of the issue price of the Commonwealth Bank PERLS.
Holders of PERLS are entitled to vote at a general meeting of the issuer in limited circumstances.

COMMONWEALTH BANK OF AUSTRALIA AND CONTROLLED ENTITIES
Notes to the financial statements
106
NOTE 29 Share Capital continued
Employee Share PlansThe Bank has in place the following employee share
plans:� Commonwealth Bank Employee Share Acquisition
Plan (ESAP);� Commonwealth Bank Equity Participation Plan
(EPP);� Commonwealth Bank Equity Reward Plan (ERP);
and� Commonwealth Bank Non-Executive Directors
Share Plan (NEDSP).
The ESAP provides employees of the Bank with upto $1,000 worth of free shares per annum subject toa performance target being met. The performance targetis growth in annual profit of the greater of 5% orconsumer price index plus 2%. Whenever annual profitgrowth exceeds CPI change, the Board may use itsdiscretion in determining whether any grant of shares willbe made. Details of issues under this plan are:
Employee Share Acquisition Plan (ESAP)The ESAP and ERP were each approved by
shareholders at the Annual General Meeting (AGM) on26 October 2000. Shareholders consent was not requiredfor either the EPP or NEDSP but details were included inthe Explanatory Memorandum to the meeting to ensureshareholders were fully informed.
Offer Issue DateOrdinary Shares
Issued(1)Bonus OrdinaryShares Issued(2)
No. ofParticipants
Shares issuedto each
Participant
IssuePrice(3)
2 Jan 1997 27,755 2,275,910 27,755 83 $12.04199618 Mar 1997 13 1,066 13 83 $12.0411 Dec 1997 3,025 1,637,273 28,281 58 $17.161997
3 Feb 1998 - 232 4 58 $17.161999 24 Sep 1999 - 1,053,199 24,493 43 $23.12
13 Oct 2000 - 872,620 24,932 35 $27.78200020 Dec 2000 - 805 23 35 $27.78
(1) For the 1996 and 1997 Offers, new employeeshareholders were granted one ordinary share withthe remainder of shares issued as Bonus OrdinaryShares. For subsequent Offers both new andexisting shareholders were granted Bonus OrdinaryShares.
(2) For the 1996 and 1997 Offers the bonus shareswere fully paid up as issued shares utilising theShare Premium Reserve. With the removal of theShare Premium Reserve the bonus shares areissued from the Share Capital Account.
(3) The Issue Price x Shares Issued to each Participanteffectively represents $1,000 of free shares.
Equity Reward Plan (ERP)The ERP is in two parts, comprising grants of
shares and grants of options. The option component ofthe ERP is similar to the Executive Option Plan (EOP)which was previously approved by shareholders with theonly difference being the maximum number of executivesto whom the Board envisages the Plan will apply (up from50 to 100). The Board also envisages that up to 500employees will participate in the share component of thePlan (including the up to 100 executives receivingoptions).
The exercise of options and the vesting of theemployees legal title to the shares is conditional on theBank achieving a prescribed performance hurdle, whichis:
� the Bank’s Total Shareholder Return (broadly,growth in share price plus dividends reinvested)over a minimum three year period, must equal orexceed the index of Total Shareholder Returnachieved by companies represented in the ASX’s‘Banks and Finance Accumulation Index’, excludingthe Bank.
� If the performance hurdle is not reached within thatthree years the options may nevertheless beexercisable only where the hurdle is subsequentlyreached within 5 years from the CommencementDate.Shares acquired under the share component of the
ERP are purchased on-market at the current marketprice.

Notes to the financial statements
107
NOTE 29 Share Capital continued
Details of options issued and shares acquired under this plan are:
Options
CommencementDate
IssueDate
OptionsIssued
OptionsOutstanding
Participants ExercisePrice
ExercisePeriod(2)
13 Sep 2000 7 Feb 2001 577,500 560,000 23 $26.97(1) 14 Sep 2003 to13 Sep 2010
(1) Exercise price will be adjusted by the premium formula (based on the actual difference between the dividend and bondyields at the date of the vesting).
(2) Performance hurdle must be satisfied between 14 September 2003 and 13 September 2005, otherwise options willlapse.
Shares
PurchaseDate
SharesPurchased
SharesOutstanding
Participants VestingPeriod
AveragePurchase Price
20 Feb 2001 361,100 358,100 61 14 Sep 2003 to 13 Sep 2005 $29.72
17,500 options and 3,000 shares granted under the ERP have lapsed as at 30 June 2001.
Equity Participation Plan (EPP)The EPP will facilitate the voluntary sacrifice of both
fixed salary and annual bonus to be applied in theacquisition of shares. The Plan will also facilitate themandatory sacrifice of part of annual performancebonuses. All shares acquired by employees under thisPlan will be purchased on-market at the current marketprice. The first purchase of shares for this scheme isscheduled for October 2001.
Non-Executive Directors Share Plan (NEDSP)The NEDSP provides for the acquisition of shares
by Non-Executive Directors through the mandatorysacrifice of 20% of their annual fees (paid on a quarterlybasis). Shares purchased are restricted for sale for10 years or when the Director leaves the Board,whichever is earlier. Shares are purchased on-market atthe current market price and details of shares purchasedunder this Plan so far are:
QuarterEnding
Total FeesSacrificed
Participants SharesPurchased
AveragePurchase Price
31/12/2000 $63,517 11 1,989 $31.9331/03/2001 $65,917 11 2,359 $27.9430/06/2001 $61,331 10 1,820 $33.45
Note - Trading restrictions on 317 shares acquiredon behalf of Mr Ken Cowley were lifted subsequent toMr Cowley’s exit from the Board.
Shareholders were also informed at the AGM on26 October 2000 that two plans were to be discontinued:� Commonwealth Bank Employee Share Subscription
Plan (ESSP); and� Commonwealth Bank Executive Option Plan (EOP).
Employee Share Subscription PlanThe Employee Share Subscription Plan provided
employees of the Bank with the opportunity to purchaseordinary shares at a 5% discount to the market price ofthe shares at the time of purchase, subject to a one yearrestriction on the disposal of the shares.
A total of 1,092,650 shares were issued under thisscheme to 4,907 employees in offers during the periodMarch 1997 to October 2000.
Executive Option PlanUnder the EOP, the Bank granted options to
purchase ordinary shares to those key executives who,are able by virtue of their responsibility, experience andskill to influence the generation of shareholder wealth,
were declared by the Board of Directors to be eligible toparticipate in the Plan. Non-Executive Directors were noteligible to participate in the Plan.
Options cannot be exercised before eachrespective exercise period and the ability to exercise isconditional on the Bank achieving a prescribedperformance hurdle. To reach the performance hurdle,the Bank’s Total Shareholder Return (broadly, growth inshare price plus dividends reinvested) over a minimumthree year period, must equal or exceed the index ofTotal Shareholder Return achieved by companiesrepresented in the ASX’s ‘Banks and FinanceAccumulation Index’, excluding the Bank.
If the performance hurdle is not reached within that3 years (4 years for the second tranche of optionsgranted to the Managing Director on 24 August 1999),the options may nevertheless be exercisable only wherethe hurdle is subsequently reached within five years(six years for the second tranche of options granted tothe Managing Director on 24 August 1999) from theCommencement Date.
The option plan did not grant rights to the optionholders to participate in a share issue of any other bodycorporate.

COMMONWEALTH BANK OF AUSTRALIA AND CONTROLLED ENTITIES
Notes to the financial statements
108
NOTE 29 Share Capital continued
Details of issues made under this plan are:
CommencementDate
IssueDate
OptionsIssued
OptionsOutstanding
Participants ExercisePrice(1)
ExercisePeriod
12 Nov 1996 16 Dec 1996 2,100,000 50,000 25 $11.85 13 Nov 1999 to 12 Nov 20013 Nov 1997 11 Dec 1997 2,875,000 125,000 27 $15.53(2) 4 Nov 2000 to 3 Nov 200225 Aug 1998 30 Sep 1998 3,275,000 2,975,000 32 $19.58(3) 26 Aug 2001 to 25 Aug 200324 Aug 1999 24 Sep 1999 3,855,000 3,700,000 38 $23.84(3) 25 Aug 2002 to 24 Aug 200913 Sep 2000 13 Oct 2000 2,002,500 1,952,500 50 $26.97(3) 14 Sep 2003 to 13 Sep 2010
(1) Market Value at the Commencement Date. Market Value is defined as the weighted average of the prices at whichshares were traded on the ASX during the one week period before the Commencement Date.
(2) Premium adjustment (based on the actual difference between the dividend and bond yields at the date of vesting) wasnil.
(3) Exercise price will be adjusted by the premium formula (based on the actual difference between the dividend and bondyields at the date of the vesting).
1,235,000 options, from all grants to date, have been forfeited as at 30 June 2001. 1,680,000 options from the 1996grant, and 2,390,000 options from the 1997 grant, have been exercised as at 30 June 2001.
Details of shares issued during the period 1 July 2000 to 22 August 2001 as a result of options being exercised are:
OptionIssue Date
SharesIssued
Price paid perShare
Total ConsiderationPaid
16 Dec 1996 145,000 $11.85 $1,718,250
11 Dec 1997 2,290,000 $15.53 $35,563,700
Share BuybackDuring the financial year ending 30 June 2001, the
Bank’s shareholders equity was reduced by $723 millionpursuant to the buyback of 25.9 million shares.
In March 2001 the Bank made an off marketbuyback of $700 million of ordinary shares. The price pershare paid by the Bank for the buyback shares was$27.84 calculated in accordance with the buyback offer.In accordance with an agreement reached with theAustralian Taxation Office $10 per share of theconsideration for each share bought back has beencharged to paid up capital ($251 million). The balance of
$17.84 per share is deemed to be a fully franked dividendand charged to retained profits ($449 million). Thisbuyback coincided with the new issue of preferenceshares as detailed previously. The balance of the equityreduction occurred by way of an on market buyback.
The Bank’s shareholders’ equity was reduced by$553 million on 8 November 1999 pursuant to thebuyback of 20.5 million shares. The price per share paidby the Bank for the buyback shares was $27.00calculated in accordance with the buyback offer.
NOTE 30 Outside Equity InterestsGROUP
2001 2000$M $M
Controlled Entities:Share Capital 6 355Reserves - 11Retained profits (9) 9Life Insurance Statutory funds 1,458 588Total Outside Equity Interests 1,455 963
In August 2000 the Group purchased the remaining 25% of ASB Group.

Notes to the financial statements
109
NOTE 31 Capital Adequacy
Entities within the Group are subject to regulationby a variety of regulators.
The Bank is subject to regulation by the AustralianPrudential Regulation Authority (APRA) and is required tomaintain certain minimum ratios of capital to assets.These ratios are applied to the Bank as a stand-aloneentity and on a consolidated basis to the Group. Theminimum ratios are 4% for Tier 1 capital and 8% for theCapital Base.
Under APRA Prudential Standards, capital falls intotwo categories, known as Tier 1 and Tier 2. Tier 1 capitalconsists of shareholders funds and certain capitalinstruments that meet the standards set by APRA. Theaggregate amount of capital instruments may not exceed25% of shareholders funds. Intangible assets and futureincome tax benefits are deducted to arrive at Tier 1capital. When calculated on a consolidated basis,goodwill and part of the Group’s investment in its lifeinsurance and funds management businesses are alsodeducted to arrive at Tier 1 capital.
Tier 2 capital is divided into Upper Tier 2 (consistingof revaluation reserves, general provisions for doubtfuldebts, cumulative irredeemable preference shares andother hybrid capital instruments approved by APRA), andLower Tier 2 (consisting of mandatory convertible notes,term subordinated debt, limited life redeemablepreference shares and other capital instrumentsapproved by APRA). Tier 2 capital may not exceed Tier 1capital and Lower Tier 2 capital may not exceed 50% ofTier 1 capital.
The sum of Tier 1 and Tier 2 capital forms TotalCapital. Investments in other banks and similarinstitutions are deducted from Total Capital to arrive atthe Capital Base. When calculated on a consolidatedbasis, part of the Group’s investment in its life insuranceand funds management businesses is deducted to arriveat the Capital Base.
The Group’s investment in its life insurance andfunds management businesses is carried at the valuesdisclosed in Note 34. Part of the investment is funded bydebt in intermediate holding companies ona non-recourse basis (i.e. obligations to pay interest orrepay principal are not guaranteed by the Bank). The partof the investment represented by shareholders’ nettangible assets and the value of in force businessacquired on the merger with Colonial in 2000, net of thenon-recourse debt, is deducted from Total Capital. Thepart of the investment represented by self-generatedvalue of business in force and the value of future newbusiness is deducted from Tier 1 capital.
For the purposes of calculating the ratios, riskweights are applied to balance sheet assets. These areintended to recognise the credit risk attached tocategories of assets. There are four risk weights (0, 20,50 or 100 per cent). Off balance sheet exposures areconverted to on balance sheet credit equivalents usingcredit conversion factors relating to the nature of theexposure, then weighted in the same manner as balancesheet assets.
In addition to the capital requirements for credit risk,the Bank is also required to hold sufficient capital to covermarket risk in its trading activities. Market risk is definedas the risk of losses in both on and off balance sheetpositions arising from movements in market price. APRArequire the measure of market risk to be multiplied by12.5 (i.e. the reciprocal of the minimum capital ratio of8 per cent) to determine a notional risk weighted assetfigure.
APRA applies similar regulatory capitalrequirements to Commonwealth Bank of Australia Limitedand CBFC Limited.
ASB Bank Limited is subject to regulation by theReserve Bank of New Zealand (RBNZ). RBNZ appliessimilar methodology in calculating the regulatory capitalrequirement. Although there are minor differences in theregulations applied by APRA and RBNZ, these are notmaterial.
Banks may not pay dividends if immediately afterpayment, they are unable to meet the minimum capitalrequirements. APRA does not normally permit banks topay dividends in excess of current year earnings.
The Group’s life insurance businesses in Australiaare also regulated by APRA. The Life Insurance Act hasestablished a framework for the regulatory capitalrequirements for life insurance companies. Theserequirements are based on tests aimed at ensuring eachstatutory fund in each life insurance company hassufficient assets to meet policy and other liabilities undera range of adverse circumstances. There are two tiers tothe regulatory capital requirements – ‘solvency’ and‘capital adequacy’. The solvency test is made assumingeach fund is closed to new business. Failure to meet thesolvency test may result in the appointment of a judicialmanager by APRA. The capital adequacy test assumeseach fund remains open to new business and thereasonable expectations of policyholders are met. Failureto meet the capital adequacy test means capital orretained profits may not be transferred from the statutoryfunds and may result in closer regulatory monitoring byAPRA. The capital adequacy test is always equal to orgreater than the solvency test. At 30 June 2001, allstatutory funds of the Group’s life insurance companies inAustralia met the capital adequacy test. In aggregate, at30 June 2001, the excess over capital adequacyamounted to $338 million.
There are no regulatory capital requirements for lifeinsurance companies in New Zealand. However theGroup determines capital requirements on a basis similarto the requirements in Australia.
The life insurance business in Hong Kong isregulated by the Insurance Authority of Hong Kong. Theminimum regulatory requirement comprises a solvencytest defined in local regulations and ordinances.
Funds managers in Australia are subject toregulation by The Australian Securities and InvestmentCommission (ASIC) through their role in supervisingResponsible Entities. The minimum regulatory capitalrequirements vary for Responsible Entities depending onthe type of dealer licence held but a minimumrequirement of $5 million of net tangible assets usuallyapplies.

COMMONWEALTH BANK OF AUSTRALIA AND CONTROLLED ENTITIES
Notes to the financial statements
110
NOTE 31 Capital Adequacy continuedGROUP
2001 2000Actual Actual
Risk Weighted Capital Ratios % %
Tier one 6.51 7.49Tier two 4.18 4.75Less deductions (1.53) (2.49)Total 9.16 9.75
GROUP2001 2000
$M $M
Tier One CapitalShareholders’ Equity (excluding asset revaluation reserve) 19,843 18,435Eligible Loan Capital 462 418Total Shareholders’ Equity and Loan Capital 20,305 18,853Less Goodwill (5,716) (5,905)Less Preference shares - (86)Less Intangible component of investment in non-consolidated subsidiaries (4,116) (2,656)Less Outside equity interest in entities controlled by non-consolidated subsidiaries (1,458) (588)Total Tier One Capital 9,015 9,618
Tier Two CapitalAsset revaluation reserve 5 -General provision for bad and doubtful debts (1) 1,390 1,358FITB related to general provision (436) (420)Note and bond issues (2) 4,825 5,120Preference shares - 39Total Tier Two Capital 5,784 6,097Tier One and Tier Two Capital 14,799 15,715Less Investment in non-consolidated subsidiaries (net of intangible componentdeducted from Tier 1) (2,005) (2,528)Less Other deductions (114) (669)Capital Base 12,680 12,518
(1) Excludes general provision for bad and doubtful debts relating to investments in non-consolidated subsidiaries.(2) Includes both upper and lower Tier 2 capital.
For an analysis of the movements in the capital ratios see page 34.

Notes to the financial statements
111
NOTE 31 Capital Adequacy continuedFace Value Risk Risk Weighted
Weights Balance2001 2000 2001 2000
$M $M % $M $M
Risk-weighted assets
On balance sheet assetsCash, claims on Reserve Bank, short term claims onAustralian Commonwealth and State Government andTerritories, and other zero-weighted assets 16,604 16,157 0% - -Claims on OECD banks and local governments 10,927 9,714 20% 2,185 1,943Advances secured by residential property (1) 77,909 75,656 50% 38,954 37,828All other assets (2) (3) 77,028 71,914 100% 77,028 71,914Total on balance sheet assets - credit risk 182,468 173,441 118,167 111,685
Face value Credit Risk-weightedEquivalent Balance
2001 2000 2001 2000 2001 2000$M $M $M $M $M $M
Off-balance sheet exposuresDirect credit substitutes 5,183 3,540 4,446 3,540 3,687 2,825Trade and performance related items 1,496 1,795 670 828 660 819Commitments 44,030 42,442 17,121 14,671 11,467 9,634Foreign exchange, interest rate and othermarket related transactions 407,014 381,438 11,407 9,358 3,758 2,785Total off balance sheet exposures - credit risk 457,723 429,215 33,644 28,397 19,572 16,063Total risk weighted assets - credit risk 137,739 127,748Risk weighted assets - market risk 644 736Total risk weighted assets 138,383 128,484
(1) For loans secured by residential mortgagesapproved after 5 September 1994, a risk weight of100 per cent applied where the loan to valuationratio is in excess of 80 per cent. Effective from28 August 1998, a risk weight of 50 per cent appliesto these loans if they are totally insured by anacceptable lender’s mortgage insurer. Loans thatare risk weighted at 100 per cent are reported under‘All Other Assets’.
(2) The difference between total on balance sheetassets and the Group’s balance sheet reflects thealternative treatment of some assets and provisionsas prescribed in APRA’s capital adequacyguidelines; principally goodwill, general provisionsfor bad and doubtful debts, and investments in lifeinsurance and funds management businesses.
(3) Total on-balance sheet assets exclude debt andequity securities in the trading book and allon-balance sheet positions in commodities as theyare included in the calculation of notional marketrisk weighted assets.

COMMONWEALTH BANK OF AUSTRALIA AND CONTROLLED ENTITIES
Notes to the financial statements
112
NOTE 32 Maturity Analysis of Monetary Assets and LiabilitiesThe maturity distribution of monetary assets and liabilities is based on contractual terms. The majority of the longer
term monetary assets are variable rate products, with actual maturities shorter than the contractual terms. Therefore thisinformation is not relied on by the Bank in the management of its interest rate risk.
GROUPMaturity Period At 30 June 2001
0 to 3 3 to 12 1 to 5 Over NotAt Call Overdrafts months months years 5 years specified Total
$M $M $M $M $M $M $M $M
AssetsCash and liquid assets 1,193 - 2,516 - - - - 3,709Receivables due from other financialinstitutions 848 2 2,636 587 477 - 72 4,622Trading securities (1) - - 6,909 - - - - 6,909Investment securities - - 1,062 1,861 4,017 2,764 1 9,705Loans, advances and other receivables (2) 1,408 4,089 12,934 12,787 42,963 63,277 (1,399) 136,059Bank acceptances of customers - - 10,868 1,207 - - - 12,075Life Assets 4,694 - 582 1,832 3,327 2,767 18,011 31,213Other Monetary assets 32 - 11,106 75 9 - 256 11,478Total Monetary assets 8,175 4,091 48,613 18,349 50,793 68,808 16,941 215,770
LiabilitiesDeposits and other public borrowings (3) 62,416 - 29,588 16,539 7,114 1,693 5 117,355Payables due to other financial institutions 358 215 4,095 2,235 - - - 6,903Bank acceptances - - 10,868 1,207 - - - 12,075Life Liabilities - - - - - - 27,029 27,029Debt issues and loan capital - - 11,349 5,271 7,862 5,095 611 30,188Other monetary liabilities 81 - 13,077 208 51 1 243 13,661Total monetary liabilities 62,855 215 68,977 25,460 15,027 6,789 27,888 207,211
(1) Trading securities are purchased without theintention to hold until maturity and are categorisedas maturing within 3 months.
(2) $65 billion of this figure represents owner occupiedhousing loans. While most of these loans wouldhave a contractual term of 20 years or more, andare analysed accordingly, the actual average termof the portfolio has historically been less than5 years.
(3) Includes substantial ‘core’ deposits which arecontractually at call customer savings and chequeaccounts. History demonstrates such accountsprovide a stable source of long term funding for theBank. Also refer to Interest Rate Risk Sensitivitytable in Note 39.
During the financial year, significant growth in variable rate, long-term loans occurred. This has been funded principallyby at call variable rate retail deposits.

Notes to the financial statements
113
NOTE 32 Maturity Analysis of Monetary Assets and Liabilities continuedGROUP
Maturity Period At 30 June 20000 to 3 3 to 12 1 to 5 Over Not
At Call Overdrafts months Months years 5 years specified Total$M $M $M $M $M $M $M $M
AssetsCash and liquid assets 1,041 - 1,534 - - - - 2,575Receivables due from other financialinstitutions 2,200 16 2,699 204 - - 35 5,154Trading securities (1) - - 7,347 - - - - 7,347Investment securities - - 1,757 1,787 3,027 2,575 3 9,149Loans, advances and other receivables (2) 510 4,719 8,351 18,315 49,826 51,853 (1,311) 132,263Bank acceptances of customers - - 9,553 1,554 - - - 11,107Life Assets (4) 2,037 - 25 4,924 2,996 3,048 14,006 27,036Other Monetary assets 1,024 - 8,854 133 13 15 244 10,283Total Monetary assets 6,812 4,735 40,120 26,917 55,862 57,491 12,977 204,914
LiabilitiesDeposits and other public borrowings (3) 55,494 - 27,577 19,744 7,408 2,371 - 112,594Payables due to other financial institutions 864 126 3,050 592 - - 1 4,633Bank acceptances - - 10,030 1,077 - - - 11,107Life Liabilities - - - - - 314 24,968 25,282Debt issues and loan capital - - 11,647 4,142 8,855 5,371 559 30,574Other monetary liabilities 201 - 11,565 317 137 30 - 12,250Total monetary liabilities 56,559 126 63,869 25,872 16,400 8,086 25,528 196,440
(1) Trading securities are purchased without the intention to hold until maturity and are categorised as maturing withinthree months.
(2) $49 billion of this figure represents owner occupied housing loans. While most of these loans would have a contractualterm of 20 years or more, and are analysed accordingly, the actual average term of the portfolio has historically beenless than 5 years.
(3) Includes substantial ‘core’ deposits which are contractually at call customer savings and cheque accounts. Historydemonstrates such accounts provide a stable source of long term funding for the Bank. Also refer to Interest Rate RiskSensitivity table in Note 39.
(4) Prior year figures have been adjusted to align with categories as at 30 June 2001 following the amalgamation ofColonial operations and product systems.

COMMONWEALTH BANK OF AUSTRALIA AND CONTROLLED ENTITIES
Notes to the financial statements
114
NOTE 33 Financial Reporting by SegmentsYear Ended 30 June 2001
Primary Segment Life Funds GROUPBusiness Segments Banking Insurance Management TotalProfit and Loss $M $M $M $M
Interest income 11,900 - - 11,900Premium and related revenue - 958 - 958Other income 2,485 1,698 701 4,884Appraisal value uplift 474Total Revenue 14,385 2,656 701 18,216
Interest Expense 7,426 - - 7,426
Profit before tax, appraisal value uplift, goodwill amortisation 2,512 514 243 3,269Income tax expense (705) (194) (94) (993)Profit after tax and before goodwill amortisationand appraisal value uplift 1,807 320 149 2,276Outside equity interest (14) - - (14)Profit after tax and outside equity interest before goodwillamortisation and appraisal value uplift 1,793 320 149 2,262Goodwill amortisation (338)Appraisal value uplift 474Profit after tax 1,793 320 149 2,398
Non-Cash ExpensesGoodwill amortisation (338)Charge for bad and doubtful debts (385) - - (385)Depreciation (108) (37) (5) (150)Other (28) (5) (4) (37)
Balance Sheet
Total Balance Sheet Assets 191,333 37,278 1,800 230,411Acquisition of Property, Plant & Equipment and Intangibles 129 - 3 391 (1)
Associate Investments 249 128 23 400Total Balance Sheet Liabilities 179,733 30,329 501 210,563
(1) Includes intangible assets of $259 million on acquisition of 25% interest in ASB Group.

Notes to the financial statements
115
NOTE 33 Financial Reporting by Segments continuedYear Ended 30 June 2000
Life Funds GROUPBanking Insurance Management Total
Profit and Loss $M $M $M $M
Interest income 8,842 - - 8,842Premium and related revenue - 337 - 337Other income 1,987 1,066 143 3,196Appraisal value uplift 1,165Total Revenue 10,829 1,403 143 13,540
Interest Expense 5,123 - - 5,123
Profit before tax, appraisal value uplift, goodwill amortisation 2,310 176 50 2,536Income tax expense (739) (47) (14) (800)Profit after income tax and before goodwillamortisation and appraisal value uplift 1,571 129 36 1,736Outside equity interest (38) - - (38)Profit after tax and outside equity interest before goodwillamortisation and appraisal value uplift 1,533 129 36 1,698Goodwill amortisation (57)Restructuring provision (106)Appraisal value uplift 1,165 (1)
Profit after tax 1,533 129 36 2,700
Non-Cash ExpensesGoodwill amortisation (57)Charge for bad and doubtful debts (196) - - (196)Restructuring provision (106)Depreciation (115) (2) - (117)Other (41) (2) (1) (44)
Balance Sheet
Total Balance Sheet Assets 185,108 32,642 509 218,259Acquisition of Property, Plant & Equipment and Intangibles 94 - - 8,137 (2)
Associate Investments 263 108 32 403Total Balance Sheet Liabilities 171,489 28,140 195 199,824
(1) $1,073 million of this amount was reported as abnormal income in this year.(2) Includes intangible assets of $8,043 million on acquisition of Colonial Group.

COMMONWEALTH BANK OF AUSTRALIA AND CONTROLLED ENTITIES
Notes to the financial statements
116
NOTE 33 Financial Reporting by Segments continuedYear Ended 30 June 1999
Life Funds GROUPBanking Insurance Management Total
Profit and Loss $M $M $M $M
Interest income 7,745 - - 7,745Premium and related revenue - 236 - 236Other income 2,438 590 97 3,125Total Revenue 10,183 826 97 11,106
Interest Expense 4,218 - - 4,218
Profit before tax, appraisal value uplift, goodwill amortisation 2,075 99 33 2,207Income tax expense (709) 4 (9) (714)Profit after tax and before goodwillProfit after income tax and before goodwill 1,366 103 24 1,493Outside equity interest (24) - - (24)Profit after tax and outside equity interest before goodwillamortisation and appraisal value uplift 1,342 103 24 1,469Goodwill amortisation (47)Profit after tax 1,342 103 24 1,422
Non Cash ExpensesGoodwill amortisation (47)Charge for bad and doubtful debts (247) - - (247)Depreciation (145) - - (145)Other (39) (2) (1) (42)
Balance Sheet
Total Balance Sheet Assets 136,787 1,157 152 138,096Acquisition of Property, Plant & Equipment and Intangibles 81 - - 81Associate Investments 258 - 23 281Total Balance Sheet Liabilities 130,195 841 97 131,134
Secondary Segment 2001 2000 1999Geographical Segment $M % $M % $M %
GEOGRAPHICAL SEGMENTSRevenueAustralia 15,150 83.2 11,614 85.8 9,470 85.3New Zealand 1,499 8.2 1,171 8.6 976 8.8Other Countries * 1,567 8.6 755 5.6 660 5.9
18,216 100.0 13,540 100.0 11,106 100.0Operating profit after tax and outside equity interestsAustralia 2,228 92.9 2,536 93.9 1,270 89.3New Zealand 159 6.6 105 3.9 80 5.6Other Countries * 11 0.5 59 2.2 72 5.1
2,398 100.0 2,700 100.0 1,422 100.0AssetsAustralia 196,918 85.5 187,452 85.9 115,510 83.6New Zealand 20,208 8.8 16,661 7.6 13,046 9.5Other Countries * 13,285 5.7 14,146 6.5 9,540 6.9
230,411 100.0 218,259 100.0 138,096 100.0Acquisition of Property, Plant & Equipment andIntangiblesAustralia 360 92.1 7,906 (1) 97.2 81 100.0New Zealand 29 7.4 231 (1) 2.8 - -Other Countries * 2 0.5 - - - -
391 100.0 8,137 100.0 81 100.0
* Other Countries are:United Kingdom, United States of America, Japan, Singapore, Hong Kong, Grand Cayman, the Philippines, Fiji,Thailand, Indonesia, Malaysia, China and Vietnam.
The geographical segments represent the location in which the transaction was booked.
(1) Includes intangible assets of $8,043 million on acquisition of Colonial Group.

Notes to the financial statements
117
NOTE 34 Life Insurance Business
The following information, in accordance with AASB 1038, is provided to disclose life insurance business transactionscontained in the Group financial statements and the underlying methods and assumptions used in their calculation. Alsorefer Notes 1 (jj) and 20.
GROUPSummarised Profit and Loss Statement 2001 2000
$M $M
Premium and related revenue 1,122 459Outward reinsurance premiums expense (164) (122)Claims expense (621) (310)Reinsurance recoveries 141 89Investment revenue (excluding investments in subsidiaries) Equity securities 552 592 Debt securities 902 442 Property 277 32 Other (33) -Life insurance policy liabilities expense (908) (856)Margin on services operating income 1,268 326Change in excess of net market values over net assetsof life insurance controlled entities 474 92Life Insurance operating income 1,742 418
Administration expense (754) (150)Operating profit before income tax 988 268
Income tax attributable to operating profit (194) (47)Operating profit after income tax 794 221
Outside equity interest in operating profit after income tax - (2)Operating profit after outside equity interest and income tax 794 219
Sources of life insurance operating profit
The Margin on Services operating profit after income tax is represented by:
Emergence of planned profit margins 257 121Difference between actual and planned experience (63) (8)Movement in excess of net market value over net assets of controlled entities 474 92Reversal of previously recognised losses or loss recognition on groups ofrelated products (2) 1Investment earnings on assets in excess of policyholder liabilities 126 13Other 2 2Operating profit after income tax 794 221
Life insurance premiums received and receivable 6,510 2,927Life insurance claims paid and payable 5,671 2,279
An analysis of this financial result is contained in the Life Insurance – Business Analysis section of this report.

COMMONWEALTH BANK OF AUSTRALIA AND CONTROLLED ENTITIES
Notes to the financial statements
118
NOTE 34Life Insurance Business continued
Carrying Values of Life Insurance and Funds Management BusinessThe following table sets out the components of the carrying values of the Group’s life insurance and funds
management businesses, together with the key actuarial assumptions that have been used by the independent actuaries.These are Directors’ valuations based on appraisal values determined by independent actuaries Trowbridge Consulting.
Analysis of Movement since 30 June 2000 Life Insurance FundsAustralia New Zealand Asia Management Total
$M $M $M $M $M
Profits (1) 273 19 (18) 149 423Opening Fair Value Adjustments (2) - - (30) - (30)Net Capital Movements (269) 39 179 77 26Transfers / Acquisitions of Business (3) - - - 34 34Change in Shareholders NTA 4 58 131 260 453Synergies Credited to Goodwill (4) 332 - - - 332Transfers / Acquisitions of Business (183) - - 191 8Net Appraisal Value Uplift (33) (26) (63) 596 474Increase to 30 June 2001 120 32 68 1,047 1,267
SHAREHOLDERS’ NET TANGIBLE ASSETSLife Insurance Funds Total
Australia New Zealand Asia30 June 2000 balance (5) 1,639 178 588 9 2,414Opening fair value adjustment (2) - - (30) - (30)Profits 319 19 (18) 149 469Less profit on strategic holding (4) (46) - - - (46)Net capital movements (269) 39 179 77 26Transfers/acquisitions of business (3) - - - 34 3430 June 2001 balance 1,643 236 719 269 2,867
VALUE IN FORCE BUSINESSLife Insurance Funds Total
Australia New Zealand Asia30 June 2000 balance (5) 686 186 101 624 1,597Synergies credited to goodwill (4) - - - - -Transfers/acquisitions of business (4) - - - 2 2Uplift 20 (51) n/a (8) (39)30 June 2001 balance 706 135 101 618 1,560
VALUE FUTURE NEW BUSINESSLife Insurance Funds Total
Australia New Zealand Asia30 June 2000 balance (5) 690 240 186 1,609 2,725Synergies credited to goodwill (4) 332 - - - 332Transfers/acquisitions of business (4) (183) - - 189 6Uplift (53) 25 (63) 604 51330 June 2001 balance 786 265 123 2,402 3,576
CARRYING VALUE AT 30 JUNE 2001Life Insurance Funds Total
Australia New Zealand AsiaShareholders' net tangible assets 1,643 236 719 269 2,867Value in force business 706 135 101 618 1,560Embedded value 2,349 371 820 887 4,427Value future new business 786 265 123 2,402 3,576Carrying Value 3,135 636 943 3,289 8,003
(1) Total Australian life insurance profit is $320 million, comprising $274 million in the life insurance corporate structureand $46 million relating to certain strategic investments transferred from the Bank to the life insurance operations.
(2) Fair value adjustments totalling $30 million have been made to the opening value of the Asian operations representingchanged assumptions on tax and investment earnings in the opening valuation.
(3) Represents the net tangible assets of a number of funds management entities not held in a life insurance corporatestructure ($34 million).
(4) This item includes a transfer of business from the Life insurance business to the Funds Management business($183 million) and goodwill arising on acquisition of new businesses during the year ($8 million). Cost and revenuesynergies arising from the Colonial Integration were achieved during the year with a value of $332 million. The value ofthese synergies is credited against goodwill.
(5) Balances at 30 June 2000 include some minor adjustments principally related to the re-allocation of value between inforce business and future new business. Such adjustments have no effect on the Appraisal Value Uplift for the year.

Notes to the financial statements
119
NOTE 34 Life Insurance Business continuedThe following table reconciles the carrying values of the life and funds management businesses to the value of
investments in non-consolidated subsidiaries as shown in the capital adequacy calculation.
Reconciliation of the components of the carrying value to the value of investments in non-consolidatedsubsidiaries
30 June 2001 30 June 2000(1)
$M $M
Intangible component of investment in non-consolidated subsidiaries deducted fromTier 1 capital comprises:Value future new business 3,576 2,725Value of self-generated in force business (2) 540 -Adjustments (1) - (69)
4,116 2,656
Investment in non-consolidated subsidiaries deducted from Total Capital comprises:Shareholders’ NTA in life and funds management businesses 2,867 2,414Shareholders’ NTA in other non-consolidated subsidiaries 41 78Debt recognised as capital per APRA regulations 96 140Value of in force business (2) - 1,597Value of acquired in force business (2) 1,020 -Less non-recourse debt (2,019) (1,698)Other (1) - (3)
2,005 2,528
(1) Balances at 30 June 2000 include some minor adjustments principally related to the re-allocation of value between inforce business and future new business.
(2) Refer Note 31 of the financial statements for an explanation of the change in treatment between 30 June 2000 and30 June 2001 relating to the value of self-generated business in force.
Key Assumptions Used in Appraisal ValuesThe following Key Assumptions have been used by Trowbridge in determining the appraisal values. Other actuarial
assumptions used in the valuation are described in the section Actuarial Methods and Assumptions.New Risk Value of
Business Discount FrankingMultiplier(1) Rate Credits
30 June 2001 % %
Life insurance entities
Australia 9 11.5 70
New Zealand 9 12.0 -
Asia- Hong Kong 9 HKD13.5 (2) -
USD12.5- Other Various Various -
Funds management entities
Australia n.a. 12.5 70
New Risk Value ofBusiness Discount Franking
As at 30 June 2000 Multiplier Rate Credits% %
Life insurance entities
Australia 10 12 70
New Zealand 8 13 -
Asia- Hong Kong 9 HKD15 (2) -
USD12.5- Other various various -
Funds management entities
Australia n.a. 13 70(1) Changes in multipliers reflect changes in risk discount rates, changes to business mix and changes to views on future
new business growth.(2) These are the risk discount rates for Hong Kong dollar business and US dollar business.

COMMONWEALTH BANK OF AUSTRALIA AND CONTROLLED ENTITIES
Notes to the financial statements
120
NOTE 34 Life Insurance Business continued
Policy LiabilitiesAppropriately qualified actuaries have been
appointed in respect of each life insurance business andthey have reviewed and satisfied themselves as to theaccuracy of the policy liabilities included in this financial
report, including compliance with the regulations of theLife Insurance Act 1995 where appropriate. Details areset out in the various statutory returns of these lifeinsurance businesses.
2001 2000$M $M
Components of policy liabilities:
Future policy benefits (1) 29,727 28,983Future bonuses 1,583 1,751Future expenses 2,209 1,648Future profit margins 1,224 1,170Future charges for acquisition expenses (648) (616)Balance of future premiums (7,112) (7,701)Provisions for bonuses not allocated to participating policyholders 46 47Total policy liabilities 27,029 25,282
(1) Including bonuses credited to policyholders in prior years.
TaxationTaxation has been allowed for in the determination
of policy liabilities in accordance with the relevantlegislation applicable in each territory.
On 1 July 2000 a new tax regime for life insurancecompanies commenced in Australia. The primary effect ofthis regime is to tax profits that had previously not beensubject to taxation. Allowance has been made in theappraisal values and policy liabilities of the life insurancebusinesses for the impact of the new tax requirements.
Actuarial Methods and AssumptionsPolicy liabilities have been calculated in accordance
with the Margin on Services (MoS) methodology as setout in Actuarial Standard 1.02 – Valuation Standard(‘AS1.02’) issued by the Life Insurance ActuarialStandards Board (‘LIASB’). There has been no change inthe principal methods and profit carriers used forparticular product groups which are as follows:
Product Type Method Profit Carrier
IndividualConventional Projection Bonuses / dividends or expected claim paymentsInvestment account Projection Bonuses or asset chargesInvestment linked Projection Asset charge
Accumulation Not applicableLump sum risk Projection Premiums/claimsIncome stream risk Projection Expected claim paymentsImmediate annuities Projection Bonuses or annuity paymentGroupInvestment account Projection Bonuses or asset chargesInvestment linked Projection Asset chargeLump sum risk Projection Claims
Accumulation Premiums (implied)Income stream risk Projection Expected claim payments

Notes to the financial statements
121
NOTE 34 Life Insurance Business continued
The ‘Projection Method’ measures the presentvalues of estimated future policy cash flows to calculatepolicy liabilities. The policy cash flows incorporateinvestment income, premiums, expenses, redemptionsand benefit payments.
The ‘Accumulation Method’ measures theaccumulation of amounts invested by policyholders plusinvestment earnings less fees specified in the policy tocalculate policy liabilities. Deferred acquisition costs areoffset against this liability.Bonuses are amounts added, at the discretion of the lifeinsurer, to the benefits currently payable underParticipating Business. Under the Life Act, bonuses area distribution to policyholders of profits and may takea number of forms including reversionary bonuses,interest credits and capital growth bonuses (payable onthe termination of the policy).
Actuarial AssumptionsSet out below is a summary of the material
assumptions used in the calculation of policy liabilities.These assumptions are also used in the determination ofappraisal values.
Discount RatesThese are the rates used to discount further cash
flows to determine their net present value in the policyliabilities. The discount rates are determined withreference to the expected earnings rate of the assets thatsupport the policy liabilities adjusted for taxation whererelevant. The following table shows the applicable ratesfor the major classes of business in Australia and NewZealand. The changes relate to changes in long termearnings rates, asset mix and reflect the new tax regimefor Australian business.
Discount RatesJune 2001 June 2000
Class of Business Rate Range % Rate Range %Traditional – ordinary business (after tax) 6.38-6.72 6.11Traditional – superannuation business (after tax) 7.80-8.23 7.88Annuity business (after tax) 6.51-7.97 6.40-8.25Term life insurance – ordinary business (after tax) 4.20-4.55 3.20-5.28Term life insurance – superannuation business (after tax) 4.20-4.55 4.50-5.28Disability business (before tax) 4.20-4.55 6.15Investment linked – ordinary business (after tax) 5.86-6.36 5.70-5.82Investment linked – superannuation business (after tax) 7.34-7.92 7.00-7.80Investment linked – exempt (after tax) 8.34-9.12 8.35-8.63Investment account – ordinary business (after tax) 4.51 4.44Investment account – superannuation business (after tax) 5.49 5.72

COMMONWEALTH BANK OF AUSTRALIA AND CONTROLLED ENTITIES
Notes to the financial statements
122
NOTE 34 Life Insurance Business continued
BonusesThe valuation assumes that the long-term
supportable bonuses will be paid, which is in line withcompany bonus philosophy. There have been nosignificant changes to these assumptions.
Maintenance expensesFor the Australian and New Zealand operations of
the Colonial Group, maintenance expense assumptionsare based on the contractual fees (inclusive of anallowance for inflation) as set out in the service companyagreements. These have increased in line with inflation.
For other operations maintenance expenseassumptions are based on an analysis of experience overthe past year taking into account future business plans.‘One-off’ expenses are excluded.
Investment management expensesInvestment management expense assumptions are
based on the contractual fees (inclusive of an allowancefor inflation) as set out in Fund Manager agreements.There have been no significant changes to theseassumptions.
InflationThe inflation assumption is consistent with the
investment earning assumptions. There have been nosignificant changes to these assumptions.
Benefit indexationThe indexation rates are based on an analysis of
past experience and estimated long term inflation andvary by business and product type. There have been nosignificant changes to these assumptions.
TaxationThe taxation basis and rates assumed vary by
territory and product type. For the Australian business itreflects the new regime for life insurance companieseffective 1 July 2000.
Voluntary discontinuanceDiscontinuance rates are based on recent company
and industry experience and vary by territory, product,age and duration inforce. The only significant change hasbeen an increase in the assumption for New Zealand andAsia.
Surrender valuesCurrent surrender value bases are assumed to
apply in the future. There have been no significantchanges to these assumptions.
Unit price growthUnit prices are assumed to grow in line with
assumed investment earnings assumptions, net of assetcharges as per current company practice. There havebeen no significant changes to these assumptions.
Mortality and MorbidityRates vary by sex, age, product type and smoker
status. Rates are based on standard mortality tablesapplicable to each territory e.g. IA90-92 in Australia forrisk, IM/IF80 for annuities, adjusted for recent companyand industry experience where appropriate. The onlysignificant change has been an increase in theassumption for disability claims.
SolvencyAustralian Life InsurersAustralian life insurers are required to hold
prudential reserves in excess of the amount of policyliabilities. These reserves are required to support capitaladequacy requirements and provide protection againstthe adverse experience. Actuarial Standard AS2.02‘Solvency Standard’ (‘AS2.02’) prescribes a minimumcapital requirement and the minimum level of assetsrequired to be held in each life insurance fund.All controlled Australian life insurance entities compliedwith the solvency requirements of AS2.02. Furtherinformation is available from the individual statutoryreturns of subsidiary life insurers.
Overseas life insurersOverseas life insurance subsidiaries are required to
hold reserves in excess of policy liabilities in accordancewith local Acts and prudential rules. Each of the overseassubsidiaries complied with local requirements. Furtherinformation is available from the individual statutoryreturns of subsidiary life insurers.
Managed assets & fiduciary activitiesArrangements are in place to ensure that asset
management and other fiduciary activities of controlledentities are independent of the life insurance funds andother activities of the Group.
Disaggregated InformationLife insurance business is conducted through
a number of life insurance entities in Australia andoverseas. Under the Australian Life Insurance Act 1995,life insurance business is conducted within one or moreseparate statutory funds which are distinguished fromeach other and from the shareholders’ fund. The financialstatements of Australian life insurers prepared inaccordance with AASB 1038, (and which are lodged withthe relevant Australian regulators) show all majorcomponents of the financial statements disaggregatedbetween the various life insurance statutory funds andtheir shareholder funds.

Notes to the financial statements
123
NOTE 35 Remuneration of AuditorsGROUP BANK
2001 2000 2001 2000$’000 $’000 $’000 $’000
Amounts paid or due and payable for audit and review of the financial report by:Ernst & Young 4,518 3,165 1,864 1,993Other Auditors 89 1,878 - -
4,607 5,043 1,864 1,993Amounts paid or due and payable for other services toErnst & Young 5,113 17,953 4,089 17,779
Total Remuneration of Auditors 9,720 22,996 5,953 19,772
Other services provided by Ernst & Young duringthe year primarily related to regulatory and other statutoryservices, accounting related services and taxationadvisory services.
Other services provided by Ernst & Young duringthe previous year substantially related to once-offinitiatives including GST preparedness and the
acquisition of Colonial Limited. A significant proportion ofthe other services was provided by Ernst & Young’smanagement consulting division. Effective 23 May 2000Ernst & Young sold its management consulting business.From that date Ernst & Young no longer provides thosemanagement consulting services to the Group.
NOTE 36 Commitments for Capital Expenditure Not Provided for in the AccountsGROUP BANK
2001 2000 2001 2000$M $M $M $M
Not later than one year 30 22 12 19Later than one year but not later than two years 2 - - -Later than two years but not later than five years - - - -Later than five years - - - -Total Commitments for Capital Expenditure Not Providedfor in the Accounts 32 22 12 19
NOTE 37 Lease Commitments - Property, Plant and EquipmentGROUP BANK
2001 2000 2001 2000$M $M $M $M
Commitments in respect of non cancellable operating leaseagreements due -Not later than one year 277 309 216 168Later than one year but not later than five years 730 784 595 469Later than five years 311 341 227 215Total Lease Commitments - Property, Plant and Equipment 1,318 1,434 1,038 852
Group's share of lease commitments ofassociated entities -Not later than one year 7 8Later than one year but not later than five years 16 22Later than five years 7 10Total Lease Commitments - Property, Plant and Equipment 30 40
Lease ArrangementsLeases entered into by the Group are for the
purpose of accommodating the business need. Leasesmay be over retail, commercial, industrial and residentialpremises and reflect the needs of the occupying businessand market conditions. All leases are negotiated withexternal professional property resources acting for theGroup.
Rental payments are determined in terms ofrelevant lease requirements – usually reflecting marketrentals as described by standard valuation practice.
The Group as lessee has no purchase options overpremises occupied. For properties sold and leased backby the Group, the Group does have the right of firstrefusal to purchase the property. There is no obligationon the Bank to do so, and there has never been aninstance of purchase.
There are no restrictions imposed on the Group’slease of space other than those forming part of thenegotiated lease arrangements for each specific premise.

COMMONWEALTH BANK OF AUSTRALIA AND CONTROLLED ENTITIES
Notes to the financial statements
124
NOTE 38 Contingent LiabilitiesThe Group is involved in a range of transactions
that give rise to contingent and/or future liabilities. Thesetransactions meet the financing requirements ofcustomers and include endorsed bills of exchange,letters of credit, guarantees and commitments to providecredit.
These transactions combine varying levels of credit,interest rate, foreign exchange and liquidity risk. Inaccordance with Bank policy, exposure to any of thesetransactions is not carried at a level which would havea material effect on the financial condition of the Bank andits controlled entities.
Details of contingent liabilities and off balance sheet business (excluding Derivatives – Note 39) are:GROUP
Face Value Credit Equivalent2001 2000 2001 2000
$M $M $M $M
Credit risk related instrumentsGuarantees 2,104 2,554 2,104 2,554Standby letters of credit 673 558 673 558Bill endorsements 1,096 428 1,096 428Documentary letters of credit 238 231 48 46Performance related contingents 1,236 1,564 618 782Commitments to provide credit 42,874 41,324 15,970 13,579Other commitments 2,488 1,118 1,728 1,091Total credit risk related instruments 50,709 47,777 22,237 19,038
Guarantees represent conditional undertakings bythe Group to support the financial obligations of itscustomers to third parties.
Standby letters of credit are undertakings by theGroup to repay a loan obligation in the event of a defaultby a customer.
Bill endorsements relate to bills of exchange whichhave been confirmed by the Group and representliabilities in the event of default by the acceptor and thedrawer of the bill.
Documentary letters of credit represent anundertaking to pay an overseas supplier of goods in theevent of payment default by a customer who is importingthe goods.
Performance related contingents involveundertakings by the Group to pay third parties ifa customer fails to fulfil a contractual non-monetaryobligation.
Commitments to provide credit include allobligations on the part of the Group to provide fundingfacilities.
Other commitments include the Group’s obligationsunder sale and repurchase agreements, outright forwardpurchases and forward deposits and underwritingfacilities.
The transactions are categorised and creditequivalents calculated under APRA guidelines for the riskbased measurement of capital adequacy. The creditequivalent amounts are a measure of the potential loss tothe Group in the event of possible non performance bya counterparty.
The credit equivalent exposure from direct creditsubstitutes (guarantees, standby letters of credit and billendorsements) is the face value of the transaction,whereas the credit equivalent exposure to documentaryletters of credit and performance related contingents is20% and 50% respectively of the face value. Theexposure to commitments to provide credit is calculatedby applying given credit conversion factors to the facevalue to reflect the duration, the nature and the certaintyof the contractual undertaking to provide the facility.
Where the potential loss depends on theperformance of a counterparty, the Group utilises thesame credit policies and assessment criteria for offbalance sheet business as it does for on balance sheetbusiness and if it is deemed necessary, collateral isobtained based on management’s credit evaluation of thecounterparty. If a probable loss is identified, suitableprovisions are raised.
LitigationNeither the Commonwealth Bank nor any of its
controlled entities is engaged in any litigation or claimwhich is likely to have a materially adverse effect on thebusiness, financial condition or operating results of theCommonwealth Bank or any of its controlled entities.Where some loss is probable an appropriate provisionhas been made.

Notes the financial statements
125
NOTE 38 Contingent Liabilities continued
Indemnities under UK Sale AgreementThe Group has contingent liabilities that relate to
indemnities given under an agreement for the sale ofColonial Life (UK) Ltd and Colonial Pension Fund Ltd tothe Winterthur Group.
These indemnities cover potential claims that couldarise from mis-selling activities in the UK for pensionproducts and mortgage endowment products. Under thesales agreement the liabilities are shared betweenWinterthur and the Group on a pre-determined basis.
Fiduciary ActivitiesThe Group and its associated entities conduct
investment management and other fiduciary activities asresponsible entity, trustee, custodian or manager fornumerous investment funds and trusts, includingsuperannuation and approved deposit funds, wholesaleand retail trusts. The amounts of funds concerned whichare not reported in the Group’s balance sheet are asfollows:
2001 2000$M $M
Funds under managementAustralia 58,018 43,400United Kingdom 14,614 19,202New Zealand 2,227 947Asia 2,095 1,717
76,954 65,266Funds under trusteeshipAustralia 22,768 21,150
Funds under custody and investment administrationAustralia 73,513 66,510
As an obligation arises under each type of duty theamount of funds has been included where that dutyarises. This may lead to the same funds being shownmore than once where Group companies are engaged toact in more than one capacity (e.g. as trustee and fundmanager).
Certain entities within the Group act as responsibleentity or trustee of various managed schemes(‘schemes’), wholesale and retail trusts (‘trusts’).Liabilities are incurred by these entities in their capacityas responsible entity or trustee. Rights of indemnity areheld against the schemes and trusts whose assetsexceeded their liabilities at 30 June 2001. Where entitieswithin the Group act as manager of unit trusts,obligations exist under the relevant Trust Deeds,whereby upon request from a unit holder, the managerhas an obligation to repurchase units from the trust or toarrange for the relevant trustee to redeem units from theassets of those trusts. It is considered unlikely that theseentities will need to repurchase units from their ownfunds.
The Commonwealth Bank of Australia does notguarantee the performance or obligations of itssubsidiaries.
Long Term ContractsIn 1997, the Bank entered into a ten year contract
with an associated entity, EDS (Australia) Pty Ltd, relatingto the provision of information technology services. In2000, the Bank entered into a telecommunicationsservices agreement with TCNZ Australia Pty Ltd for fiveyears. The exact amounts of these contracts is unable tobe reliably determined as they are dependent uponbusiness volumes over the period of the contracts.
Liquidity supportIn accordance with the regulations and procedures
governing clearing arrangements contained within theAustralian Paper Clearing Stream (Clearing Stream 1)and the Bulk Electronic Clearing Stream (Clearing Stream2) of the Australian Payments Clearing AssociationLimited, the Bank is subject to a commitment to provideliquidity support to these clearing streams in the event of afailure to settle by a member institution.
Service agreementsThe maximum contingent liability for termination
benefits in respect of service agreements with theManaging Director and other executives of the Companyand its controlled entities at 30 June 2001 was $12 million(2000: $8 million).

COMMONWEALTH BANK OF AUSTRALIA AND CONTROLLED ENTITIES
Notes to the financial statements
126
NOTE 39 Market RiskThe Group in its daily operations is exposed to
a number of market risks. A market risk is the risk of anadverse event in the financial markets that may result ina loss of earnings to the Group, e.g. an adverse interestrate movement.
Under the authority of the Bank’s Board, the RiskCommittee of the Board ensures that all the Group’smarket risk is consistent with the Group businessstrategy and within Group risk tolerance. Regular marketrisk reports are tabled before Risk Committee. Within theGroup, market risk exists in the balance sheet structureand arises in the course of its intermediation activities infinancial services and in financial markets trading.
Market risk in the balance sheetThe Risk Committee of the Board recommends for
Board approval all balance sheet market risk policies andlimits. Implementation of the policy is through the AssetLiability Committee, with operational management of therisk delegated to the Group General Manager, Financial& Risk Management. Market risk in the balance sheetincludes liquidity risk, funding risk, interest rate risk andforeign exchange rate risk.
Liquidity riskBalance sheet liquidity risk is the risk of being
unable to meet financial obligations as they fall due. TheGroup manages liquidity risk separately for its domesticAustralian Dollar (AUD) obligations and for its foreigncurrency obligations. In both domestic and foreigncurrency operations, liquidity policies are in place tomanage liquidity both in a day to day sense, and alsounder crisis assumptions.
APRA has revised its Prudential Standard for thesupervision of liquidity in banks. This standard has beenexpanded to cover all Approved Deposit-takingInstitutions (ADIs). The previous policy has beensuperseded and the Prime Assets Requirements (PAR)has been abolished.
Each bank is required to develop a liquiditymanagement strategy that is appropriate for itself, basedon its size and the nature of its operations. The primeobjective is to ensure that each bank has sufficientliquidity to meet its financial obligations as they fall due.
The Bank has developed a liquidity policy, relevantto its own circumstances and this has formally beenapproved by APRA. The objectives of the Bank’s fundingand liquidity policies are to:� Ensure all financial obligations are met when due;� Provide adequate protection at lowest cost; and� Achieve sustainable, lowest-cost funding within the
limitations of funding diversification requirements,without over-reliance on any particular marketsegment.
The Bank’s policy framework differentiates normaloperational liquidity management (corresponding to the‘going concern’ scenario in APRA’s Prudential StatementD1 on Liquidity) from a crisis event. Three types of crisisare dealt with ie, systemic, founded and unfounded. Thepolicy sets out the controls and cash flow assumptionsappropriate in all cases. The key elements of the liquiditypolicy cover:� Detailed daily forecasts out to 3 months including
mismatch limits;� Development of reliable funding sources;� The holding of a stock of high quality liquid assets
ie, assets held that are available for repurchase bythe RBA (over and above those required to meetReal Time Gross Settlement (RTGS) obligations),AUD CDs/Bills of other banks and AUD overnightinterbank loans; and
� The use of standby lines of funding.Subsidiaries are also included in the Group’s
liquidity policy framework.Foreign currency liquidity risk is managed by
ensuring that a positive cumulative cash flow exists for thenext 7 days’ operations. This means that should a crisissituation arise, the Bank would not need to access newfunding from wholesale markets for at least one week.There is also a cap on the maximum level of cumulativenegative cash flows at day 28. A stock of liquid assets isincluded in this protective measure.
Funding riskFunding risk is the risk of over-reliance on a funding
source to the extent that a change in that funding sourcecould increase overall funding costs or cause difficulty inraising funds. The Group has a policy of fundingdiversification. This Funding Policy augments the Group’sLiquidity Policy. Its aim is to assure that the Group has astable diversified funding base without over-reliance onany one market sector. Central to this is the determinationof the most appropriate mix of deposits and other liabilitiesto fund the balance sheet. A target has been set for thepreferred minimum level of retail deposits. A minimumlevel of long-term (greater than 12 months) funding hasalso been set.
Domestically, the Group continues to obtain themajority of its AUD funding from its stable retail depositbase, primarily demand and short term deposits, whichhave a lower interest cost than wholesale funds. The retailfunding percentage has risen from 60% in June 2000 to62% in June 2001. The relative size of the Group’s retailbase has enabled it to source funds at a lower averagerate of interest than the other major Australian banks.However, some of this benefit is offset by the cost of theGroup’s retail network and the Group’s large share(approximately 48%) of pensioner deeming accounts.
In recent years, the Group has experienceda movement of retail deposit balances into higher yieldingfacilities. This reflects increased customer awareness ofinvestment opportunities in an environment where thelevel of interest rates has remained lower and relativelymore stable when compared with the interest rate cyclesof the 1980s and early 1990s.

Notes to the financial statements
127
NOTE 39 Market Risk continuedThe cost of funds for Financial Year 2001,
calculated as the percentage of interest expense toaverage interest bearing liabilities, was 5.1% on a Groupbasis compared with 4.4% on a Group basis for FinancialYear 2000.
The Group obtains a significant proportion of itsfunding for the domestic balance sheet from wholesalesources – approximately 23%, excluding BankAcceptances. The cost of funds raised in the wholesalemarkets is affected by independently assessed creditratings.
A funding diversification policy is particularlyimportant in offshore markets where the absence of any‘natural’ offshore funding base means the Bank isprincipally reliant on money market and capital marketsources for funding. The Bank has imposed internalprudential limits on the relative mix of offshore sources offunds.
The following table outlines the range of financialinstruments used by the Group to raise deposits andborrowings, both within Australia and overseas. Funds areraised from well-diversified sources and there are nomaterial concentrations in these categories.
GROUP2001 2000
$M $M
AustraliaCheque Accounts 19,644 15,289Savings Accounts 30,248 29,543Term Deposits 28,102 29,677Cash Management Accounts 11,080 9,985Debt Issues 14,719 17,520Bank Acceptances 11,960 11,107Certificates of Deposit 12,927 14,136Life Insurance Policy Liabilities 23,477 21,975Loan Capital 5,704 5,299Securities Sold Under Agreements to Repurchase 435 946Other 2,798 1,809Total Australia 161,094 157,286
OverseasDeposits and Interbank 19,021 15,842Commercial Paper 8,471 6,070Life Insurance Policy Liabilities 3,552 3,307Other Debt Issues 1,294 1,685Bank Acceptances and Other 118 -Total Overseas 32,456 26,904Total Funding Sources 193,550 184,190Provisions and Other Liabilities 17,013 15,634Total Liabilities 210,563 199,824
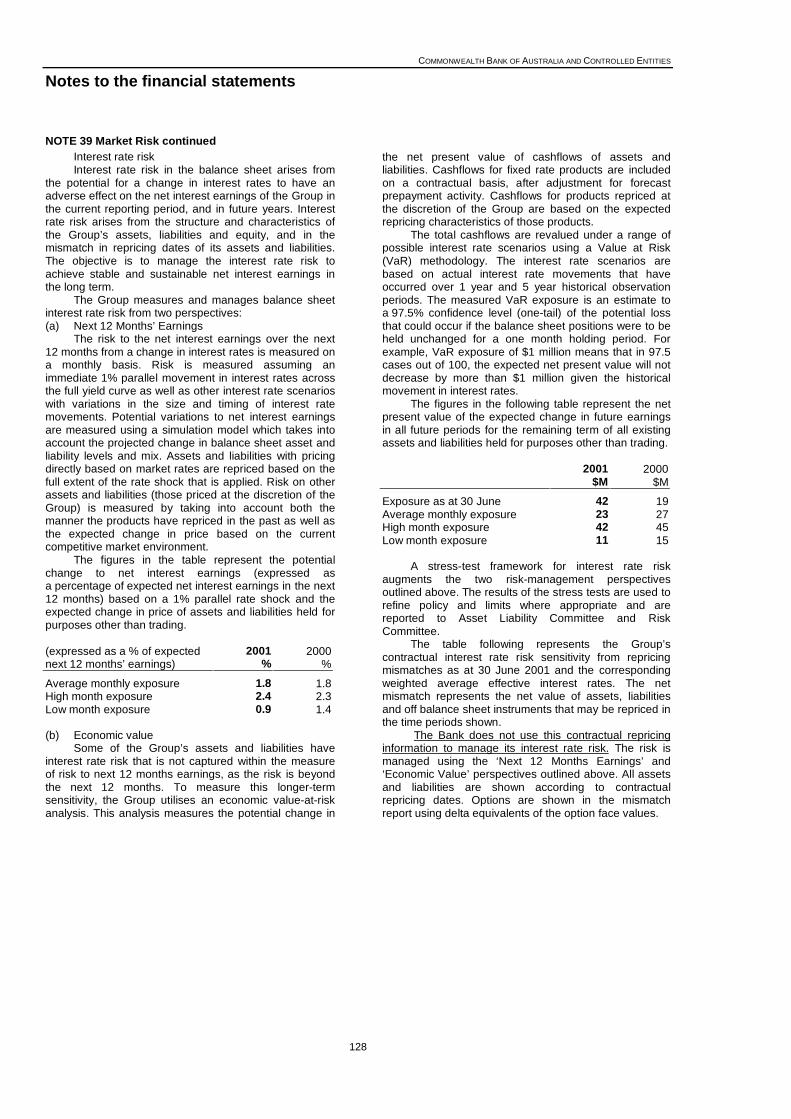
COMMONWEALTH BANK OF AUSTRALIA AND CONTROLLED ENTITIES
Notes to the financial statements
128
NOTE 39 Market Risk continuedInterest rate riskInterest rate risk in the balance sheet arises from
the potential for a change in interest rates to have anadverse effect on the net interest earnings of the Group inthe current reporting period, and in future years. Interestrate risk arises from the structure and characteristics ofthe Group’s assets, liabilities and equity, and in themismatch in repricing dates of its assets and liabilities.The objective is to manage the interest rate risk toachieve stable and sustainable net interest earnings inthe long term.
The Group measures and manages balance sheetinterest rate risk from two perspectives:(a) Next 12 Months’ Earnings
The risk to the net interest earnings over the next12 months from a change in interest rates is measured ona monthly basis. Risk is measured assuming animmediate 1% parallel movement in interest rates acrossthe full yield curve as well as other interest rate scenarioswith variations in the size and timing of interest ratemovements. Potential variations to net interest earningsare measured using a simulation model which takes intoaccount the projected change in balance sheet asset andliability levels and mix. Assets and liabilities with pricingdirectly based on market rates are repriced based on thefull extent of the rate shock that is applied. Risk on otherassets and liabilities (those priced at the discretion of theGroup) is measured by taking into account both themanner the products have repriced in the past as well asthe expected change in price based on the currentcompetitive market environment.
The figures in the table represent the potentialchange to net interest earnings (expressed asa percentage of expected net interest earnings in the next12 months) based on a 1% parallel rate shock and theexpected change in price of assets and liabilities held forpurposes other than trading.
(expressed as a % of expected 2001 2000next 12 months’ earnings) % %
Average monthly exposure 1.8 1.8High month exposure 2.4 2.3Low month exposure 0.9 1.4
(b) Economic valueSome of the Group’s assets and liabilities have
interest rate risk that is not captured within the measureof risk to next 12 months earnings, as the risk is beyondthe next 12 months. To measure this longer-termsensitivity, the Group utilises an economic value-at-riskanalysis. This analysis measures the potential change in
the net present value of cashflows of assets andliabilities. Cashflows for fixed rate products are includedon a contractual basis, after adjustment for forecastprepayment activity. Cashflows for products repriced atthe discretion of the Group are based on the expectedrepricing characteristics of those products.
The total cashflows are revalued under a range ofpossible interest rate scenarios using a Value at Risk(VaR) methodology. The interest rate scenarios arebased on actual interest rate movements that haveoccurred over 1 year and 5 year historical observationperiods. The measured VaR exposure is an estimate toa 97.5% confidence level (one-tail) of the potential lossthat could occur if the balance sheet positions were to beheld unchanged for a one month holding period. Forexample, VaR exposure of $1 million means that in 97.5cases out of 100, the expected net present value will notdecrease by more than $1 million given the historicalmovement in interest rates.
The figures in the following table represent the netpresent value of the expected change in future earningsin all future periods for the remaining term of all existingassets and liabilities held for purposes other than trading.
2001 2000$M $M
Exposure as at 30 June 42 19Average monthly exposure 23 27High month exposure 42 45Low month exposure 11 15
A stress-test framework for interest rate riskaugments the two risk-management perspectivesoutlined above. The results of the stress tests are used torefine policy and limits where appropriate and arereported to Asset Liability Committee and RiskCommittee.
The table following represents the Group’scontractual interest rate risk sensitivity from repricingmismatches as at 30 June 2001 and the correspondingweighted average effective interest rates. The netmismatch represents the net value of assets, liabilitiesand off balance sheet instruments that may be repriced inthe time periods shown.
The Bank does not use this contractual repricinginformation to manage its interest rate risk. The risk ismanaged using the ‘Next 12 Months Earnings’ and‘Economic Value’ perspectives outlined above. All assetsand liabilities are shown according to contractualrepricing dates. Options are shown in the mismatchreport using delta equivalents of the option face values.

Notes to the financial statements
129
NOTE 39 Market Risk continued
Interest Rate Risk SensitivityRepricing Period at 30 June 2001
Balance Not WeightedSheet 0 to 1 1 to 3 3 to 6 6 to 12 1 to 5 over 5 Interest AverageTotal month months months months years Years Bearing Rate
$M $M $M $M $M $M $M $M %
AustraliaAssetsCash and liquid assets 3,197 1,979 - - 10 - - 1,208 2.60Receivables due from otherfinancial institutions 2,858 1,815 855 149 39 - - - 4.89Trading securities 4,095 4,095 - - - - - - 4.97Investment securities 3,336 253 365 - 28 1,677 1,012 1 8.40Loans, advances and other receivables 118,939 65,183 9,087 5,168 13,058 26,138 1,696 (1,391) 7.18Bank acceptances of customers 11,960 - - - - - - 11,960Life insurance investment assets 27,401 3,219 229 255 1,486 3,171 2,441 16,600 2.42Deposits with regulatory authorities - - - - - - - -Property, plant and equipment 721 - - - - - - 721Intangible assets 10,848 - - - - - - 10,848Other assets 13,548 - - - - - - 13,548Total Assets 196,903 76,544 10,536 5,572 14,621 30,986 5,149 53,495 5.03
LiabilitiesDeposits and other public borrowings 102,421 65,923 7,941 9,373 4,881 6,143 1,720 6,440 3.47Payables due to otherfinancial institutions 2,816 1,500 269 456 591 - - - 4.98Bank acceptances 11,960 - - - - - - 11,960Provision for dividend 779 - - - - - - 779Income tax liability 1,212 - - - - - - 1,212Other provisions 881 - - - - - - 881Life insurance policy liabilities 23,477 - - - - - - 23,477 (3)
Debt issues 14,719 2,452 4,897 1,676 1,157 4,420 117 - 5.56Bills payable and other liabilities 12,679 - - - - - - 12,679
Loan Capital 5,624 493 1,744 213 - 406 2,768 - 6.40Total Liabilities 176,568 70,368 14,851 11,718 6,629 10,969 4,605 57,428 2.76
Shareholders EquityOutside equity interests in 18,362 700 - - - - - 17,662controlled entities 1,449 - - - - - - 1,449Total Shareholders’ Equity 19,811 700 - - - - - 19,111
Off Balance Sheet ItemsSwaps (2) 2,472 (11,560) 800 3,085 3,014 2,189 - (1)
FRAs (2) - - - - - - - (1)
Futures (2) - - - - - - - (1)
Net Mismatch (2) 7,948 (15,875) (5,346) 11,077 23,031 2,733 (23,044) (1)
Cumulative Mismatch (2) 7,948 (7,927) (13,273) (2,196) 20,835 23,568 524 (1)
(1) no rate applicable(2) no balance sheet amount applicable(3) Technically, the life insurance policy liabilities are not interest bearing, but the amount of the liability may change in line
with changes in interest rates. This is particularly so with investment linked policies.
As noted above the cumulative mismatch reflects contractual repricing periods. The balance sheet is managed basedon assessments of expected pricing behaviour having regard to historical trends and competitive positioning.
The Group has a significant portfolio of loans with fixed interest rates maturing in the one to five years repricing period.Funding is principally raised from retail deposits with at call variable interest rates. The interest rate risk exposure ismanaged in accordance with the principles outlined above in this note.

COMMONWEALTH BANK OF AUSTRALIA AND CONTROLLED ENTITIES
Notes to the financial statements
130
NOTE 39 Market Risk continuedRepricing Period at 30 June 2001
Balance Not WeightedSheet 0 to 1 1 to 3 3 to 6 6 to 12 1 to 5 over 5 Interest AverageTotal month months months months years years Bearing Rate
$M $M $M $M $M $M $M $M %
OverseasAssetsCash and liquid assets 512 375 121 7 - - - 9 1.97Receivables due from otherfinancial institutions 1,764 626 188 177 237 478 - 58 5.62Trading securities 2,814 789 823 314 367 439 57 25 5.70Investment securities 6,369 573 1,281 1,884 83 1,744 803 1 5.19Loans, advances and other receivables 17,120 6,845 1,535 1,232 2,264 4,822 430 (8) 7.50Bank acceptances of customers 115 - - - - - - 115Life insurance investment assets 3,812 666 58 95 177 518 53 2,245 2.85Deposits with regulatory authorities 61 - - - - - - 61Property, plant and equipment 198 - - - - - - 198Intangible assets 4 - - - - - - 4Other assets 739 - - - - - - 739Total Assets 33,508 9,874 4,006 3,709 3,128 8,001 1,343 3,447 5.95
LiabilitiesDeposits and other public borrowings 14,934 8,516 3,440 995 1,154 193 - 636 4.94Payables due to otherfinancial institutions 4,087 2,906 756 286 88 51 - - 4.87Bank acceptances 115 - - - - - - 115Provision for dividend - - - - - - - -Income tax liability 143 - - - - - - 143Other provisions 126 - - - - - - 126Life insurance policy liabilities 3,552 - - - - - - 3,552Debt issues 9,765 449 6,338 1,506 557 544 326 45 4.43Bills payable and other liabilities 1,193 - - - - - - 1,193
Loan Capital 80 - - - - 80 - - 8.29Total Liabilities 33,995 11,871 10,534 2,787 1,799 868 326 5,810 4.05
Shareholders EquityOutside equity interests in 31 - - - - - - 31controlled entities 6 - - - - - - 6Total Shareholders’ Equity 37 - - - - - - 37
Off Balance Sheet ItemsSwaps (2) 999 3,700 96 (1,222) (3,351) (222) - (1)
FRAs (2) (299) 199 100 - - - - (1)
Futures (2) - 74 (166) 92 - - - (1)
Net Mismatch (2) (1,297) (2,555) 952 199 3,782 795 (2,400) (1)
Cumulative Mismatch (2) (1,297) (3,852) (2,900) (2,701) 1,081 1,876 (524) (1)
(1) no rate applicable(2) no balance sheet amount applicable

Notes to the financial statements
131
NOTE 39 Market Risk continuedRepricing Period at 30 June 2000
Balance Not WeightedSheet 0 to 1 1 to 3 3 to 6 6 to 12 1 to 5 over 5 Interest AverageTotal month months months months years years Bearing Rate
$M $M $M $M $M $M $M $M %
AustraliaAssetsCash and liquid assets 2,506 1,548 - 7 - - - 951 3.59Receivables due from otherfinancial institutions 4,159 2,540 1,508 18 8 - - 85 6.64Trading securities 5,480 5,480 - - - - - - 6.07Investment securities 4,146 1,288 220 413 108 1,323 788 6 8.13Loans, advances and other receivables 116,747 65,192 8,130 7,193 12,714 23,174 1,724 (1,380) 7.55Bank acceptances of customers 11,107 - - - - - - 11,107 -Life insurance investment assets (3) 23,385 3,110 890 70 555 2,735 3,768 12,257 2.86Deposits with regulatory authorities - - - - - - - - -Property, plant and equipment 861 - - - - - - 861 -Goodwill 5,899 - - - - - - 5,899 -Other assets 14,448 - - - - - - 14,448 -Total Assets 188,738 79,158 10,748 7,701 13,385 27,232 6,280 44,234 5.58
LiabilitiesDeposits and other public borrowings 99,816 57,491 9,448 10,607 7,394 6,654 2,244 5,978 4.27Payables due to otherfinancial institutions 1,569 1,145 424 - - - - - 6.05Bank acceptances 11,107 - - - - - - 11,107 -Provision for dividend 708 - - - - - - 708 -Income tax liability 1,740 - - - - - - 1,740 -Other provisions 1,321 - - - - - - 1,321 -Life insurance policy liabilities 21,975 - - - - - - 21,975 -Debt issues 17,520 5,514 5,140 872 1,609 4,001 384 - 6.26Bills payable and other liabilities 10,942 - - - - - - 10,942 -
Loan Capital 5,220 795 1,845 182 - 394 2,004 - 7.31Total Liabilities 171,918 64,945 16,857 11,661 9,003 11,049 4,632 53,771 3.39
Shareholders Equity 17,472 - - - - - - 17,472Outside equity interests incontrolled entities 744 - - - - - - 744Total Shareholders’ Equity 18,216 - - - - - - 18,216
Off Balance Sheet ItemsSwaps (1,158) (5,774) 1,282 719 2,199 2,732 -FRAs (2) - - - - - - - (1)
Futures (2) 181 - (595) 446 (37) 5 - (1)
Net Mismatch (2) 13,236 (11,883) (3,273) 5,547 18,345 4,385 (27,753) (1)
Cumulative Mismatch (2) 13,236 1,353 (1,920) 3,627 21,972 26,357 (1,396) (1)
(1) no rate applicable(2) no balance sheet amount applicable(3) With the introduction of Australian Accounting Standard AASB 1038: Life Insurance Business, the contractual repricing
of Life insurance investment assets has been included in the Interest Rate Risk Sensitivity table for the first time for thefinancial year ended 30 June 2000. The interest income on these assets supports the life insurance policies issued bythe Group’s life companies and does not contribute to market risk within the banking book.

COMMONWEALTH BANK OF AUSTRALIA AND CONTROLLED ENTITIES
Notes to the financial statements
132
NOTE 39 Market Risk continuedRepricing Period at 30 June 2000
Balance Not WeightedSheet 0 to 1 1 to 3 3 to 6 6 to 12 1 to 5 over 5 Interest AverageTotal month months months months years years Bearing Rate
$M $M $M $M $M $M $M $M %
OverseasAssetsCash and liquid assets 69 - 8 24 - - - 37 2.13Receivables due from otherfinancial institutions 995 479 240 216 23 - - 37 5.85Trading securities 1,867 483 790 254 137 144 59 - 6.62Investment securities 5,003 201 1,710 171 164 1,281 1,476 - 7.91Loans, advances and other receivables 15,516 6,338 1,453 1,470 1,962 4,076 391 (174) 7.86Bank acceptances of customers - - - - - - - - -Life insurance investment assets 3,651 115 301 193 194 354 595 1,899 3.17Deposits with regulatory authorities 46 10 - - - 33 - 3 1.59Property, plant and equipment 212 - - - - - - 212 -Goodwill 6 - - - - - - 6 -Other assets 2,156 - - - - - - 2,156 -Total Assets 29,521 7,626 4,502 2,328 2,480 5,888 2,521 4,176 6.49
LiabilitiesDeposits and other public borrowings 12,778 6,626 3,581 1,221 972 315 1 62 5.50Payables due to otherfinancial institutions 3,064 1,652 816 370 226 - - - 6.12Bank acceptances - - - - - - - - -Provision for dividend - - - - - - - - -Income tax liability 83 - - - - - - 83 -Other provisions 233 - - - - - - 233 -Life insurance policy liabilities 3,307 - - - - - - 3,307 -Debt issues 7,755 650 4,530 640 818 709 408 - 5.26Bills payable and other liabilities 607 - - - - - - 607 -
Loan Capital 79 - - - - 79 - - 7.46Total Liabilities 27,906 8,928 8,927 2,231 2,016 1,103 409 4,292 4.67
Shareholders Equity - - - - - - - -Outside equity interests incontrolled entities 219 - - - - - - 219Total Shareholders’ Equity 219 - - - - - - 219
Off Balance Sheet ItemsSwaps (2) (261) 2,032 463 (185) (1,323) (726) - (1)
Options (2) - 670 (670) - - - - (1)
FRAs (2) 94 1 (252) 157 - - - (1)
Futures (2) - - - - - - - (1)
Net Mismatch (2) (1,469) (1,722) (362) 436 3,462 1,386 (335) (1)
Cumulative Mismatch (2) (1,469) (3,191) (3,553) (3,117) 345 1,731 1,396 (1)
(1) no rate applicable(2) no balance sheet amount applicable
Foreign exchange riskForeign exchange risk is the risk to earnings caused
by a change in foreign exchange rates.The Group hedges all balance sheet foreign
exchange risk except for long term investments inoffshore subsidiaries. An adverse movement of 10% inforeign exchange rates would cause the Group’s capitaladequacy ratio to deteriorate by less than 0.3% (2000:less than 0.3%)
Net deferred gains and lossesNet deferred unrealised gains and losses arising
from derivative hedging contracts entered into in order tomanage the risk arising from assets, liabilities,commitments or anticipated future transactions, togetherwith the expected term of deferral are shown below.

Notes to the financial statements
133
NOTE 39 Market Risk continued
As at 30 June Exchange rate Interest rateRelated contracts Related contracts Total2001 2000 2001 2000 2001 2000
$M $M $M $M $M $M
Within 6 months 167 341 349 (45) 516 296Within 6 months - 1 year (5) 31 (184) (49) (189) (18)Within 1-2 years (229) 24 (90) (28) (319) (4)Within 2-5 years (69) (33) (38) (27) (107) (60)After 5 years 19 (226) (26) (230) (7) (456)Net deferred gain (loss) (117) (1) 137 11 (379) (106) (242)
(1) The increase in net deferred losses in exchange rate derivative contracts predominantly reflects falls in the AUD/USDexchange rate over the year. These losses are offset by unrecognised net gains in assets and liabilities in the balancesheet.
Net deferred gains and losses are only in respect ofderivatives and must be considered in the context of thetotal interest rate and foreign exchange risk of thebalance sheet. The deferred gains and losses on bothderivatives and on balance sheet assets and liabilities areincluded in the economic value at risk measure outlinedabove.
Additionally, there are $107 million of net deferredlosses on derivatives (2000: $11 million net deferredlosses) used to hedge equity risk on investmentsdisclosed within Note 11.
Market risk in financial servicesMarket risk in the life insurance business arises
from mismatches between assets and liabilitiesguaranteed returns offered on some classes of policy(which may not be capable of being hedged throughmatching assets), adverse movements in market pricesaffecting fee income on investment-linked policies andfrom the returns obtained from investing the shareholderscapital held in each life company. Shareholders funds inthe life insurance business are on average invested 50%in income assets (cash and fixed interest) and 50% ingrowth assets (shares and property), although the assetmix may vary from company to company. Policyholderfunds are invested to meet policyholder reasonableexpectations without putting the shareholder at unduerisk.
Market risk in the funds management business isthe risk of an adverse movement in market prices whichleads to a reduction in the amount of funds undermanagement and a consequent reduction in fee income.
Market Risk in Financial Markets TradingThe Group’s policy is that exposure to market risk
from trading activities is managed by InstitutionalBanking. The Group trades and distributes financialmarkets products and provides risk management servicesto clients on a global basis.
The objectives of the Group’s financial marketsactivities are to:� Provide risk management products and services to
customers;
� Manage the Group’s own market risks; and� Conduct controlled trading in pursuit of profit,
leveraging off the Bank’s market presence andexpertise.The Group maintains access to markets by quoting
bid and offer prices with other market makers and carriesan inventory of treasury and capital market instruments,including a broad range of securities and derivatives.
In foreign exchange, the Group is a participant in allmajor currencies and is a major participant in theAustralian dollar market, providing services for centralbanks, institutional, corporate and retail customers.Positions are also taken in the interest rate, debt, equityand commodity markets based on views of future marketmovements. Trading securities are further detailed inNote 10 of the financial statements.
Income is earned from spreads achieved throughmarket-making and from taking market risk. All tradingpositions are valued and taken to profit and loss on amark to market basis. Trading profits also take accountof interest, dividends and funding costs relating to tradingactivities. Market liquidity risk is controlled byconcentrating trading activity in highly liquid markets.
Note 3 of the financial statements details FinancialMarkets Trading Income contribution of $426 million(2000: $311 million) to the income of the Group. Thecontribution is significant and provides importantdiversification benefits to the Group.
Residual Value Risk on Operating LeasesThe Group provides operating leases to customers
on equipment such as motor vehicles, computers andindustrial equipment. A residual value risk arises whenequipment is not fully depreciated at lease expiry.Residual value risk is the risk that the amount recoupedby selling the equipment at lease expiry will be less thanthe residual value on the lease.
In managing the risk the Group utilises industryexperts to ensure that the residual value of equipment isprudently estimated at the start of the lease and theGroup realises the maximum value of the equipment atlease expiry.

COMMONWEALTH BANK OF AUSTRALIA AND CONTROLLED ENTITIES
Notes to the financial statements
134
NOTE 39 Market Risk continued
Derivative contractsThe following table details the Group’s outstanding
derivative contracts as at the end of the year.Each derivative type is split between those held for
‘Trading’ purposes and those for ‘Other than Trading’purposes. Derivatives classified as ‘Other than Trading’are transactions entered into in order to manage the risksarising from non-traded assets, liabilities andcommitments in Australia and offshore centres.
The ‘Face Value’ is the notional or contractualamount of the derivatives. This amount is not necessarilyexchanged and predominantly acts as reference valueupon which interest payments and net settlements can becalculated and on which revaluation is based.
The ‘Credit Equivalent’ is calculated usinga standard APRA formula and is disclosed for eachproduct class. This amount is a measure of the onbalance sheet loan equivalent of the derivative contracts,which includes a specified percentage of the face value ofeach contract plus the market value of all contracts withan unrealised gain at balance date. The Credit Equivalentdoes not take into account any benefits of nettingexposures to individual counterparties.
The accounting policy for derivative financialinstruments is set out in Note 1(gg).
GROUPFace Value Credit Equivalent
2001 2000 2001 2000$M $M $M $M
DerivativesExchange rate related contractsForwardsTrading 114,962 112,949 4,295 3,374Other than trading 1,771 1,323 17 1Total Forwards 116,733 114,272 4,312 3,375SwapsTrading 23,196 14,151 1,946 1,235Other than trading 8,661 12,010 1,588 1,726Total Swaps 31,857 26,161 3,534 2,961FuturesTrading 417 324 - -Other than trading - - - -Total Futures 417 324 - -Options purchased and soldTrading 34,261 39,375 704 626Other than trading - - - -Total Options purchased and sold 34,261 39,375 704 626Total exchange rate related contracts 183,268 180,132 8,550 6,962
Interest rate related contractsForwardsTrading 23,477 18,002 2 4Other than trading 7,074 6,192 1 2Total Forwards 30,551 24,194 3 6SwapsTrading 97,822 119,120 1,671 1,865Other than trading 79,989 51,060 1,510 1,254Total Swaps 177,811 170,180 3,181 3,119FuturesTrading 45,367 33,583 - -Other than trading 20 1,142 - -Total Futures 45,387 34,725 - -Options purchased and soldTrading 12,265 12,292 123 128Other than trading 79 737 79 67Total Options purchased and sold 12,344 13,029 202 195Total interest rate related contracts 266,093 242,128 3,386 3,320
Equity risk related contractsSwapsOther than trading 278 278 - -Total equity risk related contracts 278 278 - -Total derivatives exposures 449,639 422,538 11,936 10,282

Notes to the financial statements
135
NOTE 39 Market Risk continued
The fair or market value of trading derivativecontracts, disaggregated into gross unrealised gains andgross unrealised losses, are shown below. In line with theGroup’s accounting policy, these unrealised gains andlosses are recognised immediately in profit and loss, andtogether with net realised gains on trading derivatives and
realised and unrealised gains and losses on tradingsecurities, are reported within trading income underforeign exchange earnings or other financial instruments(refer Note 3). In aggregate, derivatives trading wasprofitable for the Group during the year.
Fair Value Average Fair Value2001 2000 2001 2000
$M $M $M $M
Exchange rate related contractsForward contracts Gross unrealised gains 3,125 2,263 4,066 1,829 Gross unrealised losses (2,020) (1,828) (3,120) (1,446)
1,105 435 946 383Swaps Gross unrealised gains 2,990 1,509 2,535 1,364 Gross unrealised losses (3,025) (1,389) (2,663) (1,316)
(35) 120 (128) 48Futures Gross unrealised gains 2 3 3 5 Gross unrealised losses - (5) (2) (5)
2 (2) 1 -Options purchased and sold Gross unrealised gains 504 381 579 342 Gross unrealised losses (283) (255) (354) (252)
221 126 225 90Net Unrealised Gains on exchange Rate Related Contracts 1,293 679 1,044 521
Interest rate related contractsForward contracts Gross unrealised gains 7 6 5 10 Gross unrealised losses (7) (5) (6) (10)
- 1 (1) -Swaps Gross unrealised gains 2,874 2,029 2,736 1,759 Gross unrealised losses (3,324) (2,056) (3,082) (1,922)
(450) (27) (346) (163)Futures Gross unrealised gains 19 14 33 14 Gross unrealised losses (27) (22) (24) (13)
(8) (8) 9 1Options purchased and sold Gross unrealised gains 71 47 67 35 Gross unrealised losses (73) (45) (57) (46)
(2) 2 10 (11)Net Unrealised Losses on Interest Rate Related Contracts (460) (32) (328) (173)Net Unrealised Gains on Trading Derivative Contracts 833 647 716 348
In accordance with the accounting policy set out in Note 1(gg) the above trading derivative contract revaluations havebeen presented on a gross basis on the balance sheet.
Unrealised gains on trading derivatives (Note 21) 9,592 6,252Unrealised losses on trading derivatives (Note 27) 8,759 5,605Net unrealised gains on trading derivatives 833 647

COMMONWEALTH BANK OF AUSTRALIA AND CONTROLLED ENTITIES
Notes to the financial statements
136
NOTE 40 Superannuation Commitments
The Group sponsors a range of superannuation plans for its employees world wide. Details of major defined benefitplans with assets in excess of $10 million are:
Name of Plan Type Form of Benefit Date of Last Assessment
Officers’ Superannuation Fund (OSF) Defined Benefits andAccumulation
Indexed pensions andlump sums
30 June 2000
Commonwealth Bank of Australia (UK)Staff Benefits Scheme (CBA(UK)SBS)
Defined Benefits andAccumulation
Indexed pensions andlump sums
1 May 1999
The Colonial Group Staff SuperannuationScheme (CGSSS)
Defined Benefits andAccumulation
Indexed pensions andlump sums
30 June 1998
Colonial UK Staff Pension Scheme(CUKSPS)
Defined Benefits Indexed pensions andlump sums
5 April 2000
Stewart Ivory & Company LimitedRetirement Benefits Scheme (SI&CRBS)
Defined Benefits Indexed pensions andlump sums
1 September 1998
Financial Details of Defined Benefits PlansCBA SI&
OSF (UK) SBS CGSSS(1)(2) CUK SPS(3) CRBS Total$M $M $M $M $M $M
Net Market Value of Assets 5,566 126 610 341 24 6,667Present Value of Accrued Benefits 3,812 60 310 312 22 4,516Difference between Net Market of Assetsand Present Value of Accrued Benefits 1,754 66 300 29 2 2,151Difference as a percentage of plan assets 32% 52% 49% 9% 8% 32%Value of Vested Benefits 3,812 61 337 292 20 4,522
(1) The Colonial Group Staff Superannuation Scheme values include the values, as at 30 June 1996, of the formerPrudential Australia Superannuation Scheme, the Prudential Australia Superannuation Scheme No. 2 and thePrudential Australia Staff Pension Scheme. Members of these funds were transferred to the Colonial Scheme effective1 April 1999.
(2) The Colonial Group Staff Superannuation Scheme values also include the values, as at 30 June 1999, of the formerTrust Bank Staff Superannuation Scheme. Members of this fund were transferred to the Colonial Scheme effective30 June 2000.
(3) The Colonial UK life insurance business was sold in June 2000, which will result in a significant portion of these vestedbenefits being transferred out of this plan. An actuarial assessment is currently in progress. Initial indications are thatthere may be a small deficit in the scheme; however, this deficit would be immaterial in a Group context.
The above values have been extracted fromfinancial statements and actuarial assessments of eachplan which have been prepared in accordance withrelevant accounting and actuarial standards andpractices.
ContributionsFor the plans listed in the above table, entities of
the Group contribute to the respective plans inaccordance with the Trust Deeds following the receipt ofactuarial advice.
With the exception of contributions relating to salarysacrifice benefits, the Bank ceased contributions to theOSF from 8 July 1994. Further, the Bank ceasedcontributions to the OSF relating to salary sacrificebenefits from 1 July 1997.
An actuarial assessment of the OSF, as at 30 June2000 was completed during the year ended 30 June2001. In line with the actuarial advice contained in theassessment, the Bank does not intend to makecontributions to the OSF until after consideration of thenext actuarial assessment of the OSF as at 30 June2003.
No employer contributions were made to theCGSSS during the year and the Bank does not intend tomake contributions to the CGSSS until after considerationof the next actuarial assessment of CGSSS. Further,contributions ceased to the CGSSS relating to salarysacrifice benefits from 1 July 1999.
Transfer OfferDuring the year, the Group provided members of
the defined benefit divisions of the OSF with anopportunity to voluntarily move their superannuation tothe accumulation division. This resulted in $965 million(26%) of defined benefit liabilities being transferred to theaccumulation division.

Notes to the financial statements
137
NOTE 41 Controlled EntitiesExtent of Incorporated in
Entity Name BeneficialInterest ifnot 100%
AUSTRALIA(a) Banking Commonwealth Bank of Australia Australia Controlled Entities: Commonwealth Development Bank of Australia Limited Australia CBA Investments Limited Australia CBA Specialised Financing Limited Australia Share Investments Pty Limited Australia CBA Investments (No 2) Pty Limited Australia CBA International Finance Pty Limited Australia CBCL Australia Limited Australia CBFC Limited Australia Collateral Leasing Pty Limited Australia Commonwealth Securities Limited Australia Homepath Pty Limited Australia Chullora Equity Investments (No.2) Pty Limited * Australia Chullora Equity Investments (No.3) Pty Limited * Australia Commonwealth Insurance Limited Australia Commonwealth Investments Pty Limited * Australia Commonwealth Property Limited Australia Infravest (No. 2) Limited Australia Commonwealth Fleet Lease Pty Limited Australia Micropay Pty Limited Australia Retail Investor Pty Limited Australia Sparad (no. 20) Pty Limited Australia Sparad (no. 24) Pty Limited Australia Colonial Employee Share Plan Limited Australia Colonial Finance Limited Australia Colonial Financial Services Pty Limited Australia CST Securitisation Management Limited Australia Emerald Holding Company Limited Australia
(b) Life Insurance and Funds Management Commonwealth Custodial Services Limited Australia Commonwealth Insurance Holdings Limited Australia Commonwealth Life Limited Australia CLL Investments Limited Australia CIF (Hazelwood) Pty Limited Australia Commonwealth Investment Services Limited Group Commonwealth Investment Services Limited Australia Commonwealth Managed Investments Limited Australia CISL (Hazelwood) Pty Limited Australia Commonwealth Funds Management Limited Group Commonwealth Funds Management Limited Australia CFM (ADF) Limited Australia CFML Nominees Pty Limited Australia Commonwealth Diversified Credit Fund (1)
CMG Asia Pty Limited Australia CMG First State Investment Managers (Asia) Limited Australia Colonial AFS Services Pty Limited Australia Colonial Financial Corporation Limited Australia Colonial First State Investments Group Limited Australia Colonial First State Managed Services Limited Australia Colonial First State Property Limited Australia Colonial Holding Company Pty Limited Australia Colonial Holding Company (No.2) Pty Limited Australia Colonial Insurance Services Pty Limited Australia Colonial International Holdings Pty Limited Australia Colonial Investments Holding Pty Limited Australia Colonial Investment Services Limited Australia Colonial LGA Holdings Limited Australia Colonial Mutual Funds Limited Australia The Colonial Mutual Life Assurance Society Limited Australia Colonial Mutual Superannuation Pty Limited Australia

COMMONWEALTH BANK OF AUSTRALIA AND CONTROLLED ENTITIES
Notes to the financial statements
138
NOTE 41 Controlled Entities continuedExtent of Incorporated in
Entity Name BeneficialInterest ifnot 100%
(b) Life Insurance and Funds Management continued Colonial PCA Holdings Pty Limited Australia Colonial PCA Services Limited Australia Colonial Portfolio Services Limited Australia Colonial Promotions Pty Limited Australia Colonial Services Pty Limited Australia Comsec Trading Limited Australia Jacques Martin Pty Limited Australia
NEW ZEALAND(a) Banking ASB Group Limited New Zealand ASB Bank Limited New Zealand ASB Finance Limited New Zealand ASB Management Services Limited New Zealand ASB Properties Limited New Zealand ASB Superannuation Nominees Limited New Zealand CBA Funding (NZ) Limited New Zealand(b) Life Insurance and Funds Management ASB Group Limited New Zealand ASB Life Limited New Zealand Sovereign Limited New Zealand Colonial First State Investment Managers (NZ) Limited New Zealand Colonial First State Investments (NZ) Limited New Zealand Colonial Holding Company NZ Limited New Zealand Colonial Life (NZ) Limited New Zealand Colonial Service Corporation New Zealand Limited New Zealand
OTHER OVERSEAS(a) Banking CBA Asia Limited Singapore CBA (Europe) Finance Limited United Kingdom CBA (Delaware) Finance Incorporated USA Central Real Estate Holdings Group Central Real Estate Holdings Corporation USA Wilshire 10880 Corporation USA Wilshire 10960 Corporation USA CTB Australia Limited Hong Kong Senator House Investments (UK) Limited (2) United Kingdom Commonwealth Securities (Japan) Pty Limited Japan SBV Asia Limited Hong Kong Colonial (UK) Trustees Limited United Kingdom Colonial Finance (UK) Limited United Kingdom National Bank of Fiji Limited 51 Fiji PT Bank Commonwealth Indonesia(b) Life Insurance and Funds Management CMG Asia Life Holdings Limited Bermuda CMG Asia Limited Bermuda CMG Asia Pensions and Retirements Limited Hong Kong CMG First State Investments (Hong Kong) Limited Hong Kong CMG First State Singapore Limited Singapore CMG Life Insurance Co Inc Philippines Colonial Fiji Life Limited Fiji Colonial First State International Assets Limited United Kingdom Colonial First State Investments (Fiji) Limited Fiji Colonial First State Investment Managers (UK) Limited United Kingdom Colonial Healthcare (Fiji) Limited Fiji Colonial Services (Fiji) Limited Fiji Colonial First State UK Holdings Limited United Kingdom Stewart Ivory Holdings Limited United Kingdom CMG Holdings (Thailand) Co. Ltd 74 Thailand
Non-operating and minor operating controlled entities and investment vehicles holding policyholder assets are excluded fromthe above list.(1) Wholly owned unit trust.(2) Wholly owned subsidiary of CBA International Finance Pty Limited.* Small proprietory companies not requiring audit.

Notes to the financial statements
139
NOTE 42 Investments in Associated Entities and Joint Ventures
Extent of Principal Activities BalanceGROUP Ownership Date
2001 2000 Interest$M $M %
EDS (Australia) Pty Limited 238 238 35 Information Technology Services 31 DecemberIPAC Securities Limited (1) - 23 50 Funds Manager 30 JunePT Bank BII Commonwealth (2) - 10 50 Banking in Indonesia 31 DecemberElectronic Financial Technologies Pty Ltd (1) - - 50 Financial Technology
Development30 June
Computer Fleet Management 3 5 50 Desktop IT Lease Management 30 JuneProperty Internet PLC 5 8 24 Online residential property
information provider31 March
Alliance Group Holdings 2 2 33 Receivables Management 30 JuneCyberlynx Procurement Services 1 - 30 Procurement Services 30 JuneEON CMG Life Assurance Bhd 16 13 40 Life insurance - Malaysia 31 DecemberPT Astra CMG Life 9 7 50 Life insurance - Indonesia 31 DecemberAyudhya CMG Life Assurance PLC 61 48 48 Life insurance - Thailand 31 DecemberChina Life CMG Life Assurance CompanyLimited
36 35 49 Life insurance - China 31 December
Bao Minh CMG Life Insurance Company 6 5 50 Life insurance - Vietnam 31 DecemberCMG Mahon (China) Investment ManagementLimited
- - 50 Direct investment in China 30 June
Mahon and Associates Limited - - 50 Investment management 30 JuneCMG CH China Funds Management Limited - - 50 Investment management 31 MarchAvanteos Pty Ltd 22 - 50 Technology and Development 31 DecemberColonial First State Private Ltd (2) (3) - 4 50 Investment management 30 JuneJacques Martin Industry Funds AdministrationPty Limited (’JMIFA’)
1 5 50 Industry superannuation 30 June
TOTAL 400 403
(1) Sold during financial year 2001.(2) The Group acquired control during the financial year 2001. These investments are now consolidated in the Group
accounts.(3) Changed its name from Hambro Gratham Ltd following the Group’s acquisition of the remaining 50%.
The Group also holds investments in the ColonialFirst State Property Trust Group and Colonial MastertrustWholesale equity funds (including the Fixed Interest,Australian Share, International Share, PropertySecurities, Capital Stable, Balanced and DiversifiedGrowth funds) through controlled life insurance entitieswhich are not accounted for under the equity accountingmethod.
Instead, the market values for these investmentsare calculated at balance date and are brought to accountat this value in compliance with the requirements ofAASB 1038: Life Insurance Business. These investmentsare classified as property or equity investments and arenot material components of these asset categories.
GROUP2001 2000
$M $M
Share of associates' profits (losses) after notional goodwill amortisation Operating profits (losses) before income tax (4) (1) Income tax expense - - Operating profits (losses) after income tax (4) (1)
Carrying amount of investments in associated entities Opening balance 403 281 New investments 39 10 Disposals / transfers (16) - Writedown value of investments (2) - Fair value adjustments (20) - Investments arising from Colonial Acquisition - 117 Share of associates' profits (losses) (4) (1) Foreign exchange adjustment - (4) Closing Balance 400 403
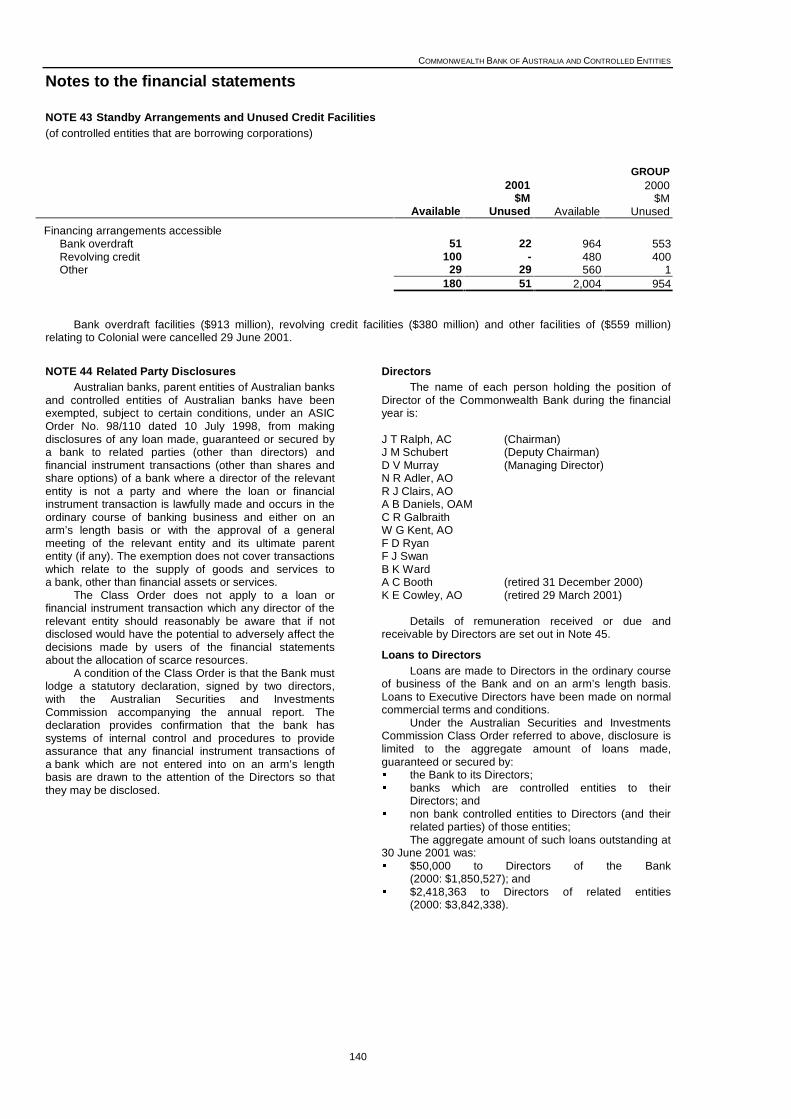
COMMONWEALTH BANK OF AUSTRALIA AND CONTROLLED ENTITIES
Notes to the financial statements
140
NOTE 43 Standby Arrangements and Unused Credit Facilities(of controlled entities that are borrowing corporations)
GROUP2001 2000
$M $MAvailable Unused Available Unused
Financing arrangements accessible Bank overdraft 51 22 964 553 Revolving credit 100 - 480 400 Other 29 29 560 1
180 51 2,004 954
Bank overdraft facilities ($913 million), revolving credit facilities ($380 million) and other facilities of ($559 million)relating to Colonial were cancelled 29 June 2001.
NOTE 44 Related Party DisclosuresAustralian banks, parent entities of Australian banks
and controlled entities of Australian banks have beenexempted, subject to certain conditions, under an ASICOrder No. 98/110 dated 10 July 1998, from makingdisclosures of any loan made, guaranteed or secured bya bank to related parties (other than directors) andfinancial instrument transactions (other than shares andshare options) of a bank where a director of the relevantentity is not a party and where the loan or financialinstrument transaction is lawfully made and occurs in theordinary course of banking business and either on anarm’s length basis or with the approval of a generalmeeting of the relevant entity and its ultimate parententity (if any). The exemption does not cover transactionswhich relate to the supply of goods and services toa bank, other than financial assets or services.
The Class Order does not apply to a loan orfinancial instrument transaction which any director of therelevant entity should reasonably be aware that if notdisclosed would have the potential to adversely affect thedecisions made by users of the financial statementsabout the allocation of scarce resources.
A condition of the Class Order is that the Bank mustlodge a statutory declaration, signed by two directors,with the Australian Securities and InvestmentsCommission accompanying the annual report. Thedeclaration provides confirmation that the bank hassystems of internal control and procedures to provideassurance that any financial instrument transactions ofa bank which are not entered into on an arm’s lengthbasis are drawn to the attention of the Directors so thatthey may be disclosed.
DirectorsThe name of each person holding the position of
Director of the Commonwealth Bank during the financialyear is:
J T Ralph, AC (Chairman)J M Schubert (Deputy Chairman)D V Murray (Managing Director)N R Adler, AOR J Clairs, AOA B Daniels, OAMC R GalbraithW G Kent, AOF D RyanF J SwanB K WardA C Booth (retired 31 December 2000)K E Cowley, AO (retired 29 March 2001)
Details of remuneration received or due andreceivable by Directors are set out in Note 45.
Loans to DirectorsLoans are made to Directors in the ordinary course
of business of the Bank and on an arm’s length basis.Loans to Executive Directors have been made on normalcommercial terms and conditions.
Under the Australian Securities and InvestmentsCommission Class Order referred to above, disclosure islimited to the aggregate amount of loans made,guaranteed or secured by:� the Bank to its Directors;� banks which are controlled entities to their
Directors; and� non bank controlled entities to Directors (and their
related parties) of those entities;The aggregate amount of such loans outstanding at
30 June 2001 was:� $50,000 to Directors of the Bank
(2000: $1,850,527); and� $2,418,363 to Directors of related entities
(2000: $3,842,338).

Notes to the financial statements
141
NOTE 44 Related Party Disclosures continuedThe aggregate amount of such loans received and repayments made was:
Loans Received Repayments Made2001 2000 2001 2000
$ $ $ $
Directors of the CBA Normal terms and conditions (1) - - 318,000 63,418Directors of related entities Normal terms and conditions (2) 3,693,546 132,356 2,482,653 354,517
(1) Directors: K E Cowley, F D Ryan and B K Ward.(2) Directors: G J Judd, R J Norris, R Boven, P Polson, A Hanna, R G Wilkie, C B Millett, S Vuetaki, C Kamea, J Wong
and A V Villamor.
Shares of DirectorsThe aggregate number of shares acquired by, disposed of and held by Directors and their director related entities in
the Commonwealth Bank during the financial year ended 30 June 2001, were:
Held HeldDirector 30 June 2000 Shares Acquired Shares Disposed Of 30 June 2001
Ordinary Ordinary Ordinary OrdinaryJ T Ralph 11,192 1,066 - 12,258J M Schubert 9,914 947 10,861D V Murray 50,387 501,916 (505,195) 47,108N R Adler 9,543 611 (2,198) 7,956R J Clairs 10,000 334 10,334A B Daniels 11,823 778 12,601C R Galbraith 3,874 495 4,369W G Kent 7,519 371 7,890F D Ryan 4,000 334 4,334F J Swan 1,922 441 (293) 2,070B K Ward 1,837 420 2,257A C Booth (retired 31 December 2000) 1,131 (1,000) n/aK E Cowley (retired 29 March 2001) 8,000 693 n/a
All shares were acquired by Directors on normalterms and conditions or through the Non-ExecutiveDirectors Share Plan (or in the case of Mr D V Murray theExecutive Option Plan). Mr D V Murray exercised500,000 options during the year, leaving his total holdingsof options at 1,500,000 under the Executive Option Plan.For further details on the Non-Executive Directors SharePlan and the Executive Option Plan refer Note 29.
Additionally, Mr J T Ralph beneficially holds100,000 units in the Commonwealth Property Trust,a related entity.
Other Transactions of Directors and Other RelatedParties
Financial Instrument TransactionsFinancial instrument transactions (other than loans
and shares disclosed above) of Directors of the Bank andother banks which are controlled entities occur in theordinary course of business of the banks on an arm’slength basis.
Under the Australian Securities and InvestmentsCommission Class Order referred to above, disclosure offinancial instrument transactions regularly made bya bank is limited to disclosure of such transactions witha Director of the entity concerned.
All such financial instrument transactions that haveoccurred between the banks and their Directors havebeen trivial or domestic and were in the nature of normalpersonal banking and deposit transactions.
Transactions other than Financial InstrumentTransactions of BanksAll other transactions with Directors, director related
entities and other related parties are conducted on anarm’s length basis in the normal course of business andon commercial terms and conditions. These transactionsprincipally involve the provision of financial andinvestment services by non bank controlled entities.
All such transactions that have occurred withDirectors, director related entities and other relatedparties have been trivial or domestic and were principallyin the nature of lodgement or withdrawal of deposit andsuperannuation monies.
Controlled EntitiesTransactions with related parties in the Group are
conducted on an arm’s length basis in the normal courseof business and on commercial terms and conditions.These transactions principally arise out of the provision ofbanking services, the acceptance of funds on deposit, thegranting of loans and other associated financial activities.

COMMONWEALTH BANK OF AUSTRALIA AND CONTROLLED ENTITIES
Notes to the financial statements
142
NOTE 44 Related Party Disclosures continuedSupport services are provided by the Bank such as
provision of premises and/or equipment, availability oftransfer payment and accounting facilities through dataprocessing etc, and are transfer charged to the respectiveuser entity at commercial rates.
Refer to Note 41 for details of controlled entities.The Bank’s aggregate investment in and loans to
controlled entities are disclosed in Note 18.
Amounts due to controlled entities are disclosed inthe balance sheet of the Bank.
Details of amounts paid to or received from relatedparties, in the form of dividends or interest, are set out inNote 3.
All transactions between Group entities areeliminated on consolidation.
NOTE 45 Remuneration of Directors
Total amount received or due and receivable by non-executive Directors of the Company for the year ended 30 June2001 was:
Base Fee/Pay Committee Fee Salary Sacrifice(2) Superannuation(1) TotalRemuneration
$ $ $ $ $Non-Executive DirectorsMr J T Ralph, AC 204,099 34,016 41,885 19,049 299,049Dr J M Schubert 83,901 34,904 21,510 9,504 149,819Mr N R Adler, AO 68,033 12,756 14,211 6,463 101,463Mr R J Clairs, AO 68,033 17,008 14,959 7,401 107,401Mr A B Daniels, OAM 68,033 12,756 14,211 7,031 102,031Mr F D Ryan 68,033 17,008 14,959 7,401 107,401Mr F J Swan 68,033 21,260 15,707 7,771 112,771Ms B K Ward 68,033 17,008 14,959 6,803 106,803Mr W G Kent, AO 68,033 9,918 14,447 7,369 99,767Mr C R Galbraith 68,033 9,918 14,447 7,128 99,526Ms A C Booth (3) 39,671 12,603 - 4,234 56,508Mr K E Cowley (4) 52,077 9,764 9,474 5,326 76,641
Executive DirectorMr D V Murray (refer Note 46)
(1) The Bank is currently not contributing to the Officers’ Superannuation Fund. A notional cost of superannuation hasbeen determined on an individual basis for certain of the Directors. Other Directors have superannuation contributionsmade to other funds.
(2) Under the Non-Executive Directors Share Plan detailed in the Explanatory Memorandum to the Notice of Meeting forthe 2000 Annual General Meeting, Non-Executive Directors are required to receive 20% of their remuneration inshares. This was implemented from the second quarter of the year. Also refer Note 29 for further details.
(3) Ms Booth retired 31 December 2000.(4) Mr Cowley retired 29 March 2001.

Notes to the financial statements
143
NOTE 45 Remuneration of Directors continued
Retirement BenefitThe aggregate amount of retirement benefits given by the Bank during the year ended 30 June 2001 was $386,397
(2000: $667,073) being: a payment of $296,065 made to Ms A C Booth and; a payment of $90,332 made to Mr K E Cowleyin accordance with the Corporations Act 2001 and pursuant to the Directors’ Retirement Allowance Scheme approved byshareholders at the 1997 Annual General Meeting.
BANK2001 2000
$ $
Total amount received or due and receivable by executive and non executive Directors(includes accumulated benefits due to Directors who retired during the year) 4,115,750 3,761,277
The number of executive and non-executive Directors whose remuneration fell within these bands was:
Remuneration (Dollars) Number Number$ 0 - $ 10,000 - 2$ 20,001 - $ 30,000 - 2$ 80,001 - $ 90,000 - 2$ 90,001 - $ 100,000 2 2$ 100,001 - $ 110,000 5 2$ 110,001 - $ 120,000 1 -$ 120,001 - $ 130,000 - 1$ 140,001 - $ 150,000 1 -$ 160,001 - $ 170,000 1 ** -$ 220,001 - $ 230,000 - 1$ 290,001 - $ 300,000 1 -$ 350,001 - $ 360,000 1 *** -$ 730,001 - $ 740,000 - 1 *$2,040,000 - $2,049,999 - 1$2,310,000 - $2,319,999 1 -
13 14
* Remuneration includes retirement payment to Mr M A Besley who retired on 28 October 1999.** Remuneration includes retirement payment to Mr K E Cowley who retired on 29 March 2001.*** Remuneration includes retirement payment to Ms A C Booth who retired on 31 December 2000.
GROUP2001 2000
$ $
Total amount received or due and receivable by executiveand non executive Directors of the Bank and controlled entities 11,194,438 6,202,912

COMMONWEALTH BANK OF AUSTRALIA AND CONTROLLED ENTITIES
Notes to the financial statements
144
NOTE 46 Remuneration of ExecutivesThe following table shows remuneration for the executive director and five highest paid other members of the senior
executive team directly reporting to the Managing Director, who were officers of the Bank and the Group for the year ended30 June 2001. The table does not include individuals, who are not direct reports to the Managing Director, whose incentivebased remuneration in any given year may be in excess of that received by a member of the senior executive team.
Senior Executive TeamName & Position Base Pay(1) Bonus(2) Superann- Other Total Option Share
Paid Vested uation(3) Compensation(4) Remuneration Grant(5) Grant(5)
This in CBAYear Shares
$ $ $ $ $ $ Number NumberD V MurrayManaging Director & CEO
1,450,000 450,000 300,000 99,773 10,400 2,310,173 - (6) - (6)
P L PolsonHead of Colonial First StateInvestments Group
600,000 550,000 - 144,480 456,000 1,750,480 100,000 16,800
M A KatzHead of Institutional Banking
750,000 336,000 224,000 67,500 10,400 1,387,900 125,000 20,900
M J UllmerGroup General ManagerFinancial & Risk Management
735,000 276,000 184,000 132,300 10,400 1,337,700 125,000 20,900
J F MulcahyHead of Australian FinancialServices
700,000 246,000 164,000 63,000 10,400 1,183,400 125,000 20,900
R J NorrisHead of InternationalFinancial Services &Managing Director & CEO ofASB Group
680,000 350,000 - n/a n/a 1,030,000 125,000 20,900
(1) Base pay is calculated on a Total Cost basis andincludes any FBT charges related to employeebenefits including motor vehicles.
(2) For the 2000/2001 payment and future bonuspayments, the Group has implemented a vesting(deferral) arrangement for most executives.A portion of the bonus payment is paid immediatelyand the remaining portion is deferred and vested inthe Bank’s shares. Half of the shares will vest afterone year (in 2002) and half will vest after two years(in 2003). In the event of resignation from the Groupbefore the vesting dates, unvested shares willlapse.
(3) The Bank is currently not contributing to theOfficers’ Superannuation Fund or to the ColonialGroup Staff Superannuation Scheme – referNote 40. Notional cost of superannuation has beendetermined on an individual basis for eachexecutive.
(4) Other compensation includes, where applicable, carparking (including FBT) and other payments.
(5) Option Grants are a right to subscribe for ordinaryshares at an exercise price which is the MarketValue (defined as the weighted average of theprices at which the Bank’s ordinary shares weretraded on the ASX during the one week periodbefore the Commencement Date) plus a premiumrepresenting the time value component of the valueof options (based on the actual differences betweenthe dividend and bond yields at the date of thevesting of the right to exercise the options). ShareGrants are awarded under the Equity Reward Plan.
Shares are registered in the name of the Trustee.No consideration is payable by the executive for thegrant of shares. The transfer of legal title to theexecutive is subject to vesting conditions. Theability to exercise options and the vesting of theshares is conditional on the Bank achieving aprescribed performance hurdle. To reach theperformance hurdle, the Bank’s Total ShareholderReturn (broadly, growth in share price plusdividends reinvested) over a minimum three yearperiod, must equal or exceed the index of TotalShareholder Return achieved by companiesrepresented in the ASX Banks and FinanceAccumulation Index, excluding the Bank. If theperformance hurdle is not reached within that threeyears, the options and shares may nevertheless beexercisable or vest as appropriate only where thehurdle is subsequently reached within five yearsfrom the Commencement Date. If the performancehurdle is not met, the options will have nil value andthe shares will be forfeited. The options and sharesare subject to a performance hurdle, theachievement of which is uncertain. Theapproximate value of options and shares at the timeof grant was $4.50 and $27 respectively. For furtherdetails on the Executive Option Plan and the EquityReward Plan refer Note 29.
(6) At the 2000 Annual General Meeting shareholdersapproved that, prior to the 2001 Annual GeneralMeeting, the Managing Director be invited to takeup no more than 250,000 options and be given theright to acquire up to 42,000 shares under theEquity Reward Plan.

Notes to the financial statements
145
NOTE 46 Remuneration of Executives continued
The following table shows the number of executives whose remuneration fell within the stated bands:
GROUP BANK2001 2000 2001 2000
Number Number Number Number
Remuneration (Dollars)
$ 100,000 - $ 109,999 1 - 1 -$ 290,000 - $ 299,999 - 1 - 1$ 310,000 - $ 319,999 1 - 1 -$ 320,000 - $ 329,999 1 - 1 -$ 350,000 - $ 359,999 - 1 - 1$ 370,000 - $ 379,999 - 1 - 1$ 420,000 - $ 429,999 - 1 - 1$ 450,000 - $ 459,999 1 - 1 -$ 460,000 - $ 469,999 - 1 - 1$ 510,000 - $ 519,999 1 1 1 1$ 520,000 - $ 529,999 2 - 2 -$ 530,000 - $ 539,999 1 - 1 -$ 540,000 - $ 549,999 - 1 - 1$ 550,000 - $ 559,999 - 1 - 1$ 570,000 - $ 579,999 1 - 1 -$ 600,000 - $ 609,999 1 - 1 -$ 650,000 - $ 659,999 - 1 - 1$ 690,000 - $ 699,999 1 - 1 -$ 720,000 - $ 729,999 - 2 - 2$ 770,000 - $ 779,999 1 - 1 -$ 780,000 - $ 789,999 - 1 - 1$ 790,000 - $ 799,999 1 1 1 1$ 820,000 - $ 829,999 - 1 - 1$ 850,000 - $ 859,999 1 - 1 -$ 890,000 - $ 899,999 1 1 1 1$ 970,000 - $ 979,999 1 - 1 -$1,030,000 - $1,039,999 1 1 1 1$1,150,000 - $1,159,999 - 1 - 1$1,180,000 - $1,189,999 1 - 1 -$1,240,000 - $1,249,999 - 1 - 1$1,290,000 - $1,299,999 - 1 - 1$1,330,000 - $1,339,999 1 - 1 -$1,380,000 - $1,389,999 1 - 1 -$1,500,000 - $1,509,999 1 - 1 -$1,750,000 - $1,759,999 1 - 1 -$1,870,000 - $1,879,999 1 - 1 -$2,040,000 - $2,049,999 - 1 - 1$2,050,000 - $2,059,999 1 - 1 -$2,310,000 - $2,319,999 1 - 1 -
Total number of executives 25 20 25 20

COMMONWEALTH BANK OF AUSTRALIA AND CONTROLLED ENTITIES
Notes to the financial statements
146
GROUP BANKNOTE 46 Remuneration of Executives continued 2001 2000 2001 2000
$ $ $ $
Total amount received or due and receivable byexecutives (includes accumulated benefits dueto executives who retired, resigned or wereretrenched during the year). 23,897,371 (1) 15,714,200 23,897,371 (1) 15,714,200
(1) Includes relevant executives from the combined Group, including Colonial. The comparative figure relates to the Groupbefore acquisition of Colonial.
An executive is a person who is directlyaccountable and responsible to the Managing Director, oris a Group employee responsible for the strategicdirection and management of major businesses or riskportfolios.
Remuneration is based on amounts paid andaccrued in respect of the financial year.
The Group’s Policy in respect of executives is that:� Remuneration will be competitively set so that the
Group can attract, motivate and retain high qualitylocal and international executive staff;
� Remuneration will incorporate, to a significantdegree, variable pay for performance elements,both short term and long term focused asappropriate, which will:� reward executives for Group, business unit
and individual performance againstappropriate benchmarks/goals,
� align the interests of executives with those ofshareholders,
� link executive reward with the strategic goalsand performance of the Group, and
� ensure total remuneration is competitive bymarket standards;
� Remuneration will be reviewed annually by theRemuneration Committee through a process thatconsiders Group, business unit and individualperformance, relevant comparative remuneration inthe market and internal and, where appropriate,external advice on policies and practices;
� Remuneration systems will complement andreinforce the Group’s leadership and successionplanning systems; and
� Remuneration and terms and conditions ofemployment will be specified in an individualcontract of employment and signed by the executiveand the Bank.

Notes to the financial statements
147
NOTE 47 Statements of Cash FlowGROUP BANK
2001 2000 1999 2001 2000$M $M $M $M $M
Note (a) Reconciliation of CashFor the purposes of the Statements of Cash Flows, cash includes cash at bankers, money at short call, at call deposits
with other financial institutions and settlement account balances with other banks.
Notes, coins and cash at bankers 1,048 980 784 830 680Other short term liquid assets 544 370 238 339 198Receivables due from other financial institutions - at call 458 1,174 912 262 986Payables due to other financial institutions - at call (2,012) (1,138) (2,491) (1,851) (1,016)Cash and Cash Equivalents at end of year 38 1,386 (557) (420) 848
Note (b) Cash Flows presented on a Net BasisCash flows arising from the following activities are
presented on a net basis in the Statement of Cash Flows:� customer deposits to and withdrawals from deposit
accounts;
� borrowings and repayments on loans, advancesand other receivables;
� sales and purchases of trading securities; and� proceeds from and repayment of short term debt
issues.
GROUP BANKNote (c) Reconciliation of Operating Profit After 2001 2000 1999 2001 2000Income Tax to Net Cash Provided by Operating Activities $M $M $M $M $M
Operating profit after income tax 2,412 2,738 1,446 1,699 1,116Decrease (increase) in interest receivable 159 (948) (1) 7 (158)Increase in interest payable (278) 558 (35) (38) 176Net (increase) decrease in trading securities (262) (50) (408) 171 (892)Net (gain)/loss on sale of investment securities (56) (12) (79) (84) (7)Charge for bad and doubtful debts 385 196 247 276 191Depreciation and amortisation 488 175 192 127 127Other provisions (692) 528 68 (230) 156Increase (decrease) in income taxes payable (371) 248 261 (343) (185)(Decrease) increase in deferred income taxes payable (97) 319 50 (9) 364(Increase) decrease in future income tax benefits 209 (218) (8) (46) (238)Amortisation of premium on investment securities 24 47 206 24 112Unrealised gain on revaluation of trading securities (186) (188) 57 (377) 48Change in excess of net market value over net assets of life 216 - (188)insurance controlled entities (474) (1,165) - - -Other assets 400 - - - -Other 174 259 (36) (19) (11)Net Cash provided by Operating Activities 1,835 2,487 2,176 1,158 611
Note (d) Non cash Financing and Investing ActivitiesShares issued under the Dividend Reinvestment Plan $313 million (2000: $253 million) and Employee Share
Acquisition Plan - $40 million (2000: $24 million). Acquisition of entity by means of an equity issue nil (2000: $9,274 million).
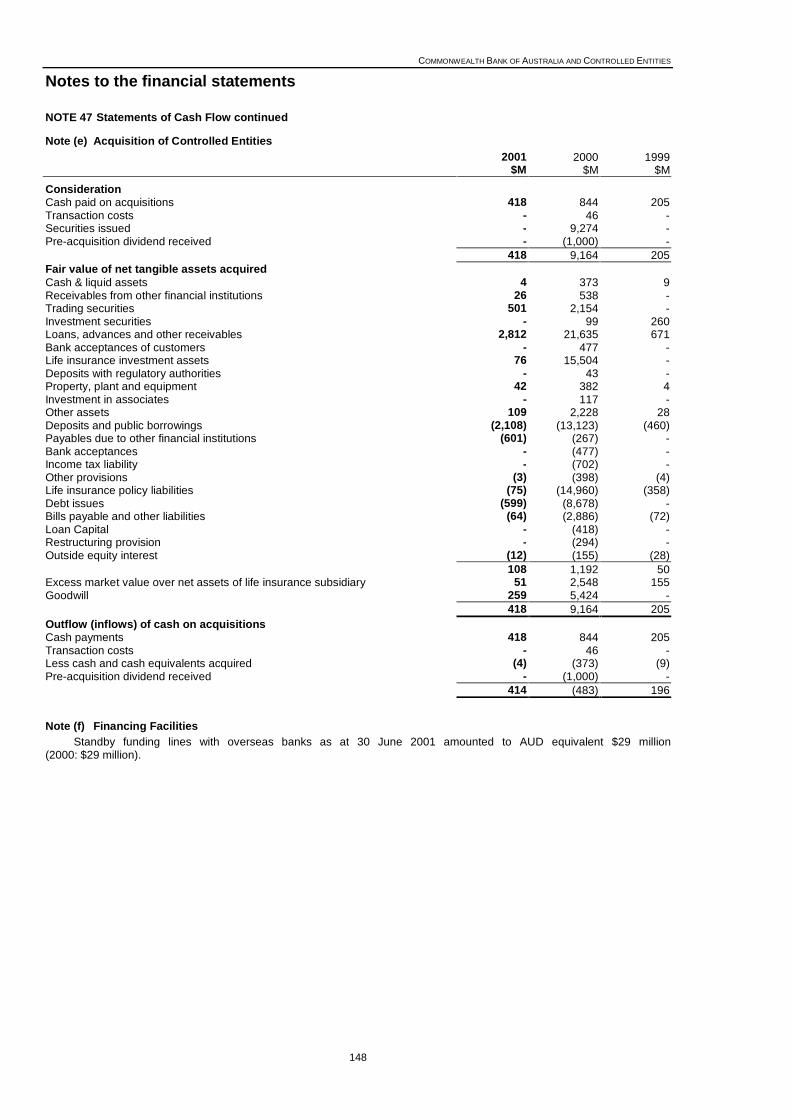
COMMONWEALTH BANK OF AUSTRALIA AND CONTROLLED ENTITIES
Notes to the financial statements
148
NOTE 47 Statements of Cash Flow continued
Note (e) Acquisition of Controlled Entities2001 2000 1999
$M $M $M
ConsiderationCash paid on acquisitions 418 844 205Transaction costs - 46 -Securities issued - 9,274 -Pre-acquisition dividend received - (1,000) -
418 9,164 205Fair value of net tangible assets acquiredCash & liquid assets 4 373 9Receivables from other financial institutions 26 538 -Trading securities 501 2,154 -Investment securities - 99 260Loans, advances and other receivables 2,812 21,635 671Bank acceptances of customers - 477 -Life insurance investment assets 76 15,504 -Deposits with regulatory authorities - 43 -Property, plant and equipment 42 382 4Investment in associates - 117 -Other assets 109 2,228 28Deposits and public borrowings (2,108) (13,123) (460)Payables due to other financial institutions (601) (267) -Bank acceptances - (477) -Income tax liability - (702) -Other provisions (3) (398) (4)Life insurance policy liabilities (75) (14,960) (358)Debt issues (599) (8,678) -Bills payable and other liabilities (64) (2,886) (72)Loan Capital - (418) -Restructuring provision - (294) -Outside equity interest (12) (155) (28)
108 1,192 50Excess market value over net assets of life insurance subsidiary 51 2,548 155Goodwill 259 5,424 -
418 9,164 205Outflow (inflows) of cash on acquisitionsCash payments 418 844 205Transaction costs - 46 -Less cash and cash equivalents acquired (4) (373) (9)Pre-acquisition dividend received - (1,000) -
414 (483) 196
Note (f) Financing FacilitiesStandby funding lines with overseas banks as at 30 June 2001 amounted to AUD equivalent $29 million
(2000: $29 million).

Notes to the financial statements
149
NOTE 48 Disclosures about Fair Value of Financial InstrumentsThese amounts represent estimates of net fair
values at a point in time. Significant estimates regardingeconomic conditions, loss experience, risk characteristicsassociated with particular financial instruments and otherfactors were used for the purposes of this disclosure.These estimates are subjective in nature and involvematters of judgment. Therefore, they cannot bedetermined with precision. Changes in the assumptionscould have a material impact on the amounts estimated.
While the estimated net fair value amounts aredesigned to represent estimates at which theseinstruments could be exchanged in a current transactionbetween willing parties, many of the Group’s financialinstruments lack an available trading market ascharacterised by willing parties engaging in an exchangetransaction. In addition, it is the Bank’s intent to hold mostof its financial instruments to maturity and therefore it isnot probable that the net fair values shown will berealised in a current transaction.
The estimated net fair values disclosed do notreflect the value of assets and liabilities that are notconsidered financial instruments. In addition, the value oflong-term relationships with depositors (core depositintangibles) and other customers (credit card intangibles)are not reflected. The value of these items is significant.
Because of the wide range of valuation techniquesand the numerous estimates which must be made, it maybe difficult to make reasonable comparisons of the Bank’snet fair value information with that of other financialinstitutions. It is important that the many uncertaintiesdiscussed above be considered when using theestimated net fair value disclosures and to realise thatbecause of these uncertainties, the aggregate net fairvalue amount should in no way be construed asrepresentative of the underlying value of theCommonwealth Bank of Australia.
2001 2000Carrying Net Fair Carrying Net Fair
Value Value Value Value$M $M $M $M
AssetsCash and liquid assets 3,709 3,709 2,575 2,575Receivables due from other financial institutions 4,622 4,622 5,154 5,154Trading securities 6,909 6,909 7,347 7,347Investment securities 9,705 9,821 9,149 9,149Loans, advances and other receivables 136,059 137,004 132,263 133,257Bank acceptances of customers 12,075 12,075 11,107 11,107Life insurance investment assets 31,213 31,213 27,036 27,036Deposit accounts with regulatory authorities 61 61 46 46Other assets 13,876 14,213 16,198 16,631
LiabilitiesDeposits and other public borrowings 117,355 117,862 112,594 112,993Payables due to other financial institutions 6,903 6,903 4,633 4,633Bank acceptances 12,075 12,075 11,107 11,107Life insurance policy liabilities 27,029 27,029 25,282 25,282Debt issues 24,484 25,308 25,275 25,321Bills payable and other liabilities 13,806 13,940 11,490 11,646Loan Capital 5,704 5,828 5,299 5,106Asset and liability hedges - unrealised gains/(losses) - (213) - (253)(Refer Note 39)
The net fair value estimates were determined by the following methodologies and assumptions:
Liquid assets and bank acceptances of customersThe carrying values of cash and liquid assets,
receivables due from other financial institutions and bankacceptances of customers approximate their net fairvalue as they are short term in nature or are receivableon demand.
SecuritiesTrading securities are carried at net market/net fair
value and investment securities have their net fair valuedetermined based on quoted market prices, broker ordealer price quotations.
Loans, advances and other receivablesThe carrying value of loans, advances and other
receivables is net of general and specific provisions fordoubtful debts and interest/fees reserved.
For variable rate loans, excluding impaired loans,the carrying amount is a reasonable estimate of net fairvalue. The net fair value for fixed rate loans wascalculated by utilising discounted cash flow models(i.e. the net present value of the portfolio future principaland interest cash flows), based on the maturity of theloans. The discount rates applied were based on thecurrent benchmark rate offered for the average remainingterm of the portfolio plus an add-on of the average creditmargin of the existing portfolio, where appropriate.

COMMONWEALTH BANK OF AUSTRALIA AND CONTROLLED ENTITIES
Notes to the financial statements
150
NOTE 48 Disclosures about Fair Value of Financial Instruments continuedThe net fair value of impaired loans was calculated
by discounting expected cash flows using a rate whichincludes a premium for the uncertainty of the flows.
For shares in companies, the estimated net fairvalues are based on quoted market prices.
Life Insurance Investment Assets & Policy LiabilitiesLife insurance investment assets are carried at net
fair value. Life insurance policy liabilities are measured ona net present value basis. This treatment is in accordancewith accounting standard AASB 1038: Life InsuranceBusiness.
Statutory deposits with central banksIn Australia, and several other countries in which
the Group operates, the law requires that the Grouplodge regulatory deposits with the local central bank ata rate of interest below that generally prevailing in thatmarket. The net fair value is assumed to be equal to thecarrying value as the Group is only able to continue asa going concern with the maintenance of these deposits.
All other financial assetsIncluded in this category are fees receivable,
unrealised income, investments in associates of$400 million (2000: $403 million), and excess of netmarket value over net assets of life insurance controlledentities of $5,136 million (2000: $4,322 million), where thecarrying amount is considered to be a reasonableestimate of net fair value.
Other financial assets are net of goodwill, futureincome tax benefits and prepayments/unamortisedpayments as these do not constitute a financialinstrument.
Deposits and other public borrowingsThe net fair value of non interest bearing, call and
variable rate deposits, and fixed rate deposits repricingwithin six months, is the carrying value as at 30 June.Discounted cash flow models based upon deposit typeand its related maturity, were used to calculate the netfair value of other term deposits.
Short term liabilitiesThe carrying value of payables due to other
financial institutions and bank acceptances approximatetheir net fair value as they are short term in nature andreprice frequently.
Debt issues and loan capitalThe net fair values of debt issues and loan capital
were calculated based on quoted market prices as at30 June.
For those debt issues where quoted market priceswere not available, a discounted cash flow model usinga yield curve appropriate to the remaining maturity of theinstrument was used.
All other financial liabilitiesThis category includes interest payable and
unrealised expenses payable for which the carryingamount is considered to be a reasonable estimate of netfair value. For liabilities which are long term, net fairvalues have been estimated using the rates currentlyoffered for similar liabilities with remaining maturities.
Other provisions including provision for dividend,income tax liability and unamortised receipts are notconsidered financial instruments.
Asset and liability hedgesNet fair value of asset and liability hedges is based
on quoted market prices, broker or dealer pricequotations.
Commitments to extend credit, letters of credit,guarantees, warranties and indemnities issued
The net fair value of these items was not calculatedas estimated fair values are not readily ascertainable.These financial instruments generally relate to credit riskand attract fees in line with market prices for similararrangements. They are not presently sold or traded. Theitems generally do not involve cash payments other thanin the event of default. The fee pricing is set as part of thebroader customer credit process and reflects theprobability of default. The net fair value may berepresented by the present value of fees expected to bereceived, less associated costs. The overall level of feesinvolved is not material.
Other off-balance sheet financial instrumentsThe net fair value of trading and investment
derivative contracts (foreign exchange contracts,currency swaps, exchange rate futures, currency options,forward rate agreements, interest rate swaps, interestrate futures, interest rate options), were obtained fromquoted market prices, discounted cash flow models oroption pricing models as appropriate.
The fair value of these instruments are disclosed inNote 39.

Directors’ Declaration
151
In accordance with a resolution of the directors of the Commonwealth Bank of Australia, we state that in the opinion ofthe Directors:
(a) the financial statements and notes of the Bank and of the Group are in accordance with the Corporations Act 2001,including:(i) giving a true and fair view of the Bank’s and the Group’s financial position as at 30 June 2001 and of their
performance for the year ended on that date; and(ii) complying with Accounting Standards and Corporations Regulations 2001; and
(b) there are reasonable grounds to believe that the Bank will be able to pay its debts as and when they become due andpayable.
Signed in accordance with a resolution of the Directors.
J T Ralph AC D V Murray
Chairman Managing Director
22 August 2001

Independent Audit Report
To the members of Commonwealth Bank of Australia
Matters relating to the Electronic Presentation of the Audited Financial ReportThis audit report relates to the Financial Report of Commonwealth Bank of Australia for the yearended 30 June 2001 included on Bank’s web site. The Bank’s directors are responsible for theintegrity of the Commonwealth Bank’s web site. The audit report refers only to the statementsnamed below. It does not provide an opinion on any other information which may have beenhyperlinked to/from these statements. If users of this report are concerned with the inherent risksarising from electronic data communications they are advised to refer to the hard copy of theaudited Financial Report to confirm the information included in the audited Financial Reportpresented on this web site.
ScopeWe have audited the Financial Report of Commonwealth Bank of Australia for the financial yearended 30 June 2001, as set out on pages 50 to 151, including the Directors’ Declaration. TheFinancial Report includes the financial statements of Commonwealth Bank of Australia and theconsolidated financial statements of the economic entity comprising the Bank and the entities itcontrolled at year’s end or from time to time during the financial year. The Bank's directors areresponsible for the Financial Report. We have conducted an independent audit of the FinancialReport in order to express an opinion on it to the members of the Bank.
Our audit has been conducted in accordance with Australian Auditing Standards to providereasonable assurance whether the Financial Report is free of material misstatement. Ourprocedures included examination, on a test basis, of evidence supporting the amounts and otherdisclosures in the Financial Report, and the evaluation of accounting policies and significantaccounting estimates. These procedures have been undertaken to form an opinion as towhether, in all material respects, the Financial Report is presented fairly in accordance withAccounting Standards, other mandatory professional reporting requirements and statutoryrequirements, so as to present a view which is consistent with our understanding of the Bank’sand the Group’s financial position and performance as represented by the results of theiroperations and their cash flows.
The audit opinion expressed in this report has been formed on the above basis.
Audit OpinionIn our opinion, the financial report of Commonwealth Bank of Australia is in accordance with:
(a)the Corporations Act 2001 including:
(i) giving a true and fair view of the Bank’s and the Group’s financial position as at 30 June2001 and of their performance for the year ended on that date; and
(ii) complying with Accounting Standards and the Corporations Regulation 2001; and
(b)other mandatory professional reporting requirements.
ERNST & YOUNG S C Van GorpSydney Partner
Date: 22 August 2001

Shareholding Information
153
Top 20 Holders of Fully Paid Ordinary Shares as at 13 August 2001Rank Name of Holder Number of
Shares%
1 Chase Manhattan Nominees Ltd 129,777,812 10.452 National Nominees Limited 80,523,978 6.483 Westpac Custodian Nominees 73,994,459 5.964 Citicorp Nominees Pty Ltd 50,715,679 4.085 AMP Life Limited 20,369,781 1.646 Commonwealth Custodial Services Limited 19,138,005 1.547 Queensland Investment Corporation Limited 18,463,831 1.498 ANZ Nominees Limited 16,207,140 1.319 Perpetual Trustees Victoria Limited 14,756,414 1.1910 Cogent Nominees Pty Limited 10,388,093 0.8411 BT Custodial Services Pty Ltd 9,639,985 0.7812 RBC Global Services Australia 9,597,704 0.7713 Colonial Foundation Limited 8,598,418 0.6914 HKBA Nominees Ltd 8,302,854 0.6715 MLC Limited 4,930,606 0.4016 The National Mutual Life Association of Australasia Limited 4,871,680 0.3917 Perpetual Nominees Limited 4,832,725 0.3918 NRMA Nominees Pty Limited 4,780,281 0.3819 Perpetual Trustees Nominees Limited 4,616,911 0.3720 CSS & PSS Board 4,485,838 0.36
The twenty largest shareholders hold 498,992,194 shares which is equal to 40.18% of the total shares on issue.
Stock Exchange ListingThe shares of the Commonwealth Bank of Australia
are listed on the Australian Stock Exchange under thetrade symbol CBA, with Sydney being the homeexchange.
Details of trading activity are published in most dailynewspapers, generally under the abbreviation of CBA orC’wealth Bank. The Bank does not have a currenton-market buyback of its shares.
Directors Shareholdings as at 22 August 2001Shares Options
J T Ralph, AC 12,674J M Schubert 7,478D V Murray 44,372 1,500,000N R Adler, AO 6,973R J Clairs, AO 10,482A B Daniels OAM 12,741C R Galbraith 4,524W G Kent AO 6,703F D Ryan 4,482F J Swan 2,225B K Ward 2,405
Guidelines for Dealings by Directors in SharesThe restrictions imposed by law on dealings by
Directors in the securities of the Bank have beensupplemented by the Board of Directors adoptingguidelines which further limit any such dealings byDirectors, their spouses, any dependent child, familycompany and family trust. The guidelines provide that, inaddition to the requirement that Directors not deal in the
securities of the Bank or any related company when theyhave or may be perceived as having relevant unpublishedprice sensitive information, Directors are only permitted todeal within certain periods. Further, the guidelines requirethat Directors not deal on the basis of considerations ofa short term nature or to the extent of trading in thosesecurities.
Range of Shares (Fully Paid Ordinary Shares and Employee Shares): 13 August 2001Range Number of
ShareholdersPercentage
ShareholdersNumber of
SharesPercentage
Issued Capital
1-1,000 566,229 78.84 186,516,233 15.001,001-5,000 134,969 18.79 269,094,091 21.635,001-10,000 11,668 1.62 80,473,001 6.4710,001-100,000 4,997 0.70 100,473,763 8.07100,001-Over 300 0.05 607,458,367 48.83Total 718,163 100.00 1,244,015,455 100.00Less than marketable parcel of $500 13,928 78,451

COMMONWEALTH BANK OF AUSTRALIA AND CONTROLLED ENTITIES
Shareholding Information
154
Voting Rights
Under the Bank’s Constitution, each memberpresent at a general meeting of the Bank in person or byproxy, attorney or official representative is entitled:� on a show of hands – to one vote; and� on a poll – to one vote for each share held or
represented.
If more than one proxy, attorney or officialrepresentative is present for a member:� none of them is entitled to a vote on a show of
hands; and� the vote of each one on a poll is of no effect unless
each is appointed to represent a specifiedproportion of the member’s voting rights, notexceeding in aggregate 100%.
Top 20 Holders of Preferred Exchangeable Resettable Listed Shares (PERLS) as at 13 August 2001Rank Name of Holder Number of Shares %
1 Commonwealth Life Limited 200,000 5.712 The National Mutual Life Association of Australia 131,650 3.763 Commonwealth Custodial Services Limited 92,591 2.654 Dervat Nominees Pty Ltd 84,300 2.415 AMP Life Limited 80,000 2.296 INVIA Custodian Pty Limited 67,000 1.517 National Mutual Funds Management 60,000 1.718 UBS Warburg Private Clients Nominees Pty Ltd 52,749 1.519 Citicorp Nominees Pty Limited 42,000 1.20
10 National Nominees Limited 41,352 1.1811 Perpetual Trustee Company Ltd 36,762 1.0512 ANZ Executors and Trustee Company Limited 36,073 1.0313 Austrust Limited 34,891 1.0014 Perpetual Nominees Limited 31,440 0.9015 Boxall Marine Pty Limited 25,000 0.7116 Questor Financial Services Limited 19,238 0.5517 Flight Centre Limited 15,000 0.4318 Livingstone Investments (NSW) Pty Limited 15,000 0.4319 Brencorp No. 2 Pty Limited 14,134 0.4020 Ms. Thelma Joan Martin-Weber 12,500 0.36
The twenty largest shareholders hold 1,091,680 shares which is equal to 30.79% of the total shares on issue.
Stock Exchange ListingCommonwealth Bank PERLS are listed on the Australian Stock Exchange under the trade symbol CBAPA, with
Sydney being the home exchange. Details of trading activity are published in most daily newspapers, generally under theabbreviation of CBA or C’wealth Bank (pref).
Range of Shares (PERLS): 13 August 2001
The twenty largest shareholders hold 1,019,071 shares which is equal to 29.11% of the total shares on issue.Range Number of
ShareholdersPercentage
ShareholdersNumber of
SharesPercentage
Issued Capital
1-1,000 19,440 98.73 1,764,548 50.411,001-5,000 199 1.01 432,255 12.355,001-10,000 26 0.13 207,062 5.9210,001-100,000 24 0.12 764,485 21.84100,001-Over 2 0.01 331,650 9.48Total 19,691 100.00 3,500,000 100.00Less than marketable parcel of $500 22 201
Voting RightsThe holders will be entitled to receive notice of any
general meeting of the Bank and a copy of every circularor other like document sent out by the Bank to ordinaryshareholders and to attend any general meeting of theBank.
The holders will not be entitled to vote at a generalmeeting of the Bank except in the followingcircumstances:� if at the time of the meeting, a dividend has been
declared but has not been paid in full by therelevant payment date;
� on a proposal to reduce the Bank’s share capital;� on a resolution to approve the terms of a buy-back
agreement;� on a proposal that affects rights attached to
Commonwealth Bank PERLS;� on a proposal to wind up the Bank;
� on a proposal for the disposal of the whole of theBank’s property, business and undertaking;
� during the winding up of the Bank; or� as otherwise required under the Listing Rules from
time to time,in which case the holders will have the same rights as tomanner of attendance and as to voting in respect of eachCommonwealth Bank PERLS as those conferred onordinary shareholders in respect of each ordinary share.
At a general meeting of the Bank, holders areentitled:� on a show of hands, to exercise one vote when
entitled to vote in respect of the matters listedabove; and
� on a poll, to one vote for each Commonwealth BankPERL.

International Representation
155
AustraliaHead Office48 Martin Place (Level 3)Sydney NSW 1155Telephone: (612) 9378 2000Telex: AA 120345Swift: CTBAAU2SFacsimile: (02) 9378 3023Head of Institutional BankingM A Katz
New ZealandHead OfficeASB Bank LtdASB Bank Centre (Level 5)Corner Albert & Wellesley StreetsAuckland New ZealandTelephone: (64 9) 373 3427Facsimile: (64 9) 373 3426Telex: NZ60881Managing DirectorR J Norris
Asia PacificFiji IslandsColonial3 Central StreetPrivate Mail BagSuvaTelephone: (679) 314 400Facsimile: (679) 302 032
Beijing, China2910 China World Towers1 Jianguomenwai AvenueBeijing 100004People’s Republic of ChinaTelephone: (86 10) 6505 5350Facsimile: (86 10) 6505 5354Chief RepresentativeY T Au
Shanghai, China805 Union Building100 Yan An Road (East)Shanghai 200002People’s Republic of ChinaTelephone: (86 21) 6355 3939Facsimile: (86 21) 6373 5066Chief RepresentativeY T Au
Hong Kong1405-1408 Two Exchange Square8 Connaught PlaceCentralHong KongTelephone: (852) 2844 7500Telex: (852) 60466 CTB HXSwift: CTB HK HH BKGFacsimile: (852) 2845 9194General ManagerS R J Holden
MalaysiaEON CMG LifeEON CMG Life Building8th Floor16 Jalan SilangKuala Lumpur 50050Telephone: (60-3) 232 1775Facsimile: (60-3) 232 5189
The PhilippinesCMG30th FloorPhilippine Stock Exchange CenterWest TowerExchange RoadOrtigas CenterPasig CityTelephone: (63-2) 636 2721Facsimile: (63-2) 636 2761
Singapore50 Raffles Place #22-04Singapore Land TowerSingapore 048623Telephone: (65) 326 3877Telex: RS 20920Swift: CTBA SG SGFacsimile: (65) 224 5812General ManagerD J McGrady
ThailandAyudhya CMG17th FloorPloenchit Tower898 Ploenchit Road PatumwanBangkok 10330Telephone: (66-2) 263 0333Facsimile: (66-2) 263 0313
VietnamSuite 202-203ACentral Building31 Hai Ba TrungHanoiVietnamTelephone: (84 4) 826 9899Facsimile: (84 4) 824 3961Chief RepresentativeS R J Holden
IndonesiaPlaza B11Tower II (5th Floor)J1 M.H. ThamrinNo 51 Kav 22Jakarta 10350IndonesiaTelephone: (6221) 318 4394Facsimile: (6221) 318 4391Chief RepresentativeL Morris
Japan8th Floor Toranomon Waiko Bldg5-12-1 Toranomon 5 chromeMinato-kuTokyo 105-0001JapanTelephone: (813) 5400 7280Facsimile: (813) 5400 7288Telex: J 28167 CombankSwift: CTBA JP JTSGeneral ManagerD A Hazelton
EuropeUnited KingdomSenator House85 Queen Victoria StreetLondon EC4V 4HATelephone: (44 171) 710 3999Telex: 883864Swift: CTBA GB 2LFacsimile: (44 171) 710 3939General Manager EuropeS Bigg
Australian Financial & MigrantInformation ServiceSenator House85 Queen Victoria StreetLondon EC4V 4HATelephone: (44 171) 710 3999Telex: 883864Swift: CTBA GB 2LFacsimile: (44 171) 710 3939Senior ConsultantJ O’Brien
Grand CaymanCBA Grand CaymanPO Box 501British West Indies
AmericasUnited States of America599 Lexington Avenue (Level 17)New York NY 10022Telephone: (1 212) 848 9200Telex: TRT 177666Swift: CTBA US 33Facsimile: (1 212) 336 7725General Manager AmericasI M Phillips
AustraliaRegistered OfficeLevel 1, 48 Martin PlaceSydney NSW 1155Telephone: (02) 9378 2000Facsimile: (02) 9378 3317