common fragile sites are characterized by histone
TRANSCRIPT

Common fragile sites are characterizedby histone hypoacetylation
Yanwen Jiang1,2, Isabelle Lucas2, David J. Young1,2, Elizabeth M. Davis2, Theodore Karrison3,
Joshua S. Rest4 and Michelle M. Le Beau1,2,�
1Committee on Cancer Biology, 2Department of Medicine, Section of Hematology/Oncology, 3Department of Health
Studies, The University of Chicago, Chicago, IL 60637, USA and 4Department of Ecology and Evolution, Stony Brook
University, Stony Brook, NY 11794, USA
Received May 28, 2009; Revised and Accepted August 21, 2009
Common fragile sites (CFSs) represent large, highly unstable regions of the human genome. CFS sequencesare sensitive to perturbation of replication; however, the molecular basis for the instability at CFSs ispoorly understood. We hypothesized that a unique epigenetic pattern may underlie the unusual sensitivityof CFSs to replication interference. To examine this hypothesis, we analyzed chromatin modification patternswithin the six human CFSs with the highest levels of breakage, and their surrounding non-fragile regions(NCFSs). Chromatin at most of the CFSs analyzed has significantly less histone acetylation than that of theirsurrounding NCFSs. Trichostatin A and/or 5-azadeoxycytidine treatment reduced chromosome breakage atCFSs. Furthermore, chromatin at the most commonly expressed CFS, the FRA3B, is more resistant to micro-coccal nuclease than that of the flanking non-fragile sequences. These results demonstrate that histonehypoacetylation is a characteristic epigenetic pattern of CFSs, and chromatin within CFSs might be relativelymore compact than that of the NCFSs, indicating a role for chromatin conformation in genomic instability atCFSs. Moreover, lack of histone acetylation at CFSs may contribute to the defective response to replicationstress characteristic of CFSs, leading to the genetic instability characteristic of this regions.
INTRODUCTION
Chromosomal common fragile sites (CFSs) are specific locithat show non-random gaps, breaks, or rearrangements inmetaphase chromosomes when cells are cultured under con-ditions that inhibit or impair DNA replication, such as in thepresence of aphidicolin (APH) (1). CFSs are highly unstableregions of the genome, and molecular deletions and rearrange-ments within CFSs have been identified in a variety of humantumors. Moreover, a high frequency of loss of heterozygosityat known CFSs, likely mediated by replication stress, occursduring the pre-malignant and pre-invasive stages of manytypes of human tumors (2). These features have led us andothers to hypothesize that CFSs play a mechanistic role inthe recurring chromosomal rearrangements, deletions andsomatic recombination observed in tumor cells.
Although extensive effort has been invested in cloningCFSs and characterizing genetic rearrangements of CFSs incancer cells, little progress has been made in elucidating themechanism(s) of fragile site induction. To date, 89 CFSshave been identified in humans, among which 13 have beencloned and characterized at the molecular level (1). On thebasis of sequence analysis of the cloned CFSs, a number ofmolecular features have been identified, including high A/Tcontent, low gene content, high-flexibility, and high contentof Long Interspersed Nuclear Elements (LINE) and MediumReiterated (MER) repeats. Several lines of evidence suggestthat DNA replication is involved in the induction of fragilesites (3). We and other investigators have shown that CFSsreplicate in mid-late S phase, and that exposure to APHfurther delays the timing of replication (3–5). Furthermore,expression of CFSs is induced by conditions that impair
�To whom correspondence should be addressed. 5841 S. Maryland Ave., MC 2115, Chicago, IL 60637, USA. Tel: þ1 7737020795; Fax: þ17737029311; Email: [email protected]
# The Author 2009. Published by Oxford University Press.This is an Open Access article distributed under the terms of the Creative Commons Attribution Non-Commercial License (http://creativecommons.org/licenses/by-nc/2.5/uk/) which permits unrestricted non-commercial use, distribution, and reproduction in any medium, provided the original work isproperly cited.
Human Molecular Genetics, 2009, Vol. 18, No. 23 4501–4512doi:10.1093/hmg/ddp410Advance Access published on August 28, 2009

replication, such as culturing cells in the presence of the DNApolymerase inhibitor, APH, and expression is enhanced by G2/M checkpoint inhibitors, such as caffeine. By examining thelocation of APH-induced breaks, CFSs have been demon-strated to lie at the interface of R- and G-bands, suggestingthat CFSs are regions of unusual chromatin conformation,that replicate late in S phase (6).
Chromatin conformation influences DNA replication in atleast two ways. First, as demonstrated in the Xenopus eggextract system, binding of the origin recognition complex toDNA is negatively regulated by DNA methylation (7).Second, replication origin activity, including origin assemblyand origin activation timing, can be positively regulated byhistone acetylation in a variety of systems (8,9). However,whether histone acetylation is required for origin selectionor replication-timing specification remains an openquestion (10).
On the basis of these observations, we hypothesized thatCFSs represent sequences that are inherently difficult to repli-cate. Moreover, perturbation of DNA replication within CFSsby APH treatment may be mediated, in part, by specific epige-netic patterns at CFSs, resulting in incomplete DNA replica-tion and, ultimately, leading to the formation of gaps,breaks, or rearrangements in metaphase chromosomes(referred to as ‘CFS expression’ in this report). To test thesehypotheses, we examined the chromatin modification patternwithin six of the most highly expressed human CFSs in ahuman lymphoblastoid cell line, using a Chromatin immuno-precipitation (ChIP)-on-chip assay described previously (11).Here, we show that the majority of these CFSs are character-ized by less acetylation, a feature typical of a more condensedchromatin structure, than their flanking non-fragile sequences(NCFSs). By using FRA3B as an example, we demonstratethat chromatin within the fragile site sequences is relativelymore compact than that of the flanking NCFSs. Furthermore,we demonstrate that modifying chromatin structure at CFSsby treatment with trichostatin A (TSA) and/or 5-azadeoxycytidine (5-Aza) increases histone acetylation,decreases CpG methylation at CFSs and, notably, reducesfragile site expression. Taken together, our results demonstratethat histone hypoacetylation is a feature of the chromatin atCFSs, and that there is a link between histone acetylation,chromatin compaction, and the level of chromosome breakageobserved at CFSs.
RESULTS
Most CFSs have features of condensed/repressivechromatin
To examine the potential role of chromatin modification infragile site expression, we analyzed several epigenetic modifi-cations associated with open versus condensed chromatin atsix CFS and their flanking NCFS sequences.
Histone acetylation pattern at CFSs. We first examined theacetylation level of the chromatin, a mark that correlateswith the level of compaction of the chromatin. We analyzeda human lymphoblastoid cell line (11 365) with anormal female karyotype using ‘ChIP-on-chip’ technology to
determine the distribution of acetylated histone H3K9/14(Ac-H3K9/14) within six CFSs (FRA3B, FRA16D, FRA7G,FRAXB, FRA2G, FRA7H), and their flanking NCFSsequences, covering almost 20 Mb of the human genome(Table 1 and Supplementary Material, Tables S1 and S2)(11). The iso-Tm oligonucleotide (45–65 nt) array platformwe designed was highly tiled with a 35 nt start-to-start dis-tance of the immediately adjacent probes. Repetitivesequences that were represented more than 35 times in thehuman genome were masked during the probe design. Thesesix CFSs have been previously mapped by fluorescence insitu hybridization (FISH) with BAC and PAC clones todefine the regions of highest breakage, designated as CFSsequences and the flanking NCFS sequences (12–18). Break-age studies have shown that these six CFSs are among themost commonly expressed CFSs induced by APH, amongwhich, the FRA3B has the highest breakage frequency of allknown CFSs, followed closely by the FRA16D. The level offragile site expression in this cell line, and in other cells isFRA3B . FRA16D . FRA7G ¼ FRAXB . FRA2G ¼FRA7H (19,20).
To identify the enriched regions of H3K9/14 acetylation, weused a permutation algorithm that was described previously(11). In a recent report, this algorithm was found to be oneof the three most robust approaches in analyzing ChIP-on-chipdata from NimbleGen tiling arrays hybridized with unampli-fied DNA samples mixed with spiked-in genomic DNAsequences (average length of 497 bp corresponding to pre-dicted promoters in the human genome) (21). We appliedthis peak finding process to four data sets from two indepen-dent experiments, each containing two replicates, and obtainedthe map of the acetylated domains in the regions examined(Fig. 1A and C–E, and Supplementary Material, Fig. S1,panels iii–vi).
To compare the acetylation level of the different regionsarrayed, we calculated the ‘acetylation coverage’, which corre-sponds to the sum of the width of all of the acetylated chroma-tin domains within a given region divided by the total lengthof the region, for each data set of each experiment (Table 1,Fig. 2A, the fragile sites are arranged in order of descendingfrequency of breakage in this and subsequent figures).Because of the large variation in acetylation coverage acrossthe regions analyzed (0.3–40.5%), we asked whether therewas a relationship between gene density and gene coverage(a measure of how much of a region is covered by genes) ofthe six fragile site regions studied here and their acetylationcoverage (Table 1). No statistically significant correlationwas found either between gene density and acetylation cover-age (CFS: r ¼ 0.20, P ¼ 0.380; NCFS: r ¼ 0.65, P ¼ 0.053),or between gene coverage and acetylation coverage (CFS:r ¼ 0.51, P ¼ 0.11; NCFS: r ¼ 0.10, P ¼ 0.54). Histoneacetylation at H3K9/14 has been shown to be a hallmark ofthe promoters of actively transcribed genes (22). To examinewhether the acetylation peaks we identified are biasedtoward promoter regions, we calculated the extent of theacetylation coverage represented by promoters (2 kb upstreamand downstream of the transcription start site). We found thatalthough 65.5+ 12.3% of the promoters were acetylated, theyaccounted for only 8.3+ 3.7% of the total observed acetylatedregions in untreated cells, suggesting that the majority of the
4502 Human Molecular Genetics, 2009, Vol. 18, No. 23

H3K9/14 acetylation-enriched sequences are not promotersequences (Supplementary Material, Fig. S2). Interestingly,five of the CFSs, FRA3B, FRA16D, FRA7G, FRAXB andFRA2G, were characterized by a relatively low acetylationcoverage (0.30–8.47%) as compared with the level of acety-lation estimated for the human genome based on the resultsof the ENCODE project ChIP-on-chip experiments (11.88%)(22) (Table 1, Fig. 2A). Of note is that the location of theacetylated sequences we identified is consistent with that ofthe acetylated domains mapped by the ENCODE projectwithin the same chromosome region (Supplementary Material,Fig. S3A).
In addition, we analyzed our data with TAMAL (23), amethod that has also been shown to be very robust in analyz-ing data from NimbleGen tiling arrays hybridized with unam-plified DNA samples (21). In comparison, TAMAL identifiedfewer peak regions and the size of individual peaks wassmaller. However, the peaks mapped by TAMAL represent asubset of peaks mapped by the permutation algorithm, andwere completely contained within the latter set, indicatingthat the discrepancy in peak number and size is a result ofdifferent stringencies set by these algorithms (SupplementaryMaterial, Fig. S3B). TAMAL is designed to locate discretetranscription factor binding sites; thus, its ‘peak calling’ cri-teria is highly stringent requiring continuous runs of consecu-tive probes above a cutoff, such as 98th percentile threshold atP , 0.0001, to call a peak. In contrast, we sought to detectcontinuous regions that are enriched in Ac-H3K9/14. Hence,we applied several criteria with a lower stringency in our per-mutation method, such as a percentage of probes (not necess-arily continuous) above the cutoff within a given window, andwe combined peaks that were �2 kb apart. Nonetheless, bothmethods gave comparable results when we compared theacetylation coverage between the CFS and NCFS sequencesas described below (Supplementary Material, Fig. S3C).
Exact permutation tests were used to compare acetylationcoverage between CFSs and their flanking NCFSs. Wefound that the acetylation coverage at FRA3B, FRA7G andFRA2G were significantly lower within the CFS in compari-son to their flanking regions (Fig. 2A). The converse wasobserved at FRAXB and FRA7H. However, it is notable thatthe acetylation level within FRAXB was very low withinboth the NCFS and CFS sequences, with the exception offive large acetylated domains (8–19 kb) within the CFSregion overlapping with the HDHD1A gene, which is tran-scriptionally active in lymphoblastoid cells (SupplementaryMaterial, Fig. S1J). Indeed, the acetylation coverage withinthe FRAXB CFS is only 2%, when the acetylated domainswithin HDHD1A are excluded, which is then comparable tothat observed at FRA2G and FRA7G. Although the acetylationcoverage at FRA16D (the second most highly expressed CFS)was not significantly lower than the flanking NCFS sequences,we observed a very low acetylation coverage (�2%) withinthe entire arrayed region, indicating that the whole region ishypoacetylated. In addition, the majority of the acetylateddomains were significantly smaller within the FRA3B,FRA7G and FRA2G, in comparison to those within theirflanking regions (Fig. 2B). Of note, the size of the acetylateddomains within all of the CFSs was also smaller (median sizeof 0.7–2.9 kb) than those of the ENCODE project (medianT
ab
le1.
Sum
mar
yof
the
Ac-
H3K
9/1
4m
appin
gre
sult
s
FR
A3B
FR
A16D
FR
A7G
FR
AX
BF
RA
2G
FR
A7H
CF
SN
CF
SC
FS
NC
FS
CF
SN
CF
SC
FS
NC
FS
CF
SN
CF
SC
FS
NC
FS
Reg
ion
size
(Mb)
0.4
64.5
70.2
71.9
40.5
14.9
10.8
30.5
30.9
70.4
80.1
64.3
4G
ene
den
sity
(/M
b)
11.7
12.1
7.8
2.9
2.4
3.8
10.3
6.3
03.5
Gen
eco
ver
age
(%)
100
52
100
52
28
29
28
569
46
041
Ace
tyla
tion
cover
age
UA
ver
age
(%)
0.3+
0.1
4.5+
1.2
1.9+
0.3
1.9+
0.2
1.6+
0.9
3.9+
1.3
8.5+
1.6
2.4+
0.4
2.4+
1.1
11.6+
2.8
40.5+
3.2
7.0+
1.7
Shar
ed(%
)0.0
6.1
1.7
2.1
1.8
5.3
10.5
2.2
3.8
18.5
51.5
9.2
AA
ver
age
(%)
0.5+
0.3
6.2+
1.2
3.0+
0.6
2.9+
0.7
2.7+
0.7
5.4+
0.3
8.9+
0.7
3.1+
0.4
2.7+
1.1
17.6+
2.9
47.5+
1.6
7.7+
0.9
Shar
ed(%
)0.0
7.8
4.6
3.6
4.3
7.2
11.0
3.9
2.6
20.6
52.4
10.6
TA
ver
age
(%)
3.5+
0.7
7.2+
0.2
9.8+
1.3
4.1+
0.8
8.5+
0.4
6.0+
1.0
11.6+
1.3
3.0+
0.5
4.9+
0.7
23.5+
3.6
50.2+
8.4
10.5+
0.3
Shar
ed(%
)4.8
9.5
14.1
5.0
6.4
7.8
15.1
3.4
5.5
29.5
59.0
13.4
Tþ
AA
ver
age
(%)
3.4+
1.2
7.2+
1.8
10.4+
4.4
4.5+
1.2
6.3+
0.7
4.1+
1.4
9.8+
1.4
2.7+
0.1
4.6+
1.0
21.7+
7.0
42.6+
13.2
8.4+
1.0
Shar
ed(%
)5.4
10.3
13.9
6.3
9.9
6.2
14.9
1.1
5.7
30.2
58.0
11.9
The
acet
yla
tion
cover
age
isdis
pla
yed
asth
eav
erag
eof
the
acet
yla
tion
cover
age
for
all
four
dat
ase
tsof
both
exper
imen
tsco
mbin
ed(‘
Aver
age’
row
),an
dth
eac
etyla
tion
dom
ains
shar
edbet
wee
nth
etw
oin
dep
enden
tex
per
imen
ts(‘
Shar
ed’
row
).T
he
shar
edac
etyla
ted
chro
mat
indom
ains
corr
espond
toth
elo
ciobse
rved
ina
min
imal
of
thre
eof
the
four
dat
ase
ts.U
:untr
eate
d;A
:A
PH
;T
:T
SA
.Gen
eC
over
age
isdefi
ned
asth
eper
cent
of
are
gio
nis
cover
edby
gen
es.
Human Molecular Genetics, 2009, Vol. 18, No. 23 4503

size of 4.9 kb) (22). A caveat is that although both our studyand the ENCODE project employed the same antibody forthe ChIP DNA preparation, the array used by the ENCODEproject was composed of probes that were 1024 bp (average)in length, significantly longer than the probes in our array(45–65 bp). Whether this variation introduces a difference inthe results of the array experiments is unknown.
Overall, these results indicate that, with the exception of theFRA7H, which is expressed at low levels, hypoacetylatedchromatin is a common characteristic of CFSs. Similarresults were observed in APH-treated cells. Although APHtreatment resulted in a statistically significant increase inacetylation coverage at several of the CFSs examined(FRA16D and FRA7H), and at the NCFS sequences of theFRA16D and FRA2G, the increase was one-half fold, indicat-ing that APH treatment does not have a strong effect on theacetylation level of the chromatin in CFS and NCFS sequences(Supplementary Material, Fig. S4).
Histone methylation pattern at CFSs. To assess the chromatinstructure at CFSs and NCFSs further, we examined the distri-bution of several histone methylation patterns characteristic of
Figure 1. Genomic map, and results of chromatin structure analysis within FRA3B. (A) Chromosome coordinates corresponding to the NCBI build 35, chromo-some band and location of the annotated genes. The position of the CFS within the arrayed region is represented by the burgundy box. (B) Screenshot from theUCSC genome browser showing ChIP-Seq data with antibody for H3K4me1. (C) Screenshot from the UCSC genome browser showing ChIP-on-chip data for thelymphoblastoid cell line, 11 365, using anti-Ac-H3K9/14 antibody, displayed as the linear ratio of ChIP-on-chip sample fluorescence to input DNA fluorescence.The location of the mapped acetylated chromatin domains shared between two independent ChIP experiments is represented by vertical bars under theChIP-on-chip data. (D, E) Screenshot of ChIP-on-chip data of zoomed-in sections within the CFS (left panels) or the NCFS sequences (right panels), withshared peaks (black bars) shown underneath.
Figure 2. Acetylation coverage at CFSs and flanking NCFS regions. (A) Thegraph illustrates the fold change in acetylation coverage of flanking NCFSregions versus each respective CFS. The arrow indicates those CFSs withless than 4% acetylation coverage. The order of the CFSs on the X-axis isshown in decreasing order of the frequency of fragile site expression, whichis used in the figures throughout. (B) The distribution of the size of the acetyl-ated chromatin domains (in kb) is represented as a box plot for each CFS (lightgray plots) and NCFS (dark gray plots) region. The circles correspond to out-lying data points, i.e. more than 1.5 times the inter-quartile range higher thanthe third quartile value. Of note, for presentation purposes, one outlier datapoint corresponding to a 55 kb domain within FRA7H CFS is not representedon the graph. The asterisks indicate a significant difference in the distributionof the size of the acetylated chromatin domains between CFSs and NCFSs(�, P , 0.05; ��, P , 0.01).
4504 Human Molecular Genetics, 2009, Vol. 18, No. 23

active chromatin by using the extensive epigenetic dataanalysis performed by Barski et al. (24). This large genome-wide study was performed using CD4þ human T cells,which also express CFSs (20). We aligned our acetylationmaps with their methylation maps of lysine modificationsthat are markers of active chromatin, e.g. high levels ofH3K4me1 (Fig. 1B and Supplementary Material, Fig. S1A–L, panels ii). Overall, the distribution of the active lysinemethylation patterns observed within the six CFSs was veryconsistent with the Ac-H3K9/14 results obtained from our‘ChIP-on-chip’ experiments.
In summary, analysis of histone acetylation and methylationpatterns indicated that four of the most highly-expressed CFSs,FRA3B, FRA16D, FRA7G and FRA2G, are characterized bylower acetylation than their flanking NCFSs. The chromatinwithin the FRAXB CFS was also hypoacetylated for most ofthe region, with the exception of the HDHD1A gene locatedin the center of the CFS. Moreover, chromatin at these fiveCFSs has substantially lower acetylation than the average ofthe genome as predicted by the ENCODE project. Unexpect-edly, we observed features of open chromatin structurewithin FRA7H, which corresponds to a gene-free region,and has the lowest level of expression of the six CFSs ana-lyzed in this study. Taken together, these observationssuggest that histone hypoacetylation may play a role in CFSexpression by slowing or perturbing the replication process,making these regions more sensitive to APH-induced replica-tion stress. Whether there are multiple subtypes of CFSs basedon their chromatin conformation remains to be determined.
TSA decreases chromosomal breaks inducedby APH/Caffeine
To examine whether increasing histone acetylation at fragilesite sequences alters the frequency of chromosomal breaksand gaps, we treated phytohemagglutinin-stimulated periph-eral blood lymphocytes (PHA-PBLs) isolated from threehealthy individuals with a histone deacetylase (HDAC) inhibi-tor, TSA, in addition to the fragile site-inducing chemicals,APH and Caffeine, and analyzed metaphase cells for chromo-somal breaks and gaps. We observed a dramatic decrease offragile site expression in cells treated with TSA (Fig. 3).PHA-PBLs treated with TSA in addition to APH/Caffeineshowed an average of 82+ 14% decrease in total breaks inthree human subjects as compared with cells treated withAPH/Caffeine (P ¼ 0.09) (Table 2 and SupplementaryMaterial, Table S3). When we focused on individual fragilesites, we noted the same trend, i.e. an average of 82+ 8%decrease for FRA3B (P ¼ 0.02). We also performed similarstudies on the 11 365, Blin (B cell ALL) and Molt-4 (T cellALL) cell lines. Comparable with the observations in lympho-cytes, TSA treatment resulted in a significant increase inacetylation on H3K9/14 (data not shown), and decreasedfragile site expression (Table 2 and Supplementary Material,Table S3).
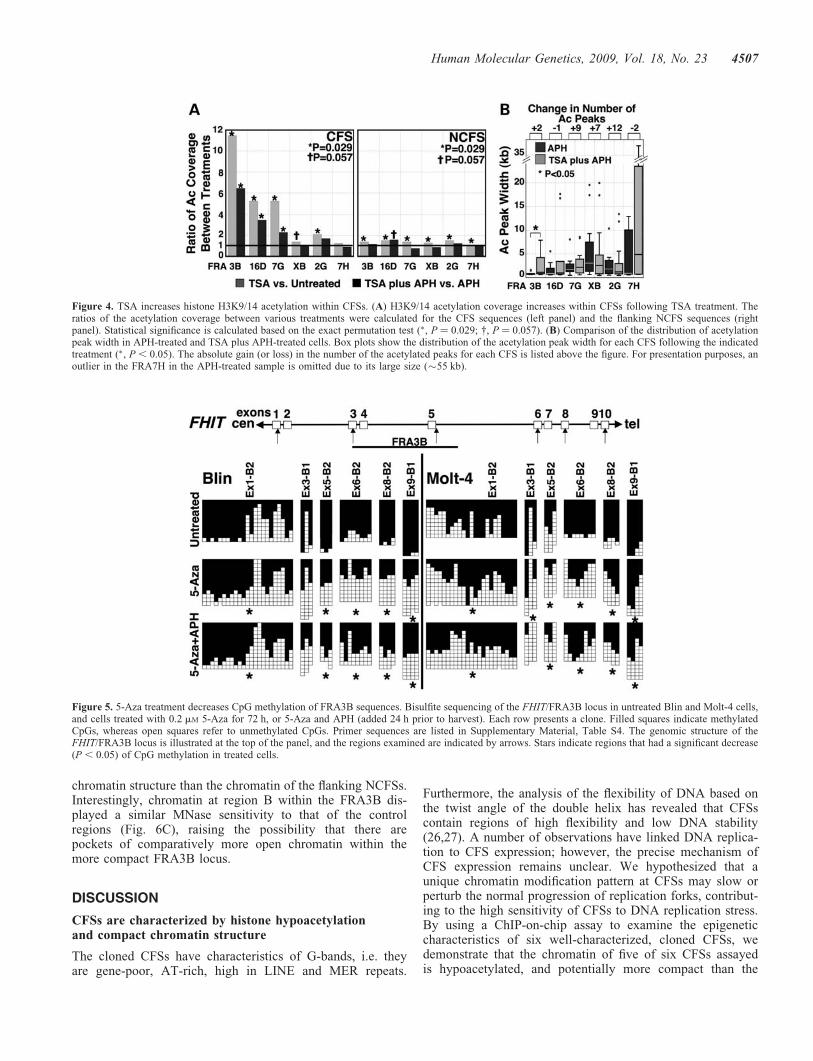
ChIP-on-chip analysis of the 11 365 lymphoblastoid cell linerevealed that TSA treatment significantly increased acetylationcoverage within the CFS portions of four of the six CFSs exam-ined (FRA3B, FRA16D, FRA7G and FRA2G), and marginallyincreased acetylation coverage in one additional CFS (FRAXB)
(Fig. 4A). Similarly, in cells treated with both TSA and APH,three of these CFSs (FRA3B, FRA16D and FRA7G) had anincrease of Ac-H3K9/14 within the CFS portions, as comparedwith APH treatment alone. Although there was an increase ofhistone acetylation at the NCFS regions following treatment,the magnitude of the increase was lower than that of the CFSregions (Fig. 4A, right panel). The overall increase of acety-lation coverage seen after TSA treatment was not due to theincrease of Ac-H3K9/14 at the promoters, since there was nosignificant increase of promoter acetylation in cells treatedwith TSA. Moreover, promoter Ac-H3K9/14 accounted for sig-nificantly less of the total Ac-H3K9/14 in TSA-treated cells ascompared with untreated cells (5.4+ 2.9% in TSA versus8.3+ 3.7% in untreated, P ¼ 0.01, Supplementary Material,Fig. S2B). Further comparison of the acetylated peaks at theseCFSs revealed that, although the median length of the acety-lation peaks was comparable in the TSA plus APH-treatedcells as compared with cells treated with APH alone, the distri-bution of acetylated peak size in TSA plus APH-treated cellswas shifted towards larger peak size indicated by the increasedsize of the box plot (i.e. greater range) for the FRA3B (P ,0.05), and by the large peak size of the outliers in theFRA16D (Fig. 4B). We also observed a substantial increase inthe number of acetylated peaks in the FRA2G and FRA7G.Thus, the increase of acetylation coverage following TSA treat-ment is the result of the combined effects of an increase in thenumber of acetylation peaks and an increase in the size oflarge peaks within CFS sequences. Taken together, our resultsindicate that histone modification and, by extension, chromatinconformation likely play a role in fragile site induction.
5-Aza decreases chromosomal breaks inducedby APH/Caffeine
Chromatin conformation is thought to be regulated not only byhistone modifications, but also by DNA methylation. To assesswhether DNA methylation affects fragile site expression in amanner similar to histone acetylation, we treated Blin andMolt-4 cells with 5-Aza, an inhibitor of DNA methylation,and examined the frequency of chromosomal breaks atCFSs. These cell lines were selected because expression offragile histidine triad gene (FHIT), which contains theFRA3B, is undetectable due to CpG methylation of its promo-ter region (25). Treatment with 5-Aza alone induced about 0.6breaks per 25 metaphase cells for both Blin or Molt-4 cells,which is less than that reported previously in T lymphoblasts(three breaks per metaphase cells using a 10-fold higher con-centration of 5-Aza) (19). Treatment with 5-Aza reduced chro-mosomal breakage at CFSs in APH-treated Blin and Molt-4cells by 52 and 65%, respectively (Table 2). Moreover, Blinand Molt-4 cells treated with both 5-Aza and TSA werefurther protected from APH-induced chromosomal breakswith an 87 and 68% decrease in breaks, respectively.
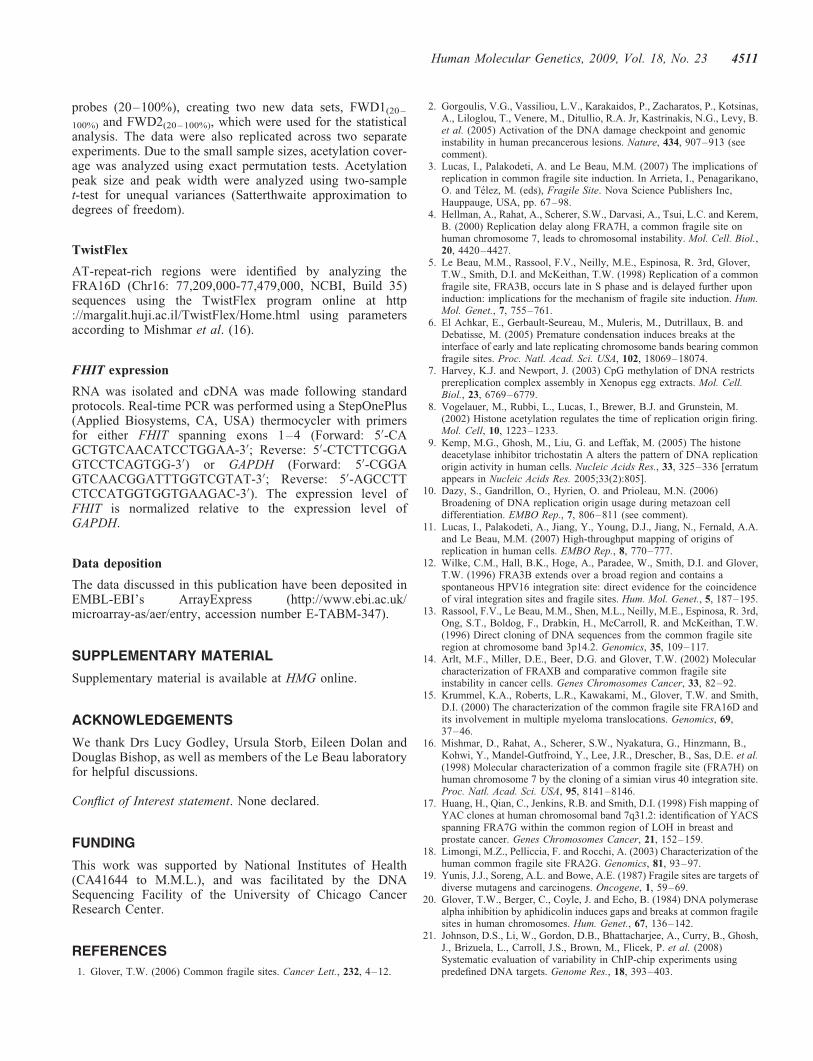
To investigate whether this reduction of chromosomalinstability was associated with an effect of 5-Aza on DNACpG methylation at CFSs, we examined the genomic CpGmethylation pattern within the FRA3B using bisulfite-sequencing with six sets of primers amplifying 43 CpGdinucleotides (Fig. 5). CpG methylation was significantlyreduced by 5-Aza treatment within most of the regions
Human Molecular Genetics, 2009, Vol. 18, No. 23 4505

examined (P , 0.05, Fig. 5). FRA3B is embedded within theFHIT gene, raising the possibility that FHIT transcriptioninterferes with DNA replication within the FRA3B, leadingto impaired replication at CFSs. We found that the level offragile site expression after 5-Aza treatment was unrelated tothe level of FHIT expression, since we observed a reductionof FRA3B breaks rather than an increase, whereas 5-Azaalone or with TSA only minimally reactivated FHITexpression in Blin cells, but not in Molt-4 cells (Supplemen-tary Material, Fig. S5).
Taken together, our results suggest that altering the epige-netic pattern by increasing histone acetylation and/or decreas-ing DNA methylation results in a reduction in the incidence ofbreakage at CFSs.
FRA3B chromatin is less sensitive to micrococcal nuclease
Given our observation that histones within the CFS sequencesare less acetylated than those of the NCFS sequences, andsince hypoacetylation is a mark for condensed chromatinstructure, we sought to determine whether chromatin atCFSs is more compact than that of the NCSFs. To address
this question, we examined the micrococcal nuclease(MNase) sensitivity of chromatin from the FRA3B and itsflanking NCFSs. Loss of the high molecular weight (MW,.3 kb) DNA of the selected regions within either theFRA3B or its flanking sequences after treatment withvarious doses of MNase was assessed by Southern blotting fol-lowed by quantification using ImageJ (Fig. 6A). The averageloss of the high MW DNA of the four FRA3B regions(regions A–D) and the four control regions (regions E–H)were similar when 11 365 nuclei were treated with highdoses of MNase (�20 U/ml) (Fig. 6B). However, theFRA3B regions exhibited a smaller loss of the high MWDNA as compared with that of the control regions when11 365 nuclei were treated with low doses of MNase(Fig. 6B). Although the differences were not statistically sig-nificant (two-tailed student t-test), we noted that comparedwith the control regions, three regions within the FRA3B(regions A, C and D) showed substantially less loss of thehigh MW DNA at 12 and 16 U/ml MNase treatments(Fig. 6C), indicating that the majority of the chromatinwithin the FRA3B sequences were less sensitive to MNasetreatment and, hence, had a relatively more compact
Figure 3. TSA treatment decreases fragile site expression. PHA-stimulated lymphocytes were treated either with 0.4 mM APH for the last 24 h (left panel), orwith 1.0 mM TSA and 0.4 mM APH for the last 24 h (right panel). Caffeine (1.5 mM) was added 4 h prior to metaphase cell preparation. Arrows identify breaks atCFSs.
Table 2. TSA and/or 5-Aza treatment decreases fragile site expression
Breakes per25 cells
PHA stimulated human lymphocytes 11365 Blin Molt-4Subject 1 Subject 2 Subject 3T A/
CT/A/C
T A/C
T/A/C
T A/C
T/A/C
T A/C
T/A/C
T A/C
T/A/C
Z Z/A/C
T/Z/A/C
T A/C
T/A/C
Z Z/A/C
T/Z/A/C
Total 1 219 44 2 767 25 6 298 94 11 111 21 2 109 65 19 52 14 12 68 13 15 24 22FRA3B (3p14.2) 0 18 4 0 33 3 0 26 6 0 10 2 0 2 0 1 0 0 0 0 0 0 0 1FRA16D (16q23.2) 1 17 3 0 17 0 0 9 3 0 23 5 0 3 0 1 0 0 0 1 1 0 0 0FRA7G (7q31.2) 0 11 0 0 14 0 0 6 1 0 6 0 0 3 0 0 0 0 0 1 1 0 0 1FRAXB (Xp22.3) 0 5 3 0 32 2 0 14 4 0 12 0 0 1 2 0 0 1 0 0 0 0 0 1FRA2G (2q31) 0 1 0 0 4 0 0 3 2 0 3 0 0 1 0 0 0 0 0 0 0 0 1 0FRA7H (7q32.3) 0 5 1 0 8 0 0 5 0 0 1 0 0 1 0 1 0 0 0 1 0 0 1 0
Fragile site breaks were scored in 25 Trypsin–Giemsa banded metaphase cells from PHA-stimulated lymphocytes, 11365, Blin, and Molt-4 cells cultured undervarious conditions (A: APH; C: Caffeine; T: TSA; Z: 5-Aza). The Molt-4 cell line is tetraploid, and both Molt-4 and Blin contain structural chromosomalabnormalities. Treatment with 5-Aza alone induced �0.6 breaks/metaphase cell for both Blin and Molt-4 cells, which is less than that reported previously(3 breaks/metaphase cell using a 10-fold higher concentration of 5-Aza) (18). Note that the number of breaks observed in untreated cells is typically zero.
4506 Human Molecular Genetics, 2009, Vol. 18, No. 23
chromatin structure than the chromatin of the flanking NCFSs.Interestingly, chromatin at region B within the FRA3B dis-played a similar MNase sensitivity to that of the controlregions (Fig. 6C), raising the possibility that there arepockets of comparatively more open chromatin within themore compact FRA3B locus.
DISCUSSION
CFSs are characterized by histone hypoacetylationand compact chromatin structure
The cloned CFSs have characteristics of G-bands, i.e. theyare gene-poor, AT-rich, high in LINE and MER repeats.
Furthermore, the analysis of the flexibility of DNA based onthe twist angle of the double helix has revealed that CFSscontain regions of high flexibility and low DNA stability(26,27). A number of observations have linked DNA replica-tion to CFS expression; however, the precise mechanism ofCFS expression remains unclear. We hypothesized that aunique chromatin modification pattern at CFSs may slow orperturb the normal progression of replication forks, contribut-ing to the high sensitivity of CFSs to DNA replication stress.By using a ChIP-on-chip assay to examine the epigeneticcharacteristics of six well-characterized, cloned CFSs, wedemonstrate that the chromatin of five of six CFSs assayedis hypoacetylated, and potentially more compact than the
Figure 4. TSA increases histone H3K9/14 acetylation within CFSs. (A) H3K9/14 acetylation coverage increases within CFSs following TSA treatment. Theratios of the acetylation coverage between various treatments were calculated for the CFS sequences (left panel) and the flanking NCFS sequences (rightpanel). Statistical significance is calculated based on the exact permutation test (�, P ¼ 0.029; †, P ¼ 0.057). (B) Comparison of the distribution of acetylationpeak width in APH-treated and TSA plus APH-treated cells. Box plots show the distribution of the acetylation peak width for each CFS following the indicatedtreatment (�, P , 0.05). The absolute gain (or loss) in the number of the acetylated peaks for each CFS is listed above the figure. For presentation purposes, anoutlier in the FRA7H in the APH-treated sample is omitted due to its large size (�55 kb).
Figure 5. 5-Aza treatment decreases CpG methylation of FRA3B sequences. Bisulfite sequencing of the FHIT/FRA3B locus in untreated Blin and Molt-4 cells,and cells treated with 0.2 mM 5-Aza for 72 h, or 5-Aza and APH (added 24 h prior to harvest). Each row presents a clone. Filled squares indicate methylatedCpGs, whereas open squares refer to unmethylated CpGs. Primer sequences are listed in Supplementary Material, Table S4. The genomic structure of theFHIT/FRA3B locus is illustrated at the top of the panel, and the regions examined are indicated by arrows. Stars indicate regions that had a significant decrease(P , 0.05) of CpG methylation in treated cells.
Human Molecular Genetics, 2009, Vol. 18, No. 23 4507

flanking NCFSs (as in the example of the FRA3B), furthersupporting the observation made by El Achkar et al. (6) thatCFSs lie at the interface of R- and G-bands with unusual chro-matin structure.
Two of the CFSs examined in this study, the FRA3B andFRA16D, are embedded within large genes, FHIT andWWOX, respectively. Each of these genes spans more than1 Mb; however, their transcripts are only �1 kb in length.Similar features are found in several other CFSs, includingthe FRA2F (LRP1B), FRA4G (GRID2), FRA6E (PARKIN),FRA13A (NBEA) and FRA15A (RORA), raising the possi-bility that CFSs may be associated with large genes (28).We examined the Ac-H3K9 acetylation pattern of largegenes (.1 Mb) in the genome by using the publicly-availableENCODE ChIP-Seq data (Bernstein Lab, ENCODE Chroma-tin Group, Massachusetts General Hospital/Harvard MedicalSchool and Broad Institute), and found that the acetylationcoverage of these genes is substantially lower than that ofthe human genome on average (Supplementary Material,Fig. S6). This result suggests that the location of CFSs mayaffect their histone acetylation pattern, and that a proportionof the CFSs that have not yet been cloned may be embeddedwithin large genes. However, more than half of the CFSscloned to date are not located within large genes, yet thechromatin of these CFSs (e.g. the FRA7G, FRAXB andFRA2G) is predominantly hypoacetylated as compared withthe genome on average, and to their flanking NCFSs. Theseobservations suggest that hypoacetylation is an inheritedcharacteristic of the majority of CFSs, and that physicallocation within large genes further exacerbates the effect ofhypoacetylation on CFS expression, exemplified by theFRA3B and FRA16D.
We examined the compaction of the chromatin at theFRA3B more directly by measuring its sensitivity to MNase.Three of four randomly-selected regions within the FRA3Bdemonstrated greater resistance to MNase treatment thancontrol regions within the flanking NCFSs. Together withthe observation of histone hypoacetylation within theFRA3B, these results clearly indicate that chromatin structureof the FRA3B is relatively more compact than that of theflanking NCFSs. Although the difference is subtle, tighterchromatin structure may affect the access of the DNA replica-tion and/or DNA repair machinery to fragile site sequences,especially under replication stress, resulting in incompleteDNA replication at CFSs and, ultimately, contributing to theexpression of CFSs.
CFS expression is influenced by epigenetics
Our results suggest that CFS expression is influenced by epi-genetic marks. In the FRA16D, AT-repeats have been impli-cated in CFS expression by stalling replication forks (29).We observed that all 12 AT-repeat-rich sequences in theFRA16D, identified by the TwistFlex program were locatedin regions with low acetylation in untreated cells; however,there was a 78% decrease of FRA16D expression after TSAtreatment, even though only one AT-repeat-rich sequencebecame acetylated (Table 2, data not shown). These resultsraise the possibility that in addition to AT-repeats, otherfactors such as histone hypoacetylation may impact ongenetic instability at CFSs, with the common theme that allof these factors affect DNA replication within CFSs.
High levels of acetylation have been associated with increasedpermissiveness for DNA replication (30). For example, the Hbo1
Figure 6. Chromatin within the FRA3B is less sensitive to MNase. (A) Ethidium bromide-stained gel and Southern blots probed with probe A (FRA3B probe) orprobe E (control probe) on DNA prepared from nuclei of 11 365 cells following treatment with increasing doses of MNase. The locations of the probes areillustrated at the top of the panel. (B) The percentage loss of high MW (.3 kb) signal for each lane was calculated by measuring the signal between thetop and center black bars, and the total signal between the top and bottom black bars using ImageJ. The measured signals were normalized to the backgroundsignals of the blots. The average percentage loss of high MW DNA for either the FRA3B regions (black line) or the control flanking non-fragile sequences (grayline) was graphed against MNase concentrations. (C) The percentage loss of high MW DNA of each individual region when the nuclei were treated with either 12or 16 U/ml MNase. The black bars indicate the averages.
4508 Human Molecular Genetics, 2009, Vol. 18, No. 23

histone acetyltransferase associates with both origin recognitioncomplexes and mini-chromosome maintenance complexes topromote access of pre-replication complexes to origins (31).Studies in Drosophila have also revealed histone hyperacetyla-tion at active origins, a modification that is conserved amongdifferent Drosophila species (32). Histone acetylation mayalso facilitate DNA double strand break (DSB) repair by creatinga binding platform to promote recruitment of remodelingcomplexes at the sites of DSBs [reviewed in (33)]. Similarly,decreasing CpG methylation can reduce/eliminate the recruit-ment of the methyl-CpG-binding proteins and other chromatinremodeling complexes, such as HDACs and H3K9 methylasewhich mediate chromatin compaction (34). Hence, the increaseof histone H3 acetylation at CFSs after TSA treatment, andthe decrease of CpG methylation after 5-Aza treatment, wouldbe expected to relax chromatin at CFSs, potentially alleviatingthe structural effects that result in CFS expression duringDNA replication stress, and/or facilitating the repair of theDSBs occurring within CFSs in response to APH treatment.However, we cannot exclude the possibility that TSA mayincrease expression and/or acetylation of certain non-histoneproteins, which may also facilitate replication or repairprocesses, leading to a protective effect on CFS expressioninduced by replication stress.
It has also been hypothesized that the collision of transcrip-tion and replication complexes may result in replication forkstalling, DSBs and, ultimately, chromosome breaks at CFSs.Although we did not address this question directly, our datasuggested that transcription does not play a role in fragilesite expression. In general, treatment with TSA and 5-Azaaugments transcription. Instead of an increase of CFS break-age, we observed a significant decrease of CFS breakage inall cell lines examined. Furthermore, we found that the levelof FRA3B expression after 5-Aza treatment was unrelated tothe level of FHIT expression (Table 2, SupplementaryMaterial, Fig. S5). The issue of whether transcription com-plexes colliding with DNA replication complexes plays arole in inducing CFS expression is only relevant if genes con-taining CFSs are transcribed in S phase. Therefore, furtherstudies are needed to address whether the genes in CFSs aretranscribed during S phase, and whether there is a correlationbetween the expression levels of these genes and CFSexpression.
Subtypes of CFSs
We observed a decrease in the frequency of chromosomalbreaks and gaps at each of the six CFSs analyzed followingTSA plus APH treatment as compared with APH treatmentalone, which was coincident with a significant increase inAc-H3K9/14 coverage within four of these CFSs. One excep-tion, the FRA7H, has higher acetylation coverage than do theother five CFSs, as well as higher acetylation coverage than itsflanking NCFSs. Thus, these observations raise the possibilitythat the FRA7H differs mechanistically from other CFSs, suchas the FRA3B and FRA16D. Extensive analysis using FISHrevealed multiple breakage ‘hot spots’ within the FRA7H,and some FISH signals showed an orientation that was theopposite of that predicted by physical maps, prompting theinvestigators to propose that the FRA7H may contain an
unusual chromatin organization (16). Whether hyperacetyla-tion contributes to this unusual chromatin organizationremains to be determined.
Nonetheless, it is also possible that other types of histonemodifications, such as acetylation on histone H4, may play amore determinant role in chromatin conformation of theFRA7H. In addition to the six CFSs examined extensively inthis study, there are seven other CFSs that have been cloned(1). On the basis of the histone methylation map reported byBarski et al. (24), the majority of these CFSs also lie withinpredicted compact chromatin regions (data not shown).However, further ChIP-on-chip studies are needed to verifythese observations.
Mechanism of CFS expression
In summary, we have demonstrated that histone hypoacetyla-tion is a common feature of the subset of CFSs with thehighest expression frequency. Moreover, we have shown thatrelaxing chromatin conformation at CFSs by TSA and/or5-Aza treatments reduces fragile site expression. In addition,our data suggest that the relatively compact chromatin struc-ture of the FRA3B, and by extension other CFSs, may affectthe process of replication of CFS sequences, such as replica-tion origin firing and replication fork progression, underDNA replication stress. Thus, CFSs may represent sequenceswith low histone acetylation that replicate very slowly, andare unable to recover from a further delay in DNA synthesisfollowing replication stress.
MATERIALS AND METHODS
Cell culture and drug treatments
Cell lines (the human Epstein Barr Virus-transformed lympho-blastoid cell line 11 365 with a normal 46,XX karyotype, andleukemia cell lines, Blin and Molt-4) were maintained inRPMI 1640 medium supplemented with 10 mM HEPES,100 units/ml Penicillin/100 mg/ml Streptomycin, and 10%fetal bovine serum (all reagents from Invitrogen, CA, USA)at 378C in a humidified 5% CO2/95% air atmosphere. Periph-eral blood lymphocytes from healthy individuals were culturedin the same medium supplemented with phytohemagglutinin(PHA, 0.09 mg/ml, Remel Inc., KS, USA) for 72 h. Toinduce fragile site expression, cells were treated with 0.4 mM
APH (Sigma, MO, USA) for 24 h with the addition of1.5 mM of caffeine (Sigma) during the last 4 h of culture.Cells in log-phase growth were cultured with TSA (Sigma)at a final concentration of 1.0 mM for 24 h, or 5-Aza (Sigma)at a final concentration of 0.2 mM for 72 h, with replenishmentof the media and the drug every 24 h.
Chromatin immunoprecipitation
ChIP assays were performed according to the protocoldescribed by the manufacturer (Millipore, http://www.millipore.com, MA, USA) with antibody against acetylatedhistone H3 K9/14 (Millipore). Minor modifications of the pro-tocol were described in Lucas et al. (11).
Human Molecular Genetics, 2009, Vol. 18, No. 23 4509

Cytogenetic analysis
Metaphase cells were prepared using standard cytogenetictechniques, and air-dried slides were prepared and stainedusing Trypsin–Giemsa banding techniques as described pre-viously (35). For the analysis of fragile site expression,chromosome breaks, gaps, rearrangements and aberrationswere scored in 25 metaphase cells for each culture condition.
Bisulfite treatment and DNA sequencing
DNA (1 mg) was diluted in 50 ml water, and incubated with5.5 ml 2 N NaOH at 378C for 10 min, followed by treatmentwith 30 ml 10 mM hydroquinone and incubation with 520 ml3.6 M Sodium Bisulfite at 50–558C for 16–22 h (all chemicalsfrom Sigma). During incubation, 5–6 drops of mineral oil wasadded to avoid evaporation. Bisulfite-treated DNA was col-lected by using the WizardTM DNA Clean-up system. Theeluted DNA was treated with 5.5 ml 3 N NaOH, incubated atRT for 5 min, and precipitated by EtOH precipitation.
Touchdown PCR (958C, 10 min; 10 cycles of 958C for 30 s,658C for 30 s and 728C for 45 s, with a decrease in the anneal-ing temperature of one-half degree per cycle; 35 cycles of958C for 30 s, 558C or 508C for 30 s and 728C for 45 s, 3.75or 2.5 mM final Mg2þ concentrations) was performed onbisulfite-treated DNA with primers designed using theregions that flank the CpG-containing sequences. Primersequences, annealing temperatures and Mg2þ concentrationsfor each pair of primers are listed in the SupplementaryMaterial, Table S4. PCR products were TOPO TA clonedand transformed into One-Shot cells (Invitrogen). Cloneswere randomly picked and sequenced. Sequences were ana-lyzed by the DNAStar MegAlign program to assess the CpGmethylation level.
MNase treatment and Southern blotting
Nuclei preparation and MNase (Worthington, NJ, USA) treat-ment were performed as previously described (36). DNAswere purified and fractionated on a 0.8% agarose gel in TPEbuffer (Sigma). Gels were transferred onto Hybond N (GEHealthcare, NJ, USA) in 20� SSC, and the subsequent mem-branes were probed with 32P-labeled probes for either theFRA3B regions or control regions. The coordinates of theprobes are listed in Supplementary Material Table S5. Probesequences were free of repetitive sequences as analyzed byRepeatMasker.
Microarray construction and hybridization
To identify the CFS sequences assayed in this study, we usedpreviously published reports of FISH analysis of BAC or PACclones to determine the genomic sequences that exhibited thehighest level (peak) of split signal patterns relative to breaksat the corresponding CFSs. The sequences surrounding theseCFS sequences were identified as the NCFS sequences. It hasbeen proposed that some CFSs, e.g. the FRA3B, may belarger than predicted previously based on the observation ofsplit signals in a low percentage of cells using probes extendingseveral megabases from the peak region of breakage (37).
We classified these sequences as NCFSs in this study (Sup-plementary Material, Table S1). In addition, some CFSs mayhave an abnormal genomic structure, as suggested by theunusual hybridization pattern observed by FISH of genomicclones from the FRA7G (38), and the FRA7H (16), making itdifficult to define the boundaries of these CFSs. We alsoincluded these sequences on our array, and categorized themas NCFSs in this study (Supplementary Material, Table S1).All regions were tiled with isothermal (Tm ¼ 768C) oligonu-cleotides of variable length (45–65 bp). To avoid repetitiveregions, the set of probes were compared against a pre-computed frequency histogram of all possible 15mer probesin the human genome. For each probe, the maximum averagefrequency of all of the 15-mers comprising the probe was setat 35. The minimum and median tiling intervals were 35 nt(start-to-start). The construction of the arrays (385 000 oligonu-cleotides), the labeling of DNAs, the microarray hybridization,and scanning were performed by the Roche NimbleGen, Inc.Core Facility (WI, USA) as described previously (11,39).
Microarray data analysis
The microarray data analysis process was performed followingthe protocol described previously (11). Briefly, after the Z-scorefiltration (cutoff ¼ 3) of the original data to eliminate the non-reproducible replicates on the array, we applied a sliding-window approach to identify potential enrichment regions.Within the window, a probe was considered to ‘qualify’ if itslog2 ratio was above a set cutoff ri. A peak was called whenthe number of qualifying probes was above a set percentageof the probes within the window. The start position of the firstqualifying probe and the end position of the last qualifyingprobe were set as the start and end positions of the peak. Thisprocedure was repeated using a series of log2 ratio cutoffvalues, r1, r2, . . . ri, where r1. r2. . . . . ri, and r1 equals the‘hypothetical maximum (meanþ6 S.D.)’ for each data set ofeach region to minimize the effects of outliers. To assess thelikelihood of any peak as representing a true enrichmentregion, we estimated the false-positive rate (FPR) for eachidentified region. The FPR was defined as the ratio of theaverage number of peaks found using the log2 ratio cutoffvalue ri for the randomized (20 times) and the non-randomizeddata. This FPR value was assigned to the peaks that were presentat the log2 ratio cutoff value ri, but absent at the value ri21. Wechose peaks that had an FPR less than 15% for further analysis.After a set of enrichment regions were identified for each dataset of each arrayed region at each individual cutoff, wemerged any two peaks 2 kb or less apart on the same set andthen combined merged peaks from different cutoff sets toobtain a final set of enrichment regions for each data set.Because the added component of variability between exper-iments was very low relative to the variation within exper-iments, we used the four data sets of both independentexperiments to obtain the definitive map of the acetylateddomains in the regions examined.
Statistical analysis of the microarray data
For statistical purposes, the two data sets (FWD1 and FWD2)were combined separately for each percentage of qualifying
4510 Human Molecular Genetics, 2009, Vol. 18, No. 23
probes (20–100%), creating two new data sets, FWD1(20 –
100%) and FWD2(20 – 100%), which were used for the statisticalanalysis. The data were also replicated across two separateexperiments. Due to the small sample sizes, acetylation cover-age was analyzed using exact permutation tests. Acetylationpeak size and peak width were analyzed using two-samplet-test for unequal variances (Satterthwaite approximation todegrees of freedom).
TwistFlex
AT-repeat-rich regions were identified by analyzing theFRA16D (Chr16: 77,209,000-77,479,000, NCBI, Build 35)sequences using the TwistFlex program online at http://margalit.huji.ac.il/TwistFlex/Home.html using parametersaccording to Mishmar et al. (16).
FHIT expression
RNA was isolated and cDNA was made following standardprotocols. Real-time PCR was performed using a StepOnePlus(Applied Biosystems, CA, USA) thermocycler with primersfor either FHIT spanning exons 1–4 (Forward: 50-CAGCTGTCAACATCCTGGAA-30; Reverse: 50-CTCTTCGGAGTCCTCAGTGG-30) or GAPDH (Forward: 50-CGGAGTCAACGGATTTGGTCGTAT-30; Reverse: 50-AGCCTTCTCCATGGTGGTGAAGAC-30). The expression level ofFHIT is normalized relative to the expression level ofGAPDH.
Data deposition
The data discussed in this publication have been deposited inEMBL-EBI’s ArrayExpress (http://www.ebi.ac.uk/microarray-as/aer/entry, accession number E-TABM-347).
SUPPLEMENTARY MATERIAL
Supplementary material is available at HMG online.
ACKNOWLEDGEMENTS
We thank Drs Lucy Godley, Ursula Storb, Eileen Dolan andDouglas Bishop, as well as members of the Le Beau laboratoryfor helpful discussions.
Conflict of Interest statement. None declared.
FUNDING
This work was supported by National Institutes of Health(CA41644 to M.M.L.), and was facilitated by the DNASequencing Facility of the University of Chicago CancerResearch Center.
REFERENCES
1. Glover, T.W. (2006) Common fragile sites. Cancer Lett., 232, 4–12.
2. Gorgoulis, V.G., Vassiliou, L.V., Karakaidos, P., Zacharatos, P., Kotsinas,A., Liloglou, T., Venere, M., Ditullio, R.A. Jr, Kastrinakis, N.G., Levy, B.et al. (2005) Activation of the DNA damage checkpoint and genomicinstability in human precancerous lesions. Nature, 434, 907–913 (seecomment).
3. Lucas, I., Palakodeti, A. and Le Beau, M.M. (2007) The implications ofreplication in common fragile site induction. In Arrieta, I., Penagarikano,O. and Telez, M. (eds), Fragile Site. Nova Science Publishers Inc,Hauppauge, USA, pp. 67–98.
4. Hellman, A., Rahat, A., Scherer, S.W., Darvasi, A., Tsui, L.C. and Kerem,B. (2000) Replication delay along FRA7H, a common fragile site onhuman chromosome 7, leads to chromosomal instability. Mol. Cell. Biol.,20, 4420–4427.
5. Le Beau, M.M., Rassool, F.V., Neilly, M.E., Espinosa, R. 3rd, Glover,T.W., Smith, D.I. and McKeithan, T.W. (1998) Replication of a commonfragile site, FRA3B, occurs late in S phase and is delayed further uponinduction: implications for the mechanism of fragile site induction. Hum.Mol. Genet., 7, 755–761.
6. El Achkar, E., Gerbault-Seureau, M., Muleris, M., Dutrillaux, B. andDebatisse, M. (2005) Premature condensation induces breaks at theinterface of early and late replicating chromosome bands bearing commonfragile sites. Proc. Natl. Acad. Sci. USA, 102, 18069–18074.
7. Harvey, K.J. and Newport, J. (2003) CpG methylation of DNA restrictsprereplication complex assembly in Xenopus egg extracts. Mol. Cell.Biol., 23, 6769–6779.
8. Vogelauer, M., Rubbi, L., Lucas, I., Brewer, B.J. and Grunstein, M.(2002) Histone acetylation regulates the time of replication origin firing.Mol. Cell, 10, 1223–1233.
9. Kemp, M.G., Ghosh, M., Liu, G. and Leffak, M. (2005) The histonedeacetylase inhibitor trichostatin A alters the pattern of DNA replicationorigin activity in human cells. Nucleic Acids Res., 33, 325–336 [erratumappears in Nucleic Acids Res. 2005;33(2):805].
10. Dazy, S., Gandrillon, O., Hyrien, O. and Prioleau, M.N. (2006)Broadening of DNA replication origin usage during metazoan celldifferentiation. EMBO Rep., 7, 806–811 (see comment).
11. Lucas, I., Palakodeti, A., Jiang, Y., Young, D.J., Jiang, N., Fernald, A.A.and Le Beau, M.M. (2007) High-throughput mapping of origins ofreplication in human cells. EMBO Rep., 8, 770–777.
12. Wilke, C.M., Hall, B.K., Hoge, A., Paradee, W., Smith, D.I. and Glover,T.W. (1996) FRA3B extends over a broad region and contains aspontaneous HPV16 integration site: direct evidence for the coincidenceof viral integration sites and fragile sites. Hum. Mol. Genet., 5, 187–195.
13. Rassool, F.V., Le Beau, M.M., Shen, M.L., Neilly, M.E., Espinosa, R. 3rd,Ong, S.T., Boldog, F., Drabkin, H., McCarroll, R. and McKeithan, T.W.(1996) Direct cloning of DNA sequences from the common fragile siteregion at chromosome band 3p14.2. Genomics, 35, 109–117.
14. Arlt, M.F., Miller, D.E., Beer, D.G. and Glover, T.W. (2002) Molecularcharacterization of FRAXB and comparative common fragile siteinstability in cancer cells. Genes Chromosomes Cancer, 33, 82–92.
15. Krummel, K.A., Roberts, L.R., Kawakami, M., Glover, T.W. and Smith,D.I. (2000) The characterization of the common fragile site FRA16D andits involvement in multiple myeloma translocations. Genomics, 69,37–46.
16. Mishmar, D., Rahat, A., Scherer, S.W., Nyakatura, G., Hinzmann, B.,Kohwi, Y., Mandel-Gutfroind, Y., Lee, J.R., Drescher, B., Sas, D.E. et al.
(1998) Molecular characterization of a common fragile site (FRA7H) onhuman chromosome 7 by the cloning of a simian virus 40 integration site.Proc. Natl. Acad. Sci. USA, 95, 8141–8146.
17. Huang, H., Qian, C., Jenkins, R.B. and Smith, D.I. (1998) Fish mapping ofYAC clones at human chromosomal band 7q31.2: identification of YACSspanning FRA7G within the common region of LOH in breast andprostate cancer. Genes Chromosomes Cancer, 21, 152–159.
18. Limongi, M.Z., Pelliccia, F. and Rocchi, A. (2003) Characterization of thehuman common fragile site FRA2G. Genomics, 81, 93–97.
19. Yunis, J.J., Soreng, A.L. and Bowe, A.E. (1987) Fragile sites are targets ofdiverse mutagens and carcinogens. Oncogene, 1, 59–69.
20. Glover, T.W., Berger, C., Coyle, J. and Echo, B. (1984) DNA polymerasealpha inhibition by aphidicolin induces gaps and breaks at common fragilesites in human chromosomes. Hum. Genet., 67, 136–142.
21. Johnson, D.S., Li, W., Gordon, D.B., Bhattacharjee, A., Curry, B., Ghosh,J., Brizuela, L., Carroll, J.S., Brown, M., Flicek, P. et al. (2008)Systematic evaluation of variability in ChIP-chip experiments usingpredefined DNA targets. Genome Res., 18, 393–403.
Human Molecular Genetics, 2009, Vol. 18, No. 23 4511
22. Koch, C.M., Andrews, R.M., Flicek, P., Dillon, S.C., Karaoz, U., Clelland,G.K., Wilcox, S., Beare, D.M., Fowler, J.C., Couttet, P. et al. (2007) Thelandscape of histone modifications across 1% of the human genome in fivehuman cell lines. Genome Res., 17, 691–707.
23. Bieda, M., Xu, X., Singer, M.A., Green, R. and Farnham, P.J. (2006)Unbiased location analysis of E2F1-binding sites suggests a widespreadrole for E2F1 in the human genome. Genome Res., 16, 595–605.
24. Barski, A., Cuddapah, S., Cui, K., Roh, T.Y., Schones, D.E., Wang, Z.,Wei, G., Chepelev, I. and Zhao, K. (2007) High-resolution profiling ofhistone methylations in the human genome. Cell, 129, 823–837.
25. Zheng, S., Ma, X., Zhang, L., Gunn, L., Smith, M.T., Wiemels, J.L.,Leung, K., Buffler, P.A. and Wiencke, J.K. (2004) Hypermethylation ofthe 50 CpG island of the FHIT gene is associated with hyperdiploid andtranslocation-negative subtypes of pediatric leukemia. Cancer Res., 64,2000–2006.
26. Toledo, F., Coquelle, A., Svetlova, E. and Debatisse, M. (2000) Enhancedflexibility and aphidicolin-induced DNA breaks near mammalianreplication origins: implications for replicon mapping and chromosomefragility. Nucleic Acids Res., 28, 4805–4813.
27. Zlotorynski, E., Rahat, A., Skaug, J., Ben-Porat, N., Ozeri, E., Hershberg,R., Levi, A., Scherer, S.W., Margalit, H. and Kerem, B. (2003) Molecularbasis for expression of common and rare fragile sites. Mol. Cell. Biol., 23,7143–7151.
28. Smith, D.I., McAvoy, S., Zhu, Y. and Perez, D.S. (2007) Large commonfragile site genes and cancer. Seminars Cancer Biol., 17, 31–41.
29. Zhang, H. and Freudenreich, C.H. (2007) An AT-rich sequence in humancommon fragile site FRA16D causes fork stalling and chromosomebreakage in S. cerevisiae. Mol. Cell, 27, 367–379.
30. Tabancay, A.P. Jr and Forsburg, S.L. (2006) Eukaryotic DNA replicationin a chromatin context. Curr. Top. Dev. Biol., 76, 129–184.
31. Iizuka, M., Matsui, T., Takisawa, H. and Smith, M.M. (2006) Regulationof replication licensing by acetyltransferase Hbo1. Mol. Cell. Biol., 26,1098–1108.
32. Calvi, B.R., Byrnes, B.A. and Kolpakas, A.J. (2007) Conservation ofepigenetic regulation, ORC binding and developmental timing of DNAreplication origins in the genus Drosophila. Genetics, 177, 1291–1301.
33. Pandita, T.K. and Richardson, C. (2009) Chromatin remodeling finds itsplace in the DNA double-strand break response. Nucleic Acids Res., 37,1363–1377.
34. Klose, R.J. and Bird, A.P. (2006) Genomic DNA methylation: the markand its mediators. Trends Biochem. Sci., 31, 89–97.
35. Roulston, D. and Le Beau, M. (1997). Cytogenetic analysis ofhematologic malignant diseases. In Barch, M.J., Knutsen, T. andSpurbeck, J.L. (eds), The AGT Cytogenetics Laboratory Manual,Lippincott-Raven, Philadelphia, PA.
36. Gilbert, N., Boyle, S., Sutherland, H., de Las Heras, J., Allan, J.,Jenuwein, T. and Bickmore, W.A. (2003) Formation of facultativeheterochromatin in the absence of HP1. EMBO J., 22, 5540–5550.
37. Becker, N.A., Thorland, E.C., Denison, S.R., Phillips, L.A. and Smith,D.I. (2002) Evidence that instability within the FRA3B region extendsfour megabases. Oncogene, 21, 8713–8722.
38. Hellman, A., Zlotorynski, E., Scherer, S.W., Cheung, J., Vincent, J.B.,Smith, D.I., Trakhtenbrot, L. and Kerem, B. (2002) A role for commonfragile site induction in amplification of human oncogenes. Cancer Cell,1, 89–97.
39. Selzer, R.R., Richmond, T.A., Pofahl, N.J., Green, R.D., Eis, P.S., Nair,P., Brothman, A.R. and Stallings, R.L. (2005) Analysis of chromosomebreakpoints in neuroblastoma at sub-kilobase resolution using fine-tiling oligonucleotide array CGH. Genes Chromosomes Cancer, 44,305–319.
4512 Human Molecular Genetics, 2009, Vol. 18, No. 23