commodities brief - crude oil and natural gas production ... · pdf filethe african...
TRANSCRIPT

The African Development Bank Group Chief Economist Complex
Content:
1- Introduction
2- Crude Oil and Gas
Reserves
3- Production of Oil and
Gas
4- Oil and Gas Consumption
5- Crude Oil and Gas Trade
6- Oil and Gas Price
Movements
7- Crude Oil and Gas Price
Drivers and Outlook
8- Is Gas going to be a
Dominant Source of
Future Energy?
9- Conclusion
Africa is well endowed with abundant
crude oil (“oil”) and natural gas
(“gas”). African net oil exporters
include: Algeria, Angola, Cameroon,
Chad, Democratic Republic of Congo,
Congo Republic, Equatorial Guinea,
Gabon, Libya, Nigeria, and Sudan.
Other producers are Cote d’Ivoire,
Egypt, Mauritania, South Africa, and
Tunisia. Emerging and potential oil
producers are Ghana, Kenya, Liberia,
Mozambique, Niger, Sao Tome &
Principe, Sierra Leone, Somalia,
Tanzania, and Uganda. With respect
to gas, Algeria, Egypt, Equatorial
Guinea, Libya, Mozambique and
Nigeria are net exporters while other
producers include Angola, Cameroon,
Congo, Cote d’Ivoire, Gabon,
Morocco, Senegal, South Africa, and Tanzania. Oil and gas resources are
central to the economic growth and
fiscal situations of an increasing
number of countries. However, for
many of them, the resource curse
syndrome, oil/gas price volatility, oil-
and gas-related social and political
conflicts and poor oil/gas revenue
management have largely eroded the
significant gains from higher but
volatile export revenues. Therefore,
countries with new oil and gas
discoveries are going to face a great
managerial challenge to avoid the
1 - Introduction
resource curse syndrome. This brief
examines the recent reserves,
production, consumption, supply and
export of oil and gas as well as their
price movements and outlook.
2. Crude Oil and Gas Reserves
Africa’s share of global crude oil
reserves stands at 9.6 percent, ranking
third region globally (see Table 1). The
majority of African oil reserves is
located in Libya, Nigeria, Algeria,
Angola, and Sudan, which together
account for more than 90 percent of the
continent’s reserves. Libya and Nigeria
account for 3.3 and 2.8 percent,
respectively, of world reserves. There is
growing knowledge about Africa’s
proved oil reserves, which rose from 53.3 billion barrels in 1980 to 117.0
billion barrels in 2005 and to 127.7
billion barrels in 2009.
While OPEC struggles to keep up
supply, the gap between potential
reserves and current oil output in many
African states is tremendous with
emerging with emerging new producers
like Ghana and Uganda, among others
as indicated in Table 2.
Commodities Brief Volume 1, issue 4
8 October 2010
Crude Oil and Natural Gas Production in
Africa and the Global Market Situation
Prepared by the following staff: John C. Anyanwu ( [email protected], Tel +216 7110 2225);
Kaouther Abderrahim ([email protected], Tel +216 7110 2225); and Amel Feidi
([email protected], Tel +216 7110 3164);
Mthuli Ncube [email protected] +216 7110 2062
Charles Leyeka Lufumpa [email protected] +216 7110 2175
Leonce Ndikumana [email protected]
+216 7110 2076

Table 1: Africa’s Proved Crude Oil Reserves
Billion barrels 2005 2009
Algeria Volume 12.3 12.2
Share 10.5 9.6
Angola Volume 9.0 13.5
Share 7.7 10.6
Chad Volume 0.9 0.9
Share 0.8 0.7
Rep. of Congo Volume 1.9 1.9
Share 1.6 1.5
Egypt Volume 3.7 4.4
Share 3.2 3.4
Equatorial Guinea Volume 1.8 1.7
Share 1.5 1.3
Gabon Volume 2.1 3.7
Share 1.8 2.9
Libya Volume 41.5 44.3
Share 35.4 34.7
Nigeria Volume 36.2 37.2
Share 31.0 29.1
Sudan Volume 6.4 6.7
Share 5.5 5.2
Tunisia Volume 0.6 0.6
Share 0.5 0.5
Other Africa 0.6 0.6
Africa Volume 117.0 127.7
Source: Statistical Review of World Energy 2010
Table 2: Estimated Crude Oil Reserves from Africa’s Emerging/Potential Producers
Country
Estimated Crude Oil Reserves (billion barrels)
Ghana 3.21
Kenya 1.52
Liberia No estimate avail.
Mozambique 3.03
Niger 0.34
Sao Tome and Principe 1.05
Sierra Leone No estimate avail.
Somalia 4.02
Tanzania No estimate avail.
Uganda 2.06
Total 15
Sources: Reuters estimates.
Crude Oil and Natural Gas Production in Africa and the Global Market Situation Page 2
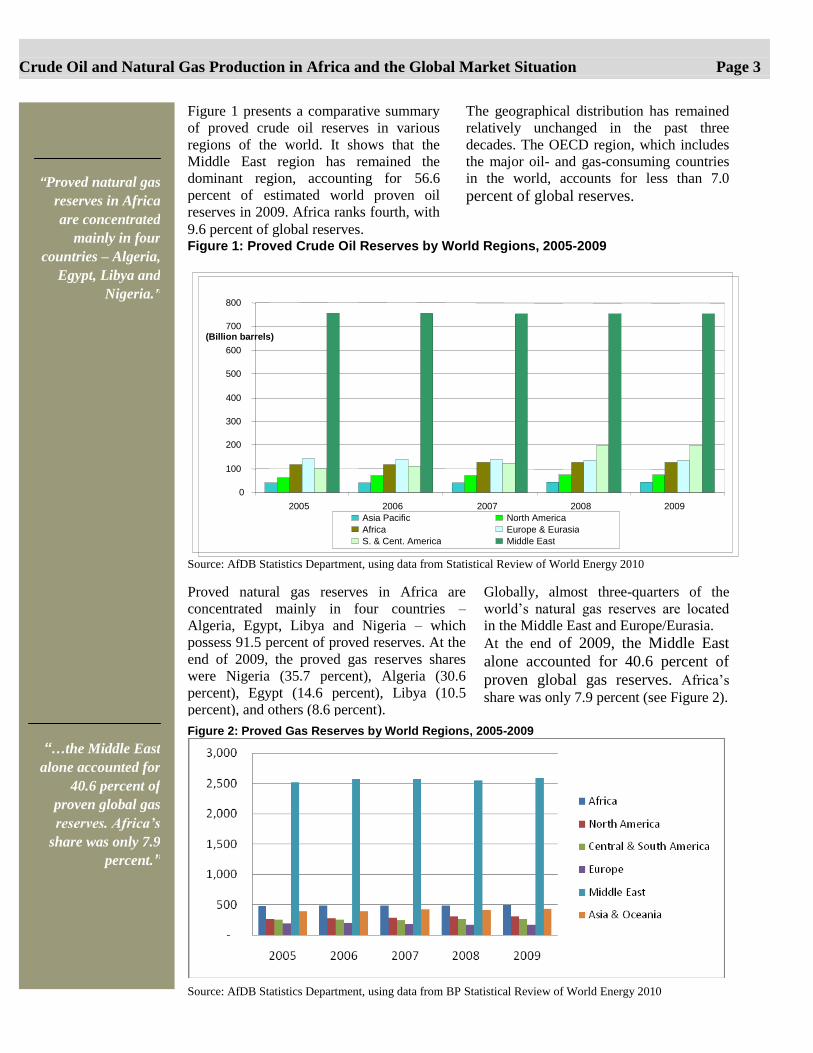
Figure 1 presents a comparative summary
of proved crude oil reserves in various
regions of the world. It shows that the
Middle East region has remained the
dominant region, accounting for 56.6
percent of estimated world proven oil
reserves in 2009. Africa ranks fourth, with
9.6 percent of global reserves.
The geographical distribution has remained
relatively unchanged in the past three
decades. The OECD region, which includes
the major oil- and gas-consuming countries
in the world, accounts for less than 7.0 percent of global reserves.
Figure 1: Proved Crude Oil Reserves by World Regions, 2005-2009
0
100
200
300
400
500
600
700
800
2005 2006 2007 2008 2009
(Billion barrels)
Asia Pacific North America Africa Europe & Eurasia S. & Cent. America Middle East
Source: AfDB Statistics Department, using data from Statistical Review of World Energy 2010
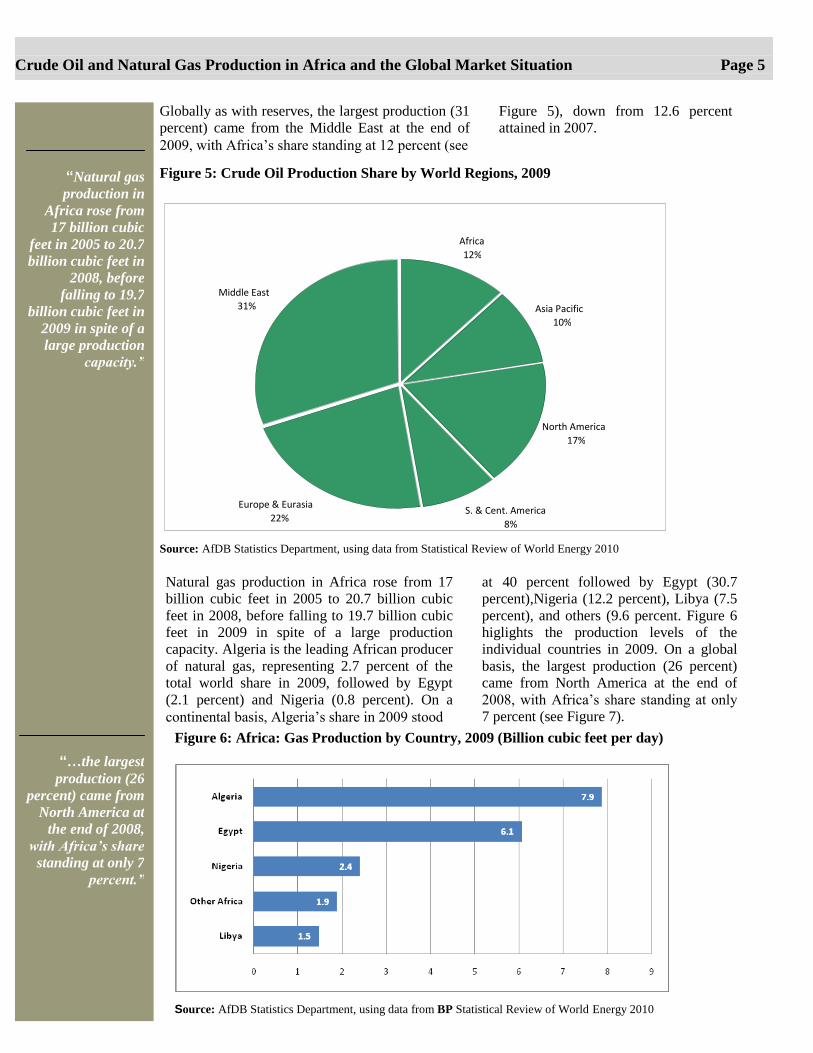
Proved natural gas reserves in Africa are
concentrated mainly in four countries –
Algeria, Egypt, Libya and Nigeria – which
possess 91.5 percent of proved reserves. At the
end of 2009, the proved gas reserves shares
were Nigeria (35.7 percent), Algeria (30.6
percent), Egypt (14.6 percent), Libya (10.5
percent), and others (8.6 percent).
Globally, almost three-quarters of the
world’s natural gas reserves are located
in the Middle East and Europe/Eurasia. At the end of 2009, the Middle East
alone accounted for 40.6 percent of
proven global gas reserves. Africa’s
share was only 7.9 percent (see Figure 2).
Figure 2: Proved Gas Reserves by World Regions, 2005-2009
Source: AfDB Statistics Department, using data from BP Statistical Review of World Energy 2010
Crude Oil and Natural Gas Production in Africa and the Global Market Situation Page 3
“Proved natural gas
reserves in Africa
are concentrated
mainly in four
countries – Algeria,
Egypt, Libya and
Nigeria.”
“…the Middle East
alone accounted for
40.6 percent of
proven global gas
reserves. Africa’s
share was only 7.9
percent.”

3. Production of Oil and Gas
African countries’ oil production trend between
2005 and 2009 is shown in Figure 3. The figure
shows that Africa’s production rose from 9,921
thousand barrels per day in 2005 to 10,238
thousand barrels per day in 2007
before falling to 9,705 thousand
barrels per day in 2009.
Figure 3: Africa Crude Oil Production, 2005-2009
9700
9800
9900
10000
10100
10200
10300
2005 2006 2007 2008 2009
(Thousand barrels daily)
Source: AfDB Statistics Department, using data from Statistical Review of World Energy 2010
Figure 4 presents African countries’ oil
production shares in 2009. The four major oil producers in Africa together account for 77
percent of the continent’s production.
Figure 4: Africa: Oil Production by Country, 2009 (Thousand barrels daily)
Source: AfDB Statistics Department, using data from Statistical Review of World Energy 2010
Crude Oil and Natural Gas Production in Africa and the Global Market Situation Page 4
“…Africa’s oil
production rose
from 9,921
thousand barrels
per day in 2005 to
10,238 thousand
barrels per day in
2007 before falling
to 9,705 thousand
barrels per day in
2009.”
Globally as with reserves, the largest production (31
percent) came from the Middle East at the end of
2009, with Africa’s share standing at 12 percent (see
Figure 5), down from 12.6 percent
attained in 2007.
Figure 5: Crude Oil Production Share by World Regions, 2009
Africa 12%
Asia Pacific 10%
North America 17%
S. & Cent. America 8%
Europe & Eurasia 22%
Middle East 31%
Source: AfDB Statistics Department, using data from Statistical Review of World Energy 2010
Natural gas production in Africa rose from 17
billion cubic feet in 2005 to 20.7 billion cubic
feet in 2008, before falling to 19.7 billion cubic
feet in 2009 in spite of a large production
capacity. Algeria is the leading African producer
of natural gas, representing 2.7 percent of the
total world share in 2009, followed by Egypt
(2.1 percent) and Nigeria (0.8 percent). On a
continental basis, Algeria’s share in 2009 stood
at 40 percent followed by Egypt (30.7
percent),Nigeria (12.2 percent), Libya (7.5
percent), and others (9.6 percent. Figure 6
higlights the production levels of the
individual countries in 2009. On a global
basis, the largest production (26 percent)
came from North America at the end of
2008, with Africa’s share standing at only
7 percent (see Figure 7).
Figure 6: Africa: Gas Production by Country, 2009 (Billion cubic feet per day)
Source: AfDB Statistics Department, using data from BP Statistical Review of World Energy 2010
Crude Oil and Natural Gas Production in Africa and the Global Market Situation Page 5
“Natural gas
production in
Africa rose from
17 billion cubic
feet in 2005 to 20.7
billion cubic feet in
2008, before
falling to 19.7
billion cubic feet in
2009 in spite of a
large production
capacity.”
“…the largest
production (26
percent) came from
North America at
the end of 2008,
with Africa’s share
standing at only 7
percent.”
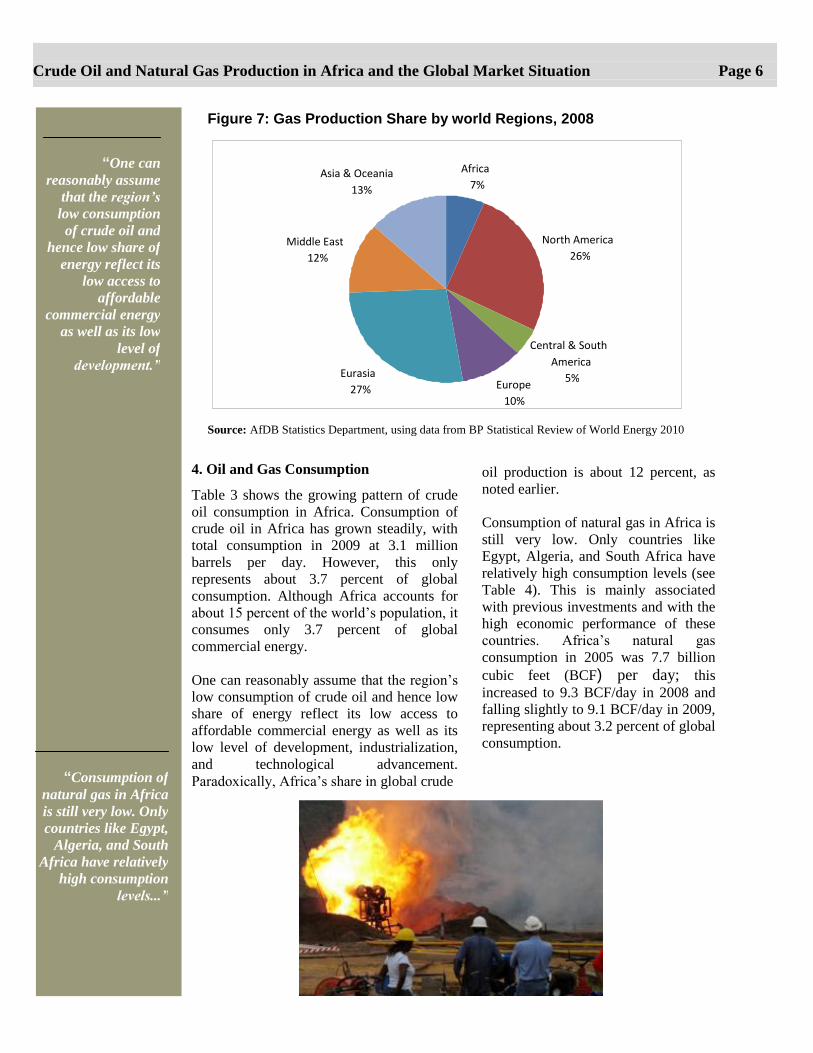
Figure 7: Gas Production Share by world Regions, 2008
Africa 7%
North America 26%
Central & South America
5% Europe
10%
Eurasia 27%
Middle East 12%
Asia & Oceania 13%
Source: AfDB Statistics Department, using data from BP Statistical Review of World Energy 2010
4. Oil and Gas Consumption
Table 3 shows the growing pattern of crude
oil consumption in Africa. Consumption of
crude oil in Africa has grown steadily, with
total consumption in 2009 at 3.1 million
barrels per day. However, this only
represents about 3.7 percent of global
consumption. Although Africa accounts for
about 15 percent of the world’s population, it
consumes only 3.7 percent of global
commercial energy.
One can reasonably assume that the region’s
low consumption of crude oil and hence low
share of energy reflect its low access to
affordable commercial energy as well as its
low level of development, industrialization,
and technological advancement.
Paradoxically, Africa’s share in global crude
oil production is about 12 percent, as
noted earlier.
Consumption of natural gas in Africa is
still very low. Only countries like
Egypt, Algeria, and South Africa have
relatively high consumption levels (see
Table 4). This is mainly associated
with previous investments and with the
high economic performance of these
countries. Africa’s natural gas
consumption in 2005 was 7.7 billion
cubic feet (BCF) per day; this
increased to 9.3 BCF/day in 2008 and
falling slightly to 9.1 BCF/day in 2009,
representing about 3.2 percent of global
consumption.
Crude Oil and Natural Gas Production in Africa and the Global Market Situation Page 6
“Consumption of
natural gas in Africa
is still very low. Only
countries like Egypt,
Algeria, and South
Africa have relatively
high consumption
levels...”
“One can
reasonably assume
that the region’s
low consumption
of crude oil and
hence low share of
energy reflect its
low access to
affordable
commercial energy
as well as its low
level of
development.”
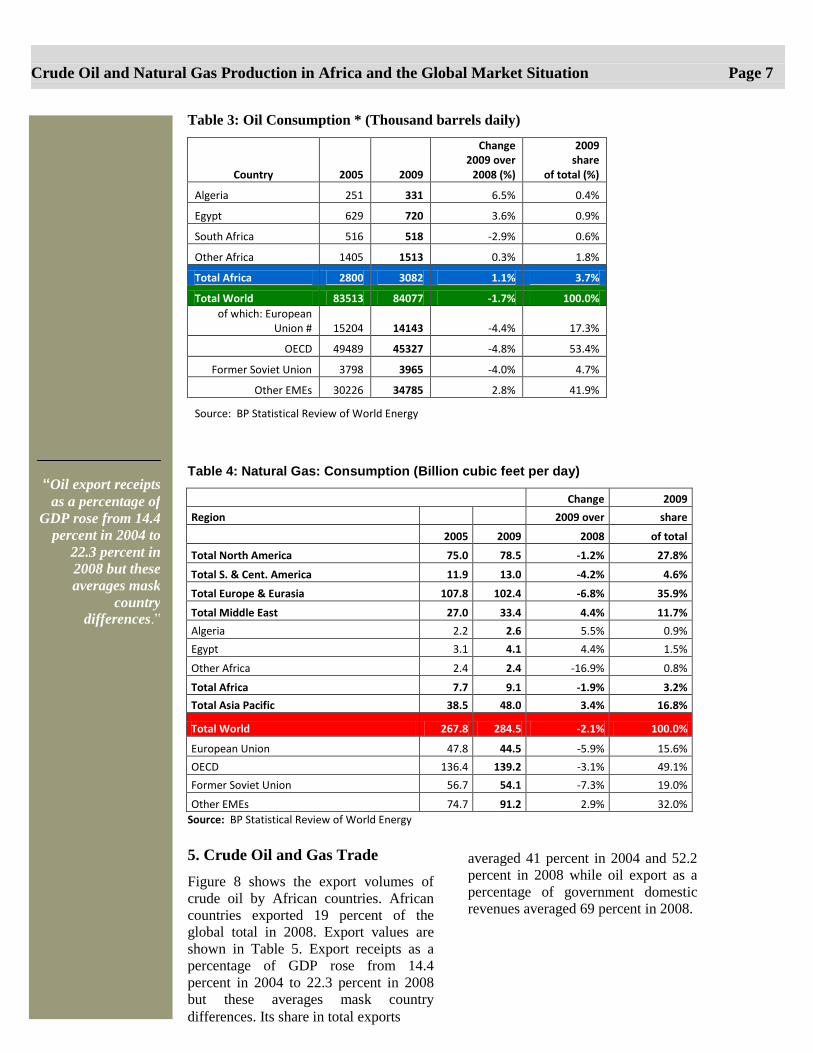
Table 3: Oil Consumption * (Thousand barrels daily)
Country 2005 2009
Change 2009 over
2008 (%)
2009 share
of total (%)
Algeria 251 331 6.5% 0.4%
Egypt 629 720 3.6% 0.9%
South Africa 516 518 -2.9% 0.6%
Other Africa 1405 1513 0.3% 1.8%
Total Africa 2800 3082 1.1% 3.7%
Total World 83513 84077 -1.7% 100.0%
of which: European Union # 15204 14143 -4.4% 17.3%
OECD 49489 45327 -4.8% 53.4%
Former Soviet Union 3798 3965 -4.0% 4.7%
Other EMEs 30226 34785 2.8% 41.9%
Source: BP Statistical Review of World Energy
Table 4: Natural Gas: Consumption (Billion cubic feet per day)
Change 2009
Region 2009 over share
2005 2009 2008 of total
Total North America 75.0 78.5 -1.2% 27.8%
Total S. & Cent. America 11.9 13.0 -4.2% 4.6%
Total Europe & Eurasia 107.8 102.4 -6.8% 35.9%
Total Middle East 27.0 33.4 4.4% 11.7%
Algeria 2.2 2.6 5.5% 0.9%
Egypt 3.1 4.1 4.4% 1.5%
Other Africa 2.4 2.4 -16.9% 0.8%
Total Africa 7.7 9.1 -1.9% 3.2%
Total Asia Pacific 38.5 48.0 3.4% 16.8%
Total World 267.8 284.5 -2.1% 100.0%
European Union 47.8 44.5 -5.9% 15.6%
OECD 136.4 139.2 -3.1% 49.1%
Former Soviet Union 56.7 54.1 -7.3% 19.0%
Other EMEs 74.7 91.2 2.9% 32.0%
Source: BP Statistical Review of World Energy
5. Crude Oil and Gas Trade
Figure 8 shows the export volumes of
crude oil by African countries. African
countries exported 19 percent of the
global total in 2008. Export values are
shown in Table 5. Export receipts as a
percentage of GDP rose from 14.4
percent in 2004 to 22.3 percent in 2008
but these averages mask country
differences. Its share in total exports
averaged 41 percent in 2004 and 52.2
percent in 2008 while oil export as a
percentage of government domestic
revenues averaged 69 percent in 2008.
Crude Oil and Natural Gas Production in Africa and the Global Market Situation Page 7
“Oil export receipts
as a percentage of
GDP rose from 14.4
percent in 2004 to
22.3 percent in
2008 but these
averages mask
country
differences.”
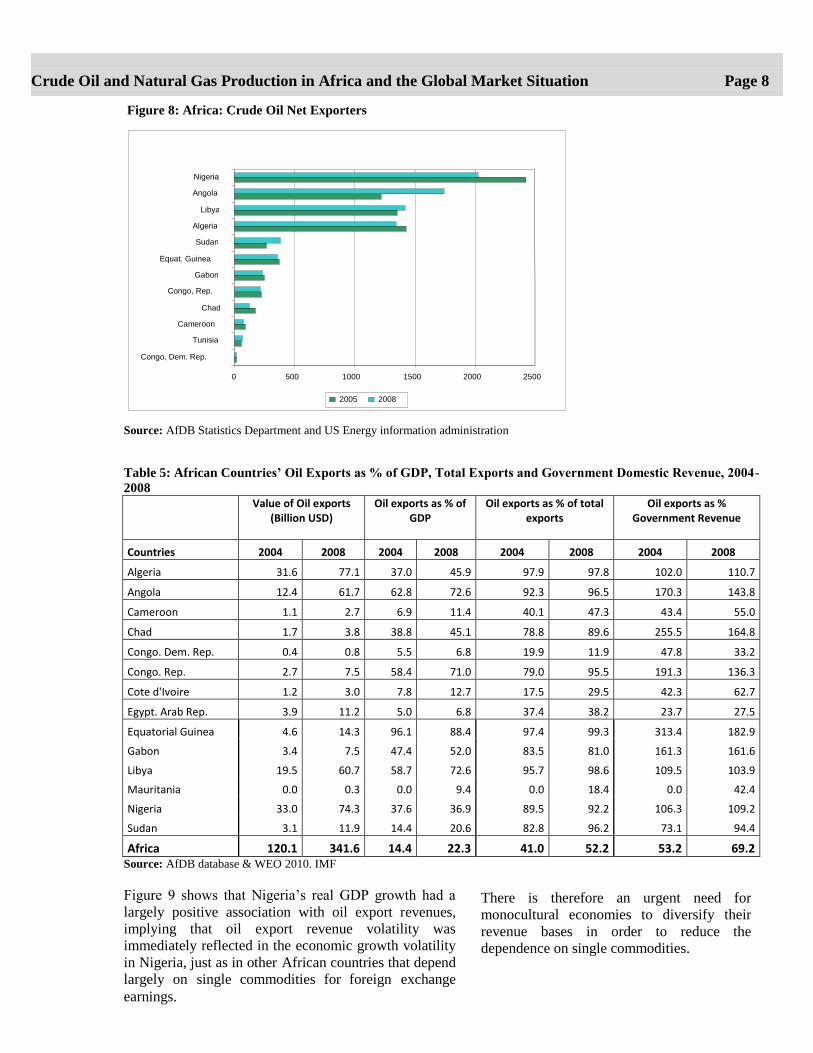
Figure 8: Africa: Crude Oil Net Exporters
0 500 1000 1500 2000 2500
Congo, Dem. Rep. Tunisia
Cameroon Chad
Congo, Rep. Gabon
Equat. Guinea Sudan
Algeria Libya
Angola Nigeria
2005 2008
Source: AfDB Statistics Department and US Energy information administration
Table 5: African Countries’ Oil Exports as % of GDP, Total Exports and Government Domestic Revenue, 2004-
2008
Value of Oil exports (Billion USD)
Oil exports as % of GDP
Oil exports as % of total exports
Oil exports as % Government Revenue
Countries 2004 2008 2004 2008 2004 2008 2004 2008
Algeria 31.6 77.1 37.0 45.9 97.9 97.8 102.0 110.7
Angola 12.4 61.7 62.8 72.6 92.3 96.5 170.3 143.8
Cameroon 1.1 2.7 6.9 11.4 40.1 47.3 43.4 55.0
Chad 1.7 3.8 38.8 45.1 78.8 89.6 255.5 164.8
Congo. Dem. Rep. 0.4 0.8 5.5 6.8 19.9 11.9 47.8 33.2
Congo. Rep. 2.7 7.5 58.4 71.0 79.0 95.5 191.3 136.3
Cote d'Ivoire 1.2 3.0 7.8 12.7 17.5 29.5 42.3 62.7
Egypt. Arab Rep. 3.9 11.2 5.0 6.8 37.4 38.2 23.7 27.5
Equatorial Guinea 4.6 14.3 96.1 88.4 97.4 99.3 313.4 182.9
Gabon 3.4 7.5 47.4 52.0 83.5 81.0 161.3 161.6
Libya 19.5 60.7 58.7 72.6 95.7 98.6 109.5 103.9
Mauritania 0.0 0.3 0.0 9.4 0.0 18.4 0.0 42.4
Nigeria 33.0 74.3 37.6 36.9 89.5 92.2 106.3 109.2
Sudan 3.1 11.9 14.4 20.6 82.8 96.2 73.1 94.4
Africa 120.1 341.6 14.4 22.3 41.0 52.2 53.2 69.2 Source: AfDB database & WEO 2010. IMF
Figure 9 shows that Nigeria’s real GDP growth had a
largely positive association with oil export revenues,
implying that oil export revenue volatility was
immediately reflected in the economic growth volatility
in Nigeria, just as in other African countries that depend
largely on single commodities for foreign exchange earnings.
There is therefore an urgent need for
monocultural economies to diversify their
revenue bases in order to reduce the
dependence on single commodities.
Crude Oil and Natural Gas Production in Africa and the Global Market Situation Page 8

Figure 9: Nigeria’s Real GDP Growth & Oil Revenues as Percent of GDP
Source: Statistics Department, African Development Bank
Oil imports for some African countries,
averaging 2% of global oil imports. It clearly
shows Africa’s limited significance with
respect to crude oil imports as well as
derived products, as opposed to its
significant contribution to basic world crude
oil exports (see Table 6) Consequently, oil
imports account for a relatively small
proportion of GDP (see Table 7).
However, oil imports accounts for a good
chunk of total imports and government
revenues and this partly accounts for poor
external account balance of most net oil-
importing countries. Figure 10 illustrates
the relative oil import positions of the
major net oil importing countries in Africa
in 2005 and 2008.
Table 6: Imports of Crude Oil* (Thousand Barrels Per Day)
Country 2004 2005 2006 2007 2008
Cote d'Ivoire 71.8 68.6 80.9 82.0 82.0
Ghana 32.2 30.1 14.3 41.0 42.0
Kenya 40.8 36.1 34.1 33.0 32.0
Morocco 118.8 129.6 125.2 126.0 131.0
Senegal 22.2 21.0 7.5 15.0 14.0
Sierra Leone 5.3 6.0 4.5 0.0 0.0
South Africa 470.5 537.5 442.5 451.0 470.0
Zambia 10.9 11.4 11.6 13.0 14.0
Net Importers 772.4 840.3 720.7 761.0 785.0
Africa 872.7 988.6 868.7 895.4 923.2
Africa (% of World Total) 2.0 2.2 2.0 2.0 2.0
World 43543.1 44291.9 44376.6 44461.6 46160.0
*/ including Lease Condensate
Source: AfDB Statistics Department and US Energy information administration
Crude Oil and Natural Gas Production in Africa and the Global Market Situation Page 9
“Oil imports for
some African
countries, averaging
2% of global oil
imports. It clearly
shows Africa’s
limited significance
with respect to crude
oil imports as well as
derived products...”
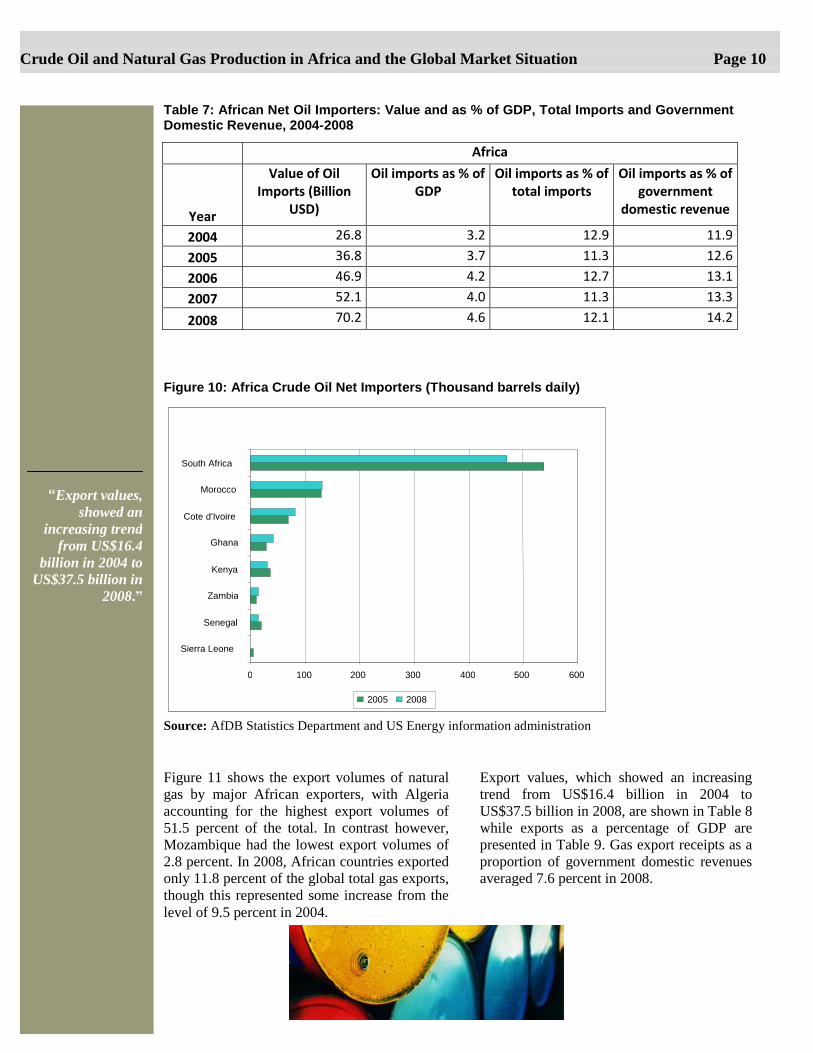
Table 7: African Net Oil Importers: Value and as % of GDP, Total Imports and Government Domestic Revenue, 2004-2008
Africa
Year
Value of Oil Imports (Billion
USD)
Oil imports as % of GDP
Oil imports as % of total imports
Oil imports as % of government
domestic revenue
2004 26.8 3.2 12.9 11.9
2005 36.8 3.7 11.3 12.6
2006 46.9 4.2 12.7 13.1
2007 52.1 4.0 11.3 13.3
2008 70.2 4.6 12.1 14.2
Figure 10: Africa Crude Oil Net Importers (Thousand barrels daily)
0 100 200 300 400 500 600
Sierra Leone
Senegal
Zambia
Kenya
Ghana
Cote d'Ivoire
Morocco
South Africa
2005 2008
Source: AfDB Statistics Department and US Energy information administration
Figure 11 shows the export volumes of natural
gas by major African exporters, with Algeria
accounting for the highest export volumes of
51.5 percent of the total. In contrast however,
Mozambique had the lowest export volumes of
2.8 percent. In 2008, African countries exported
only 11.8 percent of the global total gas exports,
though this represented some increase from the
level of 9.5 percent in 2004.
Export values, which showed an increasing
trend from US$16.4 billion in 2004 to
US$37.5 billion in 2008, are shown in Table 8
while exports as a percentage of GDP are
presented in Table 9. Gas export receipts as a
proportion of government domestic revenues
averaged 7.6 percent in 2008.
Crude Oil and Natural Gas Production in Africa and the Global Market Situation Page 10
“Export values,
showed an
increasing trend
from US$16.4
billion in 2004 to
US$37.5 billion in
2008.”

Figure 11: Africa Natural Gas Exporters (Billions Cubic Feet)
0 500 1000 1500 2000 2500
Mozambique
Equatorial Guinea
Libya
Egypt
Nigeria
Algeria
2005 2008
Source: AfDB Statistics Department and US Energy Information Administration
Table 8: Africa: Value of Natural Gas Exports (Million USD)
Country 2004 2005 2006 2007 2008
Algeria 13053.9 21094.9 15061.9 14773.7 19276.9
Egypt 235.9 2679.3 4132.2 4016.5 5466.1
Equatorial Guinea 0.0 0.0 0.0 361.7 1673.4
Libya 456.8 1767.9 2078.3 2520.9 3359.8
Mozambique 0.0 0.0 317.9 734.0 1033.8
Nigeria 2676.4 3891.3 4298.5 5542.5 6638.2
Africa 16423.0 29433.3 25888.9 27949.3 37448.2
Africa (%World Total) 9.5% 10.6% 11.8% 11.7% 11.8%
World 173369.9 277792.3 219345.4 238550.3 316921.6 Source: AfDB Statistics Department and US Energy Information Administration
Table 9: African Countries’ Natural Gas Exports as % of GDP, Total Exports and Government Domestic Revenues, 2004 and 2008
Indicator Year Algeria Egypt Equatorial
Guinea Libya Mozambique Nigeria Africa
Natural gas Exports as % of GDP
2004 15.3 0.3 0.0 1.4 0.0 3.0 2.0
2008 11.5 3.3 10.3 4.0 10.4 3.3 2.4
Natural Gas Exports as % of Total Exports
2004 43.5 2.1 0.0 2.2 0.0 7.7 6.8
2008 26.9 18.9 10.5 5.4 35.9 7.3 6.5
Natural Exports as % Government Domestic Revenues
2004 42.2 1.4 0.0 2.6 0.0 8.6 7.3
2008 27.7 13.4 21.3 5.8 40.7 9.8 7.6
Source: AfDB Statistics Department and US Energy Information Administration.
Crude Oil and Natural Gas Production in Africa and the Global Market Situation Page 11

Natural gas imports for major importers in
Africa averaged just 0.5 percent of global
imports in 2008, rising from 0.2 percent in
2004. Three major importers in the
Continent that year were South Africa (65
percent), Tunisia (25 percent) and Morocco
(10 percent). As Figure 12 shows, Algeria’s
real GDP growth had had a poor positive
association with natural gas export revenues,
indicating that gas export revenues do not
have significantly positive effect on the
countries’ economic growth. There is
therefore an urgent need for improved
management of natural revenues to promote
sustainable growth and development of
African economies.
Figure 12: Algeria’s Real GDP Growth & Natural Gas Export Revenues as Percent of
GDP
0.0
5.0
10.0
15.0
20.0
25.0
2004 2005 2006 2007 2008
Natu
ral
Gas E
xp
ort
-GD
P R
ati
o (
%)
0.0
1.0
2.0
3.0
4.0
5.0
6.0
Real
GD
P G
row
th (
%)
(%)
Natural Gas Export-GDP Ratio (%) Real GDP Growth (%)
Source: AfDB Statistics Department and US Energy Information Administration
6. Oil and Gas Price Movements
A barrel of crude oil that was trading
between US$18 and US$23 in the 1990s;
crossed the US$40 mark in 2004; and rose
to about US$60 from 2005. During the
summer of 2007, the price of one barrel of
crude oil jumped above US$70 and even
crossed the US$147 mark in July 2008.
Figure 13 displays the price trend of Brent
crude oil between 1995 and early June
2010.The oil price had the greatest price
gain among key commodities in 2008 and
ironically about the highest loss (with
natural gas and metals) in 2009 consequent
upon the financial crisis.
After the price collapse of late 2008 and
early 2009, recovery commenced in the
second quarter of 2009 and reached its
recent peak in April 2010 before the recent
high volatility. However, spot crude oil
prices were volatile from May 2010, with
the Euro zone debt crisis triggering a
meltdown in both financial and oil
markets and setting in motion a sea
change in market sentiment. Table 10 presents the spot and futures
prices for Brent and New York
Mercantile Exchange (NYMEX) West
Texas Intermediate (WTI) for the period,
2005 to 2010 on annual, quarterly and
monthly basis.
Since January 2005, natural gas prices
had experienced some volatility (see
Figure 13). It hit a trough of US$2.4 in
August 2009 due to the financial crisis
that adversely affected commodity prices.
Natural gas prices hit their high early in
2010 as cold weather during the winter
drove up heating demand. However,
prices have since fallen back to under
US$4 per Million Metric British Thermal
Units (MMBtu).
Crude Oil and Natural Gas Production in Africa and the Global Market Situation Page 12
“There is an
urgent need for
improved
management of
natural revenues to promote
sustainable growth
and development of
African
economies...”
“After the price
collapse of late
2008 and early
2009, recovery
commenced in the
second quarter of
2009 and reached
its recent peak in
April 2010 before
the recent high volatility...”
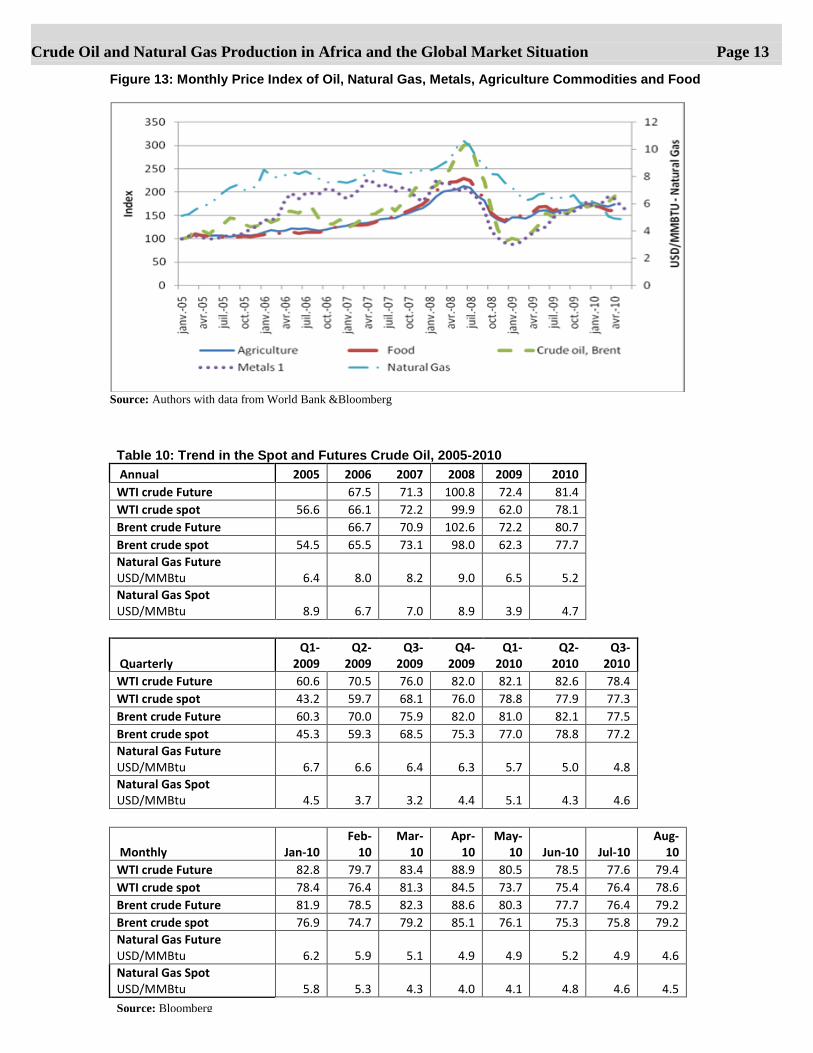
Figure 13: Monthly Price Index of Oil, Natural Gas, Metals, Agriculture Commodities and Food
Source: Authors with data from World Bank &Bloomberg
Table 10: Trend in the Spot and Futures Crude Oil, 2005-2010
Annual 2005 2006 2007 2008 2009 2010
WTI crude Future 67.5 71.3 100.8 72.4 81.4
WTI crude spot 56.6 66.1 72.2 99.9 62.0 78.1
Brent crude Future 66.7 70.9 102.6 72.2 80.7
Brent crude spot 54.5 65.5 73.1 98.0 62.3 77.7
Natural Gas Future USD/MMBtu 6.4 8.0 8.2 9.0 6.5 5.2
Natural Gas Spot USD/MMBtu 8.9 6.7 7.0 8.9 3.9 4.7
Quarterly Q1-
2009 Q2-
2009 Q3-
2009 Q4-
2009 Q1-
2010 Q2-
2010 Q3-
2010
WTI crude Future 60.6 70.5 76.0 82.0 82.1 82.6 78.4
WTI crude spot 43.2 59.7 68.1 76.0 78.8 77.9 77.3
Brent crude Future 60.3 70.0 75.9 82.0 81.0 82.1 77.5
Brent crude spot 45.3 59.3 68.5 75.3 77.0 78.8 77.2
Natural Gas Future USD/MMBtu 6.7 6.6 6.4 6.3 5.7 5.0 4.8
Natural Gas Spot USD/MMBtu 4.5 3.7 3.2 4.4 5.1 4.3 4.6
Monthly Jan-10 Feb-
10 Mar-
10 Apr-
10 May-
10 Jun-10 Jul-10 Aug-
10
WTI crude Future 82.8 79.7 83.4 88.9 80.5 78.5 77.6 79.4
WTI crude spot 78.4 76.4 81.3 84.5 73.7 75.4 76.4 78.6
Brent crude Future 81.9 78.5 82.3 88.6 80.3 77.7 76.4 79.2
Brent crude spot 76.9 74.7 79.2 85.1 76.1 75.3 75.8 79.2
Natural Gas Future USD/MMBtu 6.2 5.9 5.1 4.9 4.9 5.2 4.9 4.6
Natural Gas Spot USD/MMBtu 5.8 5.3 4.3 4.0 4.1 4.8 4.6 4.5
Source: Bloomberg
Crude Oil and Natural Gas Production in Africa and the Global Market Situation Page 13
7. Crude Oil and Gas Price Drivers and
Outlook
What factors are behind these price volatilities?
As with other commodities, factors such as
sentiment regarding the recovery in the
underlying global economy (including
manufacturing and construction data from the
U.S. and China, which are major oil
consumers), market sentiment generally
expressed in equity markets and expectations
of a tighter or loose physical market going
forward are important in dictating price
direction of crude oil. In particular, in addition
to the response to the Euro zone debt crisis, oil
prices are also being affected by weak
underlying fundamentals, including weak
global demand, sluggish economic recovery,
less than expected growth in non-
manufacturing sector, and of course, weak U.S.
employment and consumer data. China's
slowing economic growth is also raising
concerns about energy demand. In addition, the
pace of manufacturing growth in China slowed
in June 2010 as government steps to cool the
property market and curb bank lending
combined with a faltering global recovery.
Dollar exchange against major currencies is a
critical factor affecting oil price movements.
Dollar-denominated commodities like crude oil
tend to move inversely to the U.S. currency. In
addition, since the early 2000s, commodities
such as oil have gone through a process of
“financialization”, driven by the desire to
diversify portfolios in the wake of the equity
market bubble in 2000 and by the thinking
(rightly or wrongly) that commodities provide
a hedge against inflation. This has informed
recent investor’s behavior in trading in and out
of commodities such as oil as an asset class,
thus further adding to the price volatility.
IEA’s forecast for 2011 shows that global daily
crude oil consumption will climb 1.3 million
barrels, or 1.6 percent, to average 87.8 million
a day, compared to an estimate 86.5 million for
2010. Thus means that the rate of demand
growth for 2011 will be less than 2010’s 2.1
percent due to increased fuel efficiency in the
organization for Economic Co-operation and
Development (OECD) countries. It is also
assumed that the oil price in 2011 would
average US$79.40/bbl. On the other hand, it
has been posited that warmer weather and
increased production from shale gas fields are
the likely causes of gas price falls.
Many producers continue to drill in shale
gas regions in order to maintain their
leases. Available evidence shows that since
bottoming out in July 2008, the rig count
has increased 52 percent, with 63 percent
of that increase attributable to horizontal
rigs. This means that the price outlook for
natural gas will remain weak throughout
2010 and in fact, within the short-term. We
see nothing very positive on the horizon to
push gas prices above their recent trading
range for the rest of this year. In addition,
in an era of technological progress, greater
convergence between global gas markets
and the declining relevance of established
pricing patterns in the continental
European pipeline business appear to be
the norm in the short- to medium-term.
8. Is Gas Going to be a Dominant
Source of Future Energy Source?
By energy source, the projected increase in
natural gas consumption is second only to
coal: natural gas currently accounts for 20
percent of global electricity production,
second only to coal at 41 percent. In the
power sector, natural gas is an attractive
choice for new generating plants because
of its relative fuel efficiency. Natural gas
also burns more cleanly than coal or
petroleum products. As more governments
begin implementing national or regional
plans to reduce carbon dioxide emissions,
they may encourage the use of natural gas
to displace liquids and coal. The steady
increase in the use of natural gas in power
generation has resulted in a greater inter-
dependence between gas and electricity
markets. Even in developing countries, gas
use in energy generation is also increasing.
The low price trend of gas further puts it in
a better competitive position relative to
coal, especially in Europe. Another factor
going for gas is that among fossil fuels it
has the lowest carbon dioxide emissions
(21 percent compared to 44 percent for
coal and 35 percent for oil). It has also
been estimated that 10 percent coal
displacement by natural gas would result
in 1.1 billion tons of carbon dioxide by
2030. All these indicate that gas-fired
power generation could become the swing
resource utilization to provide flexibility in
power systems with large shares of
intermittent renewable generation.
Crude Oil and Natural Gas Production in Africa and the Global Market Situation Page 14
“The low price
trend of gas
further puts it in a
better competitive
position relative to
coal, especially in
Europe. Another
factor going for
gas is that among
fossil fuels it has
the lowest carbon
dioxide emissions
(21 percent 35
percent for oil)...”
“Dollar exchange
against major
currencies is a
critical factor
affecting oil price
movements.
Dollar-
denominated
commodities like
crude oil tend to
move inversely to
the U.S.
currency...”
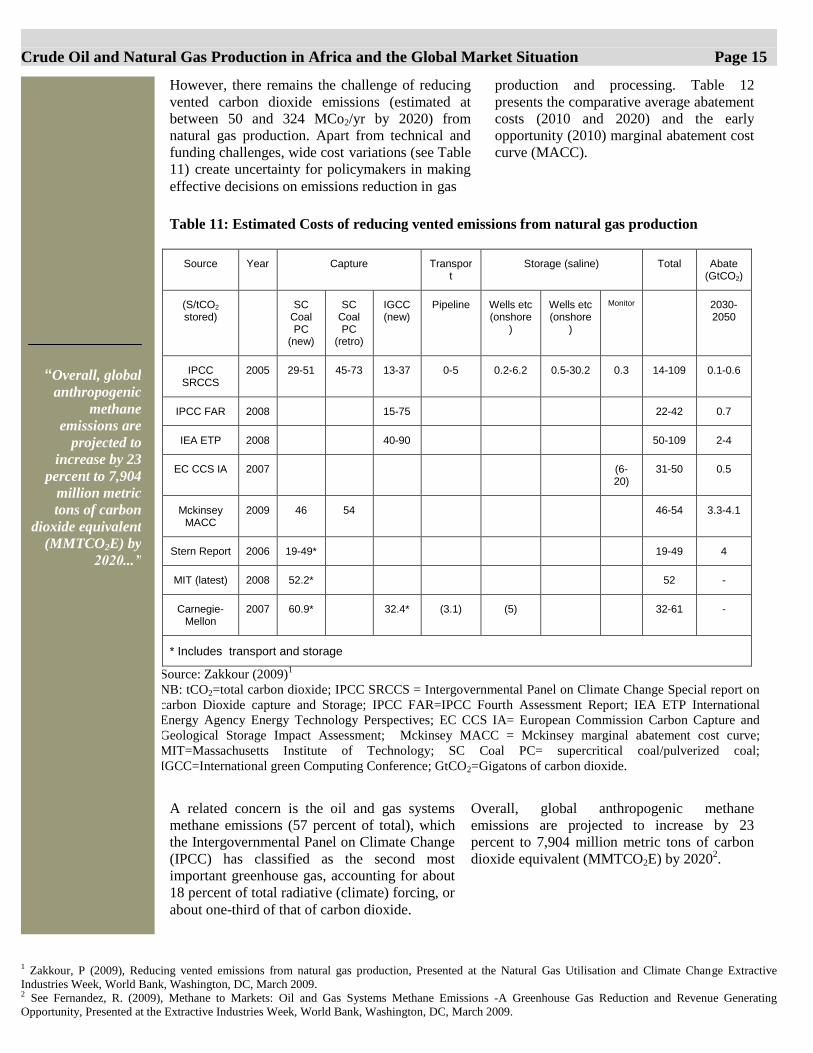
However, there remains the challenge of reducing
vented carbon dioxide emissions (estimated at
between 50 and 324 MCo2/yr by 2020) from
natural gas production. Apart from technical and
funding challenges, wide cost variations (see Table
11) create uncertainty for policymakers in making
effective decisions on emissions reduction in gas
production and processing. Table 12
presents the comparative average abatement
costs (2010 and 2020) and the early
opportunity (2010) marginal abatement cost
curve (MACC).
Table 11: Estimated Costs of reducing vented emissions from natural gas production
Source Year Capture Transport
Storage (saline) Total Abate (GtCO2)
(S/tCO2 stored)
SC Coal PC
(new)
SC Coal PC
(retro)
IGCC (new)
Pipeline Wells etc (onshore
)
Wells etc (onshore
)
Monitor 2030-2050
IPCC SRCCS
2005 29-51 45-73 13-37 0-5 0.2-6.2 0.5-30.2 0.3 14-109 0.1-0.6
IPCC FAR 2008 15-75 22-42 0.7
IEA ETP 2008 40-90 50-109 2-4
EC CCS IA 2007 (6-20)
31-50 0.5
Mckinsey MACC
2009 46 54 46-54 3.3-4.1
Stern Report 2006 19-49* 19-49 4
MIT (latest) 2008 52.2* 52 -
Carnegie-Mellon
2007 60.9* 32.4* (3.1) (5) 32-61 -
* Includes transport and storage
Source: Zakkour (2009)1
NB: tCO2=total carbon dioxide; IPCC SRCCS = Intergovernmental Panel on Climate Change Special report on
carbon Dioxide capture and Storage; IPCC FAR=IPCC Fourth Assessment Report; IEA ETP International
Energy Agency Energy Technology Perspectives; EC CCS IA= European Commission Carbon Capture and
Geological Storage Impact Assessment; Mckinsey MACC = Mckinsey marginal abatement cost curve;
MIT=Massachusetts Institute of Technology; SC Coal PC= supercritical coal/pulverized coal;
IGCC=International green Computing Conference; GtCO2=Gigatons of carbon dioxide.
A related concern is the oil and gas systems
methane emissions (57 percent of total), which
the Intergovernmental Panel on Climate Change
(IPCC) has classified as the second most
important greenhouse gas, accounting for about
18 percent of total radiative (climate) forcing, or about one-third of that of carbon dioxide.
Overall, global anthropogenic methane
emissions are projected to increase by 23
percent to 7,904 million metric tons of carbon
dioxide equivalent (MMTCO2E) by 20202.
Crude Oil and Natural Gas Production in Africa and the Global Market Situation Page 15
1 Zakkour, P (2009), Reducing vented emissions from natural gas production, Presented at the Natural Gas Utilisation and Climate Change Extractive
Industries Week, World Bank, Washington, DC, March 2009. 2 See Fernandez, R. (2009), Methane to Markets: Oil and Gas Systems Methane Emissions -A Greenhouse Gas Reduction and Revenue Generating
Opportunity, Presented at the Extractive Industries Week, World Bank, Washington, DC, March 2009.
“Overall, global
anthropogenic
methane
emissions are
projected to
increase by 23
percent to 7,904
million metric
tons of carbon
dioxide equivalent
(MMTCO2E) by
2020...”

Table 12: Estimated Costs of reducing vented emissions from natural gas production
–all “early opportunities” (1)
2010 2020
Abatement potential (MtCO2)
Average Cost
($/tCO2)
Abatement potential (MtCO2)
Average Cost
($/tCO2)
NGP 219 18 318 14
Ammonia 97 62 97 62
Fertilizer 97 92 12 92
Ethanol 14 104 14 103
Refineries 292 115 292 115
Hydrogen 6 115 6 115
Cement 600 138 600 138
Coal power 0 n.a. 93 36
Gas power 0 n.a. 28 48
Total 1,240 - 1,455 -
1Notes: IPCC defines early opportunities as projects that (are likely to) ‘involve CO2 captured from a
high purity, low-cost source, the transport of CO2 over distances of less than 50 km, coupled with CO2 storage in a value-added application such as EOR”. Early opportunities here include longer transport distances and lower purity sources (e.g. cement).
Source: Zakkour (2009)2
It is estimated that 100 billion cubic meters of
natural gas is vented or lost through fugitive
emissions from the oil and gas sector worldwide
each year. Since methane is 21 times as potent a
greenhouse gas as carbon dioxide, these emissions
add more than 1000 million metric tons of carbon
dioxide equivalent to the atmosphere annually. In
addition, global gas flaring results in 400 million
metric tons of carbon dioxide to the atmosphere
annually. The good news is that it has been
estimated that over 30 percent of these emissions
could be captured at a profit and therefore billions
of dollars are lost annually without action.
Though, in some cases, infrastructure and market
barriers exist, today technologies do exist to
detect, measure, capture and use vented or fugitive
methane emissions thus providing cost-effective methane mitigation opportunities and further
increase gas-power generation and utilization.
9. Conclusion
It is recognized today that short- to medium-term
oil market trends are hinged on two main factors:
the threat to global economic recovery from
OECD sovereign debt issues, and the
sustainability of Chinese oil demand
growth. Given these factors, the global oil
market appears subdued. On the other hand,
in Africa’s crude oil-dependent economies,
the current price volatility can result in
growth instability. Growth volatility, in
turn, can result in these countries’ inability
to achieve higher levels of living standards.
Crude oil endowment, like other natural
resources, is a source of wealth if well
managed, to support growth and
development. This involves converting the
wealth into physical and human capital to
increase and sustain economic growth, and
alleviate poverty. The successful pathway
to fully harnessing the benefits of having
oil endowment in Africa is nested in good
institutions and governance, and sound
economic policies. These are indispensable
conditions not only for efficient
management of oil revenue but also for
these countries to diversify away from
crude oil dependence.
Crude Oil and Natural Gas Production in Africa and the Global Market Situation Page 16
“…short- to medium-
term oil market trends
are hinged on two
main factors: the
threat to global
economic recovery
from OECD sovereign
debt issues, and the
sustainability of
Chinese oil demand
growth...”
“The successful
pathway to fully
harnessing the
benefits of having oil
endowment in Africa
is nested in good
institutions and
governance, and
sound economic
policies...”

While gas is potentially the fuel of choice in
the foreseeable future, the cost and
technological challenges to the profitable
reduction of carbon dioxide and methane
(through carbon capture and storage) from
gas production and processing remain huge.
In addition, trading in emission certificates
would make natural gas significantly more
competitive vis-à-vis fossil alternatives since
it is widely accepted that the combustion of
natural gas emits less carbon dioxide than hard coal and lignite.
The current gas glut is likely to persist for
some time to come, with severe repercussions
on pricing but it provides new opportunities
for consumers and gas-fired power generation and utilization. However, for gas producers it
is not yet celebration time while the
momentum towards the formation of an
Organization of Gas Exporting Countries
(“Gas OPEC”) will wane.
Crude Oil and Natural Gas Production in Africa and the Global Market Situation Page 17
“The current gas
glut is likely to
persist for some
time to come, with
severe
repercussions on
pricing but it
provides new
opportunities for
consumers and
gas-fired power
generation and
utilization...”