commissioned by trafikverket to kth sth, lighting...
TRANSCRIPT

- 1 -
Research Project: Lighting Häggvik Tunnel, Sollentuna
Commissioned by Trafikverket to KTH STH, lighting
laboratory.
2012/01/16 – 2012/07/16
Project manager: Prof. Jan Ejhed, head of department.
Researcher: Eran Aronson, B.Design, Msc. Lighting design.

- 2 -
Table of contents
Background 3-4
Research question 4-6
Methodology 7-11
Testing 11-14
Results 15-30
Conclusions 31-32
Acknowledgments 33
Appendix 34-44

- 3 -
Background
During December of 2011, Christer Berg and Micael Bäckström of Trafikverket had requested
the lighting laboratory in the school of health and science (STH) at KTH, to conduct research
regarding the qualities of LED lighting in tunnels vs. those of HPS lighting.
This research commission is part of the Stockholm Bypass project connecting the E-18 and E-4
highways around western Stockholm. The Stockholm Bypass is to be completed in 2020,
resulting in 18km of tunnels out of the 21km route.
We, in the lighting laboratory, accepted the commission with prospects for gain of knowledge,
mutual experience transfer and an ongoing collaboration with Trafikverket.

- 4 -
Personnel involved:
KTH: Project manager, Prof. Jan Ejhed. Head of the lighting laboratory, STH KTH.
Researcher, Eran Aronson. Masters’ graduate, architectural lighting design, STH KTH.
Trafikverket: Senior Project Manager Christer Berg.
Senior Engineering Consultant Micael Bäckström.
Lightning Engineer Consultant,Petter Hafdell.
Lightning Engineer Consultant,Henrik Gidlund.
Research question
Trafikverket’s representatives and research commissioners, Christer Berg and Micael
Bäeckström, had explained to the KTH staff what are the main interests in the research
concerning them: As part of the planning of the large scale Stockholm bypass project, safety and
costs are of immense importance. In order to improve both aspects which are strongly
correlated, concerning better light quality and higher safety standards, they asked the lighting
laboratory at STH KTH to conduct research comparing traditional HPS lighting with newly fitted
LED lighting.
The main objective is to establish a scientific assumption proving that LED lighting will serve
better the purpose of lighting in a tunnel regarding perception and energy efficiency, as
compared to HPS lighting. That, if proved, will allow Trafikverket to invest in LED lighting within
the Stockholm bypass project and acquire the knowledge for implementation there and in other
relevant projects.
Hypothesis The minimum level of light in the main part of a tunnel when driving at 90km/h is 5cd/m2 (to
the Swedish standard, table below). Trafikverket’s interest is to check if, when using LED's as the
main light source in a tunnel, can a level lower then 5cd/m2 be sufficient in all parameters due
to the superior light qualities of LED's (?). That, if proven possible, will result in a long term
significant power save, reducing costs while saving valuable energy.
REFERENSHASTIGHET KM/H
MEDELLUMINANS CD/M2
LUMINANSJÄMNHET TOT
LUMINANSJÄMNHET LÄNGS
50 3 – 6 0,4 0,6 70 3 – 6 0,4 0,6 90 5 –10 0,4 0,6
- 5 -
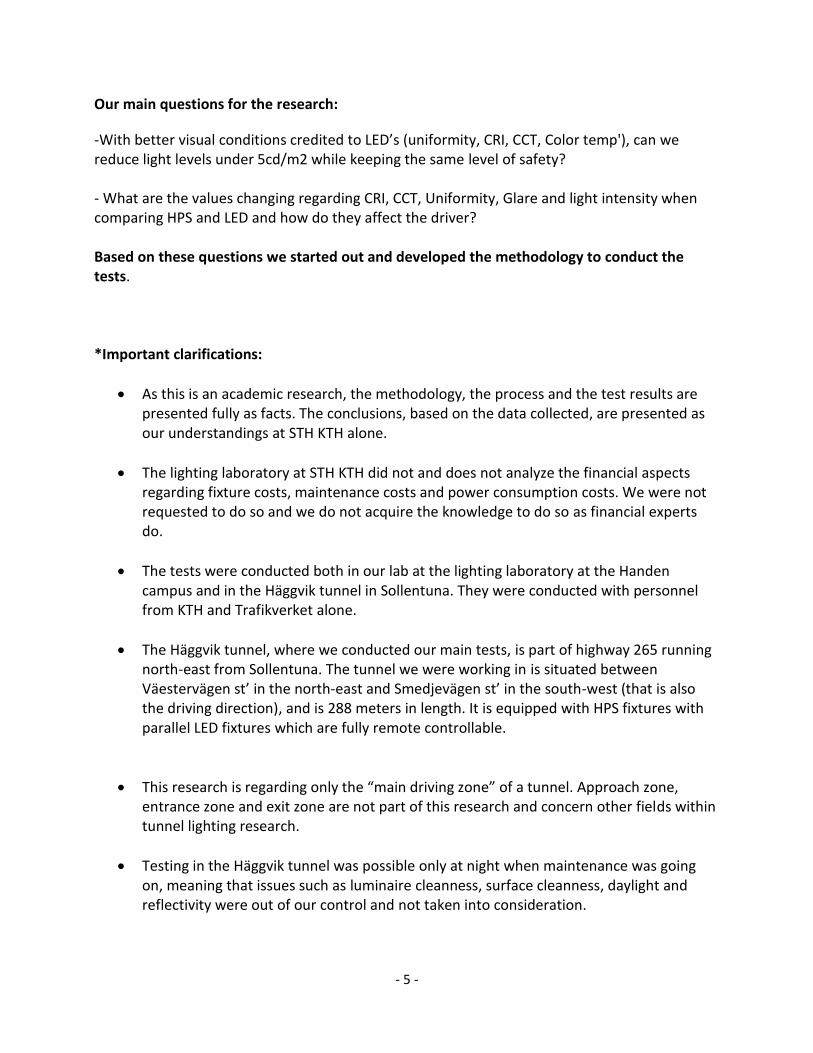
Our main questions for the research:
-With better visual conditions credited to LED’s (uniformity, CRI, CCT, Color temp'), can we reduce light levels under 5cd/m2 while keeping the same level of safety? - What are the values changing regarding CRI, CCT, Uniformity, Glare and light intensity when comparing HPS and LED and how do they affect the driver? Based on these questions we started out and developed the methodology to conduct the tests. *Important clarifications:
As this is an academic research, the methodology, the process and the test results are presented fully as facts. The conclusions, based on the data collected, are presented as our understandings at STH KTH alone.
The lighting laboratory at STH KTH did not and does not analyze the financial aspects regarding fixture costs, maintenance costs and power consumption costs. We were not requested to do so and we do not acquire the knowledge to do so as financial experts do.
The tests were conducted both in our lab at the lighting laboratory at the Handen campus and in the Häggvik tunnel in Sollentuna. They were conducted with personnel from KTH and Trafikverket alone.
The Häggvik tunnel, where we conducted our main tests, is part of highway 265 running north-east from Sollentuna. The tunnel we were working in is situated between Väestervägen st’ in the north-east and Smedjevägen st’ in the south-west (that is also the driving direction), and is 288 meters in length. It is equipped with HPS fixtures with parallel LED fixtures which are fully remote controllable.
This research is regarding only the “main driving zone” of a tunnel. Approach zone, entrance zone and exit zone are not part of this research and concern other fields within tunnel lighting research.
Testing in the Häggvik tunnel was possible only at night when maintenance was going on, meaning that issues such as luminaire cleanness, surface cleanness, daylight and reflectivity were out of our control and not taken into consideration.

- 6 -
Häggvik tunnel location

- 7 -
Methodology Overview In the process of validating a suitable methodology for the research questions, our first intuitive direction was towards conducting tests of driver reaction time in the tunnel. The idea was about measuring the exact moment when a driver hits the breaks when he/she recognizes an obstacle. This methodology was later abandoned since, after reevaluating it, we recognized that as a methodology it will provide information that is irrelevant for our study, and therefore result in receiving data not meaningful in relation to the research question. Another important factor persuading us to abandon this methodology was the safety issue. That kind of test demanded driving at high speeds towards static obstacles, which we naturally wanted to avoid. However, as part of the research process, it is important to follow this step as a comparison to the later chosen methodology and as a reference to understand better the dynamics and logic that follows. Early visualizations of reaction time methodology:

- 8 -
On 2012/02/14 we went on to the Häggvik tunnel for a preliminary test and evaluation of the conditions and feasibility of the reaction time methodology. Some simple technical issues were checked out, such as the measuring grid on the tunnel walls, the lighting conditions and the driving-visibility conditions. On site personnel: Micael Bäeckström, Christer Berg and Petter Hafdell of Trafikverket. Eran Aronson, Jan Ejhed and Rodrigo Muro of KTH. Preliminary tunnel observation test 2012/02/14:
The 2012/02/14 preliminary observation was valuable for the general process in a few ways; we had the chance to observe closely our main testing site and by that understanding the volumes of space, the lighting configuration, getting an early sense of the driving distances we will be dealing with, the surfaces (walls, ceiling, asphalt – reflectance and color), and safety issues as well. This visit to the tunnel, and the basic tests we were conducting there, eventually contributed to the understanding that the reaction time methodology is a step in the right direction, but should not be the methodology to practice in the end.
- 9 -
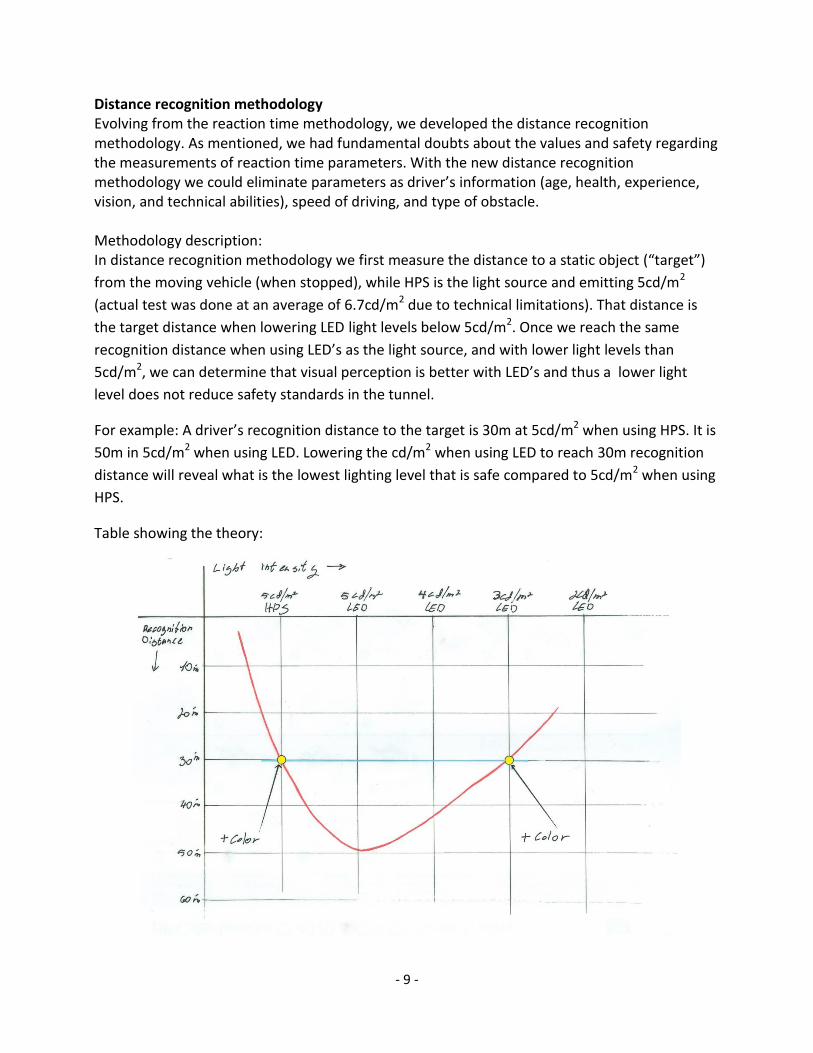
Distance recognition methodology Evolving from the reaction time methodology, we developed the distance recognition methodology. As mentioned, we had fundamental doubts about the values and safety regarding the measurements of reaction time parameters. With the new distance recognition methodology we could eliminate parameters as driver’s information (age, health, experience, vision, and technical abilities), speed of driving, and type of obstacle. Methodology description: In distance recognition methodology we first measure the distance to a static object (“target”)
from the moving vehicle (when stopped), while HPS is the light source and emitting 5cd/m2
(actual test was done at an average of 6.7cd/m2 due to technical limitations). That distance is
the target distance when lowering LED light levels below 5cd/m2. Once we reach the same
recognition distance when using LED’s as the light source, and with lower light levels than
5cd/m2, we can determine that visual perception is better with LED’s and thus a lower light
level does not reduce safety standards in the tunnel.
For example: A driver’s recognition distance to the target is 30m at 5cd/m2 when using HPS. It is
50m in 5cd/m2 when using LED. Lowering the cd/m2 when using LED to reach 30m recognition
distance will reveal what is the lowest lighting level that is safe compared to 5cd/m2 when using
HPS.
Table showing the theory:

- 10 -
Color recognition In an attempt to add the color variable to support the distance recognition methodology, suggested by Micael Bäckström, we decided to engage color recognition as part of the main test scheduled for 2010/04/03. As the main character of the methodology is about visual perception in changing lighting conditions, and for simply taking the opportunity of a full scale test, we agreed that the color recognition findings will most probably support our future conclusions and data. Quick lab tests were done to check the feasibility of color recognition tests. These tests were not meant to be scientifically accurate, but to show the different sense of perception of colors when lit under HPS vs. LED. Simple scale models were placed under a 150w/HPS (Philips outdoor “Decoflood” fixture with an Osram High-Intensity Discharge Lamp, VIALOX® NAV®-T, SON-T HPS, E40 GES, 2000K, 150W, CRI25),
and a 30w/LED (2X Meyer “Super Light Compact Micro”, 5x3w LED, neutral white 4000K, CRI80)
light sources. Cd/m2 measurements were taken (Hagner “Screen Master”, serial #30516) to show the numeric differences. This test showed clearly the visual differences regarding CRI, CCT, shadows, sharpness and atmosphere while the LED emits half or less cd/m2 on the models compared to the HPS source. Color lab test examples:

- 11 -
Clearly noticeable, besides the color shift on the models and the numeric differences, is the dramatic change regarding the background. In the photos showing the models under the HPS light source (left) the background is completely lit and flooded with light. On the other hand, when observing the photos taken under the LED light source (right) the background “disappears” and is actually almost not lit at all. The reason for that comes from the different optics used by the different light sources in this preliminary test; while the Philips “Decoflood” (HPS) uses a wide beam reflector, the Meyer “Super Light Compact Micro” (LED) uses a narrow beam reflector. This difference is purely a result of these technical differences and does not imply or suggest of any other visual parameters which are of the properties of these light sources. Important to mention as well is the fact that the photos were not done and not intended to acquire a professional attitude regarding values such as ISO, aperture and exposure, therefore they stand only for documentation of the preliminary lab test in the simplest manner.
Testing
Methodology in practice Scheduled for 2010/04/04-03, the main test was conducted as planned between 22:00-04:30 with personnel of 20 people, both from Trafikverket and KTH. How did we translate the methodology to practice?
This model sketch above shows the action plan for the tunnel test. On the top left is the target vehicle (black & red), behind it in the center is the test vehicle (blue), and at the bottom are located measuring + control functions. Participants/users are at the waiting area to the top right, at the time of the test they were situated at the bottom right.

- 12 -
Recognition to target means: the measured distance point where a driver stops the moving car. That point is where the driver can clearly read the license plate number.
Color recognition test follows the distance recognition test at the same point where the car is stopped. For that the license plate is swapped for a colored license plate, and the driver is now asked what colors does he/she recognizes.
Testing flow
1. Light levels adjusted.
2. Light levels measured using luminance camera and Hagner photometer.
3. Driver moves to target – stops at recognition point.
4. Laser measurements are documented, photos are taken. Additional color testing is done
at the stopping point.
5. Car is reversed to starting point and driver changes.
This is repeated for the number of test drivers for every light level.

- 13 -
Detailed example: All operating personnel and equipment are ready on location light levels
measured and approved driver drives to target, stops at recognition point measuring is
taken (laser) and documented (writing on prepared document and photography of vehicle +
markings), color recognition takes place driver reverses to starting point and between tests,
license plates are changed.
- 11 drivers were taking part of the test; all were KTH lighting laboratory students and staff.
- 4 tests were conducted in the following sequence: 6.7cd/m2 using HPS
2.2cd/m2 using LED
3.2cd/m2 using LED
4.2cd/m2 using LED
- 44 tests for distance recognition took place + 44 tests for color recognition = 88 tests
altogether.
License plate numbers were changed between every test in order to eliminate the
memory factor. So were the color license plates changed – the color sequence.
Tests were done in groups of 11 for every light level (distance followed by color).
Although the planned cd/m2 for the HPS test was 5cd/m2, we technically could not go
lower than that figure. On the other hand, we were measuring average luminance to a
selected area on site (the back of the target vehicle in a radius of approx. 5 meters). That
means that on a different surface or direction we could have possibly measured 5cd/m2.
The Hagner photometer was used as well for every test and was taking measurements to
the asphalt surface approaching the target vehicle (from the driver vehicle direction),
and to the license plate itself.
The LED luminance was controlled by % of power from the operator’s mobile
workstation.
All vehicle lights were turned off in both the target vehicle and the moving vehicle. That
means that there was no influence by red backlights or front headlight during the tests
regarding distance recognition and color recognition.
- 14 -
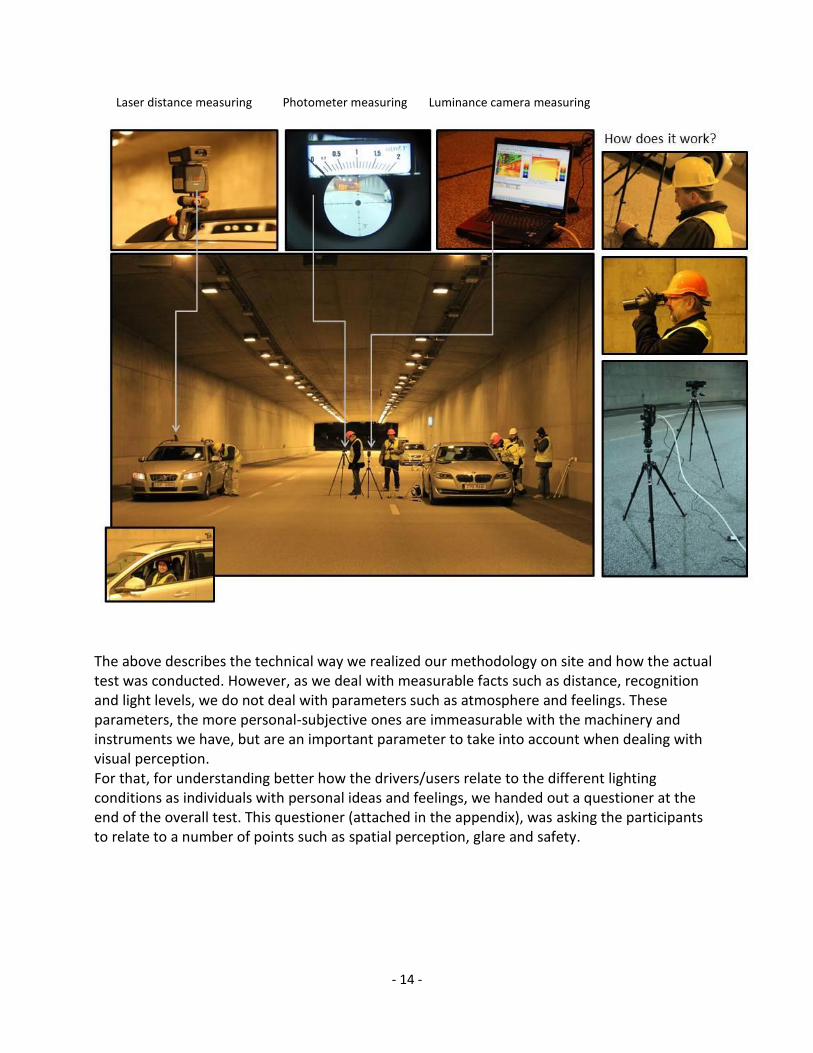
Laser distance measuring Photometer measuring Luminance camera measuring
The above describes the technical way we realized our methodology on site and how the actual test was conducted. However, as we deal with measurable facts such as distance, recognition and light levels, we do not deal with parameters such as atmosphere and feelings. These parameters, the more personal-subjective ones are immeasurable with the machinery and instruments we have, but are an important parameter to take into account when dealing with visual perception. For that, for understanding better how the drivers/users relate to the different lighting conditions as individuals with personal ideas and feelings, we handed out a questioner at the end of the overall test. This questioner (attached in the appendix), was asking the participants to relate to a number of points such as spatial perception, glare and safety.

- 15 -
Results
Distance recognition
Below are the data chart and the graph of all 11 participants regarding distance recognition.
Three observations are clear to see:
1. The tendency is going down from 6.7cd/m2 HPS to 2.2 cd/m2 LED, and then higher through 3.2
cd/m2 LED to 4.2 cd/m2 LED.
2. The average distances vary in small differences; 0.5m’ – 2.7m’.
3. The similarity between individual patterns of distance recognition is not always predictable.
That means that only the overall average can indicate of a clear tendency.
cd/m2LalioAndriYaroslavAndikaAlexandraAndrePerJannaJanOgniyanaRodrigoAverage
6.7HPS26,65936,06637,29823,35318,40136,90137,60329,90932,72222,20122,3829,41
2.2LED29,95328,5731,11323,00219,83733,45434,10130,10727,69422,1130,53128,22
3.2LED32,94932,52638,75326,40723,5130,99538,90130,88429,20123,05327,85730,46
4.2LED34,31132,55531,67624,1421,63132,40441,7529,12832,08824,55936,22430,95
Graph showing all 11 participants results individualy (fig.1):

- 16 -
Chart showing all 11 participants results individually (fig.2):
As seen here, it is hard to get an indication of the tendency simply by observing the raw data of
distance recognition by individuals. You may notice, by comparing the length of the bars, that
some individuals have better eye sight or better distance perception than others. But that is not
relevant to our methodology since we are dealing with data in a relative approach, as opposed
to data that is critical in a comparison approach.
For example: The fact that Alexandra’s bars are generally shorter than those of Per, isn’t
relevant to our study. However, the comparison of the four bars in relation to the light source is
what we are after.
Lalio
Andri
Yaroslav
Andika
Alexandra
Andre
Per
Janna
Jan
Ogniyana
Rodrigo
26,659
36,066
37,298
23,353
18,401
36,901
37,603
29,909
32,722
22,201
22,38
29,953
28,57
31,113
23,002
19,837
33,454
34,101
30,107
27,694
22,11
30,531
32,949
32,526
38,753
26,407
23,51
30,995
38,901
30,884
29,201
23,053
27,857
34,311
32,555
31,676
24,14
21,631
32,404
41,75
29,128
32,088
24,559
36,224
4.2LED 3.2LED 2.2LED 6.7HPS

- 17 -
Graph showing average distance recognition results in meters (fig.3):
The graph above shows the tendency by an average of all 11 participants. It is clear to see here
the overall tendency in distance recognition: 2.2cd/m2 LED scores the lowest distance followed
by 6.7cd/m2 HPS, and climbing up to 3.2cd/m2 LED to finally reach 4.2cd/m2 LED.
By that we can prove our basic hypothesis: Even when using LED’s in lower luminance levels
we can increase the recognition distance!
In this particular test, according to the precise luminance levels tested only, we can determine
that in luminance levels of 3.2cd/m2 using LED, and 4.2cd/m2 using LED, distance recognition
is greater than the distance recognition when using 6.7cd/m2 with HPS, and therefore
necessarily greater than that when using 5 cd/m2 with HPS as well.
30,9
30,4
29,4
28,2
26,5
27
27,5
28
28,5
29
29,5
30
30,5
31
31,5
4.2 LED3.2 LED6.7 HPS2.2 LED

- 18 -
Graph showing average distance recognition results in meters by test sequence and on a large
scale (fig.4):
Analyzing the same data from a different point of view, when simply changing the meters scale
from 0 to 50, we can easily point out that we actually deal here with very minor changes in
distance recognition (2.7 meters from Min’ to Max’). That is another understanding that comes
to show how it is possible to keep the same, or even better, light related safety conditions
when reducing the light levels in half or more. These figures, shown from a different
perspective, are valuable for the understanding that LED lighting is potentially a complete
alternative to HPS lighting in tunnels.
30,9 30,4 29,4
28,2
0
5
10
15
20
25
30
35
40
45
50
4.2 LED3.2 LED6.7 HPS2.2 LED

- 19 -
Color recognition
Graph showing overall color recognition according to light levels (fig.5):
The graph above shows how many colors in percentage were recognized by all 11 participants in
every one of the 4 tests. It shows that the least amount of colors were recognized when using
3.2cd/m2 LED (test #3), doing better was the 2.2cd/m2 LED (test #2). Surprisingly enough is the
6.7cd/m2 HPS test (test #1) that scores only 11% under the best at 4.2cd/m2 LED (test #4).
This finding might suggest that there is a threshold correlation between the light intensity and
the light source. In other words, it may occur that even with a better light source (CRI, CCT,
spread, uniformity…) such as LED, under a certain low light level and from a certain distance, the
observer will not necessarily better recognize colors.
However, in that case we would expect the 3.2cd/m2 LED to score higher than the 2.2cd/m2
LED. The fact that it didn’t score higher can be explained by the fatigue factor; the tests, as
mentioned, were conducted between 22:00am to 04:30am. #1 was 6.7cd/m2 HPS, #2 was
0,00%
10,00%
20,00%
30,00%
40,00%
50,00%
60,00%
70,00%
80,00%
90,00%
100,00%
LED 4.2 HPS 6.7 LED 2.2 LED 3.2
90%
79%
67% 63%

- 20 -
2.2cd/m2 LED, #3 was 3.2cd/m2 LED and #4 was 4.2cd/m2 LED. Each test took between 1-1.5
hours.
Fatigue was not measured in any way during the tests, but was clearly noticed. The most
difficult hours for the participants were between 01:00am to 03:30 am roughly. These hours are
when tests #2 (2.2cd/m2 LED ) and #3 (3.2cd/m2 LED) were taking place. Then why test #4
(4.2cd/m2 LED) still scored better? In the technical aspect it had the best lighting conditions
regarding all parameters (besides glare), and in the psychological aspect, the participants knew
it is the last test and were eager to get it done with, plus most of them were physically active at
that time packing up and cleaning the test site.
Visual system
Another important factor to consider, besides the fatigue factor, is regarding the human visual
system. We know that mesopic vision is fully adapted at luminance conditions between those of
scotopic and photopic vision, i.e., between about (the precise figures are not settled and can
vary from different sources. However, the figures shown here are in the margin of error
between 0.001 to 0.004) 0.034CD/m2 and 3.4CD/m2, this is when both photopic and scotopic
visual systems actually work together. With luminance levels under 0.034CD/m2 we will be
using our scotopic visual system (rods) and therefore will be almost completely color blind. On
the other hand, when light levels in our surroundings are higher than 3.4CD/m2 we will be using
our photopic visual system (cones) and see color at the full spectrum visible for humans. When
using the combination – mesopic vision (rods and cones) in approximately the luminance range
mentioned above, we will be more sensitive to light sources with shorter wavelengths in the
more “cooler” color range of blue-green but still recognize most of the visible human color
spectrum with longer wavelengths. Our tests with the lowest cd/m2: 2.2 and 3.2 gave us the
worst results regarding color recognition. These tests were done still in the mesopic range,
when 3.2CD/m2 is on the border between mesopic and photopic vision. Once using 6.7 and 4.2
cd/m2 (into photopic vision) we saw an increase of up to 27% in color recognition. When
dividing our tests to mesopic and photopic, we can possibly understand better our test results:
over 3.4CD/m2 (4.2LED and 6.7HPS) our results in color recognition are far better. Lower then
3.4CD/m2, our test results show a clear decrease in color recognition, meaning that color
recognition in mesopic vision (and naturally into scotopic vision) is becoming arguably
irrelevant.

- 21 -
That is a point to take into account when searching for the “ideal” light level from the “ideal”
light source. We will have color recognition loss under approx’ 3.4 cd/m2 due to the use of our
mesopic visual system, yet we are in search for the lowest light level possible to use in tunnels.
That backs the finding of the “green zone” (fig.11) where the recommendation for tunnel
lighting from this research data is between 3.7cd/m2 to 4.0cd/m2 when using LED in the range of
photopic vision and at its minimum before shifting to mesopic vision.
If we do not seek color recognition as a goal, or as a fundamental parameter for tunnel lighting,
we can easily go lower than 3cd/m2 in light levels and still keep distance recognition at a
satisfactory safety level (compared to HPS lighting).
Graph showing color recognition by color (fig.6):
This graph shows which color was recognized in percentage. It is clear to see that white was
recognized the most, while black was recognized the least. In between we recognize the rest of
the spectrum ranging from light blue to purple.
0,00%
10,00%
20,00%
30,00%
40,00%
50,00%
60,00%
70,00%
80,00%
90,00%
100,00%
1
2
3
4
5
6
7
8
9
10
- 22 -
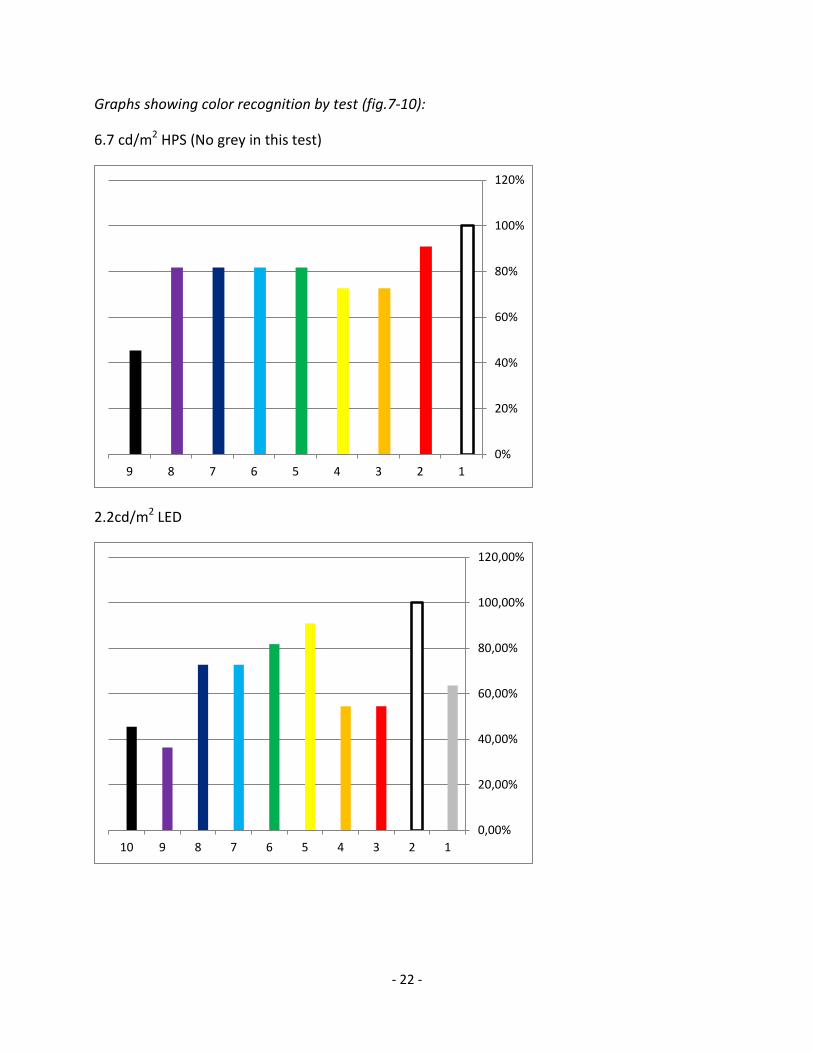
Graphs showing color recognition by test (fig.7-10):
6.7 cd/m2 HPS (No grey in this test)
2.2cd/m2 LED
0%
20%
40%
60%
80%
100%
120%
123456789
0,00%
20,00%
40,00%
60,00%
80,00%
100,00%
120,00%
12345678910

- 23 -
3.2cd/m2 LED
4.2cd/m2 LED (No grey in this test)
0,00%
10,00%
20,00%
30,00%
40,00%
50,00%
60,00%
70,00%
80,00%
90,00%
12345678910
0,00%
20,00%
40,00%
60,00%
80,00%
100,00%
120,00%
123456789

- 24 -
Combined graph showing the correlation between distance recognition and color recognition
according to the test sequence (fig.11):
In this graph, which you can say is the essence of our test, we see both the distance recognition
values and the color recognition values aligned in the test sequence: 6.7cd/m2 HPS 2.2cd/m2
LED 3.2cd/m2 LED 4.2cd/m2 LED.
The best result regarding distance and color recognition goes to 4.2cd/m2 LED, as expected.
Distance recognition (the red line) goes down from 6.7 cd/m2 HPS to 2.2cd/m2 LED and then up
to 3.2cd/m2 LED, to the maximum at 4.2cd/m2 LED. The drop from 6.7cd/m2 HPS to 2.2cd/m2
LED can be explained simply by the light level at 2.2cd/m2 LED that is too low to compete or
equal with the high luminance level of 6.7cd/m2 HPS.
Color recognition results pattern can be explained by the shift between mesopic vision to
photopic vision. The graph goes steadily down from 6.7 cd/m2 HPS to 3.2cd/m2 LED, and then
suddenly summits to the highest score at 4.2cd/m2 LED. That suggests that our “magical” break
point (green triangle), where LED wins over HPS in distance recognition and color recognition, is
somewhere between 3.2cd/m2 LED and 4.2cd/m2 LED. To be more accurate, 3.7cd/m2 LED to
4.0cd/m2 LED.

- 25 -
Questioners
As an important indication to the personal – ‘unmeasured’ parameters of the test, the
questioners give us valuable information regarding the participants’ feelings and attitudes
towards the comparison of HPS vs. LED in terms of comfort, safety and recognition. By reading
the questioners two basic ideas are obvious:
1. LED lighting in the tunnel is favorable (80%-90%) in all questioned parameters; Spatial
perception, depth perception, color recognition, uniformity and shadows. The one
exception to appear repeatedly is glare. The glare factor, mentioned more regarding the
4.2cd/m2 LED test, is marked and written about in every questioner, and is said to be too
strong and disturbing. This data is important as backup to the “green triangle” shown in
fig.10. That means that keeping the luminance level when using LED under 4.2cd/m2 LED
(3.7cd/m2 LED to 4.0cd/m2 LED ) will probably improve the glare problem of the LED. Of
course, shaders and reflectors can also improve the glare problem, but will encourage
light cut-off.
2. When asked about the atmosphere in the tunnel during the different lighting conditions,
most participants were favoring LED lighting regarding safety, surroundings, distance
assessment, near objects, far objects + the overall parameter. The exceptions, to appear
as a minority, are distance assessment and far objects.
Questioner chart data (regarding 8 questioners, 3 were never submitted):
Visual perception: Please fill in the chart by marking “V” as your favorite choice.
HPS LED
Spatial perception 1 7
Depth perception 2 6
Color recognition 0 8
Uniformity 3 5
Glare 7 1
Shadows 2 6
Overall 0 8
Atmosphere: Mark “V” for where you had a better feeling regarding the different
parameters.
HPS LED
Safety 0 8
Surroundings 1 7
Distance assessment 2 6
Near objects 0 8
Far objects 3 5
Overall 0 8

- 26 -
Visual perception graph (fig.12):
Atmosphere graph (fig.13):
Besides writing about the differences between HPS and LED in the tunnel, some participants
mentioned the “fatigue factor” (mentioned on p.18) as a factor that they thought did influence
their ability to function equally sharp in the later tests compared to the earlier tests. Specifically
mentioning the difficulty to differentiate between colors and counting them.
0
1
2
3
4
5
6
7
8
9
HPS
LED
0
1
2
3
4
5
6
7
8
9
HPS
LED

- 27 -
Luminance camera and photo visualizations (fig.14-17):
6.7cd/m2 HPS
Hagner photometer: 8.3cd/m2 on license plate, 11cd/m2 on asphalt.

- 28 -
2.2cd/m2 LED
Hagner photometer: 2cd/m2 on license plate, 3cd/m2 on asphalt.
The photo above, “POH 069”, has the right license plate number for this test, but was
most probably shot at the wrong light source still at HPS – just before changing to LED.

- 29 -
3.2cd/m2 LED
Hagner photometer: 3cd/m2 on license plate, 4cd/m2 on asphalt.

- 30 -
4.2cd/m2 LED
Hagner photometer: 4cd/m2 on license plate, 5cd/m2 on asphalt.

- 31 -
Conclusions 1. Findings (fig.3, 11) Distance recognition decreases from 6.7cd/m2 HPS to 2.2cd/m2 LED. Distance recognition increases from 6.7cd/m2 HPS to 3.2cd/m2 LED and 4.2cd/m2 LED. Conclusion This proves our research hypothesis to be correct: When using LED’s at light levels lower than 5cd/m2, we increase the recognition distance compared to the standard of 5cd/m2 with HPS.
As mentioned, although we were testing at 6.7cd/m2 with HPS and not 5cd/m2 HPS, the results are actually better since the extra 1.7cd/m2 with HPS increased the distance recognition for the first test. If 5cd/m2 HPS were to be used at the start as the HPS luminance, we would have probably reached the target zone earlier than we did with 4.2cd/m2 LED.
2. Findings (fig.5, 11) Color recognition decreases from 6.7cd/m2 HPS to 2.2cd/m2 LED and to 3.2cd/m2 LED. Color recognition increases from 6.7cd/m2 HPS to 4.2cd/m2 LED. Conclusion Light level is a stronger factor, in relation to light quality, for color recognition when using light levels lower than 3.2cd/m2 LED. Light quality becomes a stronger factor for color recognition between 3.2cd/m2 LED and higher to 4.2cd/m2 LED, even when distance recognition becomes bigger. Once shifting from photopic vision to mesopic vision (at approx’ 3.4cd/m2) our color recognition abilities deteriorate down to a level where it is harder to distinguish between different colors.
That is backed by the “green triangle” (fig.10), showing that the point where distance recognition and color recognition merge to the optimum, when using LED’s, is between 3.7cd/m2 LED and 4.0cd/m2 LED (considering the glare factor at 4.2cd/m2 LED to be too sharp).
3. Findings (fig.11) When combining both distance recognition and color recognition data, we find a zone with optimized perception values for tunnel lighting using LED under 5cd/m2, which is the “green triangle”. Conclusion Combining the “green triangle” with the questioner data (fig.11,12), leads to concluding that the ideal luminance level with LED is between 3.7cd/m2 to 4.0cd/m2, and that LED lighting for a tunnel is the preferable solution by users.
The glare factor is one not to ignore. That is why 4.2cd/m2 LED might be considered a slightly too high level. Reducing glare around the 4cd/m2 point using LED should result in absolute favor for the LED by the users.

- 32 -
Exceptions, clarifications and further thoughts
1. This research shows and explains data collected in an overall period of 6 months. During this period lab tests were conducted, one preliminary tunnel test was done and one full scale tunnel test was done. The data collected was analyzed to ultimately prove or disprove our research hypothesis. The results show our hypothesis for distance recognition was correct and that the adding of color recognition tests did eventually contribute and backup the research (if taking into account the color recognition disabilities regarding mesopic vision discussed). It is important to emphasis that the research and the process were thought of and conducted according to our understandings, based on our methodology. We find this research satisfactory, according to the goals we set to achieve, and we believe we have answered the research questions according to the request of Trafikverket.
2. Color recognition, set from the start as a secondary research goal, was proven to be a field wide enough for having its own complete research. Further and deeper research regarding color recognition should deal with nuances we have not had the time and insight to deal with during this research. Examples: The colors used the color sequence (on the license plates), the connection between color and distance vs. color and light source (that was talked about, but not tested scientifically. It was an observation), color and atmosphere (psychological aspect) and color recognition regarding our visual system, photopic-mesopic-scotopic photometry. In any case, we could establish that for the best result with distance recognition the best result for color recognition appeared as well.
3. It is important to note that after re-evaluating the final draft paper, and in a manner of self-judgment and criticism to check and think what we did right and what we did wrong, we (KTH staff together with Trafikverket staff) were questioning the relevancy of some matters, the most important of them was color recognition. This led to the adding of the discussion about the human visual system and the connection of it to our research. As mentioned previously, color on all its aspects is a field wide enough for big scale comprehensive research alone. The lessons learned here about color are valuable for understanding better the scope of the matter and for evaluating the need and methods for dealing with it in future researches.
4. Organization and cooperation between KTH and Trafikverket, during the whole process,
was excellent and contributed considerably to the fruitful process and ultimately to the research results. The guarantee that everyone involved will do their best and the fact that we, at KTH, were trusted to develop and conduct the research as we saw right, gave us freedom of thought and a sense of security. We welcome the lighting specialists of Trafikverket to accept an active role during future projects, we believe that will strengthen our cooperation and enhance our professionalism both ways.

- 33 -
Acknowledgments
Special thanks to Christer Berg and Micael Bäeckström for the enthusiasm, cooperation, long late hours in the tunnel and the trust throughout the process.
The professional help and advice by Petter Hafdell and Henrik Gidlund, who worked with us during the whole process from start to end and shared their valuable knowledge with us.
The technical support and positive attitude by Trafikverket’s operators during the full scale tunnel test.
Prof’ Jan Ejhed, for sharing knowledge, hours of conversation and open minded support.
Rodrigo Muro, for helping all the way both technically and professionally.
Our indispensable, always smiling, test participants: Lalio Penev, Andri Reynisson, Yaroslav Paslavskiy, Andika Pradana, Alexandra Vogel, Andre Martins, Per Henrik Branzell, Janna Witt, Ogniyana Zhelezova and Amy Rennie.
Thank you!

- 34 -
Appendix
Detailed individual data

- 35 -

- 36 -
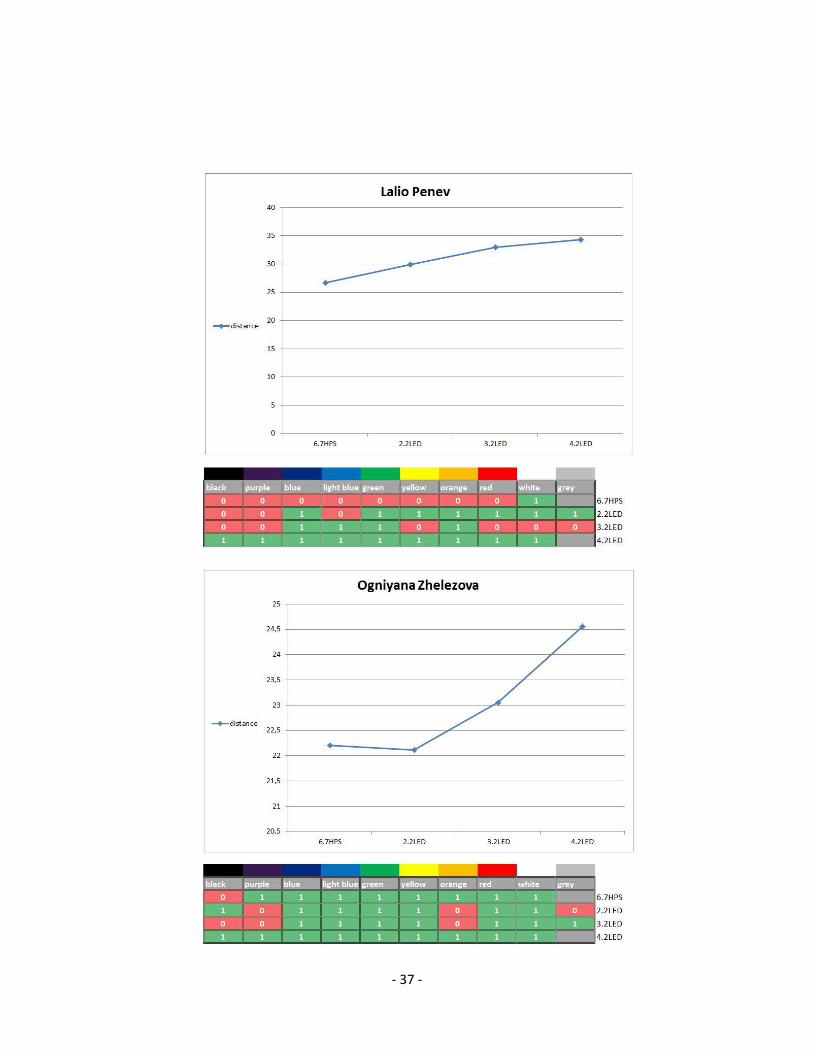
- 37 -
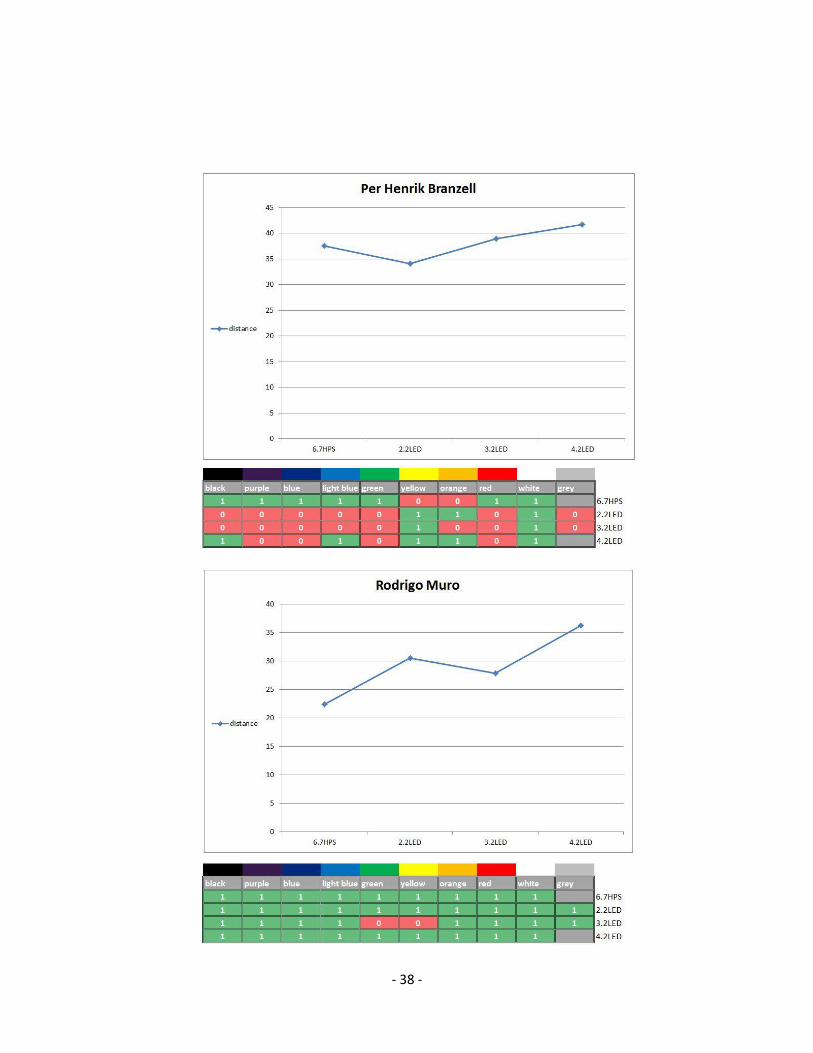
- 38 -

- 39 -
2010-24-03 Tunnel Test Questioner
As opposed to the technically clear tests you were taking part of, this questioner is aimed at
the driver’s feelings in the context of perception. This is since we cannot devise a test where
comfort, atmosphere and general feelings can be measured. It is personal due to physical
and psychological reasons where we do not target our technical tests. Nevertheless, safety is
a factor that has a lot to do with feelings, not only technical matters. We will appreciate it
very much if you can give us feedback regarding the overall experience and the particular
experiences in different lighting conditions you have taken part of tonight.
1. User details: Male Female
Age 20-25 , 25-30 , 30-35 , 35-40 , 40-45 , 45-50 , 50-55 ,
55-60 , 60-65 , 65-70
Vision – color blind , optical glasses , perfect eye sight
Profession________________________________________________________________
2. Visual perception: Please fill in the chart by marking “V” as your favorite choice.
HPS LED
Spatial perception
Depth perception
Color recognition
Uniformity
Glare
Shadows
Overall

- 40 -
Comments_____________________________________________________________________
______________________________________________________________________________
______________________________________________________________________________
3. Atmosphere: Mark “V” for where you had a better feeling regarding the different
parameters.
HPS LED
Safety
Surroundings
Distance assessment
Near objects
Far objects
Overall
Comments_____________________________________________________________________
______________________________________________________________________________
______________________________________________________________________________
4. Light levels: This regards the “break even” point between 5cd/m2 HPS and your equal
cd/m2 level of LED. Please answer with words the following questions.
A. Considering the parameters stated in the previous questions and as a test driver
tonight, please indicate what light source you would prefer in a tunnel (HPS/LED) and
why?
_____________________________________________________________________
_____________________________________________________________________
_____________________________________________________________________
_____________________________________________________________________
_____________________________________________________________________
_____________________________________________________________________
_____________________________________________________________________
B. Before analyzing the test results, we would like to know if your feeling of safety as a
driver in the tunnel is higher with any of the light sources and why?
_____________________________________________________________________
_____________________________________________________________________
_____________________________________________________________________
_____________________________________________________________________
- 41 -
_____________________________________________________________________
_____________________________________________________________________
_____________________________________________________________________
C. Please mention if there are any risks, in your opinion, of using any of the light
sources in any of the light levels we tested tonight.
_____________________________________________________________________
_____________________________________________________________________
_____________________________________________________________________
_____________________________________________________________________
_____________________________________________________________________
_____________________________________________________________________
D. We would appreciate to receive any feedback regarding the testing methodology,
the test sequence, overall operation, general conditions, and basically anything you
would like to add professionally or personally.
_____________________________________________________________________
_____________________________________________________________________
_____________________________________________________________________
_____________________________________________________________________
_____________________________________________________________________
_____________________________________________________________________
_____________________________________________________________________
_____________________________________________________________________
_____________________________________________________________________
_____________________________________________________________________
_____________________________________________________________________
_____________________________________________________________________
_____________________________________________________________________
_____________________________________________________________________
_____________________________________________________________________
_____________________________________________________________________
_____________________________________________________________________
_____________________________________________________________________
_____________________________________________________________________
_____________________________________________________________________

- 42 -
_____________________________________________________________________
_____________________________________________________________________
_____________________________________________________________________
_____________________________________________________________________
_____________________________________________________________________
Thank you very much for your cooperation!

- 43 -

- 44 -
Eran Aronson, KTH STH, the lighting laboratory, Håninge August 2012.