comments on “three glass tragedy beginning to rethink (us) financial policy” david a westbrook...
TRANSCRIPT

Comments on “Three Glass Tragedy
Beginning to Rethink (US) Financial Policy”
David A Westbrook
Andy Haldane
Bank of England

The Westbrook Thesis
• It has been a tragedy – but not a uniquely US one
• “Portfolio” approach to financial management:– May reduce risk– But increases uncertainty
• Risk is idiosyncratic; uncertainty is systematic • Systematic risk has gone up• Uncertainty manifests as:
– “Indeterminate” asset prices– “Downward biases” in asset prices

Different regulatory structures, same outcomes
Australia
Netherlands
France
Italy
China
Mexico
UK
Germany
Japan
Poland
Sweden
Norway
Spain
Portugal
Turkey
USA
Hong Kong
New Zealand
Singapore
-70
-60
-50
-40
-30
-20
-10
0
Integrated regulator
Objective -based
Institutional Functional
Chart 2: The percentage decrease in equity prices from 01/01/2007-10/12/2008
Per cent
Source: Datastream and Bank calculations

Systematic risk rises…
0
10
20
30
40
50
60
70
80
Jan. Apr. Jul. Oct. Jan. Apr. Jul. Oct. Jan.
Per cent(b)
2007
Average since 1998
08 09

…and implied losses exaggerated

Roots of Uncertainty
• Among the primary causes of uncertainty are:– Contract design (eg CDOn)– Industrial organisation of finance (eg
securitisation)– Myopia (eg VAR)– Network topology (eg CDS market)

ABCP
Equity
SIV
HY bonds
Mezzanine
Leveraged loans
Mezzanine tranche
Senior AAA
Senior ABS/CDOtranches
(andbank debt/
capital)
CDOmezzaninetranches
Senior
Mezzanine
Equity
Capital Notes
CDO
HY bonds
Mezz/second lien debt
Corporate assets
Leveraged loans
Equity
LBO’d company
CDO2
Mezzanine (often BBB-)
Sub-prime mortgages/Commercial mortgages
Senior
Equity
HEL ABS/CMBS
Mezzanine
BBB- ratedHEL ABS/
CMBSor
synthetic
Senior
Equity
CDO of ABS
CDOequity
tranches
Principal protected
notes
CPPI on CDO equity
FIN
AN
CIA
L E
CO
NO
MY
RE
AL
EC
ON
OM
Y
Financial contract design – ‘Russian Dolls’
MTNs
• Current episode borne of leveraging developments over the previous few years.

Sub-prime securitisation chain

Pre-crisis VaR
0
5
10
15
20
25
1 2 3 4 5 6 7 8 9
VaR Pre Crisis
Percent
Institution

Post-crisis VaR
0
5
10
15
20
25
1 2 3 4 5 6 7 8 9
VaR Post Crisis
VaR Pre Crisis
Percent
Institution

Post crisis CoVAR
0
5
10
15
20
25
1 2 3 4 5 6 7 8 9
Median CoVaR Post Crisis
VaR Post Crisis
VaR Pre Crisis
Percent
Institution
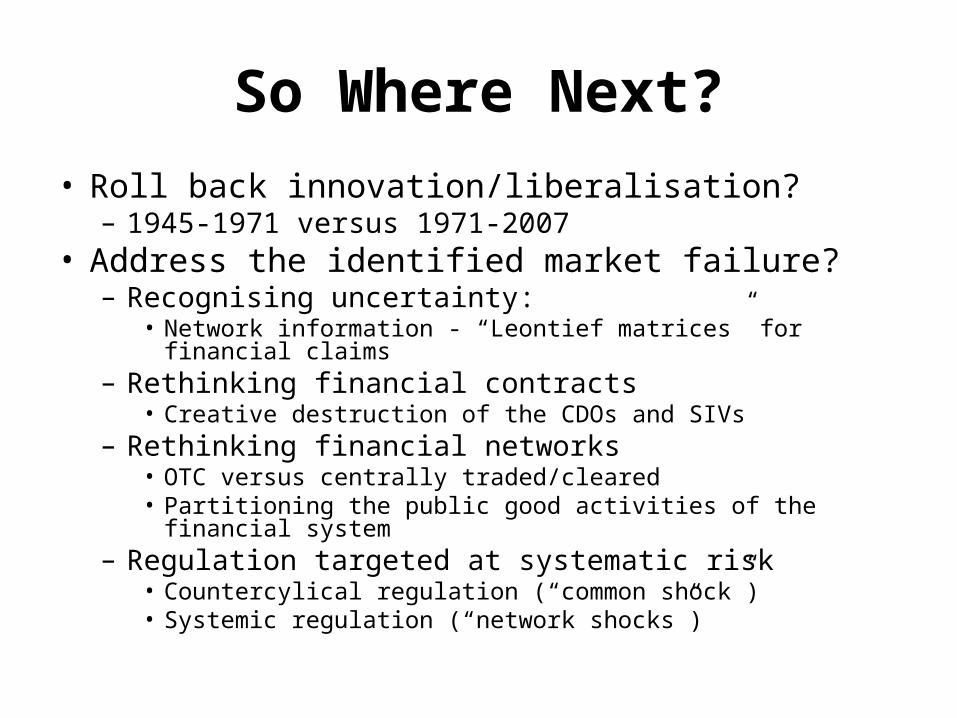
So Where Next?
• Roll back innovation/liberalisation?– 1945-1971 versus 1971-2007
• Address the identified market failure?– Recognising uncertainty:
• Network information - “Leontief matrices” for financial claims– Rethinking financial contracts
• Creative destruction of the CDOs and SIVs– Rethinking financial networks
• OTC versus centrally traded/cleared• Partitioning the public good activities of the financial system
– Regulation targeted at systematic risk• Countercylical regulation (“common shock”)• Systemic regulation (“network shocks”)

Financial Crises – Past and Present
Year 1881-1913 1919-1939 1945-1971 1973-1997
Probability of Crisis (%)
5 13 7 12
Depth of crisis (cumulative % GDP loss)
9.8 13.4 5.2 8.3
Average GDP growth (%)
1.93 0.98 2.13 2.43