combustion processes in propulsion || computational fluid dynamics simulations of supersonic...
TRANSCRIPT
Chapter 5
COMPUTATIONAL FLUID DYNAMICS SIMULATIONS OF SUPERSONIC JET-NOISE REDUCTION CONCEPTS
S.M. Dash, D.C. Kenzakowski, C. Kannepalli, J.D. Chenoweth, and N. Sinha
A collaborative effort with Florida State University (FSU) and the University of Mississippi (UM) to develop jet-noise suppression technologies for military aircraft is described. In the first phase of this effort, Reynolds-Averaged Navier-Stokes (RANS)-based computational fluid dynamics (CFD) is being used to support laboratory subscale experiments via establishing optimal geometries and conditions. Jet-noise suppression technologies initially being investigated include microjet injection and Bluebell tab/chevron nozzles (with various designs for divergent flap corrugations). Scale-up studies to permit such concepts to work on a military aircraft are also in progress to support tie-down tests. To date, gaseous microjet injection studies have been performed on a round Mach 1.35 imperfectly expanded jet, and baseline studies have been performed on a generic model aircraft exhaust for both static and Mach 0.5 flight conditions. Studies for this engine exhaust with chevrons have just been initiated.
5.1 INTRODUCTION
A collaborative effort (with Krothapalli/FSU and Seiner/UM) was recently initiated to develop jet-noise suppression technologies for military aircraft. The role of Combustion Research and Flow Technology, Inc. (CRAFT) in the initial phases of this program is that of utilizing CFD to support this research effort via:
(1) Pretest RANS simulations which permit selection of optimal noise reduction actuation details (e.g., location/angle of microjet nozzles, chevron/flag corrugation nozzle geometry details, etc);
259

260 HIGH-SPEED JET NOISE
3T24B
Baseline Chevron
Chevron
Total temperature comparisons at selected axial stations
Turbulent kinetic energy comparisons at selected axial stations
F i g u r e 5.1 Tab/chevron mixing enhancement study for separate flow nozzles: the plot above shows the resulting integrated mixing extent of core stream, (j) = (To — To,fan)/(To,core — To,fan)* 1 — baseline, 2 — chevron, and 3 — tab.

COMPUTATIONAL SIMULATIONS OF SUPERSONIC JET-NOISE REDUCTION 2 6 1
F i g u r e 5.2 Military aircraft plume with shock train.
(2) Post-test RANS simulation to provide an enhanced understanding of flow details, to corroborate experimental findings, and to provide turbulence inputs needed to make noise predictions; and
(3) Scale-up studies which permit transitioning the laboratory isolated jet studies to a full-scale aircraft.
Concepts initially under investigation include those of microjet injection [1] and the use of Bluebell (corrugated) nozzles with tabs/chevrons and /or nozzle lip injection [2]. These concepts embody several types of technologies for jet-noise reduction which include those of conventional vortical mechanisms, turbulent structure alteration, and shock at tenuation.
The RANS CFD methodology, such as that contained in the C R A F T CFD structured grid and CRUNCH CFD unstructured grid codes, is well established for the investigation of varied jet-noise reduction concepts. These codes contain specialized, well calibrated turbulence models for j e t / p lume applications [3-5] and have been used to investigate the effects of tabs and chevrons in NASA's AST program [6], as well as to analyze lobed mixer nozzle concepts in NASA's HST program [7]. Figure 5.1 (from [6]) shows some results of chevron and tab mixing enhancement studies with results corresponding favorably with NASA Glenn data . Much of the current full-scale aircraft plume simulation work has focused on infrared signature prediction for both cargo and fighter aircraft [8]. Aircraft-specific modules with integrated cycle deck da ta have been developed for the SPIRITS aircraft target signature model for isolated plumes. Such modules have been recently developed for the engine used on the military aircraft with a typical plume prediction shown in Fig. 5.2 [9]. Current work has focused on the development of complete aircraft models using multielement unstructured numerics [10] with specialized plume grids as depicted in Fig. 5.3.
From a jet-noise perspective, the experience base with the aircraft is invaluable in making the scale-up from laboratory to aircraft (since realistic internal mixing details need to be addressed), and the availability of a complete aircraft capability is also felt to be important since installation effects and p lume/plume interactions can have a first-order effect on jet noise [11].

262 HIGH-SPEED JET NOISE
k;5£v.?Ci:Cfid
Tetrahedral region Pyramid layer
Hexahedral region
Figure 5.3 Complete aircraft/plume configuration: grid approach.
5.2 MICROJET INJECTION STUDIES
Based on discussions with Krothapalli, work was initiated on analyzing a Mach 1.35 hot laboratory jet (into still air) with eight equally spaced microjet injectors angled at 60^ into the main jet. Preliminary studies evaluated the microjets on a stand-alone basis to ascertain a working range of static pressure ratios and Mach numbers. Sonic injection at very high pressure ratios was found to be problematic due to large total pressure losses across Mach discs. Next, studies were performed using the original microjet locations suggested by Krothapalli. These studies indicated that at the lowest microjet momentum conditions there was insufficient penetration, and, thus, the microjet nozzle exit was moved closer to the prime jet. A grid for the configuration analyzed is shown in Fig. 5.4 (symmetry plane through one injector and cross-cut at exit plane of microjet) — this grid provided grid resolved results and required a high concentration of points about the microjet to avoid numerical diffusion errors. Bounding limits for the microjet momentum were established for air injection, yielding minimal penetration and excessive pene-

COMPUTATIONAL SIMULATIONS OF SUPERSONIC JET-NOISE REDUCTION 263
Symmetry plane
'i:-:'-;
iSi'. W'.
w is y
U Slice through mm z—^j^ microjet axis
F igu re 5.4 Grid and configuration for the microjet simulations.
M
0.0 0.3 0.5 0.8 1.0 1.3 1.5 1.:
M
0.0 0.1 0.1 0.2 0.3 0.4 0.4 0.5
F i g u r e 5.5 Mach number contours: (a) baseline, (6) velocity vectors, (c) LM case, and {d) HM case. (Refer color plate, p. XVIII.)
2 6 4 HIGH-SPEED JET NOISE
TKE / m /s 0
2900
5700
8600
11000
14000
17000
20000
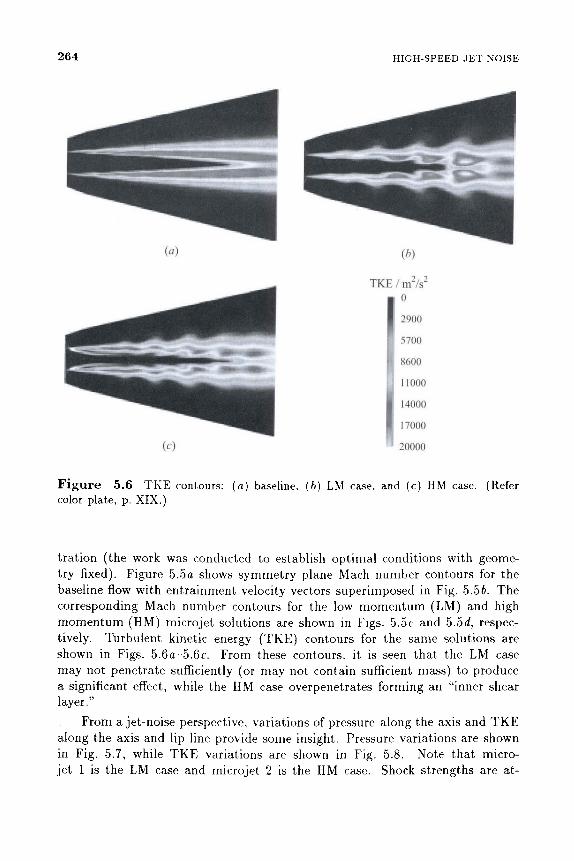
F i g u r e 5.6 TKE contours: (a) baseline, (6) LM case, and (c) HM case. (Refer color plate, p. XIX.)
trat ion (the work was conducted to establish optimal conditions with geometry fixed). Figure 5.5a shows symmetry plane Mach number contours for the baseline flow with entrainment velocity vectors superimposed in Fig. 5.56. The corresponding Mach number contours for the low momentum (LM) and high momentum (HM) microjet solutions are shown in Figs. 5.5c and 5.5rf, respectively. Turbulent kinetic energy (TKE) contours for the same solutions are shown in Figs. 5.6a-5.6c. From these contours, it is seen that the LM case may not penetrate sufficiently (or may not contain sufficient mass) to produce a significant effect, while the HM case overpenetrates forming an "inner shear layer."
From a jet-noise perspective, variations of pressure along the axis and T K E along the axis and lip line provide some insight. Pressure variations are shown in Fig. 5.7, while T K E variations are shown in Fig. 5.8. Note that micro-jet 1 is the LM case and microjet 2 is the HM case. Shock strengths are at-

COMPUTATIONAL SIMULATIONS OF SUPERSONIC JET-NOISE REDUCTION 265
200
^ 150
^ 100 OH
50
— V ' p li 1 1 1 1 1 1
1 J
2 3
1 1 50 100 150 200 250 300 350 400 450 500
X/ mm
F i g u r e 5.7 Axis pressure variations: 1 — baseline, 2 — microjet 1 (LM case), and 3 — microjet 2 (HM case).
400 600 ^ / m m
(a)
1000
20000
,^15000KJ
gq 10000
^ 5000
200 400 600 Jf/mm
(b)
800 1000
F i g u r e 5.8 Axis (a) and nozzle lip line (b) TKE variations: i — baseline, 2 microjet 1 (LM case), and 3 — microjet 2 (HM case).

2 6 6 HIGH-SPEED JET NOISE
tenuated significantly for the HM case, but minimally for the LM case. Lip line TKE is initially reduced for both cases, but values revert to those of the baseline case. The peak level of TKE at the axis is increased for the HM case, and both the LM and HM solutions have a shorter core length than the baseline case. Work is continuing to find optimal mass and momentum conditions for the air microjet and to examine injection at smaller angles (30^ and 45").
5.3 MILITARY AIRCRAFT MODEL STUDIES
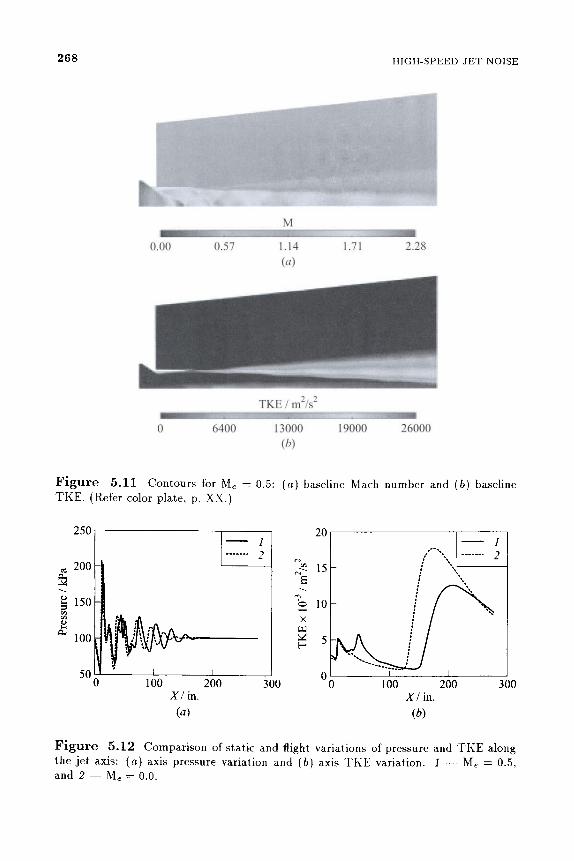
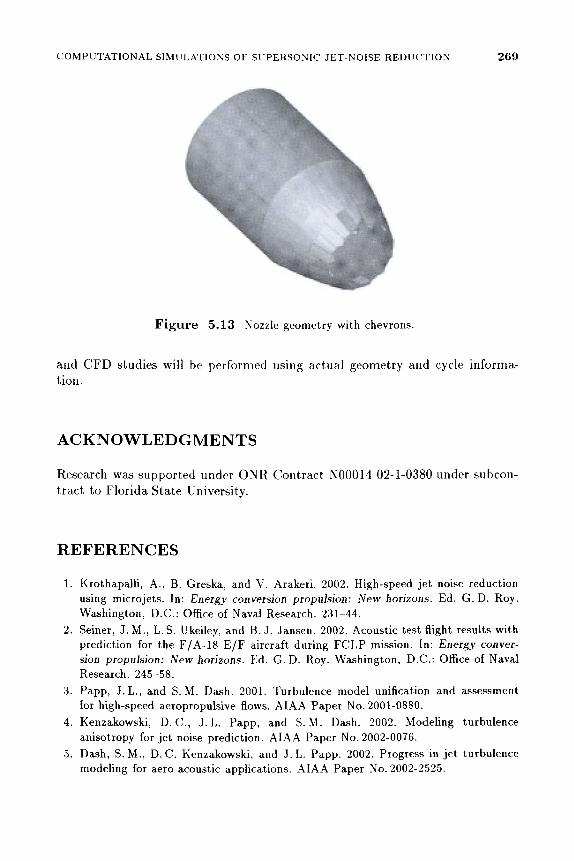
A wind tunnel model has been designed by Seiner that replicates many geometric features of the real engine (plug, nozzle geometry for varied thrust settings, etc.). Operating conditions were representative of 96% MRT (Military Rated Thrust). Figure 5.9 shows a near-field grid of the baseline geometry, while Fig. 5.10 shows contours of Mach number and TKE for static conditions (Me = 0) at sea level. Figure 5.11 shows comparable contours for a flight Mach number of 0.5, showing the eff'ects of flight Mach number on the shock structure and turbulent mixing. Figure 5.12 compares axis variations of pressure and TKE for the static and flight calculations. The well-known effect of flight velocity is to reduce the turbulent mixing rate (velocity ratio effect) with shock strengths somewhat higher since shear layer interactions are reduced (shocks interact with thinner shear layers having lower turbulence levels). Present work is examining modifying the nozzle geometry via the addition of chevrons. Some details of the chevron geometry being analyzed are provided in Fig. 5.13.
5.4 CONCLUDING REMARKS
The studies performed and presented here are very preliminary. In the near term, it will explore the eff'ects of varying microjet conditions (jet size, exit Mach number and pressure, and injection angle) to achieve maximum noise reduction using an overall microjet meiss flux that is about 1% of the main jet. This work is being performed in collaboration with experiments at FSU [12]. In addition, it will analyze the military aircraft laboratory model with chevrons to be tested by Seiner at NCPA for static conditions and assess their eff'ec-tiveness with forward flight. Finally, it will unify chevrons and microjets and obtain a noise reduction design that extracts the maximum eflfectiveness out of both concepts. This design will then be scaled-up for operation on the real engine (with requisite modifications to accommodate moveable nozzle features),

COMPUTATIONAL SIMULATIONS OF SUPERSONIC JET-NOISE REDUCTION 267
Figure 5.9 Near-field baseline grid of military engine nozzle.
TKE / rnls-
0 6400 13000 19000 26000
{b)
F i g u r e 5.10 Contours for Me = 0: (a) baseline Mach number and (6) baseline TKE. (Refer color plate, p. XX.)
268 HIGH-SPEED JET NOISE
0.00 0.57
M
1.14 (a)
TKE / mW
1.71 2.28
6400 13000 (b)
19000 26000
Figure 5 .11 Contours for Me = 0.5: (a) baseline Mach number and (6) baseline TKE. (Refer color plate, p. XX.)
300
F i g u r e 5 .12 Comparison of static and flight variations of pressure and TKE along the jet axis: (a) axis pressure variation and (6) axis TKE variation. 1 — Me = 0.5, and 2 — Me = 0.0.
COMPUTATIONAL SIMULATIONS OF SUPERSONIC JET-NOISE REDUCTION 2 6 9
F igure 5 .13 Nozzle geometry with chevrons.
and CFD studies will be performed using actual geometry and cycle information.
ACKNOWLEDGMENTS
Research was supported under ONR Contract N00014-02-1-0380 under subcontract to Florida State University.
REFERENCES
1. Krothapalli, A., B. Greska, and V. Arakeri. 2002. High-speed jet noise reduction using microjets. In: Energy conversion propulsion: New horizons. Ed. G. D. Roy. Washington, D.C.: Office of Naval Research. 231-44.
2. Seiner, J.M., L. S. Ukeiley, and B. J. Jansen. 2002. Acoustic test flight results with prediction for the F/A-18 E/F aircraft during FCLP mission. In: Energy conversion propulsion: New horizons. Ed. G. D. Roy. Wcishington, D.C.: Office of Naval Research. 245-58.
3. Papp, J.L., and S. M. Dash. 2001. Turbulence model unification and assessment for high-speed aeropropulsive flows. AIAA Paper No. 2001-0880.
4. Kenzakowski, D. C., J. L. Papp, and S. M. Dash. 2002. Modeling turbulence anisotropy for jet noise prediction. AIAA Paper No. 2002-0076.
5. Dash, S.M., D.C. Kenzakowski, and J.L. Papp. 2002. Progress in jet turbulence modeling for aero-acoustic applications. AIAA Paper No. 2002-2525.
2 7 0 HIGH-SPEED JET NOISE
6. Kenzakowski, D.C., and S.M. Dash. 2000. Study of three-stream laboratory jets with passive mixing enhancements for noise reduction. AIAA Paper No. 2000-0219.
7. Kenzakowski, D. C , and S.M. Dash. 1998. Advances in jet aircraft mixer/nozzle and plume simulation. JANNAF 6th SPIRITS User Group Proceedings. NASA Kennedy Space Center, FL.
8. Kenzakowski, D. C , J.D. Shipman, S.M. Dash, P. Markarian, M. Borger, and G. Smith. 2001. Increasing fidelity of aircraft plume IR signatures. The 2001 Electromagnetic Code Consortium (EMCC) Annual Meeting Proceedings. Kauai, Hawaii.
9. Cavallo, P. A., D. C. Kenzakowski, and S.M. Dash. 1997. Axisymmetric flowfield analysis of the F414-400 turbofan and exhaust plumes. Combustion Research and Flow Technology, Inc. Report No. CRAFTR-10/97.014.
10. Shipman, J.D., P. A. Cavallo, and A. Hosangadi. 2001. Efficient simulation of aircraft exhaust plume flows using a multi-element unstructured methodology. AIAA Paper No. 2001-0598.
11. Seiner, J. M., M. K. Ponton, B. J. Jansen, S. M. Dash, and D. C. Kenzakowski. 1997. Installation effects on high speed plume evolution. ASME Fluids Engineering Division Summer Meeting Proceedings. Vancouver, British Columbia, Canada. Paper No. FEDSM97-3227.
12. Krothapalli, A., B. Greska, and V. Arakeri. 2002. High speed jet noise reduction using microjets. AIAA Paper No. 2002-2450.
Comments
Smirnov: What turbulence model and boundary conditions did you use?
D a s h : We used the k-e model with correction on compressibility effects. Boundary conditions were more sophisticated than in other approaches.

XVIII
M
0.0 0.1 0.1 0.2 0.3 0.4 0.4 0.5
(b)
(c) (d)
Figure 5.5 Mach number contours: (a) baseline, (b) velocity vectors, (c) LM case, and (d) HM case. (Refer Dash et al., p. 263.)

XIX
{a)
TKE / m2/s2
0
2900
5700
8600
11000
14000
17000
20000
{c)
Figure 5.6 TKE contours: {a) baseline, {b) LM case, and (c) HM case. (Refer Dash et al, p. 264.)

XX
TKE/m2/s2 0 6400 13000 19000 26000
(b)
Figure 5.10 Contours for M^ = 0: (a) baseline Mach number and (b) baseline TKE. (Refer Dash
et al, p. 267.)
TKE/m2/s2 0 6400 13000 19000 26000
{b)
Figure 5.11 Contours for M^ = 0.5: {a) baseline Mach number and {b) baseline TKE. (Refer Dash
et al, p. 268.)