combustion model for a homogeneous turbocharged … articles/combustion model for a...dimensional...
TRANSCRIPT

COMBUSTION MODEL FOR A HOMOGENEOUS TURBOCHARGED GASOLINE DIRECT-INJECTION ENGINE
Sedigheh Tolou, Ravi Teja Vedula, Harold Schock, and Guoming Zhu Michigan State University
East Lansing, MI, USA
Yong Sun and Adam Kotrba Tenneco Inc.
Grass Lake, MI, USA
ABSTRACT
Homogeneous charge is a preferred operation mode of
gasoline direct-injection (GDI) engines. However, a limited
amount of work exists in the literature for combustion models of
this mode of engine operation. Current work describes a model
developed and used to study combustion in a GDI engine having
early intake fuel injection. The model was validated using
experimental data obtained from a 1.6L Ford EcoBoost® four-
cylinder engine, tested at the U.S. EPA. The start of combustion
was determined from filtered cycle-averaged cylinder pressure
measurements, based on the local maximum of third derivative
with respect to crank angle. The subsequent heat release,
meanwhile, was approximated using a double-Wiebe function,
to account for the rapid initial pre-mixed combustion (stage 1)
followed by a gradual diffusion-like state of combustion (stage
2) as observed in this GDI engine. A non-linear least-squares
optimization was used to determine the tuning variables of
Wiebe correlations, resulting in a semi-predictive combustion
model. The effectiveness of the semi-predictive combustion
model was tested by comparing the experimental in-cylinder
pressures with results obtained from a model built using a one-
dimensional engine simulation tool, GT-POWER (Gamma
Technologies). Model comparisons were made for loads of 60,
120, and 180 N-m at speeds ranging from 1500 to 4500 rpm, in
500 rpm increments. The root-mean-square errors between
predicted cylinder pressures and the experimental data were
within 2.5% of in-cylinder peak pressure during combustion.
The semi-predictive combustion model, verified using the GT-
POWER simulation, was further studied to develop a predictive
combustion model. The performance of the predictive
combustion model was examined by regenerating the
experimental cumulative heat release. The heat release analysis
developed for the GDI engine was further applied to a dual mode,
turbulent jet ignition (DM-TJI) engine. DM-TJI is an advanced
combustion technology with a promising potential to extend the
thermal efficiency of spark ignition engines with minimal
engine-out emissions. The DM-TJI engine was observed to offer
a faster burn rate and lower in-cylinder heat transfer when
compared to the GDI engine under the same loads and speeds.
INTRODUCTION
In recent years, a range of different technologies have been
under consideration to improve the fuel economy of gasoline
engines and reduce exhaust emissions. Among these, GDI
engines have a greater degree of feasibility for market
acceptance [1,2]. Therefore, a large portion of light-duty vehicle
developments lean towards achieving higher thermal efficiency
and lower exhaust emissions in GDI engines. Significant
developments include [3]:
Higher compression ratio
Charge dilution using exhaust gas recirculation (EGR)
Tumble enhancement
Higher ignition energy
Late intake valve closure timing (Miller or Atkinson
cycle)
Direct injection of the fuel into the combustion chamber
decreases the charge temperature, resulting in higher volumetric
efficiency and less knock tendency at higher compression ratios.
These characteristics lead to higher thermal efficiency and power
output for GDI engines, which facilitates engine downsizing.
Proceedings of the ASME 2017 Internal Combustion Engine Division Fall Technical Conference ICEF2017
October 15-18, 2017, Seattle, Washington, USA
ICEF2017-3613
1 Copyright © 2017 ASME
Downloaded From: http://proceedings.asmedigitalcollection.asme.org/ on 05/16/2018 Terms of Use: http://www.asme.org/about-asme/terms-of-use

GDI engines can be designed to operate in both homogenous and
lean stratified modes of operation. Homogeneous charge is
obtained through early intake injection of the fuel. Stratified
charge, on the other hand, is attained as a result of a late fuel
injection during compression stroke causing local fuel-rich
mixture in the vicinity of spark plug surrounded by a globally
fuel-lean mixture in the combustion chamber. At engine low-mid
load operation, the homogeneous mode with its higher
combustion stability lacks the advantage of lower pumping work
compared to the lean stratified mode. Combustion stability is
challenging to obtain in lean stratified mode due to high cycle-
to-cycle variability of in-cylinder charge motion and quenching
of the flame.
The dual mode, turbulent jet ignition (DM-TJI) is an engine
combustion technology wherein an auxiliary air supply apart
from an auxiliary fuel injection, as seen in TJI systems, is
provided into the pre-chamber [3,4]. Upon spark ignition in the
pre-chamber, highly energetic chemically active turbulent jets
enter the main chamber through a multi-orifice nozzle and ignite
the lean air/fuel mixture inside the main chamber. DM-TJI
ignition strategy extends the mixture flammability limits by
igniting leaner mixtures compared to the traditional spark
ignition approach [3]. Therefore, the DM-TJI combustion system
is a promising combustion technology to achieve higher fuel
economy. Vedula et al. reported a net thermal efficiency of
45.5%±0.5% for both lean and near-stoichiometric operations of
a gasoline-powered DM-TJI engine [3].
The importance of GDI engines in current and future
markets is identified, and it is worthwhile to develop predictive
combustion models that allow the engine developers to find
optimal operating conditions. There have been several numerical
and experimental investigations on GDI engines. Fuel economy
and exhaust emissions were numerically and/or experimentally
studied under different injection strategies and advanced
injection systems in [5–8]. Berni et al. examined the effects of
water/methanol injection as knock suppressor on a downsized
GDI engine [9]. Simulations of in-cylinder charge motion, spray
development, and wall impingement in GDI engines were
performed by Lucchini et al. and Fatouraie et al. [10,11]. Cho et
al. investigated the combustion and heat transfer behavior in a
single-cylinder GDI engine [12]. These studies cover a wide
variety of subjects. However, the current authors did not find any
in-depth investigation on the one-dimensional combustion
model of a GDI engine.
Burnt et al. and Egnell conducted single-zone heat release
analysis on direct-injection diesel engines [13,14]. Dowell et al.
meticulously studied heat release models for modern high-speed
diesel engines [15]. Lindström et al. reported an empirical
combustion model for a port fuel injection (PFI) spark ignition
engine [16]. Hellström et al. [17,18] have done studies on the
combustion model of spark-assisted compression ignition
(SACI) engines. Spicher et al. showed GDI development
potentialities and compared the heat release behavior of a PFI
and GDI engine [19]. Huegel et al. investigated the heat transfer
of a single-cylinder GDI engine with a side study on the heat
release behavior of the engine in both homogeneous and
stratified modes of operations [20]. Results obtained in the
current study well agree with the works done by Spicher and
Huegel describing heat release behavior and consequently the
combustion model of a GDI engine.
There are two goals behind the work done here: (1) develop
a 0-D combustion model which can be used towards the whole-
cycle simulation of a GDI engine (2) perform a preliminary heat
release analysis of DM-TJI engine and compare the results
obtained with those of the GDI engine. The work addresses the
combustion behavior of a GDI engine using experimental data
from a Ford EcoBoost® 1.6 liter engine (Model Year 2013). The
heat release behavior of the DM-TJI engine was examined using
the same single-zone analysis as the GDI engine.
The paper is organized as follows. The experimental
arrangement is first described. After that the numerical approach
and model development are explained followed by the section
providing the numerical results using experimental data and the
discussion of the results. A separate section covers the
preliminary results for the heat release behavior of a DM-TJI
engine and compares the combustion characteristics of current
homogeneous turbocharged GDI engine with that of DM-TJI
engine. Conclusions are drawn in the last section.
EXPERIMENTAL ARRANGEMENT Experimental Setup
Experimental data was collected from a 2013 Ford Escape
1.6 liter EcoBoost® turbocharged GDI engine. To make use of
the stock engine and vehicle controllers, the engine was tethered
to its vehicle located outside the test cell. Details of the test site,
vehicle tether information, engine setup, engine systems
including intake/exhaust, charge air cooling, cooling system, oil
system, and front end accessory drive (FEAD) can be found in
[21]. Engine specifications are listed in Table 1.
TABLE 1 Engine specifications
Vehicle (MY, Make, Model) 2013 Ford Escape
Engine (Displacement, Name) 1.6 L EcoBoost®
Rated Torque 240 N-m @ 1600-5000 RPM
Rated Power 180 hp @ 5700 RPM
Compression Ratio 10:1
No. of Cylinders 4
Firing Order 1-3-4-2
Fuel Injection Common rail
Fuel Type LEV III regular gasoline
Data Set Definition The data logged included engine torque, fuel flow rate, air
flow rate, pressures, temperatures, in-cylinder pressure, and
OBD/extended PID CAN data.
Data Collection Procedure
Two data acquisition systems were used. The first was an
A&D Technology iTest Test System Automation Platform for
low-frequency data at a rate of 10Hz. The second was an A&D
2 Copyright © 2017 ASME
Downloaded From: http://proceedings.asmedigitalcollection.asme.org/ on 05/16/2018 Terms of Use: http://www.asme.org/about-asme/terms-of-use
Technology Combustion Analysis System (CAS) for high-
frequency data acquisition. CAS was sampled at 0.1 crank angles
resolution and transmitted to iTest at 10Hz rate. The engine with
its associated engine control unit (ECU) operates under original
equipment manufacturer (OEM) specific protection modes.
These protection modes limit the engine operation in a test cell,
especially at higher loads as engine temperatures reach the safety
thresholds. To obtain experimental data, two test procedures
were used to compensate for the protection modes.
The first procedure was used for the loads below ~70% of
the maximum rated torques at which the engine temperatures
remain within the safety thresholds. During this procedure, a set
of selected parameters was used as stability criteria. These
parameters included fuel flow, torque, and turbine inlet
temperature. The settling time ranged from 20 seconds to 30
seconds at different loads and speeds.
The second procedure was used to obtain high-load data
which go beyond OEM safety thresholds. It should be noted that,
in real-world driving the engine does not remain at high-load
operating conditions for more than a few seconds. Thus, the
quasi-steady-state values were of interest for the high-load
operating points beyond the OEM safety thresholds. This second
procedure started with the engine being set to the desired speed
and a load of 10 N-m. The data logger was triggered on and the
load stepped to the desired value. The data was logged for 20
seconds in total before the engine was brought back to the cool-
down mode of 1500 rpm and 10 N-m.
Details of these test procedures can be found in [21]. A total
of 50 cycles were used for the current study at each operating
condition. Table 2 shows all the cases studied here. It should be
noted that the engine was always operated at stoichiometric
condition.
TABLE 2 Loads, speeds and corresponding case numbers
Load (N-m)
60 120 180
Sp
eed
(R
PM
)
1500 1 2 3
2000 4 5 6
2500 7 8 9
3000 10 11 12
3500 13 14 15
4000 16 17 −
4500 18 19 −
NUMERICAL APPROACH AND MODEL DEVELOPMENT Heat Release Analysis
The single-zone analysis applied in the current work
considered the change in sensible internal energy (first term on
the right-hand side of equation 1), work done by the piston
motion (second term); and heat transfer from in-cylinder gas to
the walls (𝑄ℎ.𝑡). The effects of blowby and crevices were
assumed to be negligible. The energy equation is written as
[22,23]:
𝑑𝑄𝑐ℎ
𝑑𝑡=
1
𝛾 − 1 𝑉
𝑑𝑝
𝑑𝑡+
𝛾
𝛾 − 1 𝑝
𝑑𝑉
𝑑𝑡+
𝑑𝑄ℎ.𝑡
𝑑𝑡 (1)
Net Heat Release The summation of change in sensible
internal energy and work done by the piston is commonly called
net heat release. Having the in-cylinder pressure and volume, net
heat release can be calculated if the dependency of specific heat
ratio, or gamma, on temperature is well defined. In general,
gamma is a function of both temperature and mixture
composition. However, as Chang et al. showed in [24], ignoring
the gamma dependency on mixture composition leads to a
negligible error. They reported a third-order polynomial gamma
dependency on temperature as a result of curve-fitting at a
median air/fuel ratio. This polynomial was used in the current
work.
𝛾 = −9.97 × 10⁻¹²𝑇3 + 6.21 × 10⁻⁸𝑇2 − 1.44× 10⁻⁴𝑇 + 1.40
(2)
Average in-cylinder temperature was determined from the
ideal gas law using the total mass trapped in the cylinder at the
intake/exhaust valve closing (IVC/EVC), the in-cylinder
pressure at each crank angle, and the corresponding in-cylinder
volume. This temperature was believed to be close to the mass-
averaged cylinder temperature during combustion, since the
molecular weights of burned and unburned mixtures are
basically the same [22]. Trapped in-cylinder mass can be
calculated as a summation of trapped air, fuel, internal EGR, and
external EGR in the combustion chamber. There was no external
EGR for all the cases under study. Thus, the term was set to zero.
Internal EGR was calculated using the Yun and Mirsky
correlation [25]. An iterative algorithm was used to find gamma
and in-cylinder temperature at IVC. In-cylinder temperature at
IVC can be calculated as a weighted average of intake
temperature and exhaust temperature at intake pressure [16].
𝑇𝑒𝑥ℎ∗ = 𝑇𝑒𝑥ℎ (
𝑝𝑖𝑛𝑡
𝑝𝑒𝑥ℎ
)(𝛾−1)/𝛾
(3)
𝑥𝑟 =𝑉𝐸𝑉𝐶
𝑉𝐸𝑉𝑂
(𝑃𝐸𝑉𝐶
𝑃𝐸𝑉𝑂
)1/𝛾
(4)
𝑇 = (1 − 𝑥𝑟)𝑇𝑖𝑛𝑡 + 𝑥𝑟𝑇𝑒𝑥ℎ∗ (5)
Heat Transfer Model The GT-POWER WoschniGT heat
transfer model was used to simulate the heat transfer term in the
energy equation of the heat release analysis. WoschniGT closely
matches the classical Woschni correlation without swirl. The
most important difference lies in the treatment of heat transfer
coefficients when the intake and exhaust valves are open, where
intake inflow velocities and exhaust backflow velocities increase
the in-cylinder heat transfer.
ℎ𝑐 𝑊𝑜𝑠𝑐ℎ𝑛𝑖 =𝐾1𝑝0.8𝑤0.8
𝐵0.2𝑇𝐾2 (6)
where k1 = 3.01 and k2 = 0.50.
3 Copyright © 2017 ASME
Downloaded From: http://proceedings.asmedigitalcollection.asme.org/ on 05/16/2018 Terms of Use: http://www.asme.org/about-asme/terms-of-use

𝑤 = 𝐶1𝑆𝑝_ +
𝐶2(𝑉𝑑𝑇𝑟)
𝑃𝑟𝑉𝑟
(𝑝 − 𝑝𝑚) (7)
where
C1 = 2.28+3.90 min (Net mass flow into cylinder from valves
Trapped Mass∗Engine Frequency, 1)
C2 = {0 During cylinder gas exchange and compression3.24E − 3 During combustion and expansion
After calculation of the heat transfer coefficient using
WoschniGT formulation, the rate of in-cylinder heat transfer can
be calculated as below, Equation 8. Since there was no
temperature data available for the piston, head, and liner of this
Ford EcoBoost® engine, the temperature profiles were extracted
from the work by Huegel et al. on a single-cylinder GDI engine
[20]. A heat transfer multiplier (HTM) was used to adjust the heat
transfer term, assuming the combustion efficiency as 99.9% with
no blow-by or crevice losses.
𝑑𝑄ℎ.𝑡
𝑑𝑡= 𝐻𝑇𝑀. ℎ𝑐 . (
𝐴𝑝𝑖𝑠𝑡𝑜𝑛. (𝑇 − 𝑇𝑤𝑎𝑙𝑙, 𝑝𝑖𝑠𝑡𝑜𝑛) +
𝐴ℎ𝑒𝑎𝑑 . (𝑇 − 𝑇𝑤𝑎𝑙𝑙, ℎ𝑒𝑎𝑑) +
𝐴𝑙𝑖𝑛𝑒𝑟 . (𝑇 − 𝑇𝑤𝑎𝑙𝑙, 𝑙𝑖𝑛𝑒𝑟)
) (8)
Start of Combustion Several approaches can be found
in the literature to define start of combustion (SOC). Reddy et al.
studied determination of SOC based on first and second derivate
of in-cylinder pressure [26]. Hariyanto et al. applied the wavelet
analysis to define SOC of a diesel engine [27]. Shen et al. and
Bitar et al. defined SOC as the start for the dynamic stage of
combustion, which corresponds to the transition between
compression and expansion process; using a pressure-volume (P-
V) diagram [28,29]. Katrašnik et al. developed a new criterion to
determine SOC in [30]. Their study mathematically
demonstrated the delay in SOC prediction using first and second
derivative of in-cylinder pressure. They proposed a SOC
criterion based on the local maximum of third derivative of in-
cylinder pressure with respect to crank angle. Determination of
SOC using wavelet analysis requires the engine vibration data
which was not available. Additionally, Hariyanto et al. showed a
high degree of correlation between the results from their wavelet
analysis and the SOC criterion of Katrašnik group. The accuracy
of SOC determination methods based on P-V diagram depends
on a level of judgment in defining SOC as the point where the
straight portion of compression stroke deviates from its averaged
path.
The current work used the SOC criterion of Katrašnik et al.
Signal preparation for in-cylinder pressures was done using a
MATLAB filtering algorithm called “filtfilt”. This algorithm
performs a zero-phase forward and reverse filtration. Design
specifications were set to a third-order Butterworth filter with a
0.15 normalized cutoff frequency for the 3 dB point,
corresponding to 450 Hz – 1350 Hz for different speeds. Ignition
delay was defined as the difference between spark timing and
calculated SOC for the range of speeds and loads studied.
Combustion Model
Ivan Wiebe was one of the pioneers to connect the rate of
combustion to chain chemical reactions in an internal
combustion engine [17,31]. In real combustion systems, chain
reactions progress sequentially and in parallel with reactions
involved in the formation of intermediate species called “active
centres” [31]. Active centres, which were referred to as effective
centres by Wiebe, initiate effective reactions which result in the
formation of combustion products. The well-known Wiebe
function was developed over the basis of this concept [31].
Current work demonstrates a two-stage heat release
phenomenon for the studied GDI engine. Thus, a single Wiebe
function is not suitable to capture the heat release characteristics
of the engine wherein pre-mixed combustion is followed by a
diffusion-like combustion. “Diffusion-like” combustion here is
characterized with the slow-rate combustion as a result of either
mixture inhomogeneity or wall impingement. The mixture
inhomogeneity can arise due to locally fuel-rich regions, thereby
leading to a slow-rate combustion. The wall impingement, on the
other hand, can result from fuel film deposition or flame hitting
the wall. The deposited fuel film can evaporate in the course of
combustion, resulting in the second stage of heat release. Also,
the heat losses when the flame reaches the chamber walls would
slow down the rate of combustion.
The current study used a double-Wiebe function to fit the
results of heat release calculation, see equation 9.
𝑥𝑏(𝜃) = 𝒂𝒍𝒑𝒉𝒂 ∗ {1 − 𝑒𝑥𝑝 [−𝑎 (𝜃 − 𝜽𝟎
∆𝜽𝟏
)𝒎𝟏+1
]}
+ (1 − 𝒂𝒍𝒑𝒉𝒂)
∗ {1 − 𝑒𝑥𝑝 [−𝑎 (𝜃 − 𝜽𝟎
∆𝜽𝟐
)𝒎𝟐+1
]}
(9)
where a = −ln0.001 = 6.9.
Semi-Predictive Combustion Model The double-
Wiebe function includes six unknown variables, 𝛼, 𝑚1, 𝑚2, ∆𝜃1,
and ∆𝜃2, and the SOC (𝜃0). The first five variables were
determined based on a non-linear least-squares optimization
using MATLAB Curve Fitting Toolbox™. The SOC was
determined using Katrašnik et al. criterion as mentioned earlier.
A total of six look-up tables, one for each variable, were built for
different loads and speeds. These look-up tables were used in the
GT-POWER model as discussed next.
GT-POWER Model The effectiveness of the semi-
predictive combustion model was tested by comparing the
experimental in-cylinder pressures with results obtained from a
model built using the one-dimensional engine simulation tool,
GT-POWER (Gamma Technologies). The six variables of the
double-Wiebe function, used to model the two-stage combustion
behavior of the GDI engine, were defined in GT-POWER by
importing the look-up tables built from semi-predictive
combustion model. The GT-POWER model simulates the engine
4 Copyright © 2017 ASME
Downloaded From: http://proceedings.asmedigitalcollection.asme.org/ on 05/16/2018 Terms of Use: http://www.asme.org/about-asme/terms-of-use

components from intercooler outlet to turbine inlet. Components’
characteristics were set based on experimentally measured data
and 3D computer-aided design (CAD) models including: valve
geometries, timings, lift profiles, and discharge coefficients; in-
cylinder and port geometries; injection timings and durations,
and air/fuel ratio. The engine induction and exhaust system were
built to a close approximation, as there was no CAD model
available. Intake manifold throttle angle was controlled using a
proportional–integral (PI) controller with brake-mean-effective-
pressure (BMEP) as its input value. The in-cylinder heat transfer
model was set to WoschniGT with the same in-cylinder
temperatures and heat transfer multiplier of heat release analysis
described earlier. The combustion model was imposed based on
results obtained from the semi-predictive combustion model.
Predictive Combustion Model The semi-predictive
combustion model, verified using the GT-POWER simulation,
was further studied to find correlations for each of the six
variables of the double-Wiebe function. The corresponding
combustion model called as ‘predictive combustion model’ can
correlate the combustion behavior of the GDI engine to a set of
engine parameters. The predictor parameters (𝑥1 to 𝑥4) chosen
for each of these variables are listed in Table 3. The linear
correlations, as shown in expression 10, were found to well
predict the six variables. The first four variables; 𝜃0, 𝛼, ∆𝜃1, and
∆𝜃2; were predicted using the manifold temperature, internal
EGR, engine speed, and ignition timing. However, the behavior
of last two variables, 𝑚1 and 𝑚2, were best captured by using
∆𝜃1 and ∆𝜃2, respectively, along with 𝑖𝐸𝐺𝑅 and 𝑆𝑝𝑒𝑒𝑑 as model
predictor parameters (see Table 3). Thus, the same linear
correlation shown in expression 10 was used for 𝑚1 and 𝑚2,
excluding the 𝑥4 parameter. A variety of parameters were
examined to define these dependencies. It seemed that the engine
in-cylinder characteristics at different loads and speeds could be
well captured by current predictor parameters. The combination
of manifold temperature and fraction of internal EGR was
believed to act as an indicator of the boundary temperature. The
speed parameter could play a role in capturing the in-cylinder
turbulence. The ignition timing along with three other
parameters could represent the effect of flame initiation on the
combustion behavior.
𝑎0 + 𝑎1𝑥1 + 𝑎2𝑥2 + 𝑎3𝑥3 + 𝑎4𝑥4 (10)
TABLE 3 Double-Wiebe variables and associated predictor parameters
Variables 𝒙𝟏 𝒙𝟐 𝒙𝟑 𝒙𝟒
𝜽𝟎 𝑇𝑀𝑎𝑛 𝑖𝐸𝐺𝑅 𝑆𝑝𝑒𝑒𝑑 𝜃𝑖𝑔𝑛
𝜶 𝑇𝑀𝑎𝑛 𝑖𝐸𝐺𝑅 𝑆𝑝𝑒𝑒𝑑 𝜃𝑖𝑔𝑛
∆𝜽𝟏 𝑇𝑀𝑎𝑛 𝑖𝐸𝐺𝑅 𝑆𝑝𝑒𝑒𝑑 𝜃𝑖𝑔𝑛
∆𝜽𝟐 𝑇𝑀𝑎𝑛 𝑖𝐸𝐺𝑅 𝑆𝑝𝑒𝑒𝑑 𝜃𝑖𝑔𝑛
𝒎𝟏 ∆𝜃1 𝑖𝐸𝐺𝑅 𝑆𝑝𝑒𝑒𝑑 −
𝒎𝟐 ∆𝜃2 𝑖𝐸𝐺𝑅 𝑆𝑝𝑒𝑒𝑑 −
A least-squares optimization was performed using the MATLAB
algorithm “LinearModel.fit” to minimize the root-mean-square
(RMS) error in the prediction of each variable. The linear
correlations found here were validated by regenerating the
experimental cumulative heat release as discussed later.
RESULTS AND DISCUSSION
The following discussion for the GDI engine was divided
into three parts. The first part covered the results obtained for the
heat release analysis including the ignition delays at different
loads and speeds. The second part discussed the semi-predictive
combustion model results followed by a comparison between the
experimental and model regeneration of engine heat release in
the third part.
Heat Release Analysis The results obtained from the heat release analysis
demonstrated rapid initial pre-mixed combustion (stage 1)
followed by a gradual diffusion-like state of combustion (stage
2) for all the loads and speeds studied in this homogenous charge
GDI engine. Figure 1 shows the heat release rate for the loads of
60, 120, and 180 N-m at 2000 rpm. Pre-mixed and diffusion-like
phases of combustion are clearly noticeable in this figure. To
highlight the two stages of combustion in the figure, the rate of
combustion at 120 and 180 N-m were shifted to the left with an
offset of 6 and 19 crank angle degrees, respectively, to match
their SOCs with that of 60 N-m load. The end point for the pre-
mixed combustion is the start point of the diffusion-like phase of
combustion, which continues up to nearly exhaust valve opening
(EVO). The switch point from pre-mixed to diffusion-like phases
of combustion was determined as the point where the double-
Wiebe function shifts from the first Wiebe function to the second
Wiebe function, the crank angle degree corresponding to the 𝛼
value. In this work, 0 CAo corresponds to firing top dead center
(TDC). Cumulative heat release results obtained for 120 N-m at
2000 rpm are displayed in Fig. 2. In this figure, the peak of the
resulting apparent heat release curve was matched to the total
chemically released energy (energy from burned fuel) using
averaged heat transfer calibrations. These calibrations were
attained by adjusting the values for HTM. The blow-by and
crevice losses were assumed negligible, and a value of 99.9%
was used for the combustion efficiency of all the cases studied.
The SOCs were determined from filtered cycle-averaged
cylinder pressure measurements, based on the local maximum of
third derivative with respect to crank. Accordingly, the
corresponding ignition delays are shown in Fig. 3. The reported
ignition delays were not used in the current engine model
development. Nevertheless, they are reported as they can be of
interest to the readers. The ignition delay, in general, increased
with an increase in the engine speed. However, the ignition delay
first decreased with the increase in engine load and then slightly
increased with further load increase from 120 N-m to 180 N-m.
Assanis et. al reported the same trends and value magnitudes for
the ignition delay of a direct-injection diesel engine [32].
5 Copyright © 2017 ASME
Downloaded From: http://proceedings.asmedigitalcollection.asme.org/ on 05/16/2018 Terms of Use: http://www.asme.org/about-asme/terms-of-use
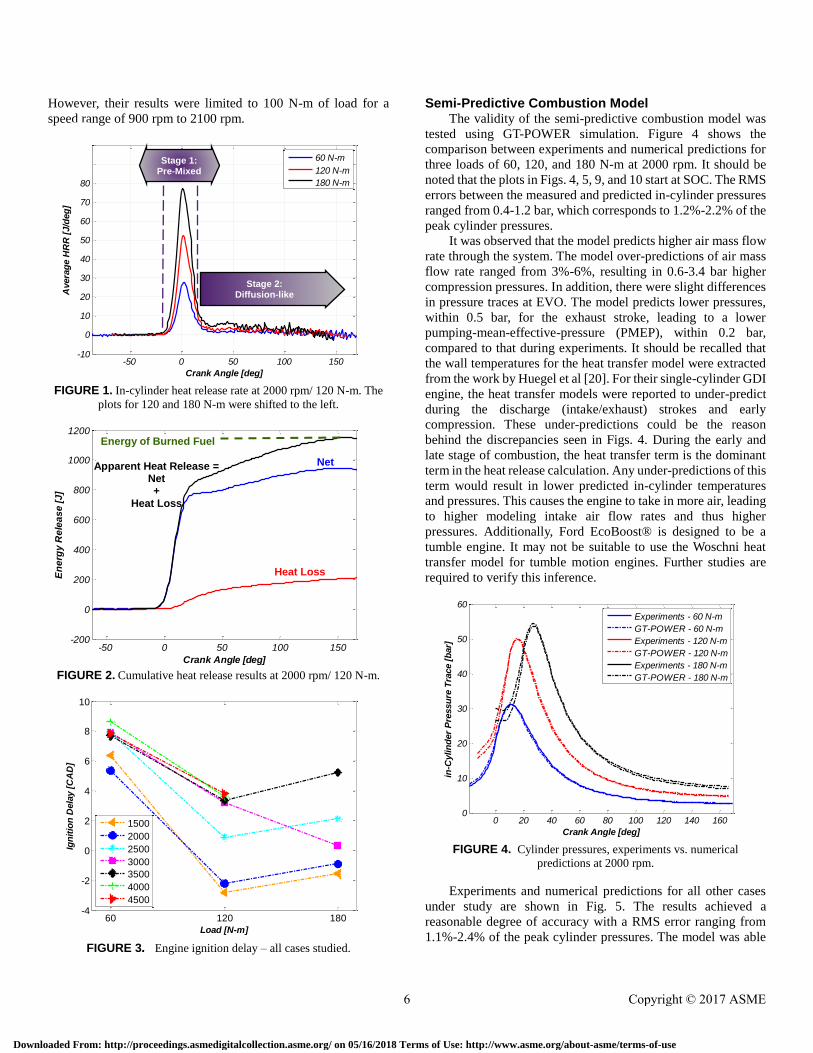
However, their results were limited to 100 N-m of load for a
speed range of 900 rpm to 2100 rpm.
FIGURE 1. In-cylinder heat release rate at 2000 rpm/ 120 N-m. The
plots for 120 and 180 N-m were shifted to the left.
FIGURE 2. Cumulative heat release results at 2000 rpm/ 120 N-m.
FIGURE 3. Engine ignition delay – all cases studied.
Semi-Predictive Combustion Model The validity of the semi-predictive combustion model was
tested using GT-POWER simulation. Figure 4 shows the
comparison between experiments and numerical predictions for
three loads of 60, 120, and 180 N-m at 2000 rpm. It should be
noted that the plots in Figs. 4, 5, 9, and 10 start at SOC. The RMS
errors between the measured and predicted in-cylinder pressures
ranged from 0.4-1.2 bar, which corresponds to 1.2%-2.2% of the
peak cylinder pressures.
It was observed that the model predicts higher air mass flow
rate through the system. The model over-predictions of air mass
flow rate ranged from 3%-6%, resulting in 0.6-3.4 bar higher
compression pressures. In addition, there were slight differences
in pressure traces at EVO. The model predicts lower pressures,
within 0.5 bar, for the exhaust stroke, leading to a lower
pumping-mean-effective-pressure (PMEP), within 0.2 bar,
compared to that during experiments. It should be recalled that
the wall temperatures for the heat transfer model were extracted
from the work by Huegel et al [20]. For their single-cylinder GDI
engine, the heat transfer models were reported to under-predict
during the discharge (intake/exhaust) strokes and early
compression. These under-predictions could be the reason
behind the discrepancies seen in Figs. 4. During the early and
late stage of combustion, the heat transfer term is the dominant
term in the heat release calculation. Any under-predictions of this
term would result in lower predicted in-cylinder temperatures
and pressures. This causes the engine to take in more air, leading
to higher modeling intake air flow rates and thus higher
pressures. Additionally, Ford EcoBoost® is designed to be a
tumble engine. It may not be suitable to use the Woschni heat
transfer model for tumble motion engines. Further studies are
required to verify this inference.
FIGURE 4. Cylinder pressures, experiments vs. numerical
predictions at 2000 rpm.
Experiments and numerical predictions for all other cases
under study are shown in Fig. 5. The results achieved a
reasonable degree of accuracy with a RMS error ranging from
1.1%-2.4% of the peak cylinder pressures. The model was able
-50 0 50 100 150-10
0
10
20
30
40
50
60
70
80
90
100
Crank Angle [deg]
Avera
ge H
RR
[J/d
eg
]
60 N-m
120 N-m
180 N-m
-50 0 50 100 150-200
0
200
400
600
800
1000
1200
Crank Angle [deg]
En
erg
y R
ele
as
e [
J]
60 120 180-4
-2
0
2
4
6
8
10
Load [N-m]
Ign
itio
n D
ela
y [
CA
D]
1500
2000
2500
3000
3500
4000
4500
0 20 40 60 80 100 120 140 1600
10
20
30
40
50
60
Crank Angle [deg]
in-C
ylin
der
Pre
ssu
re T
race [
bar]
Experiments - 60 N-m
GT-POWER - 60 N-m
Experiments - 120 N-m
GT-POWER - 120 N-m
Experiments - 180 N-m
GT-POWER - 180 N-m
Heat Loss
Apparent Heat Release = Net +
Heat Loss
Net
Energy of Burned Fuel
Stage 1: Pre-Mixed
Stage 2: Diffusion-like
6 Copyright © 2017 ASME
Downloaded From: http://proceedings.asmedigitalcollection.asme.org/ on 05/16/2018 Terms of Use: http://www.asme.org/about-asme/terms-of-use

to capture the peak pressure at all the loads and speeds except for
3500 rpm and 180 N-m (case #15). At this operating condition,
the experimental data reveals a relatively low coolant
temperature (marked with arrow in Fig. 6) which can be the
response to the abnormally high in-cylinder temperature (see
case #15 in Fig. 7). The load and speed associated to each of
these case numbers, listed in Figs. 6, 7, and 8, can be found in
Table 2. This abnormality was accounted for the larger deviation
of experimental and numerical peak pressures. Additionally,
higher pressures were observed for all the cases during the early
compression and late expansion. The reason behind these
discrepancies have been identified while discussing Fig. 4.
FIGURE 6. Intercooler, intake manifold, coolant, and exhaust
manifold temperature – all cases studied. The load and speed
associated to each of these case numbers can be found in Table 2.
FIGURE 7. In-cylinder temperature at spark timing for all the
cases. The load and speed associated to each of these case numbers can
be found in Table 2.
Predictive Combustion Model The predicting correlations were found for the six variables
of the double-Wiebe function from the results obtained for the
semi-predictive combustion model using linear regressions. The
comparisons between direct calculations of double-Wiebe
function variables and that of linearly developed model
predictions are shown in Fig. 8. Results demonstrate a good
prediction for all the variables except for ∆𝜃1. However, even the
linear model for ∆𝜃1 with a low R-squared value of 0.51 predicts
a general trend close to the experiments. It is shown in this figure
that the major discrepancy happens at case #15 (speed/load of
3500rpm/ 180N-m) which the abnormal behavior of this
operating condition has been already discussed.
FIGURE 5. Cylinder pressures, experiments vs. numerical predictions – all cases studied; solid and dashed line represent the experiments and
numerical prediction, respectively. In each subplot, blue lines show 60 N-m load with red and black representing loads of 120 N-m and 180 N-m,
respectively.
0 5 10 15 2020
25
30
35
40
Tem
pera
ture
[C
]
InterCooler
0 5 10 15 2025
30
35
40Intake Manifold
0 5 10 15 2080
85
90
95
100
Tem
pera
ture
[C
]
Case #
Coolant
0 5 10 15 20500
600
700
800
900
Case #
Exhaust Manifold
0 5 10 15 20280
290
300
310
320
330
340
350
360
370
in-C
yl T
em
p @
Sp
ark
Tim
ing
[C
]
Case #
0 20 40 60 80 100 120 140 160
10
20
30
40
50
Pre
ssu
re T
race [
bar]
0 20 40 60 80 100 120 140 160
10
20
30
40
50
0 20 40 60 80 100 120 140 160
20
40
60
0 20 40 60 80 100 120 140 160
10
20
30
40
50
Pre
ssu
re T
race [
bar]
Crank Angle [deg]
0 20 40 60 80 100 120 140 160
10
20
30
40
50
Crank Angle [deg]
0 20 40 60 80 100 120 140 160
20
40
60
20
Crank Angle [deg]
Speed: 1500 rpm Min RMS Err: 1.1 Max RMS Err: 1.3
Speed: 2500 rpm Min RMS Err: 1.3 Max RMS Err: 1.9
Speed: 3000 rpm Min RMS Err: 1.2 Max RMS Err: 2.2
Speed: 3500 rpm Min RMS Err: 1.3 Max RMS Err: 2.4
Speed: 4000 rpm Min RMS Err: 1.5 Max RMS Err: 1.7
Speed: 4500 rpm Min RMS Err: 1.2 Max RMS Err: 1.3
7 Copyright © 2017 ASME
Downloaded From: http://proceedings.asmedigitalcollection.asme.org/ on 05/16/2018 Terms of Use: http://www.asme.org/about-asme/terms-of-use

FIGURE 8. Double-Wiebe variables, direct calculations vs. linear models predictions; solid and dashed line represent the direct calculations and
models predictions, respectively. The load and speed associated to each of these case numbers can be found in Table 2.
Cumulative heat release can be regenerated using linear
correlations found for the six variables of the double-Wiebe
function. Figure 9 compares the cumulative normalized apparent
heat release obtained from direct calculations with those from
the developed linear model predictions for the loads of 60, 120,
and 180 N-m at 2000 rpm. The RMS errors between direct
calculations and model predictions ranged from 0.5%-3.5%. The
results obtained for all other loads and speeds can be found in
Fig. 10. Overall, the comparison of direct calculations and model
predictions showed a RMS error within 3.5%. Therefore, the
developed predictive combustion model is believed to well
predict in-cylinder heat release characteristics. The model
accuracy can be improved further by employing non-linear
regression models which were avoided in this work for the sake
of model simplicity.
FIGURE 9. Cumulative normalized apparent heat release, direct
calculations vs. developed linear model predictions at 2000 rpm.
HEAT RELEASE ANALYIS OF DM-TJI ENGINE
As mentioned earlier, this study was performed to set the
ground for future works where the combustion behavior of a
production-based GDI engine would be compared to that of a
DM-TJI engine. Single-zone heat release analysis cannot
account for the mass and energy transfer between DM-TJI pre-
and main chambers. Therefore, a more detailed two-zone
analysis such as the work by Song et al. [4] should be done to
study the complexity of the problem. However, single-zone
analysis should be able to produce reliable simplified results
since the pre-chamber volume in a DM-TJI engine is as small as
3% of volume at TDC [3].
Single-zone heat release analysis has been performed on the
experimental data obtained from a gasoline-powered single-
cylinder DM-TJI engine at Michigan State University (MSU).
Engine specifications can be found in Table 4. Engine was
operated at 1500 rpm for all the cases studied here. Details of the
engine setup and experimental procedure can be found in [3].
Figure 11 compares the normalized apparent heat release for the
DM-TJI engine for a range of gross indicated-mean-effective-
pressure (IMEPg) values below 6.5 bar with that of the Ford
EcoBoost® GDI engine at 1500 rpm and a load of 60 N-m
(IMEPg: 5.8 bar).
TABLE 4 DM-TJI engine specifications
Bore 95 mm
Stroke 100 mm
Connecting rod length 190 mm
Compression ratio 12:1
Pre-chamber volume 2700 mm3 (~0.4% of displacement volume)
Main chamber volume 0.709 L
Fuel injection High-pressure injectors for both chambers
Fuel type EPA LEV-II liquid gasoline (both chambers)
0 5 10 15 20-30
-20
-10
0
10
SO
C [
CA
DaT
DC
]
0 5 10 15 20
0.65
0.7
0.75
0.8
[
-]
0 5 10 15 2035
40
45
50
55
1 [
CA
D]
0 5 10 15 20200
250
300
2 [
CA
D]
Case #
0 5 10 15 201.5
2
2.5
3
m1
[-]
Case #
0 5 10 15 200.8
1
1.2
1.4
1.6
1.8
m2
[-]
Case #
0 50 100 1500
0.1
0.2
0.3
0.4
0.5
0.6
0.7
0.8
0.9
1
Crank Angle [deg]
Cu
mu
lati
ve N
orm
alized
Ap
pare
nt
HR
[C
AD
]
Single-Zone Model - 60 N-m
linear fit - 60 N-m
Single-Zone Model - 120 N-m
linear fit - 120 N-m
Single-Zone Model - 180 N-m
linear fit - 180 N-m
RMS Error: 2.14
R-squared: 0.932
RMS Error: 0.02 R-squared: 0.78
RMS Error: 2.45 R-squared: 0.51
RMS Error: 11.50 R-squared: 0.77
RMS Error: 0.08 R-squared: 0.90
RMS Error: 0.08 R-squared: 0.86
8 Copyright © 2017 ASME
Downloaded From: http://proceedings.asmedigitalcollection.asme.org/ on 05/16/2018 Terms of Use: http://www.asme.org/about-asme/terms-of-use

FIGURE 10. Cumulative normalized apparent heat release, direct calculations vs. developed linear model predictions – all cases studied; solid and
dashed line represent the experiments and numerical predictions, respectively. In each subplot, blue lines show 60 N-m load with red and black
representing loads of 120 N-m and 180 N-m, respectively.
FIGURE 11 Normalized apparent heat release, homogeneous
turbocharged GDI engine vs. DM-TJI; speed of 1500 rpm and 𝐼𝑀𝐸𝑃𝑔
~ 6 bar.
FIGURE 12 Normalized in-cylinder heat transfer, homogeneous
turbocharged GDI engine vs. DM-TJI; speed of 1500 rpm and 𝐼𝑀𝐸𝑃𝑔
~ 6 bar.
The different behaviors of normalized apparent heat release
for DM-TJI and GDI engine are evident in Figs. 11 and 12. In
Fig. 11, the DM-TJI combustion system is shown to benefit
from a rapid pressure rise similar to that in the GDI engine.
However, DM-TJI engine operation retains the fast burn rate
until the end of combustion, while GDI engine operation entails
a slow-paced diffusion-like phase of combustion after
approximately 10 CAo. Additionally, for a given load, lean burn
combustion in the DM-TJI engine showed a lower percentage
of in-cylinder heat transfer (see Fig. 12) compared to a GDI
engine, as a result of lower in-cylinder temperatures. Recall that
the GDI engine was run at stoichiometry with throttled intake
to attain IMEPg of 5.8 bar. These predictions made by current
single zone analysis will be further verified by employing a
two-zone analysis on the DM-TJI engine. In addition, the
corresponding combustion model of the DM-TJI engine will be
studied and published in a separate manuscript.
0 50 100 150
0.2
0.4
0.6
0.8
Cu
mu
lati
ve H
eat
Rele
ase
0 50 100 150
0.2
0.4
0.6
0.8
0 50 100 150
0.2
0.4
0.6
0.8
0 50 100 150
0.2
0.4
0.6
0.8
Cu
mu
lati
ve H
eat
Rele
ase [
-]
Crank Angle [deg]
0 50 100 150
0.2
0.4
0.6
0.8
Crank Angle [deg]
0 50 100 150
0.2
0.4
0.6
0.8
Crank Angle [deg]
-100 -50 0 50 100 150-0.2
0
0.2
0.4
0.6
0.8
1
1.2
Crank Angle [deg]
No
rmalized
Ap
pare
nt
HR
[-]
Ford EcoBoost 1.6L
DM-TJI, IMEPg: 4.5 bar
DM-TJI, IMEPg: 5.6 bar (WOT)
DM-TJI, IMEPg: 6.3 bar (WOT)
-100 -50 0 50 100 150-2
0
2
4
6
8
10
12
14
16
18
Crank Angle [deg]
in-C
ylin
der
Heat
Tra
nsfe
r [%
of
To
tal H
R]
Ford EcoBoost 1.6L
DM-TJI, IMEPg: 4.5 bar
DM-TJI, IMEPg: 5.6 bar (WOT)
DM-TJI, IMEPg: 6.3 bar (WOT)
Speed: 1500 rpm Min RMS Err: 1.7 Max RMS Err: 3.1
Speed: 2500 rpm Min RMS Err: 1.2 Max RMS Err: 2.2
Speed: 3000 rpm Min RMS Err: 1.0 Max RMS Err: 1.7
Speed: 3500 rpm Min RMS Err: 1.6 Max RMS Err: 3.0
Speed: 4000 rpm Min RMS Err: 1.8 Max RMS Err: 2.4
Speed: 4500 rpm Min RMS Err: 1.9
Max RMS Err: 2.4
9 Copyright © 2017 ASME
Downloaded From: http://proceedings.asmedigitalcollection.asme.org/ on 05/16/2018 Terms of Use: http://www.asme.org/about-asme/terms-of-use
CONCLUSION
A combustion model was developed and validated for a
homogeneous turbocharged GDI engine operated at a wide
range of loads and speeds. Unlike that in a PFI engine, the
combustion system of a homogeneous DI engine incurred initial
rapid burn pre-mixed combustion followed by a slow diffusion-
like phase of combustion. Based on this observation, a double-
Wiebe function was employed to model the heat release
behavior of the GDI engine. Double-Wiebe variables were
further studied to develop a predictive combustion model by
using a set of engine parameters. The validity of the predictive
combustion model was tested in repeat study of the heat release
characteristics of the current GDI engine.
The semi-predictive combustion model reasonably
demonstrated the combustion behavior of this GDI
engine in reproducing the in-cylinder pressure traces.
The RMS errors between experiments and numerical
pressure traces were within 2.4% of peak in-cylinder
pressures.
The predictive combustion model was able to capture
two phases of combustion for the GDI engine with a
maximum RMS error of 3.4% in reproduction of the
results obtained from the direct semi-predictive model.
This study is believed to act as a strong foundation for
future works to compare the combustion behavior of a
production-based GDI engine with that of a DM-TJI engine.
The DM-TJI combustion system offers several benefits in
improving the performance of spark ignition engines. Here, a
preliminary study was conducted to compare the heat release
and heat transfer characteristics of the GDI engine to those of a
single-cylinder DM-TJI engine. The DM-TJI engine appears to
benefit from a faster energy release and lower heat transfer
compared to the GDI engine at the same load and speed. Future
works will involve a two-zone heat release analysis to account
for the mass/energy transfer between pre- and main chambers
of the DM-TJI engine. This heat release analysis can be used in
further development of a predictive combustion model for such
engines. Additionally, the heat transfer model of GDI engines
should be further investigated in order to extend the model
prediction to the entire engine cycle.
NOMENCLATURE
Abbreviations
BMEP Brake Mean Effective Pressure CAS Combustion Analysis System
CAD Computer-Aided Design
CAN Controller Area Network DM-TJI Dual Mode, Turbulent Jet Ignition
ECU Engine Control Unit
EGR Exhaust Gas Recirculation EPA Environmental Protection Agency
Err Error
EVC Exhaust Valve Closing EVO Exhaust Valve Opening
FEAD Front End Accessory Drive
GDI Gasoline Direct-Injection HTM Heat Transfer Multiplier
IMEP Indicated Mean Effective Pressure
IVC Intake Valve Closing OBD On-Board Diagnostics
OEM Original Equipment Manufacturer
Max Maximum Min Minimum
MSU Michigan State University
MY Model Year PFI Port Fuel Injection
PI Proportional Integral
PID Proportional Integral Derivative PMEP Pumping Mean Effective Pressure
RMS Root-Mean-Square
SACI Spark-Assisted Compression Ignition
SOC Start of Combustion
TDC Top Dead Center
WOT Wide Open Throttle
Mathematical Symbols
𝐵 Cylinder Bore 𝑚
𝐶1&𝐶2 Constants given −
ℎ𝑐 Cylinder heat transfer coefficient 𝑊
𝑚2𝐾
𝐾1&𝐾2 Constant given −
𝑚1 Combustion mode parameter (Wiebe
exponent) for 1st Wiebe function −
𝑚2 Combustion mode parameter (Wiebe
exponent) for 2nd Wiebe function −
𝑝 Cylinder pressure 𝑘𝑃𝑎
𝑝𝑚 Motoring pressure 𝑘𝑃𝑎
𝑝𝑟 Working fluid pressure prior to combustion 𝑘𝑃𝑎
𝑄𝑐ℎ Apparent total heat release 𝑘𝐽
𝑄ℎ.𝑡 Heat transfer to the walls 𝑘𝐽
𝑆𝑝_ Mean piston speed 𝑚/𝑠
𝑡 Time 𝑠 T Cylinder temperature 𝐾
𝑇𝑒𝑥ℎ∗ Exhaust temperature at intake pressure 𝐾
𝑇𝑟 Working fluid temperature prior to combustion 𝐾
𝑉 Cylinder volume 𝑚3
𝑉𝑑 Displacement volume 𝑚3
𝑉𝑟 Working fluid volume prior to combustion 𝑚3
𝑤 Average cylinder gas velocity 𝑚/𝑠
𝑥𝑟 Internal residual gas fraction −
Greek Symbols
𝛼 Switch point from 1st Wiebe function to 2nd
𝛾 Specific heat ratio
𝜃0 Start of combustion
𝜃𝑖𝑔𝑛 Ignition timing
∆𝜃1 Total burn duration for 1st Wiebe function
∆𝜃2 Total burn duration for 2nd Wiebe function
Subscripts
𝑐 Coefficient
𝑐ℎ Chamber
𝑑 Displacement
𝑒𝑥ℎ Exhaust
𝐸𝑉𝐶 Exhaust Valve Close
𝐸𝑉𝑂 Exhaust Valve Open
ℎ. 𝑡 Heat transfer
𝑖𝑛𝑡 Intake
𝑚 Motoring
10 Copyright © 2017 ASME
Downloaded From: http://proceedings.asmedigitalcollection.asme.org/ on 05/16/2018 Terms of Use: http://www.asme.org/about-asme/terms-of-use

𝑀𝑎𝑛 Manifold
𝑝 Piston
𝑟 Prior to combustion
ACKNOWLEDGMENTS
This project was supported by the US EPA, Tenneco Inc.,
and the state of Michigan. The authors would like to thank Dr.
Matt Brusstar and Mr. Mark Stuhldreher of EPA for their
valuable technical contributions.
REFERENCES
[1] Fraser, N., Blaxill, H., Lumsden, G., and Bassett, M.,
2009, “Challenges for Increased Efficiency through
Gasoline Engine Downsizing,” SAE Int. J. Engines, 2(1),
pp. 991–1008.
[2] Estefanous, F., Mekhael, S., Badawy, T., Henein, N., and
Zahdeh, A., 2014, “Multisensing Fuel Injector in
Turbocharged Gasoline Direct Injection Engines,” J.
Eng. Gas Turbines Power, 136(11), pp. 111502-111502–
7.
[3] Vedula, R. T., Song, R., Stuecken, T., Zhu, G. G., and
Schock, H., 2017, “Thermal Efficiency of a Dual-Mode
Turbulent Jet Ignition Engine under Lean and near-
Stoichiometric Operation,” Int. J. Engine Res.
[4] Song, R., Gentz, G., Zhu, G., Toulson, E., and Schock,
H., 2016, “A Control-Oriented Model of Turbulent Jet
Ignition Combustion in a Rapid Compression Machine,”
Proc. Inst. Mech. Eng. Part J. Automob. Eng.
[5] De Boer, C., Bonar, G., Sasaki, S., and Shetty, S., 2013,
“Application of Supercritical Gasoline Injection to a
Direct Injection Spark Ignition Engine for Particulate
Reduction,” SAE Technical Paper No. 2013-01-0257.
[6] Disch, C., Kubach, H., Spicher, U., Pfeil, J.,
Altenschmidt, F., and Schaupp, U., 2013, “Investigations
of Spray-Induced Vortex Structures during Multiple
Injections of a DISI Engine in Stratified Operation Using
High-Speed-PIV,” SAE Technical Paper No. 2013-01-
0563.
[7] Doornbos, G., Hemdal, S., and Dahl, D., 2015,
“Reduction of Fuel Consumption and Engine-out NO x
Emissions in a Lean Homogeneous GDI Combustion
System, Utilizing Valve Timing and an Advanced
Ignition System,” SAE Technical Paper No. 2015-01-
0776.
[8] Costa, M., Catapano, F., Marseglia, G., Sorge, U.,
Sementa, P., and Vaglieco, B. M., 2015, “Experimental
and Numerical Investigation of the Effect of Split
Injections on the Performance of a GDI Engine Under
Lean Operation,” SAE Technical Paper No. 2015-24-
2413.
[9] Berni, F., Breda, S., D’Adamo, A., Fontanesi, S., and
Cantore, G., 2015, “Numerical Investigation on the
Effects of Water/Methanol Injection as Knock
Suppressor to Increase the Fuel Efficiency of a Highly
Downsized GDI Engine,” SAE Technical Paper No.
2015-24-2499.
[10] Lucchini, T., D’Errico, G., Onorati, A., Bonandrini, G.,
Venturoli, L., and Di Gioia, R., 2012, “Development of a
CFD Approach to Model Fuel-Air Mixing in Gasoline
Direct-Injection Engines,” SAE Technical Paper No.
2012-01-0146.
[11] Fatouraie, M., Wooldridge, M. S., Petersen, B. R., and
Wooldridge, S. T., 2015, “Spray Development and Wall
Impingement of Ethanol and Gasoline in an Optical
Direct Injection Spark Ignition Engine,” ASME Paper
No. ICEF2015-1053, pp. V001T02A004.
[12] Cho, K.-W., Assanis, D., Filipi, Z., Szekely, G., Najt, P.,
and Rask, R., 2008, “Experimental Investigation of
Combustion and Heat Transfer in a Direct-Injection
Spark Ignition Engine via Instantaneous Combustion
Chamber Surface Temperature Measurements,” Proc.
Inst. Mech. Eng. Part J. Automob. Eng., 222(11), pp.
2219–2233.
[13] Brunt, M. F. J., and Platts, K. C., 1999, “Calculation of
Heat Release in Direct Injection Diesel Engines,” SAE
Technical Paper No. 1999-01-0187.
[14] Egnell, R., 2001, “Comparison of Heat Release and NOx
Formation in a DI Diesel Engine Running on DME and
Diesel Fuel,” SAE Technical Paper No. 2001-01-0651.
[15] Dowell, P. G., Akehurst, S., and Burke, R. D., 2016, “An
Improved Rate of Heat Release Model for Modern High
Speed Diesel Engines,” ASME Paper No. ICEF2016-
9360, pp. V001T05A003.
[16] Lindström, F., Angstrom, H.-E., Kalghatgi, G., and
Möller, C. E., 2005, “An Empirical SI Combustion
Model Using Laminar Burning Velocity Correlations,”
SAE Technical Paper No. 2005-01-2106.
[17] Hellström, E., Stefanopoulou, A., and Jiang, L., 2014, “A
Linear Least-Squares Algorithm for Double-Wiebe
Functions Applied to Spark-Assisted Compression
Ignition,” J. Eng. Gas Turbines Power, 136(9), pp.
091514-091514-7.
[18] Prakash, N., Martz, J. B., and Stefanopoulou, A. G.,
2015, “A Phenomenological Model for Predicting the
Combustion Phasing and Variability of Spark Assisted
Compression Ignition (SACI) Engines,” ASME Paper
No. DSCC2015-9883, pp. V001T11A004.
[19] Spicher, U., Reissing, J., Kech, J. M., and Gindele, J.,
1999, “Gasoline Direct Injection (GDI) Engines -
Development Potentialities,” SAE Technical Paper No.
1999-01-2938.
[20] Huegel, P., Kubach, H., Koch, T., and Velji, A., 2015,
“Investigations on the Heat Transfer in a Single Cylinder
Research SI Engine with Gasoline Direct Injection,” SAE
Int. J. Engines, 8(2), pp. 557–569.
[21] Stuhldreher, M., Schenk, C., Brakora, J., Hawkins, D.,
Moskalik, A., and DeKraker, P., 2015, “Downsized
Boosted Engine Benchmarking and Results,” SAE
Technical Paper No. 2015-01-1266.
11 Copyright © 2017 ASME
Downloaded From: http://proceedings.asmedigitalcollection.asme.org/ on 05/16/2018 Terms of Use: http://www.asme.org/about-asme/terms-of-use

[22] Heywood, J., 1988, Internal Combustion Engine
Fundamentals, McGraw-Hill Education, pp. 383-389,
Chap. 9.
[23] Gatowski, J. A., Balles, E. N., Chun, K. M., Nelson, F.
E., Ekchian, J. A., and Heywood, J. B., 1984, “Heat
Release Analysis of Engine Pressure Data,” SAE
Technical Paper No. 841359.
[24] Chang, J., Güralp, O., Filipi, Z., Assanis, D. N., Kuo, T.-
W., Najt, P., and Rask, R., 2004, “New Heat Transfer
Correlation for an HCCI Engine Derived from
Measurements of Instantaneous Surface Heat Flux,” SAE
Technical Paper No. 2004-01-2996.
[25] Yun, H. J., and Mirsky, W., 1974, “Schlieren-Streak
Measurements of Instantaneous Exhaust Gas Velocities
from a Spark-Ignition Engine,” SAE Technical Paper No.
741015.
[26] Reddy, P. R., Krishna, D. M., Mallan, K. R. G., and
Ganesan, V., 1993, “Evaluation of Combustion
Parameters in Direct Injection Diesel Engines - An Easy
and Reliable Method,” SAE Technical Paper No. 930605.
[27] Hariyanto, A., Bagiasna, K., Asharimurti, I., Wijaya, A.
O., Reksowardoyo, I. K., and Arismunandar, W., 2007,
“Application of Wavelet Analysis to Determine the Start
of Combustion of Diesel Engines,” SAE Technical Paper
No. 2007-01-3556.
[28] Shen, Y., Schock, H. J., and Oppenheim, A. K., 2003,
“Pressure Diagnostics of Closed System in a Direct
Injection Spark Ignition Engine,” SAE Technical Paper
No. 2003-01-0723.
[29] Bitar, E. Y., Oppenheim, A. K., and Schock, H. J., 2006,
“Model for Control of Combustion in a Piston Engine,”
SAE Technical Paper No. 2006-01-0401.
[30] Katrašnik, T., Trenc, F., and Oprešnik, S. R., 2005, “A
New Criterion to Determine the Start of Combustion in
Diesel Engines,” J. Eng. Gas Turbines Power, 128(4), pp.
928–933.
[31] Ghojel, J. I., 2010, “Review of the Development and
Applications of the Wiebe Function: A Tribute to the
Contribution of Ivan Wiebe to Engine Research,” Int. J.
Engine Res., 11(4), pp. 297–312.
[32] Assanis, D. N., Filipi, Z. S., Fiveland, S. B., and Syrimis,
M., 2003, “A Predictive Ignition Delay Correlation
Under Steady-State and Transient Operation of a Direct
Injection Diesel Engine,” J. Eng. Gas Turbines Power,
125(2), pp. 450–457.
12 Copyright © 2017 ASME
Downloaded From: http://proceedings.asmedigitalcollection.asme.org/ on 05/16/2018 Terms of Use: http://www.asme.org/about-asme/terms-of-use