combining the microarray and metabolic capabilities of biobike case study how is carbon metabolism...
TRANSCRIPT
Combining the microarray and metabolic capabilities of BioBIKE
Case Study
How is carbon metabolism affected by starving the cyanobacterium Anabaena for nitrogen?*
*Problem taken from Xu X, Elhai J, Wolk CP (2007). Transcriptional and developmental responses
by Anabaena to deprivation of fixed nitrogen. In: The Cyanobacteria: Molecular Biology, Genetics and Evolution (Herrero A, Flores E, eds). Horizon Scientific Press. pp.387-426.
This demonstration is best viewed as a slide show,enabling you to simulate a session and make
changes in cursor position more obvious.To do this, click Slide Show on the top tool bar, then View show.
+N +N
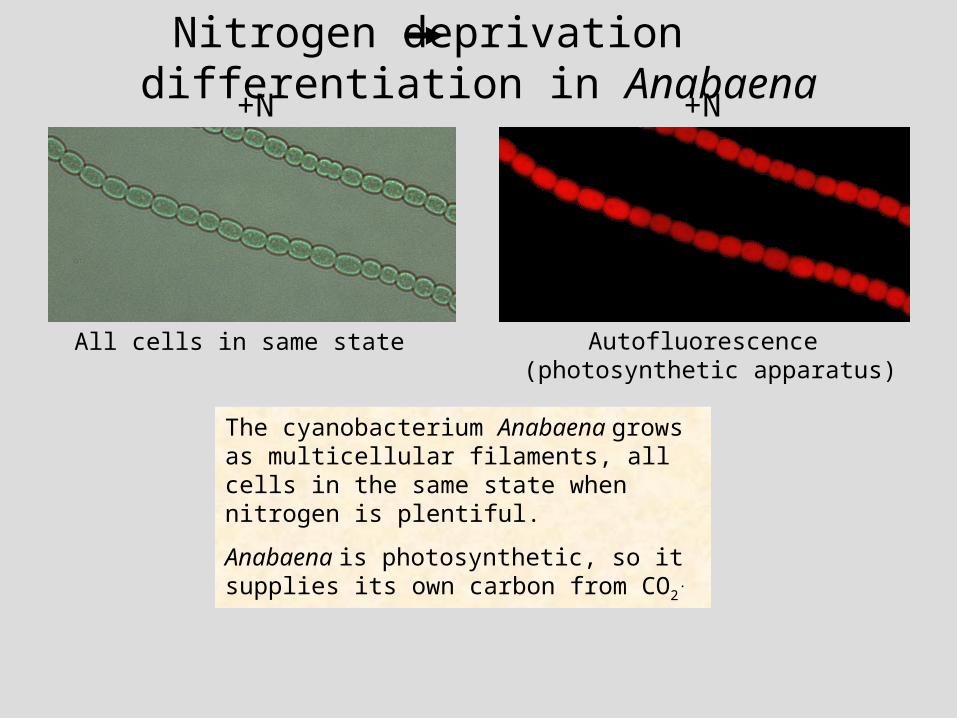
Nitrogen deprivation differentiation in Anabaena
Autofluorescence (photosynthetic apparatus)
All cells in same state
The cyanobacterium Anabaena grows as multicellular filaments, all cells in the same state when nitrogen is plentiful.
Anabaena is photosynthetic, so it supplies its own carbon from CO2
.

+N +N
-N
Nitrogen deprivation differentiation in Anabaena
Autofluorescence (photosynthetic apparatus)
All cells in same state
N2-fixing heterocysts
When starved for nitrogen, Anabaena differentiates specialized cells, heterocysts, that can utilize atmospheric N2 gas.

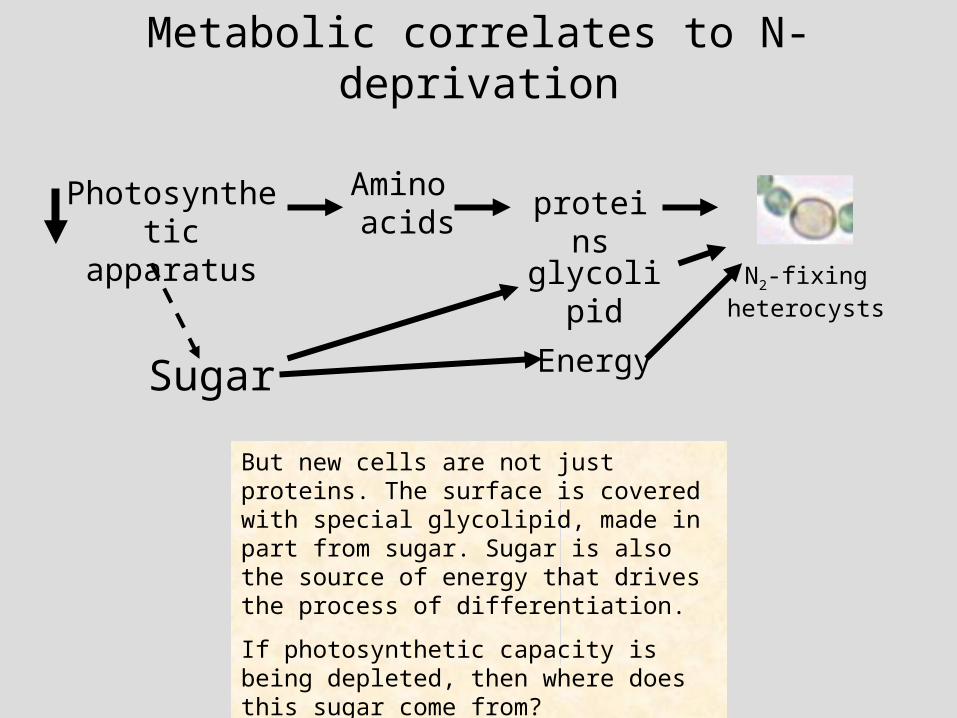
Metabolic correlates to N-deprivation
N2-fixing heterocysts
Photosynthetic apparatus
Amino acids
When the supply of fixed nitrogen (e.g. ammonia) dries up, Anabaena faces the necessity of making N2-fixing heterocysts fast. They get the amino acids to make the new protein needed by heterocysts by cannibalizing the biggest source of proteins in the cell – the photosynthetic apparatus.
proteins
Metabolic correlates to N-deprivation
N2-fixing heterocysts
Photosynthetic apparatus
Amino acids
But new cells are not just proteins. The surface is covered with special glycolipid, made in part from sugar. Sugar is also the source of energy that drives the process of differentiation.
If photosynthetic capacity is being depleted, then where does this sugar come from?
proteins
Sugar
glycolipid
Energy

Metabolic correlates to N-deprivation
We can address this question by examining which genes involved in carbon metabolism are turned on or turned off by N-starvation.
Microarrays can be used to get a snapshot of gene expression under different conditions.
What enzymes of carbon metabolism are affected by N-starvation?
Microarray
+N-NRNA
Courtesy of Inst. für Hormon-und Fortpflanzungsforschung, Universität Hamburg
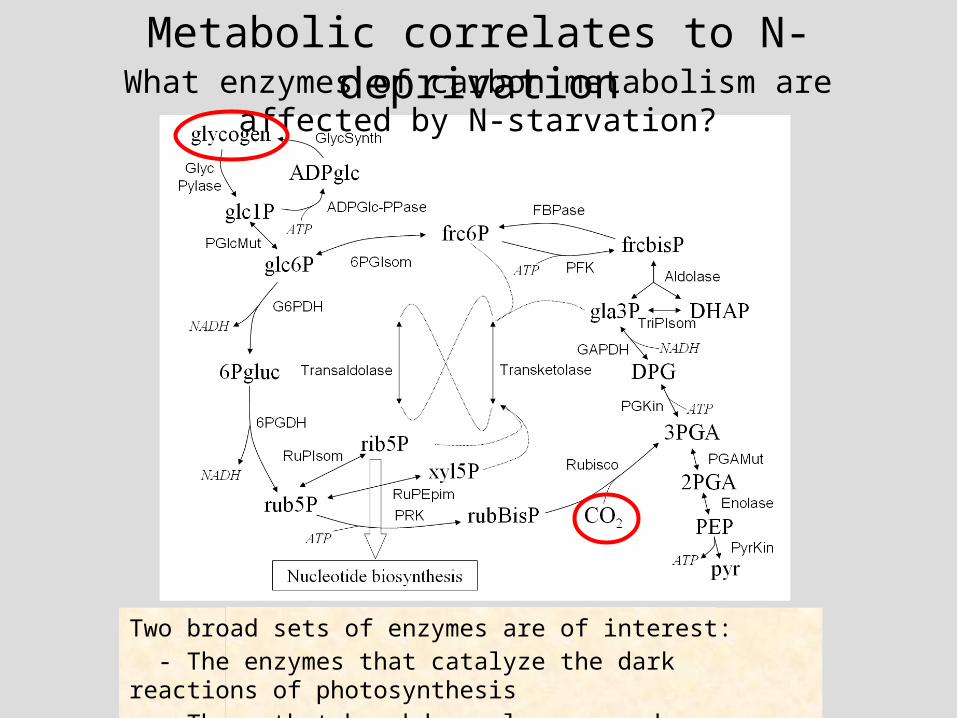
Metabolic correlates to N-deprivationWhat enzymes of carbon metabolism are affected by N-starvation?
Two broad sets of enzymes are of interest:
- The enzymes that catalyze the dark reactions of photosynthesis
- Those that breakdown glycogen and metabolize glucose derivatives.

Metabolic correlates to N-deprivationWhat enzymes of carbon metabolism are affected by N-starvation?
Cyanobacteria use primarily the reactions of the Pentose Phosphate Pathway to break down glucose derivatives. They use carbon fixation reactions to build glucose. These sets overlap a great deal.
Carbon fixationPentose
PhosphatePathway
Glycogenmetabolism

- Define genes involved in pentose phosphate pathway
- Find from microarray how the levels of expression of these genes are affected by N-deprivation
- Sort the results, from lowest expression to highest
- Display the results, along with a description of the genes, in an intelligible way
Go to the BioBIKE Portalbiobike.csbc.vcu.edu
Metabolic correlates to N-deprivation
PLAN

Go to a public site

Your name (no spaces)
Enter a log in nameClick New Login
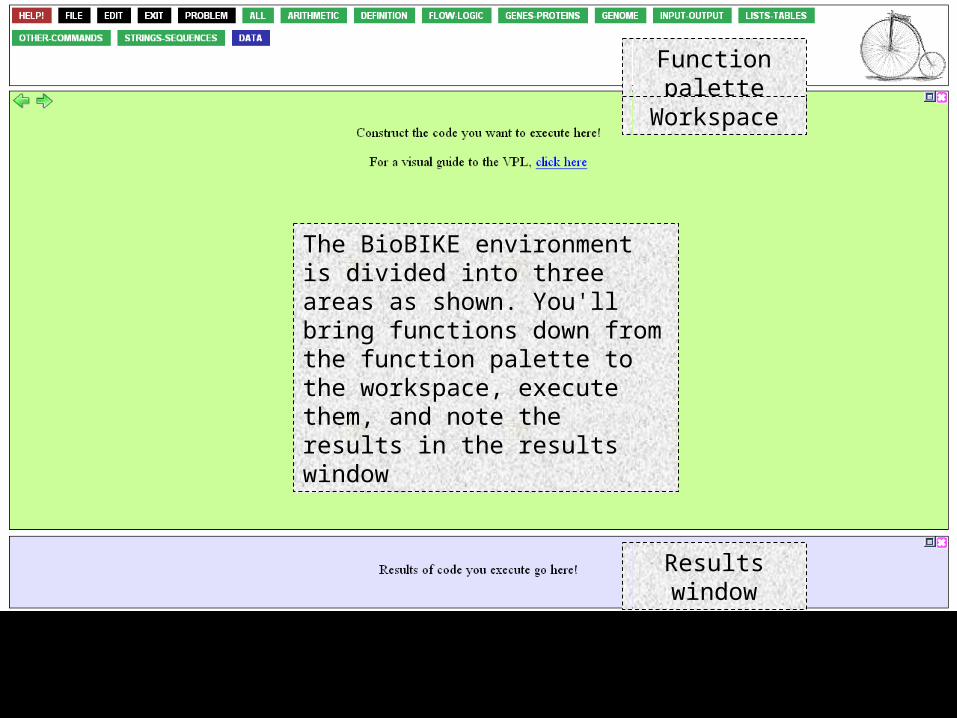
The BioBIKE environment is divided into three areas as shown. You'll bring functions down from the function palette to the workspace, execute them, and note the results in the results window
Function palette
Workspace
Results window

Two very important buttons on the function palette:
On-line help (general)
Something went wrong? Tell us!
HELP!
PROBLEM

Two very important buttons in the workspace:
Undo (return to workspace before last action)
Redo (Get back the workspace you undid)

What now?
The first step in exploring the expression of the genes of carbon metabolism is to define each set. In this tour, we'll focus only on the genes of the pentose phosphate pathway, but you will be able to imagine how the analysis could be extended.
Mouse over the DEFINITION button
PentosePhosphatePathway

… and click DEFINE, to bring down a DEFINE box.

DEFINE box? Before going on, let's take a break to look at what boxes mean.

General Syntax of BioBIKE
Function-name Argument(object)
Keyword object Flag
The basic unit of BioBIKE is the function box. It consists of the name of a function, perhaps one or more required arguments, and optional keywords and flags.
A function may be thought of as a black box: you feed it information, it produces a result.

• Function-name (e.g. SEQUENCE-OF or LENGTH-OF)
• Argument: Required, acted on by the function
• Keyword clause: Optional, more information
General Syntax of BioBIKE
• Flag: Optional, more (yes/no) information
Function-name Argument(object)
Keyword object Flag
Function boxes contain the following elements:

General Syntax of BioBIKE
Function-name Argument(object)
Keyword object Flag
… and icons to help you work with functions:
• Option icon: Brings up a menu of keywords and flags
• Clear/Delete icon: Removes information you entered or removes box entirely
• Action icon: Brings up a menu enabling you to execute a function, copy and paste, information, get help, etc
And now back to our show…

The DEFINE function takes two arguments: the name of the variable to be defined and its value. We want first to define the set of genes encoding the enzymes of the pentose phosphate pathway.
Click the variable argument box.

That opens the box for input. Notice that the box is now white and selected (surrounded by red dots).
Type the name you want to give the set. The name must not contain spaces, but symbols are OK. I chose pentose-phosphate-genes.
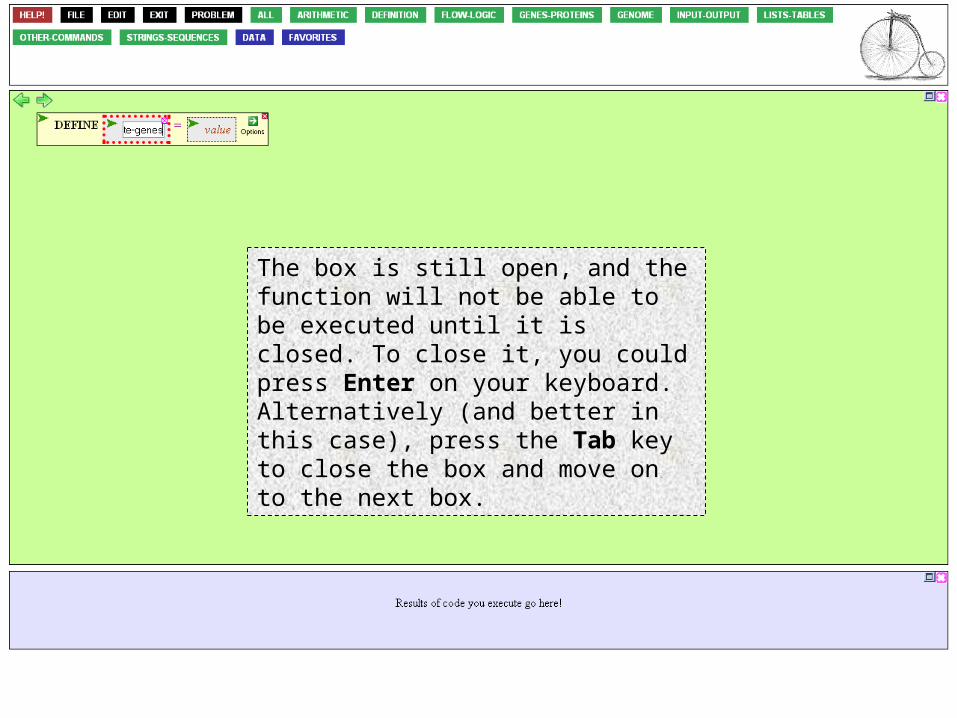
The box is still open, and the function will not be able to be executed until it is closed. To close it, you could press Enter on your keyboard. Alternatively (and better in this case), press the Tab key to close the box and move on to the next box.

Now the value argument box is open for input.
We'd like to put in that box the genes of Anabaena involved in the pentose phosphate pathway. To get a function that will provide those genes, mouse over the Genome button…

… and click GENES-IN-PATHWAY/S.

This function calls for two arguments: the pathway we're interested in and the organism (or a replicon from the organism). The organism is clear, so let's do that first.
Click on the organism-or-replicon argument box. Then, once it's open, mouse over the DATA button to get the organism, Anabaena.

Anabaena is a nitrogen-fixing cyanobacterium, so mouse down to that category

… and across Anabaena PCC 7120 to…Hmmm. Looking ahead, I realize that the microarray I'll be using considers only chromosomally encoded genes. It will simplify matters if I choose the chromosome of Anabaena. Click that.
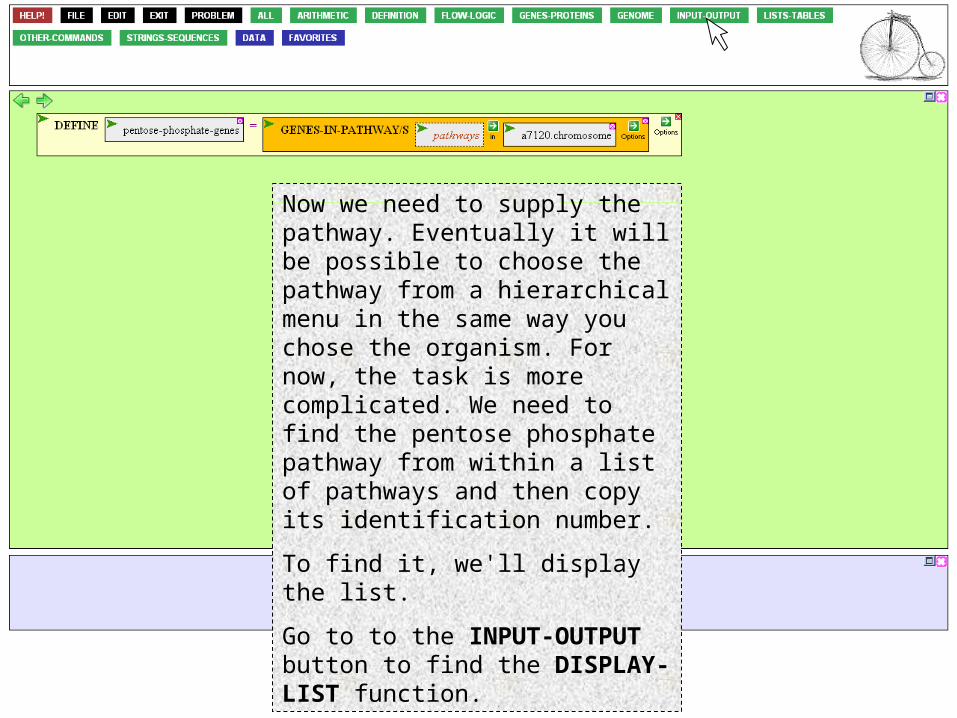
Now we need to supply the pathway. Eventually it will be possible to choose the pathway from a hierarchical menu in the same way you chose the organism. For now, the task is more complicated. We need to find the pentose phosphate pathway from within a list of pathways and then copy its identification number.
To find it, we'll display the list.
Go to to the INPUT-OUTPUT button to find the DISPLAY-LIST function.

Click DISPLAY-LIST to bring down the function.
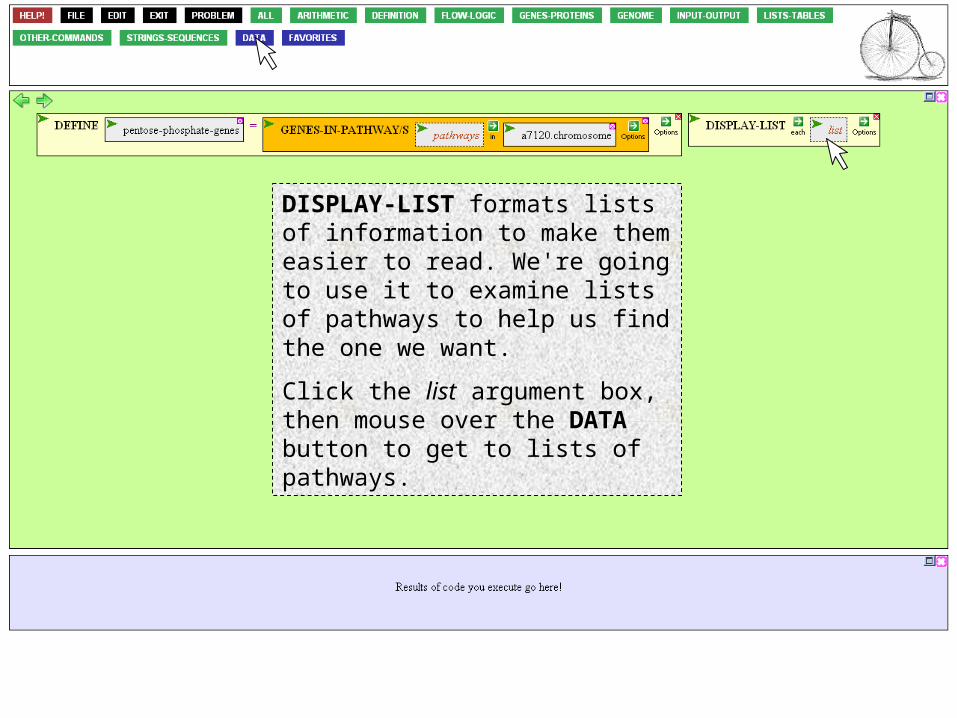
DISPLAY-LIST formats lists of information to make them easier to read. We're going to use it to examine lists of pathways to help us find the one we want.
Click the list argument box, then mouse over the DATA button to get to lists of pathways.

Mouse over kegg-pathways, and click *CARBOHYDRATE-METABOLISM*, the most likely category in which to find the pentose phosphate pathway.

Carbohydrate metabolism consists of many pathways. We want to display each one, with formatting, so mouse over the EACH prefix option and select it.

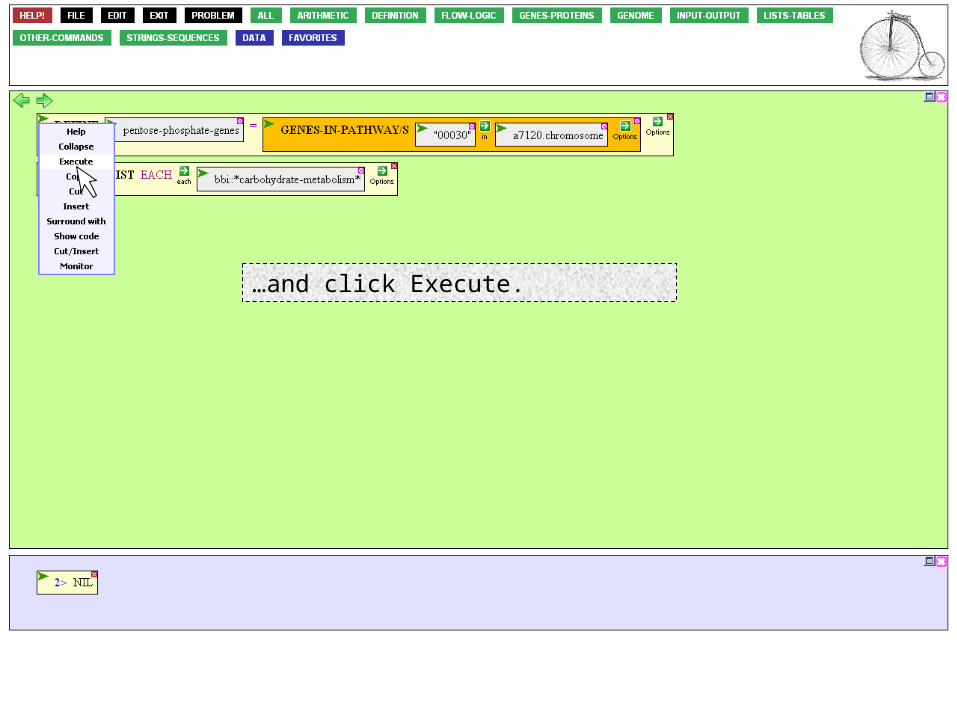
The function is now complete and ready to be executed. Mouse over to the action icon of DISPLAY-LIST…

…and click Execute.

A popup window appears, displaying the list of pathways defined by KEGG as related to carbohydrate metabolism. The pentose phosphate pathway has an identification number "00030". That's what we came for.
Important displays can be downloaded to your computer through the usual browser controls. This time just X out of the box.

With the pathway identification number in hand, click the pathway argument box…

… enter "00030", and press the ENTER key. Once you've done that, all the boxes will be filled in and closed. The function is now ready to be executed.
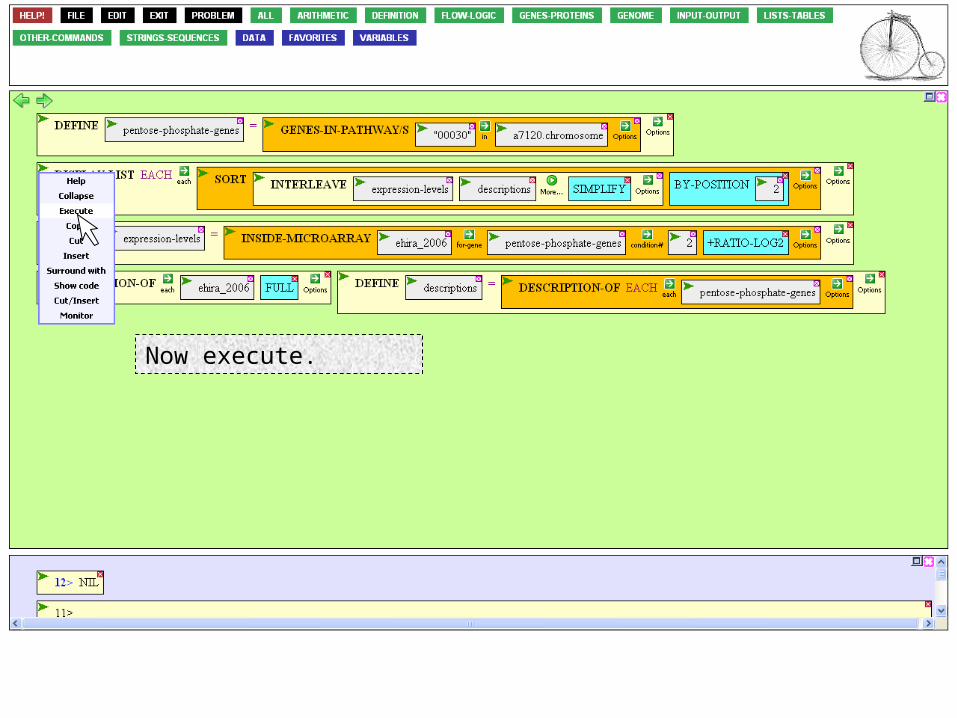
Mouse over the Action Icon of the DEFINE function…
…and click Execute.

Note that a new VARIABLES button appears. We'll use it in a moment. At the same time, a list of genes appears in the Result Window.
What is that list of genes? It's supposed to be the genes in the chromosome of Anabaena that encode enzymes of the pentose phosphate pathway. Is that true?
To check, go to the GENES-PROTEINS button,…
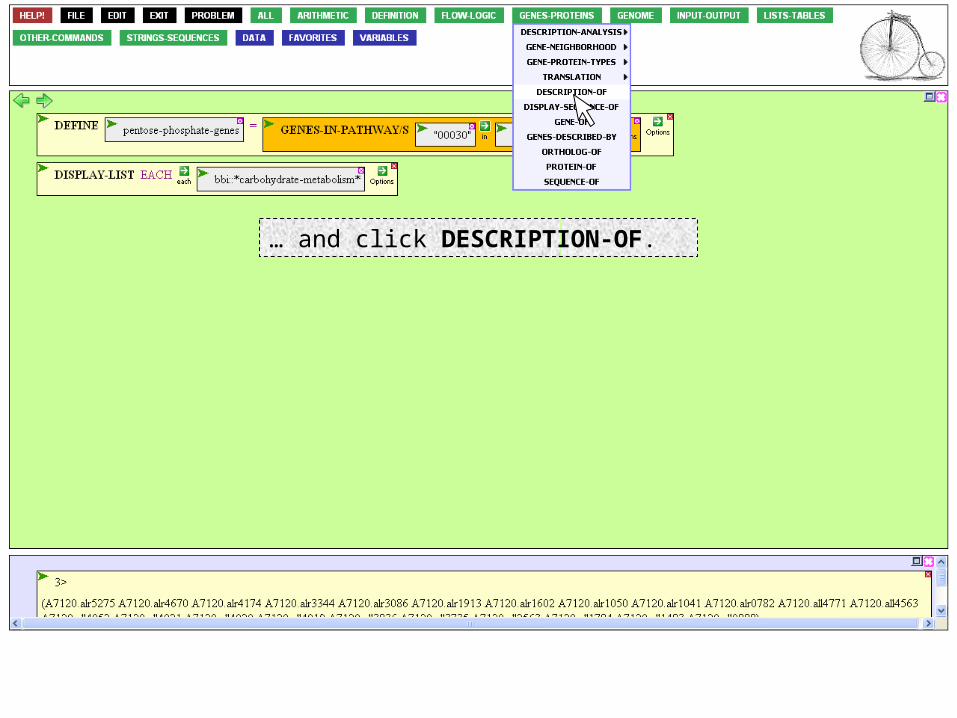
… and click DESCRIPTION-OF.

We can use this function to describe the set of genes we just defined. If we recognize within the descriptions names of enzymes of the pentose phosphate pathway, all is OK.
The function is asking for something to describe. Click on the entity argument box.

The set we just defined has become part of our language, accessible through the Variables button.
Mouse over that button…
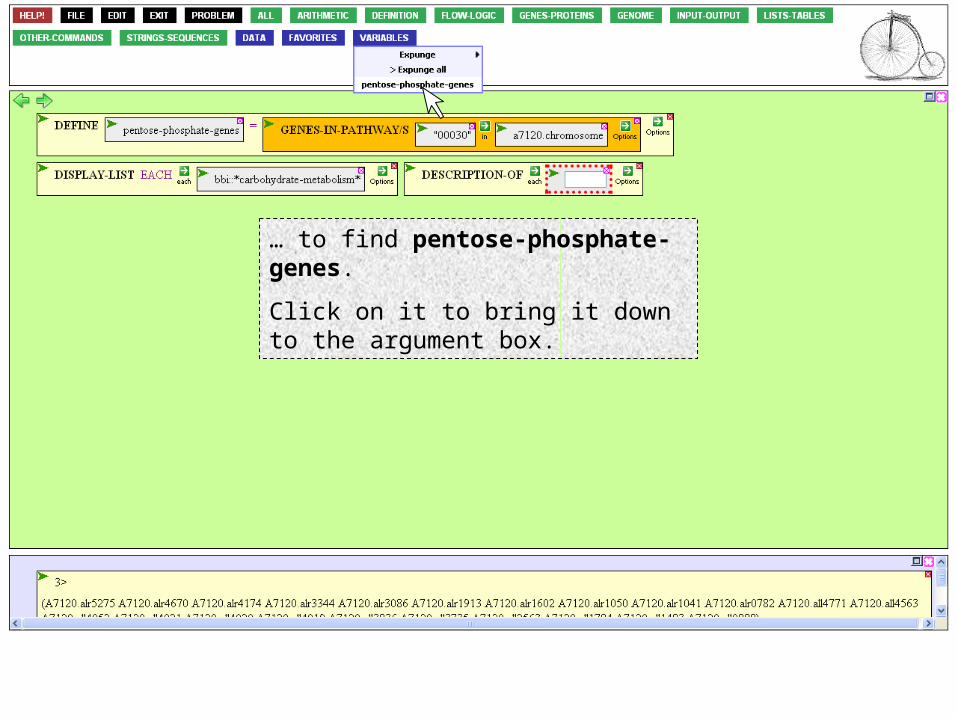
… to find pentose-phosphate-genes.
Click on it to bring it down to the argument box.

You can execute this function as it stands, but the result will be disappointing (try it!). To make the result more intelligible, mouse over the Option Icon…

… and click DISPLAY. Now the results will not only be presented in the Result Window, they will also be displayed in an intelligible form.

You might think that now the function is ready, but try it and you'll get a description of the list (it's a list) when what you want is a description of each element of the list. So as before, you need to specify the EACH prefix option.

Finally, execute the function.

Glucose-6-phosphate dehydrogenase (G6PDH), transaldolase... They all seem to be there. You've done the right thing, checking the result. Now kill the box.
PentosePhosphatePathway

- Define genes involved in pentose phosphate pathway
- Find from microarray how the levels of expression of these genes are affected by N-deprivation
PLAN
We've defined the genes, now we define their expression levels.
Mouse over the DEFINITION button.

- Define genes involved in pentose phosphate pathway
- Find from microarray how the levels of expression of these genes are affected by N-deprivation
… and click DEFINE.

As before, we put in the variable box a memorable name for the set.
Click the variable box.
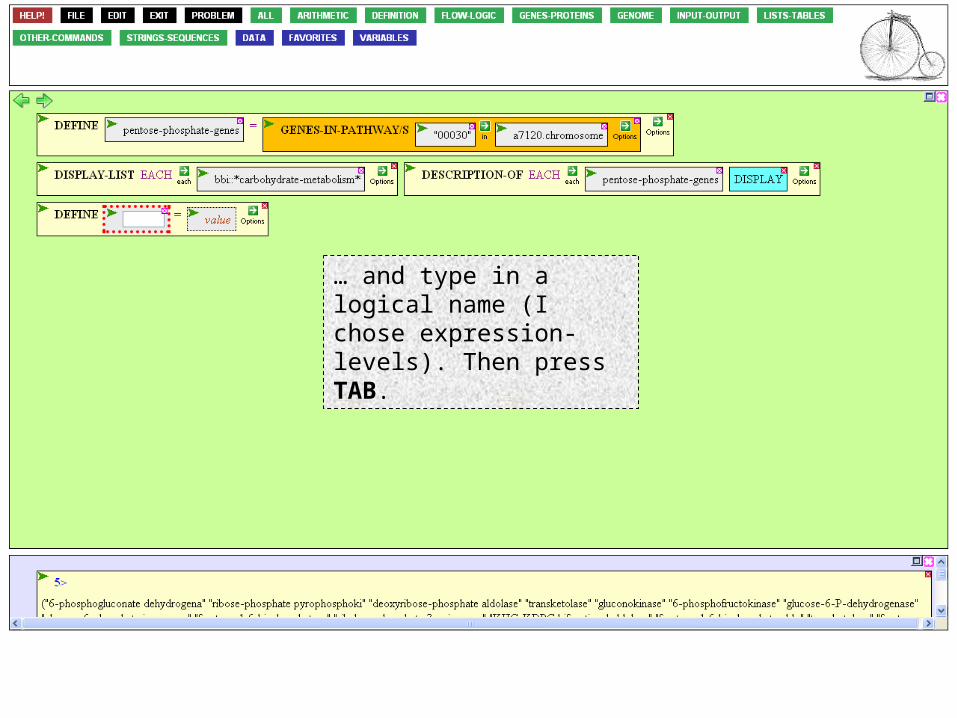
… and type in a logical name (I chose expression-levels). Then press TAB.

Now to get the microarray data. Mouse over the GENOME button to reach the microarray functions.

…and click INSIDE-MICROARRAY to gain access to the expression levels of specific genes.

INSIDE-MICROARRAY needs to know the name of the microarray experiment, the names of the genes your interested in, and the experimental condition.
There are other ways, but suppose we already know of a pertinent experiment…

To use the data of Ehira and Ohmori, click the expt argument box…
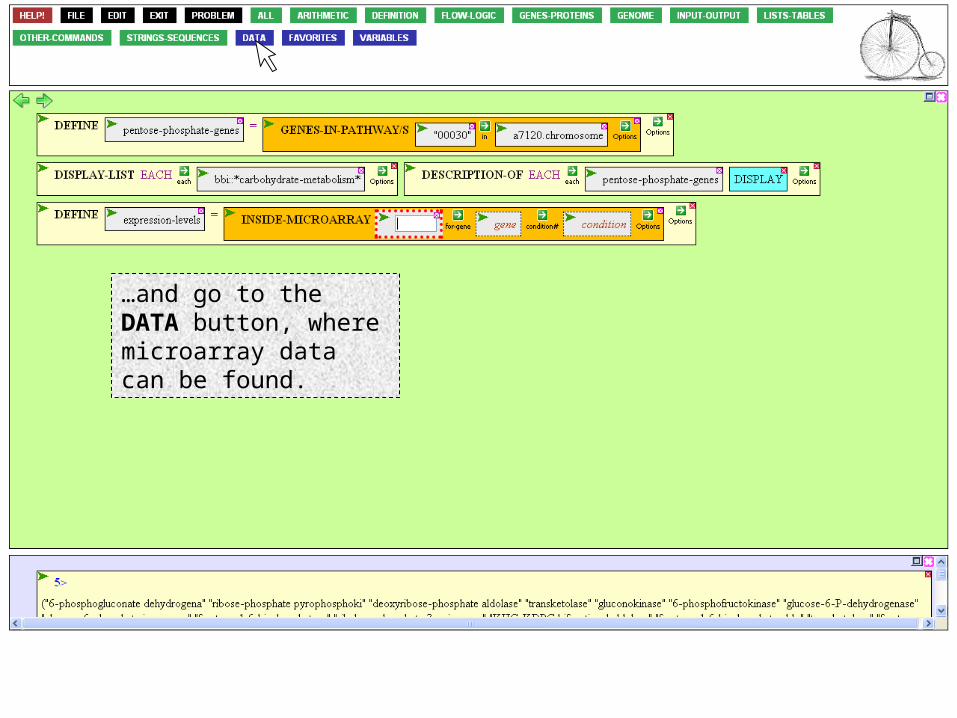
…and go to the DATA button, where microarray data can be found.
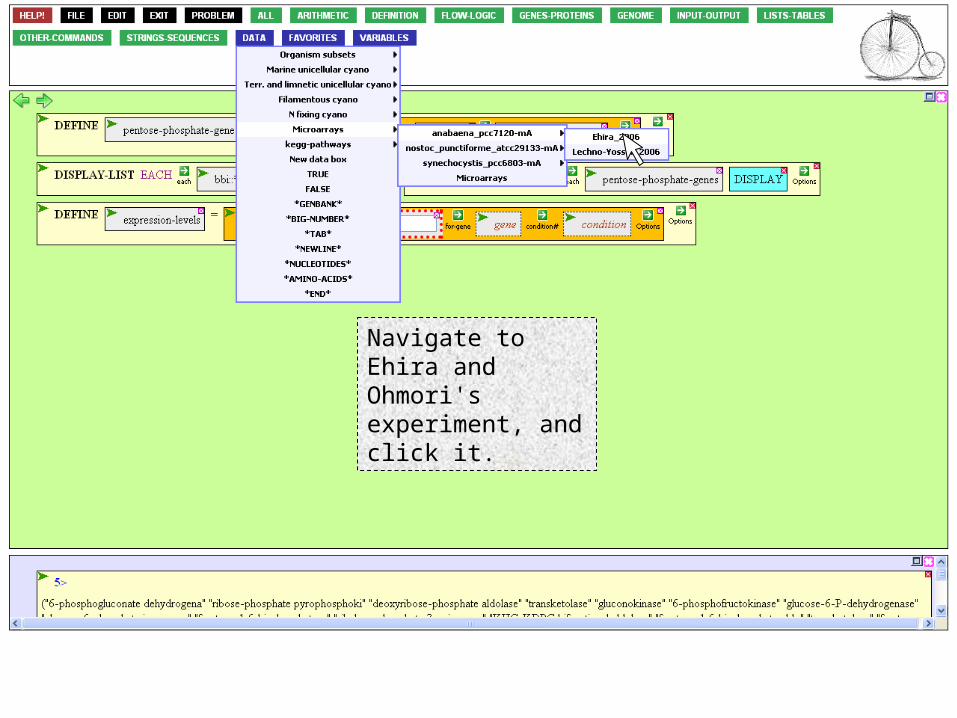
Navigate to Ehira and Ohmori's experiment, and click it.

Experiment in place, where to find the genes? We've already defined the set we're interested in, so open the argument box and mouse over the VARIABLES button.

… and select our set.
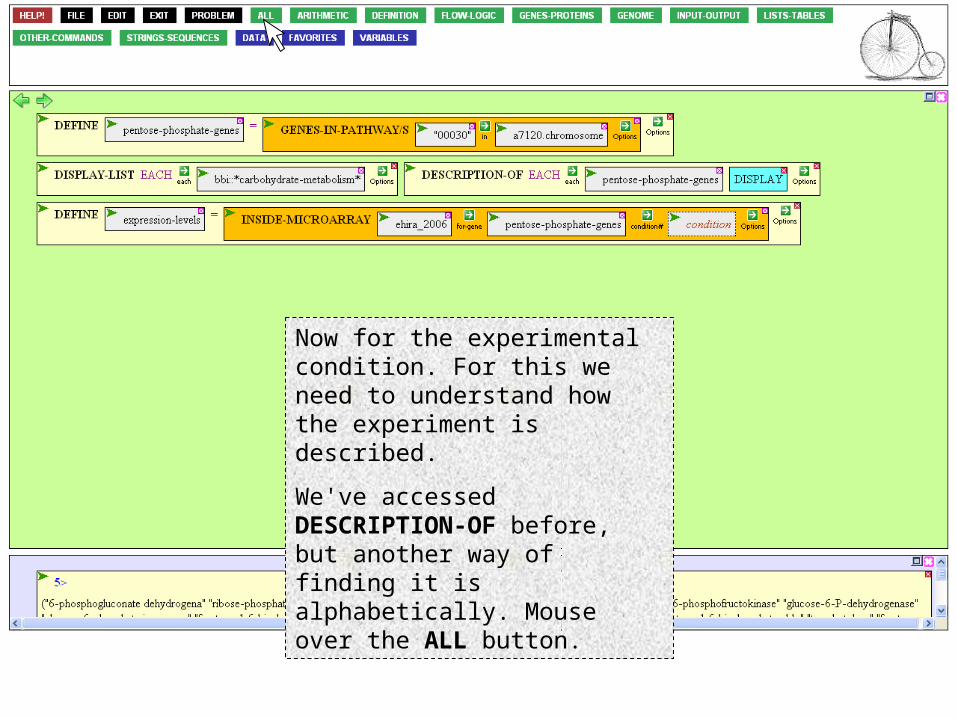
Now for the experimental condition. For this we need to understand how the experiment is described.
We've accessed DESCRIPTION-OF before, but another way of finding it is alphabetically. Mouse over the ALL button.

Find and click DESCRIPTION-OF.

We could get the experiment the same way as before, but it may be easier to copy and paste what we already have.
Mouse over the Action Icon of the experiment.

... and click Copy. The contents of the box is placed in BioBIKE's clipboard (different from the clipboard of your operating system)

To paste what's on the BioBIKE clipboard, mouse over the Action Icon of the target box.
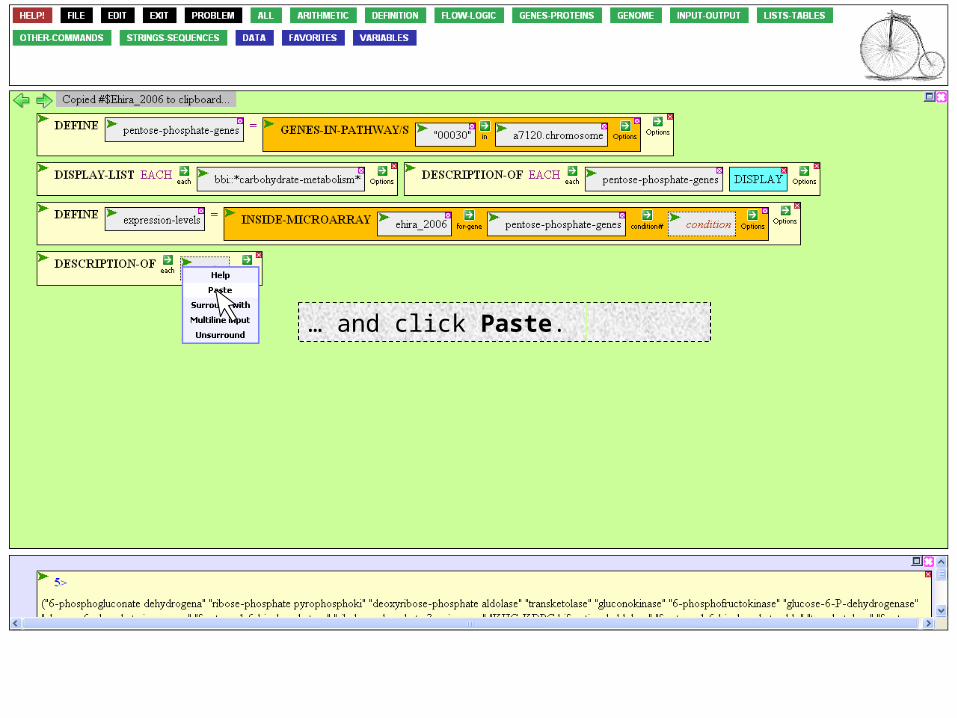
… and click Paste.

If we executed the function now, we’d learn that ehira_2006 is an experiment, not a profound insight. To learn more than this, mouse over to the Option Icon,…
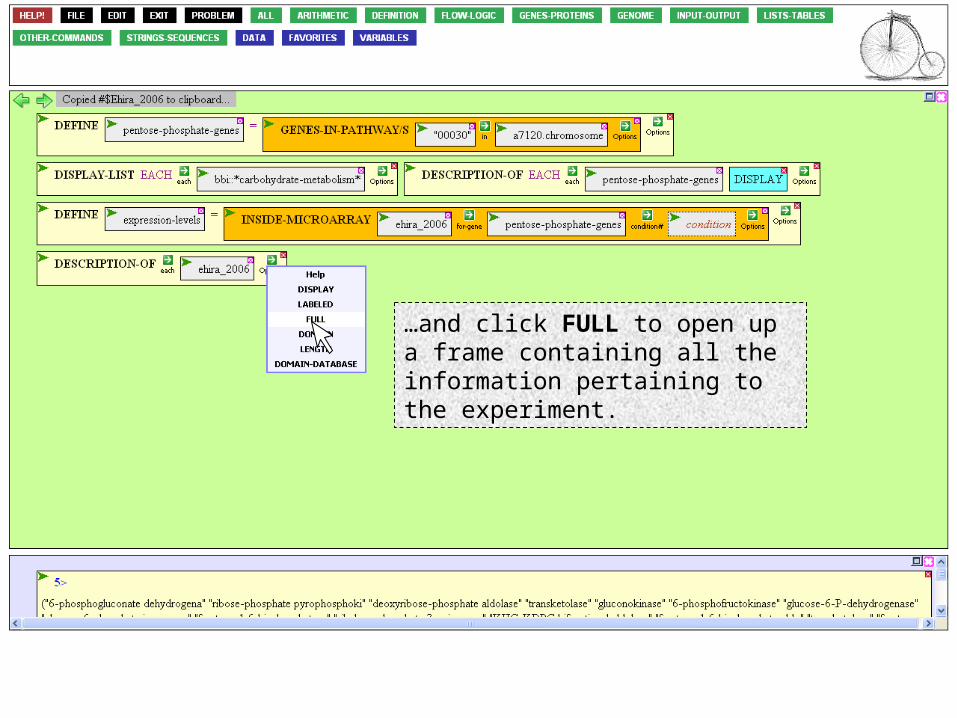
…and click FULL to open up a frame containing all the information pertaining to the experiment.

Click Execute, as usual.

We get a table of contents for the experiment, which we can expand, if we like. But the information we’re looking for is already here. Condition 2 is the microarray that measures expression 8 hr after nitrogen deprivation.
X out of the box.

Now we can fill in the last argument box,…
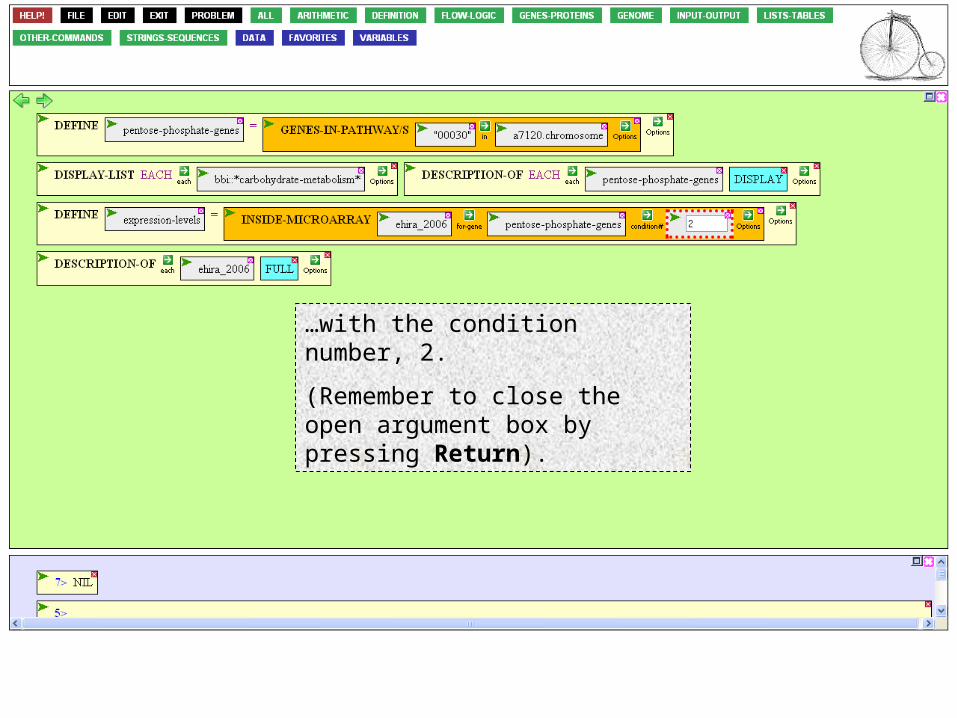
…with the condition number, 2.
(Remember to close the open argument box by pressing Return).

We still have to specify what information we want out of the microarray.
Mouse over the Options Icon.

We can choose as much information as we like, but the log expression ratio is enough. That number represents the ratio of expression at 8 hr of starvation divided by the control experiencing no starvation, represented as a log so that increased levels of expression are positive numbers and decreased levels negative.
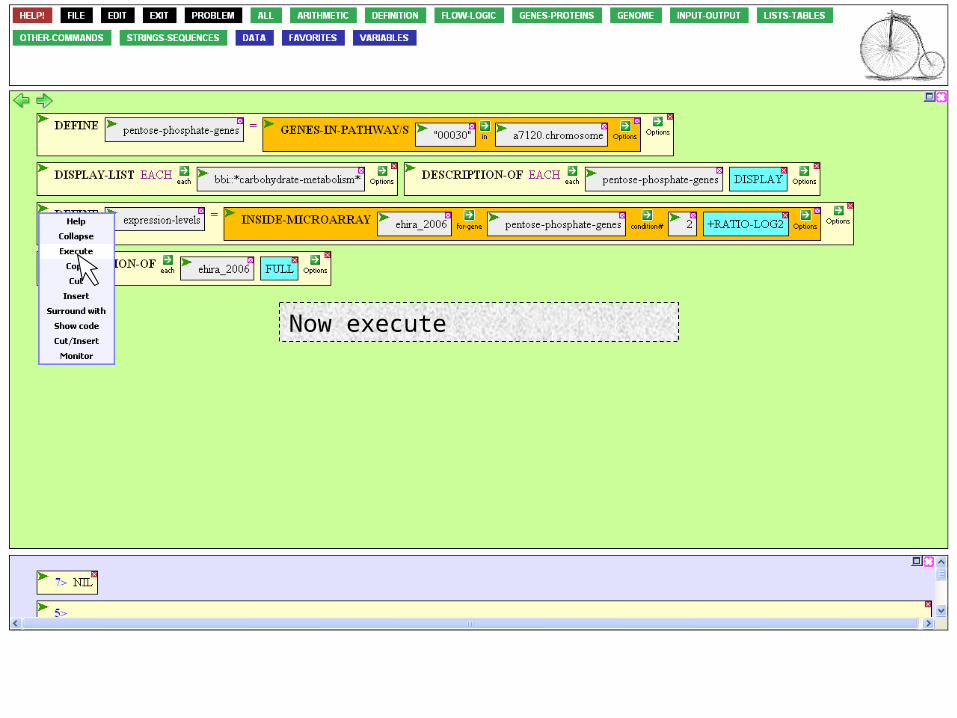
Now execute

The Result Window provides the desired answer – gene + log2-expression-level – good for further computation but not good for human consumption. We used DISPLAY-LIST before to format such results. We can make use of that function box now.
First, clear the earlier argument.
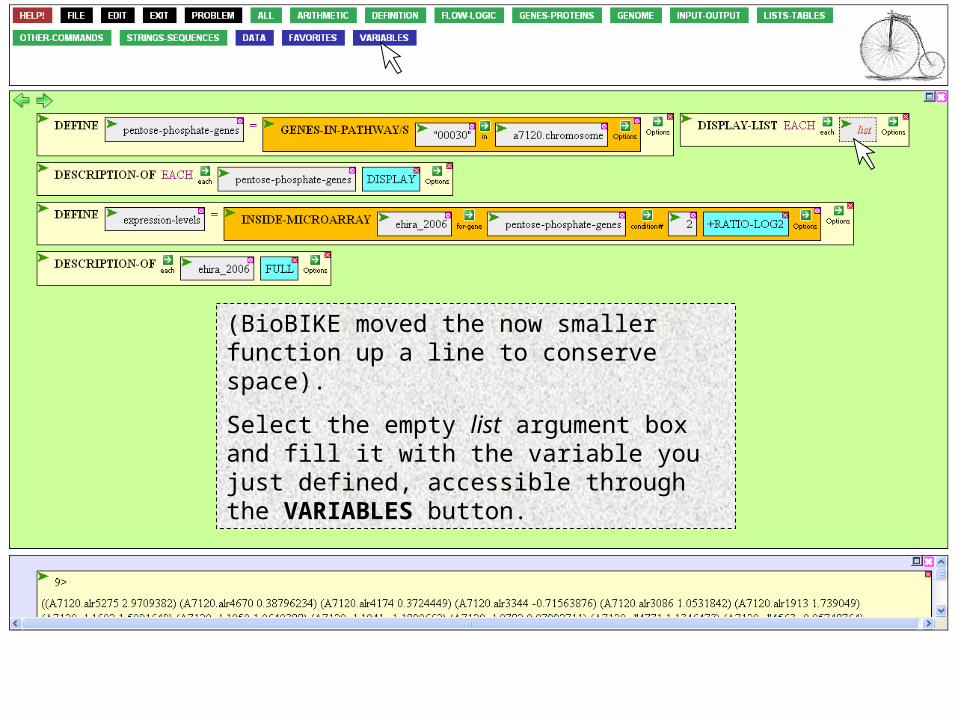
(BioBIKE moved the now smaller function up a line to conserve space).
Select the empty list argument box and fill it with the variable you just defined, accessible through the VARIABLES button.

Select the new variable.

(BioBIKE moved the now larger function back to where it was before. This is a bit jarring, but space is valuable!).
Mouse over the Action Icon of DISPLAY-LIST to execute.

Click Execute…

Well, we got what we asked for: genes and their expression levels, but somehow it doesn’t burst with meaning.
It would be more useful if there were some description of the genes and if the expression levels were sorted.
X out of this box.
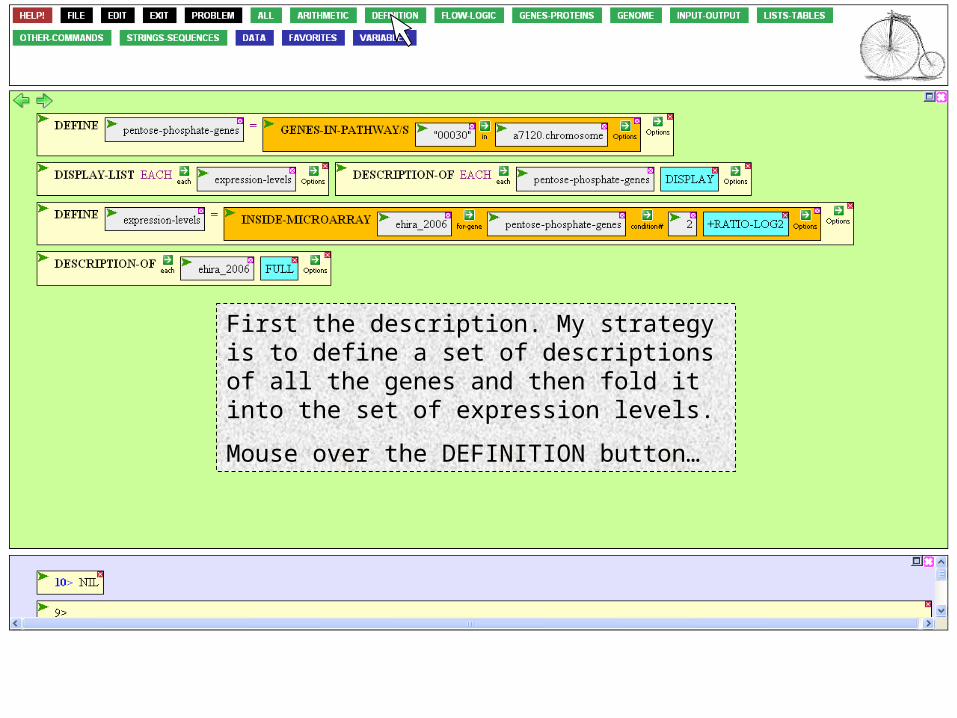
First the description. My strategy is to define a set of descriptions of all the genes and then fold it into the set of expression levels.
Mouse over the DEFINITION button…

…and click DEFINE.

Name the variable something comprehensible, and tab to go to the value argument box.

We’ve already used the DESCRIPTION-OF function. Since the argument box is already selected, all I need to do is to cut out the DESCRIPTION-OF box and insert it into the open box.
To do this, mouse over the box’s Action Icon…

…and click Cut/Insert
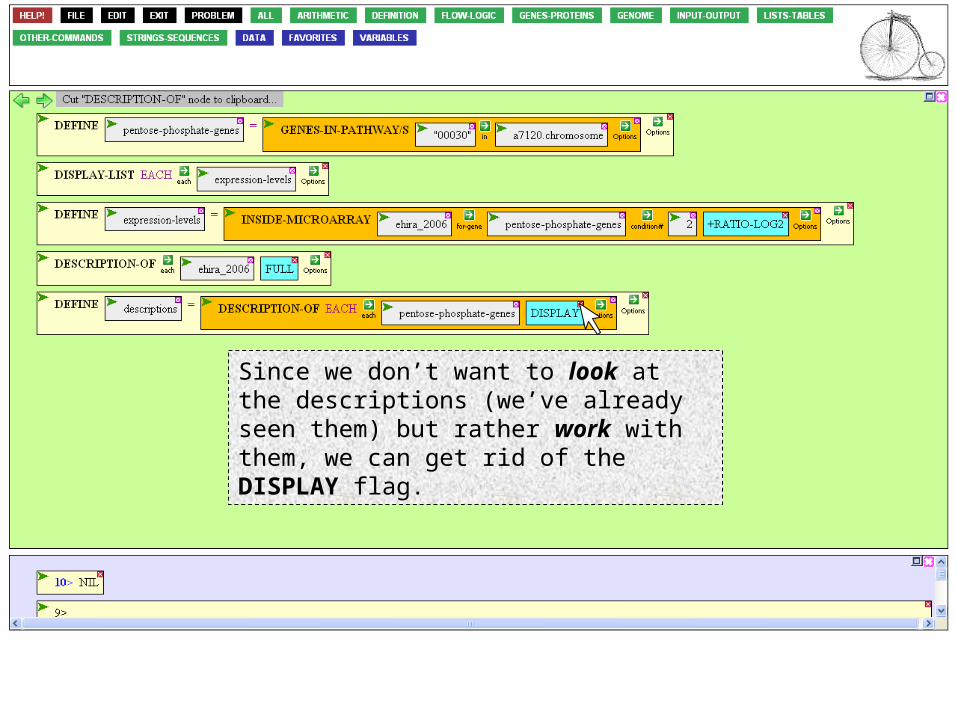
Since we don’t want to look at the descriptions (we’ve already seen them) but rather work with them, we can get rid of the DISPLAY flag.

All good. Now execute it, by mousing to the Action Icon…
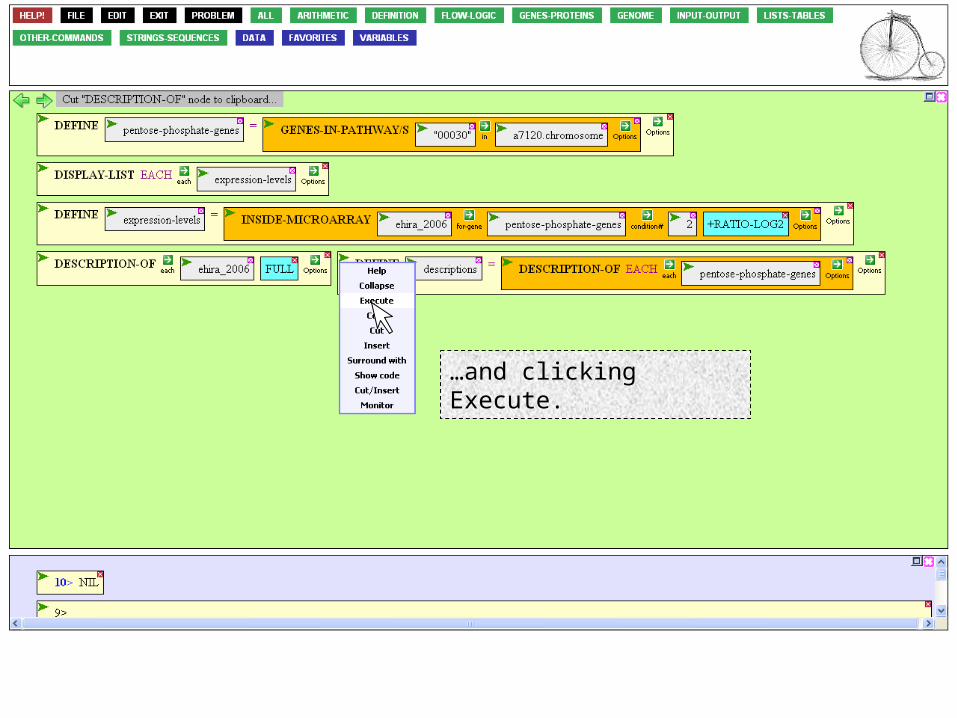
…and clicking Execute.
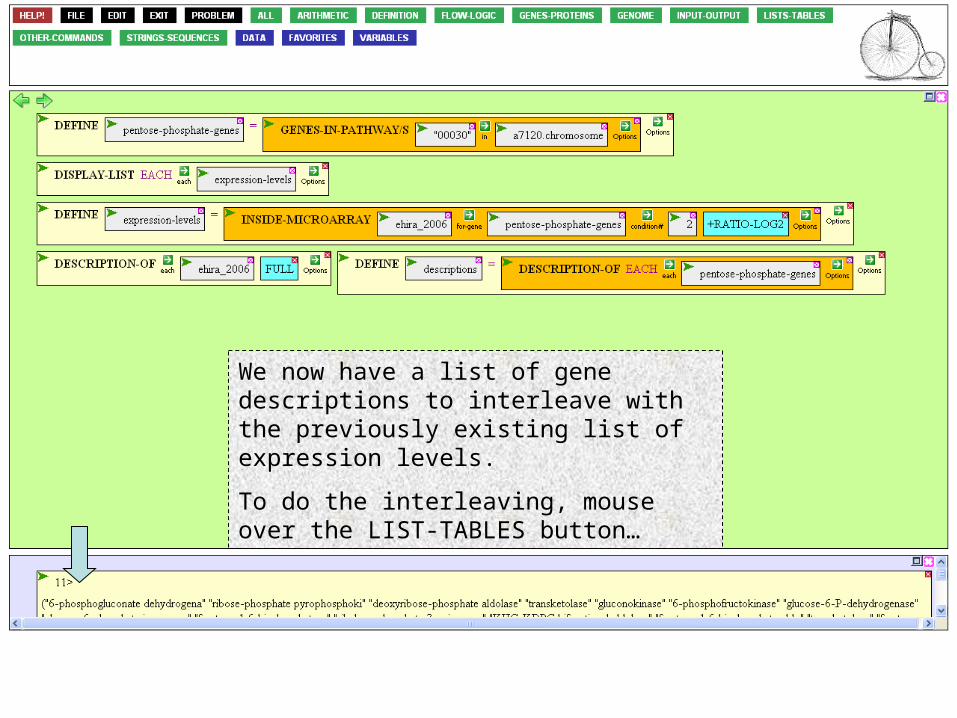
We now have a list of gene descriptions to interleave with the previously existing list of expression levels.
To do the interleaving, mouse over the LIST-TABLES button…

… and navigate to INTERLEAVE.

INTERLEAVE asks us to provide two lists. The first…

…is the expression levels we defined earlier.
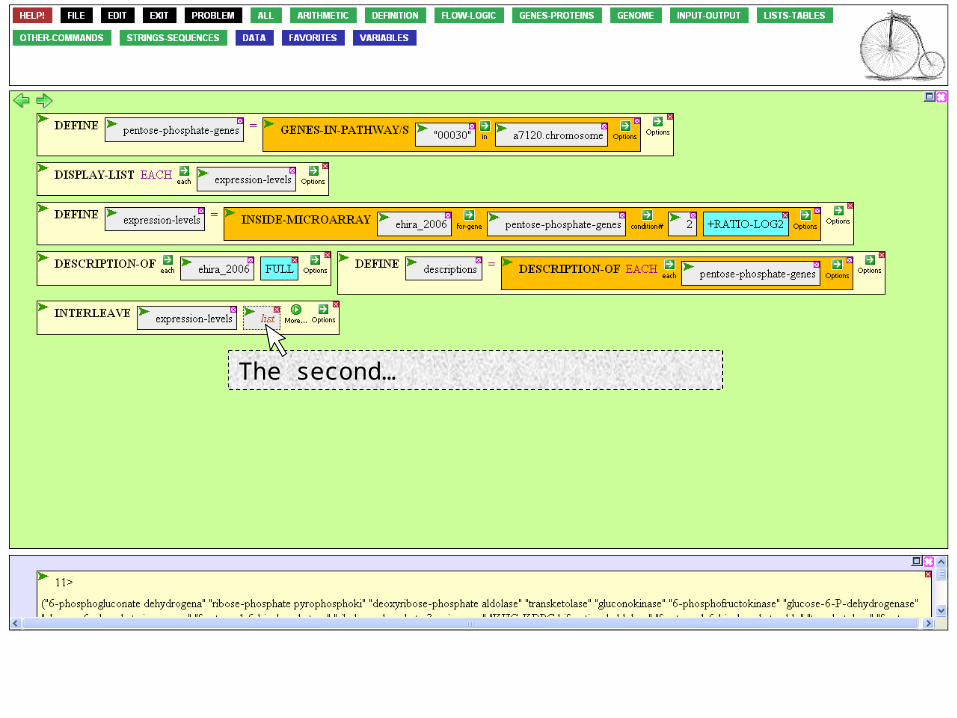
The second…

…is the list of descriptions.

If we execute it as it stands (try it), you’ll be reminded that the expression-levels consist of two values, which will be separated from the descriptions by parentheses. To avoid this fine distinction, SIMPLIFY the list at each round of interleaving.

You can execute this function to make sure it does what it is supposed to do (always a good idea), but in the end, we want to display the list as we did before.
To do this, we can delete the old argument to DISPLAY-LIST…

…and move the INTERLEAVE box into the hole of DISPLAY-LIST.
Click somewhere in the INTERLEAVE box, holding it for a half a second…
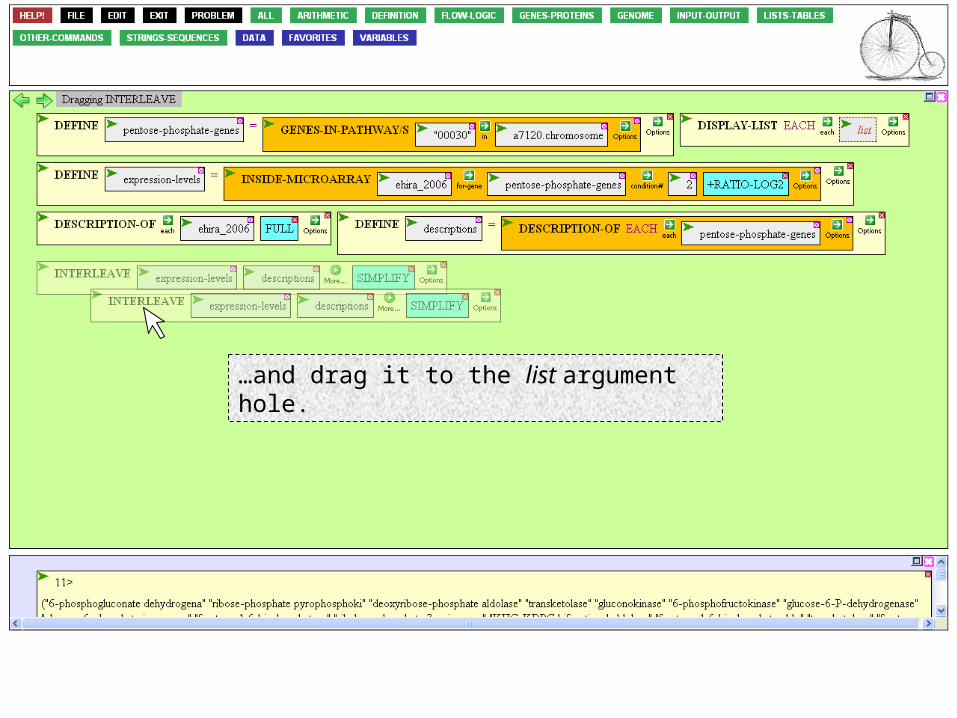
…and drag it to the list argument hole.

…then release it.

Finally, mouse over the Action Icon…

…and execute.

Better!
But not sorted.
X out of the box
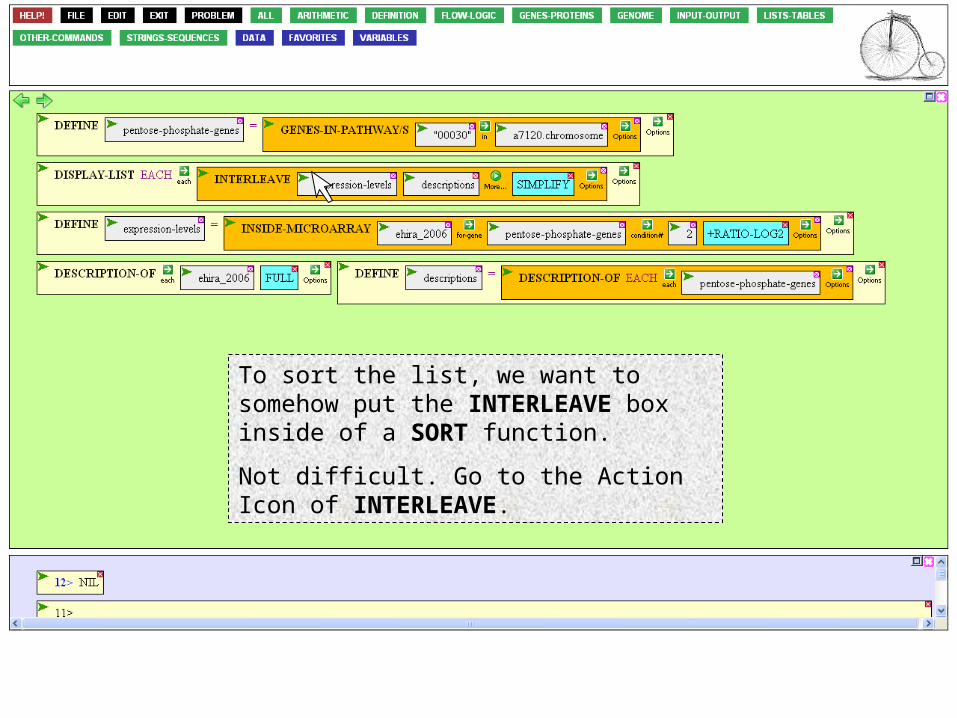
To sort the list, we want to somehow put the INTERLEAVE box inside of a SORT function.
Not difficult. Go to the Action Icon of INTERLEAVE.

…and click Surround with

This selects the box (notice the red dotted outline).
Now mouse to the LIST-TABLES menu and click on SORT.
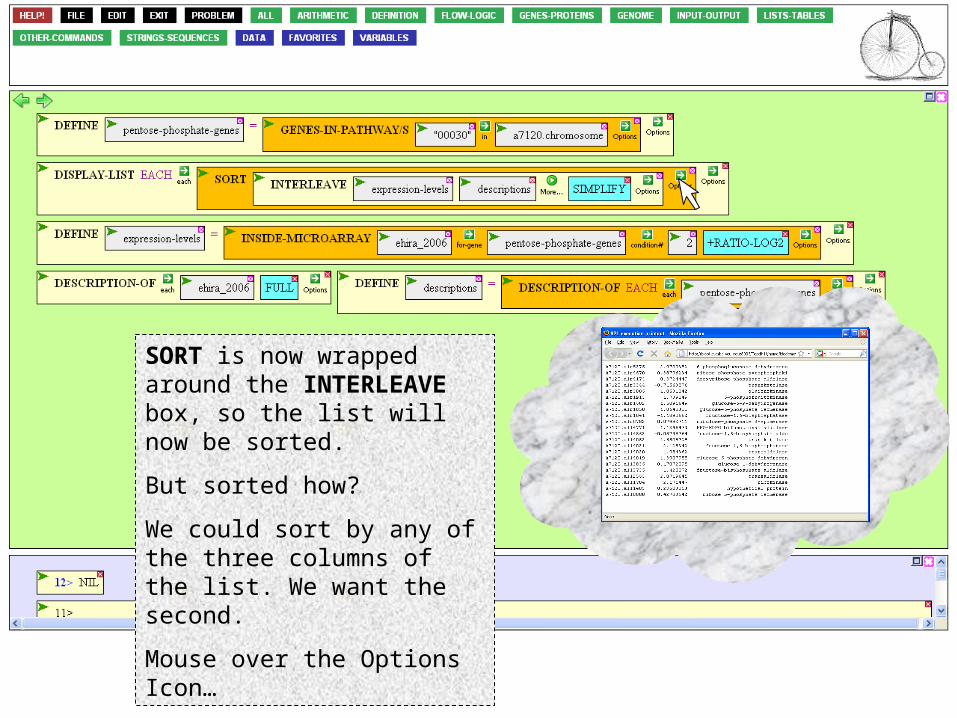
SORT is now wrapped around the INTERLEAVE box, so the list will now be sorted.
But sorted how?
SORT is now wrapped around the INTERLEAVE box, so the list will now be sorted.
But sorted how?
We could sort by any of the three columns of the list. We want the second.
Mouse over the Options Icon…

…and click BY-POSITION…

…select the value box…

…and enter 2, for the 2nd column.
Now execute.

Much better! We can readily identify those genes of the pentose phosphate pathway that are up-regulated by nitrogen-starvation.
What about the genes of carbon fixation?

The steps are the same as before… we’ll fast-forward to the result.

Metabolic correlates to N-deprivationWhat enzymes of carbon metabolism are affected by N-starvation?
Putting the expression results for the three pathways together...
PentosePhosphatePathway
Carbon fixation
Glycogenmetabolism

Metabolic correlates to N-deprivationWhat enzymes of carbon metabolism are affected by N-starvation?
We can see that the portion of the pentose phosphate pathway shared with carbon fixation is repressed (from a high level) by nitrogen starvation while the remainder is induced (from a low level).
PentosePhosphatePathway
Carbon fixation
Glycogenmetabolism
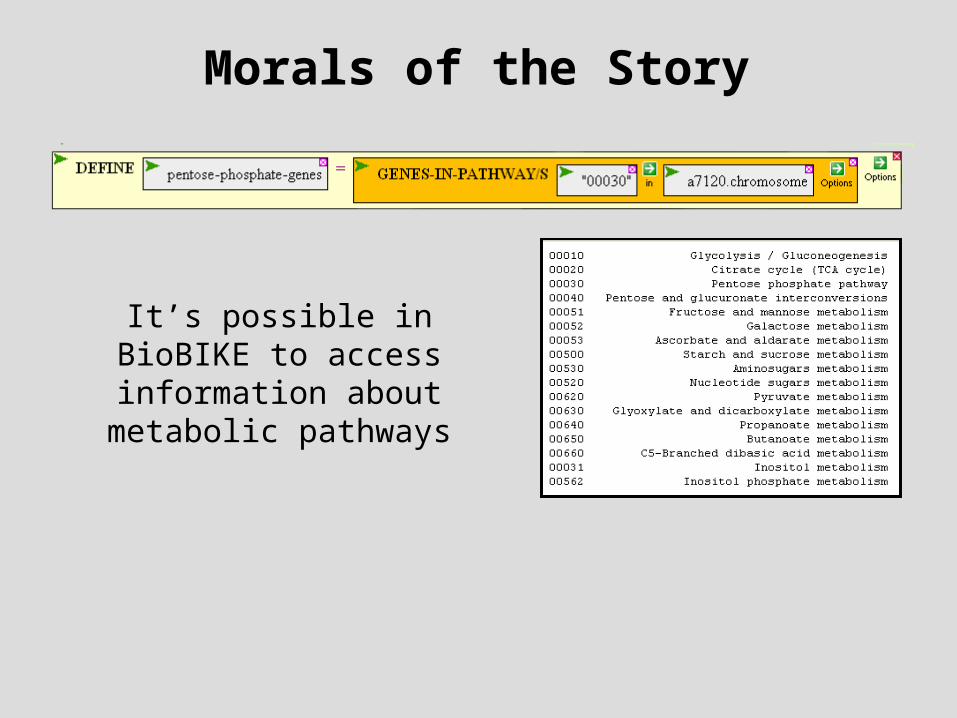
Morals of the Story
It’s possible in BioBIKE to access information about
metabolic pathways

Morals of the Story
It’s possible in BioBIKE to combine this information with
microarray data

Morals of the Story
No tool ever does exactly what you want

Morals of the Story
No tool ever does exactly what you want
In BioBIKE it’s possible to make your own tools.
Users can package useful operations like the one shown above into one-word functions and simplify their own personal language. Functions that are particularly useful may be incorporated into the general language.

Morals of the Story
And in fact, the language WAS changed to make the
process simpler.
The same result may now be obtained as shown below

CollaboratorsJohnny Casey (Sequoia Cons.) Sarah CousinsJeff Elhai (VCU)Sahel FarhangiMichiko Kato (now UC Davis)JP Massar (Berkeley)James Mastros (now Philip Morris) Bogdan Mihai (VCU)John Myers (Sequoia Cons.)Nihar Sheth (VCU)Jeff Shrager (CollabRx)Mark SlupeskyArnaud Taton (VCU)Hien Truong (VCU)Andy Whittam (Washington & Jefferson)
Development of BioBIKE was funded by grant DBI-0516378 from the National Science FoundationContact Jeff Elhai, Center for the Study of Biological Complexity, Virginia Commonwealth
University (E-mail) [email protected], (Tel) 804-828-0794