combining multi-dimensional scaling and cluster analysis ... · combining multi-dimensional scaling...
TRANSCRIPT

Expl Agric (2014) volume 50 (3) pp 376ndash397 Ccopy Cambridge University Press 2013
doi101017S0014479713000495
COMBINING MULTI-DIMENSIONAL SCALING ANDCLUSTER ANALYSIS TO DESCRIBE THE
DIVERSITY OF RURAL HOUSEHOLDS
By G C PACINIdaggerDagger D COLUCCIsect F BAUDRONparadaggerdagger E RIGHIdaggerM CORBEELSdaggerdagger P TITTONELLdaggerdaggerDaggerDagger and F M STEFANINIsectsect
daggerDepartment of Agrifood Production and Environmental Sciences University of Florence Firenze
Italy sectDepartment of Mathematics for Decisions University of Florence Firenze Italy
paraCIMMYT (International Maize and Wheat Improvement Center) Addis Ababa Ethiopia
daggerdaggerUPR Annual Cropping Systems Centre de Coopeacuteration Internationale en Recherche Agronomique
pour le Deacuteveloppement (CIRAD) Cedex France DaggerDaggerFarming Systems Ecology Wageningen
University Wageningen The Netherlands and sectsectDepartment of Statistics University of Florence
Firenze Italy
(Accepted 1 July 2013 First published online 7 August 2013)
SUMMARY
Capturing agricultural heterogeneity through the analysis of farm typologies is key with regard to thedesign of sustainable policies and to the adoptability of new technologies An optimal balance needs tobe found between on the one hand the requirement to consider local stakeholder and expert knowledgefor typology identification and on the other hand the need to identify typologies that transcend the localboundaries of single studies and can be used for comparisons In this paper we propose a method thatsupports expert-driven identification of farm typologies while at the same time keeping the characteristicsof objectivity and reproducibility of statistical tools The method uses a range of multivariate analysistechniques and it is based on a protocol that favours the use of stakeholder and expert knowledge in theprocess of typology identification by means of visualization of farm groups and relevant statistics Resultsof two studies in Zimbabwe and Kenya are shown Findings obtained with the method proposed arecontrasted with those obtained through a parametric method based on latent class analysis The methodis compared to alternative approaches with regard to stakeholder-orientation and statistical reliability
I N T RO D U C T I O N
Motivation
Understanding farm diversity in its multiple dimensions is decisive in the design ofsound agricultural policies (Ruben and Pender 2004) and in assessing the suitabilityof technological innovation to improve agricultural production (Giller et al 2011Tittonell et al 2010) Diversity of livelihoods and farmersrsquo strategies is one of thebackbones of sustainability as it is through diverse farm livelihoods that greaterresilience against stresses and shocks may be ensured (Block and Webb 2001 Ellis2000 Tesfaye et al 2004) At regional level sustainability targets call for a holisticperspective taking into account the whole range of farmersrsquo responses
DaggerCorresponding author Email gaiocesarepaciniunifiit
httpwwwcambridgeorgcoreterms httpdxdoiorg101017S0014479713000495Downloaded from httpwwwcambridgeorgcore Open University Libraryy on 22 Dec 2016 at 180450 subject to the Cambridge Core terms of use available at
Typology of rural households 377
Researchers have used farm typologies to support their studies with various aimssuch as building econometric models to predict farm structural change (Zimmermannet al 2009) selecting case study farms for detailed analyses and modelling (Tittonellet al 2005 2009) scaling-up of field and farm-level model results at regional level(Righi et al 2011b) prototyping crop management systems (Blazy et al 2009)analysing agricultural trajectories (Iraizoz et al 2007) conceptual investigation inrural sociology (van der Ploeg et al 2009) and predicting household behaviour inwealth-based studies (Paumgarten and Shackleton 2009)
In these cases a major challenge of typology identification typically consistsin the large variability of farm production systems socio-economic circumstancesand biophysical conditions which are distinctive of the agricultural sector Besidesproduction and biophysical variables there are a variety of other factors at the root offarm diversity including household composition technology and remittance incomeVariable selection is a fundamental step in the process of farm data analysis since itcan highly affect the resulting typology The purpose for which the typology is beingcreated should drive such process and only the factors that have a proven impact onthe relevant structural diversity should be selected To this end it is often beneficialand sometimes imperative to include local expert knowledge in the process of typologyidentification
Considering that local expert knowledge is strongly contextual can objectivereplicability be made compatible with the need to take local knowledge and contextsin due consideration On the opposite end the use of sophisticated statistical analysismay yield proper farm classifications but remain opaque to many stakeholders involvedin the process of dealing with farm diversity How can the results of statistical analysesbe made easily readable for different stakeholders (including other researchers) dealingwith the agricultural sectorrsquos extreme diversity
The present paper attempts to address such questions by adopting a number ofwell-established multivariate techniques and combining them in a way that favours theintegration of expert knowledge and communication to a vast range of stakeholdersWe provide an application of this method to a sample of farms located in the mid-Zambezi Valley Zimbabwe as the starting point of a research for developmentintervention aimed at designing alternative sustainable farming strategies
Background and objectives
Methods for farm or household typology identification include (i) conceptualcategorization based on economic data (eg the farm typology relying on the Europeanfarm accountancy data network Decision 85377EEC 1985) on economic andenvironmental criteria (Andersen et al 2007) on socio-economic knowledge (Laurentet al 1998 van der Ploeg et al 2009) on a combination of socio-economic and agro-ecological aspects with production objectives (Tittonell et al 2005) or on iterativeabstractions based on contextualized reading of qualitative and quantitative data(Madsen and Adriansen 2004) (ii) Statistical non-parametric multivariate analysis(MVA) such as principal component analysis (PCA) multiple correspondence analysis
httpwwwcambridgeorgcoreterms httpdxdoiorg101017S0014479713000495Downloaded from httpwwwcambridgeorgcore Open University Libraryy on 22 Dec 2016 at 180450 subject to the Cambridge Core terms of use available at
378 G C PA C I N I et al
cluster analysis (CA) and factor analysis (Blazy et al 2009 Gaspar et al 2008 Iraizozet al 2007 Solano et al 2001) (iii) MVA techniques with parametric distributionalassumptions such as the mixture-of-distribution technique (Kostov and McErlean2006) (iv) Participatory techniques such as wealth ranking and focus groups (Adamset al 1997 Zingore et al 2007) in some cases corroborated by MVA techniques (egPaumgarten and Shackleton 2009 Tittonell et al 2010)
Each approach to farm typology identification has strengths and weaknessesQuantitative identification and characterization methods based on multivariatedescriptors are sometimes preferred to a priori approaches based on expert knowledgedue to the objective replicability built in their statistical foundations and to thepossibility of making an efficient use of information (Iraizoz et al 2007) Coherentlywith such considerations on reproducibility and efficiency the methods used in thisstudy are based on MVA techniques in particular non-parametric techniques Webelieve that as compared to parametric approaches non-parametric techniques holda strong potential for facilitating the communication of results to non-technical end-users Such potential for communicability of results is only partially addressed byMVA non-parametric studies in the literature (Blazy et al 2009) In these studies datareduction plays a key role first the original database is typically transformed by eitherPCA multiple correspondence or factor analysis (or a combination of those) in orderto select a smaller group of uncorrelated scores then CA is applied for farm groupingHowever the use of factors or components from PCA multiple correspondence andfactor analysis to define the clusters makes it hard for non-technical stakeholders tounderstand what variables are principally responsible for the classification Studieson typology identification are generally deficient in this sense even if the problem istechnically addressed by studying the weighting of correlations of the variables withthe principal components (see eg Gaspar et al 2008) In many of these studies thedata obtained and especially the knowledge of the context where data were collectedare often reduced in order to function as inputs in statistical measures (Madsen andAdriansen 2004) so as to sometimes appear research-driven rather than problem-driven imposing (especially those relying on CA) predetermined categories onreality
The objectives of the present paper are (a) to present an application of multi-dimensional scaling (MDS) in combination with cluster analysis for farm typologyidentification (b) to evaluate the statistical reliability of the method as compared to aparametric method based on a mixture model using latent class analysis along the linesof Kostov and McErlean (2006) (c) to compare the results of our approach with thoseof conceptual categorization and participatory methods and (d) to discuss relevantstrengths and weaknesses of the method The method outlined in the present paperwas elaborated and applied during two EU projects in Africa and Latin America witha total of 18 studies in 11 countries For the sake of simplicity the method will bepresented and discussed in detail with reference to the application to a study area innorth Zimbabwe selected results will be shown for another area in western Kenya butthe general conclusions drawn about the method are borne out by evidence stemmingfrom the whole set of applications
httpwwwcambridgeorgcoreterms httpdxdoiorg101017S0014479713000495Downloaded from httpwwwcambridgeorgcore Open University Libraryy on 22 Dec 2016 at 180450 subject to the Cambridge Core terms of use available at
Typology of rural households 379
M AT E R I A L S A N D M E T H O D
The study sites
The main steps of the method are illustrated in detail with reference to data onhousehold characteristics from the Dande Communal Land an area located in themid-Zambezi Valley northern Zimbabwe Communal Lands are state lands usedfor small-scale farming and residential purposes in accordance with local traditionalauthority andor the local rural district council regulations The Dande CommunalLand is characterized by former floodplains of the Zambezi river basin at an averagealtitude of 400 m above sea level It has a dry tropical climate with low and veryvariable annual rainfall (on average between 450 and 650 mmyear) and a meanannual temperature of 25 C Two seasons are clearly defined a rainy season fromDecember to March and a long dry season from April to November Settlements arefound predominantly along the main rivers and the major activity is dryland farmingof cotton maize and sorghum (Baudron et al 2011)
The mid-Zambezi Valley is an area of global importance for its biodiversity whichis hosted in a network of protected areas (eg national parks safari areas) as well as inpatches of the communal land Rapid and extensive land-use and land-cover changeshowever are threatening this biodiversity Such changes are driven by immigrationand by changes in farming systems notably the expansion of plough-based agricultureand cotton farming Different farming systems affect the environment differently Thepurpose of constructing a typology in the mid-Zambezi Valley was to develop arecommendation domain for the design of innovative sustainable farming systemshighly productive while having a limited impact on the environment (in terms of areaused for cropping erosion pollution by biocides etc)
To compare the combined application of MDS and cluster analysis with conceptualcategorization and participatory methods selected applications of the method are alsopresented for a typology of smallholder subsistence-oriented mixed farming systemsfrom western Kenya which was previously developed based on participatory methodsand conceptual categorizations (Tittonell et al 2005)
Method
The method involves the following steps (i) data collection (ii) selection of variablesfor farm groupings (iii) identification of farm groups and (iv) characterization ofrepresentative farms and farm typology In this section the method is presented indetail Concerning steps (iii) and (iv) the present method has been adapted from amethodology developed at the Plymouth Marine Laboratory for the analysis of changein marine communities (Clarke and Warwick 2001) The non-parametric MVAs inthis study were performed with the software PRIMER 6 (Clark and Gorley 2006)
Data collection The identification of the farm sample was the first important stepof the analysis The sample should be representative of the diversity of farms inthe area Depending on the characteristics of the farms the sampling frame canbe based on stratification random selection or transects with exclusion rules In
httpwwwcambridgeorgcoreterms httpdxdoiorg101017S0014479713000495Downloaded from httpwwwcambridgeorgcore Open University Libraryy on 22 Dec 2016 at 180450 subject to the Cambridge Core terms of use available at
380 G C PA C I N I et al
the case of Zimbabwe data were collected from 176 farms on a transect followingan intensification gradient (ie increasing human density cattle density and cottonproduction along that transect) of about 40 km oriented north-westndashwestsouth-eastndasheast (Baudron et al 2011) Along this gradient wildlife population and tsetsepopulation decrease whilst human and livestock population total cultivated surfaceand surface under cotton increase Variables included in the farm surveys were selectedby experts with an intimate knowledge of local farming systems
Selection of variables for farm groupings from classification to key variables The selection of thevariables for the farm groupings was performed in two successive steps First a list ofclassification variables was developed based on expert knowledge and data availabilitytaking into account the structure of the farming system and giving importance tothe main sources of variabilitydiversity among the farms Variables related to farmresources availability and management were chosen by experts and were consideredas the starting point to design alternative more sustainable farm strategies which wasthe ultimate goal of the farm typology identification
Quantitative as well as qualitative variables were included in the databaseQualitative variables are ordinal variables whose scores reproduce increasing levels ofquality In a second step different sets of key variables were defined by reducingthe number of classification variables with the aim of obtaining a meaningfuldifferentiation of the farm samples for the purpose of delineating a typology Theselection of the final set of key variables was carried out based on expert knowledgesupported by the use of PCA to identify highly correlated variables
Identification of farm groups All key variables were standardized as percentages toavoid the influence of different levels of variation due to the unit of measurementThe similarity matrix which shows the degree of resemblance between each pair ofobjects (farms in our case) was then calculated We used the BrayndashCurtis distance(a non-metric coefficient particularly common in ecology) for the quantitative andqualitative standardized variables (Bray and Curtis 1957) and the Jaccard similaritycoefficient for the binary variables (presenceabsence variables in our case) defined asthe size of the intersection divided by the size of the union of the sample sets (Jaccard1901)
Usually the availability of different types of variables (qualitative quantitativeand binary) is dealt with using data-reduction techniques such as PCA multiplecorrespondence or factor analysis (eg Blazy et al 2009 Gaspar et al 2008 Iraizozet al 2007 Solano et al 2001 Tittonell et al 2010) In this paper instead we decidedto rule out any such database reduction prior to the application of MVA techniqueson the grounds that presenting the results of the classification of farms in the formof the original variables (standardized by percentage) would be more meaningful forMVA non-practitioners
Alternatively the joint processing of quali-quantitative and binary variables couldbe achieved for example by using the general similarity coefficient of Gower (1971)or by combining the use of the BrayndashCurtis coefficient for quali-quantitative variables
httpwwwcambridgeorgcoreterms httpdxdoiorg101017S0014479713000495Downloaded from httpwwwcambridgeorgcore Open University Libraryy on 22 Dec 2016 at 180450 subject to the Cambridge Core terms of use available at
Typology of rural households 381
and the SorensenndashDice coefficient for presence or absence variables (Dice 1945Soslashrensen 1957) Instead we decided not to combine datasets in such a manner andwe chose to use the Jaccard coefficient for its straightforward logic of lsquosimple matchingrsquosimilarity only adjusted by removing those variables which are jointly absent from allsample units
The coefficients of the similarity matrix were used as inputs for the MVAswhich we carried out sequentially First we concentrated on the qualitative andquantitative variables computing the BrayndashCurtis coefficients and thus formingthe main groupings of farms Then we turned to the presenceabsence variablescomputing the Jaccard coefficient conditional on belonging to each group to checkwhether we could identify meaningful subgroups We relegated the binary variablesto such ancillary role because our analyses showed that their information content wasmodest and that they had no capacity of generating reasonable groupings of farms ontheir own
Farm groups were generated by using a combination of the results of MDS andCA Non-metric MDS (Kruskal 1964 Kruskal and Wish 1978) was performedwith graphical representation in two- dimensional plots MDS was used to constructa plot of the samples in a specified number of dimensions (normally two or three)which attempts to satisfy all the conditions imposed by the similarity matrix in terms ofresemblance between each sample pair The non-metric MDS algorithm is an iterativeprocedure constructing the MDS plot by successively relocating the points (samples)until their positions satisfy as closely as possible the dissimilarity relations betweensamples Relocation of sample points is done by regressing the interpoint distances fromthis plot on the corresponding dissimilarities The MDS plot is interpreted in termsof the relative distances between samples since similarities are the only informationused by non-metric MDS ordination There is normally some distortion in the plotthat is minimized by the MDS algorithm which is captured by the stress value Thestress value is a goodness-of-fit measure depending on the difference between thedistances of each couple of sample points on the MDS plot and the distance predictedfrom the fitted regression line corresponding to coefficients of dissimilarities If suchdifference is equal to zero the stress is zero Instead widely scattered points clearlylead to a large stress and this can be interpreted as measuring the difficulty involvedin compressing the sample relationships into two (or a small number of) dimensions(Clarke and Warwick 2001)
Agglomerative hierarchical clustering was used to group the farm samples accordingto the group average link method (Clarke and Warwick 2001 Field et al 1982) Groupsof farms were identified by the superimposition of the clusters on the MDS plot at achosen similarity level which is a graphical facility of PRIMER Such choice whichdetermines the number of clusters was handled with a heuristic procedure througha subjective inspection of the CA dendrogram (Kobrich et al 2003) and supported bylsquoanalysis of similaritiesrsquo statistics (ANOSIM Clarke 1993)
The most representative farm groups in terms of number of farm samples includedwere selected for farm typology characterization The choice of how to assemblegroups at different similarity levels was statistically supported by ANOSIM which is
httpwwwcambridgeorgcoreterms httpdxdoiorg101017S0014479713000495Downloaded from httpwwwcambridgeorgcore Open University Libraryy on 22 Dec 2016 at 180450 subject to the Cambridge Core terms of use available at
382 G C PA C I N I et al
used to measure the dissimilarities within the groups and guided by experts who gaveindications on the most plausible number of groups The ANOSIM tests operate onthe similarity matrix and constitute an approximate analogue of the standard analysisof variance tests ANOSIM compares pairs of clusters on the basis of similaritiesbetween samples It computes a statistical test (R) that lies in the interval (minus11) andis a comparative measure of the degree of separation of the groups The R statisticis equal to 1 only if all samples within a group are more similar to each other thanany sample from different groups and is approximately zero if the similarities betweenand within groups are on average the same A significance level is then calculated byreferring the observed value of R to its permutation distribution (Clarke and Warwick2001) However ANOSIM is not a valid test of differences between groups generatedby CA or other methods starting from the similarity matrix and should be applied totest the differences between groups defined a priori by an independent classificationscheme (Clarke and Gorley 2006) We used ANOSIM in an explorative way to evaluateand compare the differences between the groups identified in order to support theselection of the most representative farm types in combination with MDS plot andexpert knowledge
Characterization of representative farms and farm typology The last step of the methodologywas the similarity percentages (SIMPER) analysis of the farm groups (Clarke 1993)SIMPER analysis concentrates on BrayndashCurtis similarities between samples andhighlights the variables principally responsible for determining the sample groups inthe cluster or ordination analyses The SIMPER algorithm first computes the averagesimilarity between all pairs of sample units within a group and then disaggregates thisaverage into separate contributions from each variable The variables whose valuesare all equal to zero within a group although equal do not give any contribution to thewithin-group similarity The rate between within-group similarity and each variablersquosstandard deviation holds a strong characterization power if the variable values arerelatively constant within a group so that standard deviation of its contribution is lowand the ratio between within-group similarity and standard deviation is high
The average and modal variable values of the most representative farm groupswere used to describe the farming structure using farm types In this way the resourceendowment of each farm type was summarized by a virtual farm characterized by theaverage values of the whole group The variables that provide the highest contributionsto form the clusters according to SIMPER analysis were emphasized to characterizethe farm types
Further in order to represent the farm population in a more realistic way severalrepresentative farms were selected among the farm sample units The process ofselection of representative farms is straightforward as farms with average and modalvalues of the selected variables are placed in the middle of the farm groupingsin the MDS plot Whether virtual farms are able to realistically portray the farmtypes depends on specific features of each group and can be assessed by consideringthe relative differences of virtual and representative farms variables as well as byassessing such differences with the support of SIMPER statistics eg by giving greater
httpwwwcambridgeorgcoreterms httpdxdoiorg101017S0014479713000495Downloaded from httpwwwcambridgeorgcore Open University Libraryy on 22 Dec 2016 at 180450 subject to the Cambridge Core terms of use available at
Typology of rural households 383
importance to virtual versus representative similarities for those variables with highercontribution to within-group similarity and with higher ratio between within-groupsimilarity and standard deviation Such assessment was carried out by local experts
On the other hand the number of farm types chosen by local experts as supportedby ANOSIM results was refined after the SIMPER analysis by adding a constraintallowing for a minimum of 50 of within-group similarity The latter constraint wasposed in order to warrant that on average farms belonging to one type be rathersimilar than dissimilar to each other given the key variables selected (Kobrich et al2003)
Comparison with latent-class-based classification
In order to evaluate the reliability of the method described above we consideredan explicitly parametric method based on latent class analysis inspired by Kostov andMcErlean (2006) Using the same set of variables of the mid-Zambezi Valley datasetas described above we employed the mixed-mode latent class regression (mmlcr)package under R (R Development Core Team 2009) This package was selectedbecause it can handle different classes of distributions for the variables (which canbe both quantitative ndash either continuous or discrete ndash and categorical) Indeed thedatabase of mid-Zambezi Valley contemplates such heterogeneity as can be inferredfrom Figure 1 The package is built around the Expectation Maximization algorithmof Dempster et al (1977)
The procedure basically entails estimating a mixture model which gives for eachfarm the probability of belonging to each of a (predetermined) number of latentclasses With regard to the assumptions about the (marginal) distributions which needto be assigned explicitly to each variable the variables recording the number of adultshaving off-farm employment (lsquoofffarmrsquo) and the index of land preparation (lsquolandpreprsquo)were coded as multinomial whereas all the remaining variables were coded as negativebinomial1 We estimated models with three four five and six classes For each classsize we ran 200 independent estimations each characterized by different randomlyselected initial conditions and generating a potentially different model The models canbe judged through the usual score functions namely the Akaike Information Criterion(AIC) and the Bayes Information Criterion (BIC) For the best fitting models accordingto AIC and BIC we also computed the consistency of the resulting groups with thetypology constructed non-parametrically with CA and MDS in the following way Fora given number of classes (3 to 6) the algorithm returns a vector of probabilities foreach farm we then used the highest probability to identify the class membership for
1The variable landprep in particular took values in the interval [0 2] with significant frequencies on the integers andother sparse values between 0 and 1 and between 1 and 2 Therefore it was discretized into five classes correspondingto the values of 0 between 0 and 1 1 between 1 and 2 2 The limitations of the R package mmlcr which modelscontinuous variables within the Gaussian family only urged us to use the Negative Binomial family for the continuousas well as for the discrete variables indeed the two variables that were essentially continuous namely cotton land(cot) and cultivated land (cult) had empirical distributions (see Figure 1) for which discretizing and using the NegativeBinomial (whose two parameters can be adjusted to cover skewed cases) seemed more appropriate than imposingnormality
httpwwwcambridgeorgcoreterms httpdxdoiorg101017S0014479713000495Downloaded from httpwwwcambridgeorgcore Open University Libraryy on 22 Dec 2016 at 180450 subject to the Cambridge Core terms of use available at
384 G C PA C I N I et al
Figure 1 Distributions of selected variables of the dataset of the mid-Zambezi Valley Zimbabwe Legend casualadults working sometimes as casual workers (no) cot cotton land (ha) cult cultivated land (ha) draft draft animals(no of adult cattle + donkeys) fert inorganic fertilizers and manure applications for cotton maize and sorghum (no)foodaid food mainly produced andor purchased (presenceabsence) hh household members (no) hirelab hiredlabour (presenceabsence) landprep land preparation (index) migrant migrant settlers (presenceabsence) offfarm
adults having off-farm employment (no) rum small ruminants (no) workers adults working (no)
each farm (this is known as the lsquomaximum a posteriorirsquo principle) We then consideredthe best possible match between the groups of farms constructed with this methodand with CA and MDS computing the fraction of farms belonging to correspondinggroups
Comparison with conceptual categorization and participatory methods
Using the same set of variables of three farm samples in western Kenya as inTittonell et al (2005) we applied the method based on CA and MDS as presentedin the previous section In Tittonell et al (2005) an initial approach to classify farmssolely based on wealth ranking led to the identification of three farm types but itresulted in poor discrimination of resource allocation patterns Adding informationon production goals the main types of constraints faced by the household position in
httpwwwcambridgeorgcoreterms httpdxdoiorg101017S0014479713000495Downloaded from httpwwwcambridgeorgcore Open University Libraryy on 22 Dec 2016 at 180450 subject to the Cambridge Core terms of use available at
Typology of rural households 385
the farm developmental cycle and main source of income improved the discriminationof farm types Here we compare the results obtained with MDS in combination withCA reported through the corresponding plot with the typology identified by Tittonellet al (2005)
R E S U LT S
Application of the method in the mid-Zambezi Valley
Data collection Three transects oriented along the intensification gradient weresampled and 176 farms were sampled along the gradient Every household that hadat least one cultivated field on one of the transects was sampled Heads of selectedhouseholds were interviewed on 75 variables including location of the farm (GPSpoint) age of the head composition of the household (including number of peopleworking as casual workers for other farmers and number of external people hired)number of implements (plough wheelbarrow etc) areas cultivated in different cropsplanting dates for these crops use of fertilizers and manure mode of land preparationmode of weeding livestock number (disaggregated by species) destruction by wildlife
Selection of variables for farm groupings Selected classification variables are reportedin Figure 1 together with corresponding histograms showing empirical distributionsFrom the initial complete list of 75 classification variables 13 key variables wereselected three of which were presenceabsence variables and the other 10 were quali-quantitative Some key variables were calculated by condensing information from twoor more classification variables this was the case of the farm-level number of fertilizerapplications and the farm-level land preparation index which were calculated as themean value of the number of fertilizer applications for the different crops weighed bytheir surface area and as the mean value of the land preparation index for the differentcrops weighed by their surface area respectively For each crop the land preparationindex value was set to zero when no tillage was used (ie digging of shallow plantingholes by hand-hoe without previous land preparation) one when minimum tillagewas used (ie opening of a furrow without soil inversion) and two when ploughing wasused (ie land preparation with soil inversion)
Identification of farm groups Figure 2 shows the two-dimensional MDS plot Therelative distances of one sample to another represent between-sample similarities Thestress value of the representation is 019 According to Clarke and Warwick (2001)a stress value between 01 and 02 gives a potentially useful two-dimensional picturethough for values at the upper end of the range a cross check of the groupings shouldbe made by superimposing CA groups of farms
Using a cut-off value of 50 for within-group similarity for CA five groups of farmswere identified (Figure 3) The classification in five groups was favourably evaluatedby local experts
In Figure 2 the clusters are superimposed on the MDS plot While the levelof determination of membership of each farm sample to one of the five groups
httpwwwcambridgeorgcoreterms httpdxdoiorg101017S0014479713000495Downloaded from httpwwwcambridgeorgcore Open University Libraryy on 22 Dec 2016 at 180450 subject to the Cambridge Core terms of use available at
386 G C PA C I N I et al
Figure 2 (Colour online) Superimposition of cluster groupings on the multi-dimensional scaling plot representingthe farm sample of the mid-Zambezi Valley Zimbabwe The stress value of the representation is 019 Results wereobtained after standardization by percentage of the variables and calculation of a similarity matrix based on the
BrayndashCurtis coefficient
Figure 3 Cluster dendrogram grouping the sample farms of the mid-Zambezi Valley Zimbabwe Results wereobtained after standardization by percentage of the variables and calculation of a similarity matrix based on the
BrayndashCurtis coefficient Five groupings were identified at 50 of within-group similarity
httpwwwcambridgeorgcoreterms httpdxdoiorg101017S0014479713000495Downloaded from httpwwwcambridgeorgcore Open University Libraryy on 22 Dec 2016 at 180450 subject to the Cambridge Core terms of use available at
Typology of rural households 387
Table 1 Results from analysis of similarity (ANOSIM) of farm groupsof the farm sample of the mid-Zambezi Valley Zimbabwe
Global test
Complete dataset global Rlowast = 0809 (significant at p = 0001)Pairwise tests (Rlowast values significant at p = 0001)
Farm group A B C D E
A ndashB 0996 ndashC 0981 0777 ndashD 0902 1000 1000 ndashE 0799 0818 0711 0591 ndash
lowastTest statistic comparatively measuring the degree of separation of thegroups
is made possible at higher detail thanks to the superimposition of clusters inter-relations between the samples on a continuous scale are displayed thanks to the MDSconfiguration on the plot Clusters are not imposed because the continuum of changeis visible on the MDS plot Besides farms representative of the group and of boundaryconditions can be easily identified and selected for further study or scaling-up of resultsby choosing farm samples at the centre and on the borders of the groups respectively
Some farms were positioned in the overlapping space between two differentgroupings when MDS and CA were combined their attribution to groups wasambiguous (Figure 2) Allocating each farm to a single group (including those inthe intersections) would be possible by checking their single membership on the CAdendrogram However it can be the case that in real-world conditions single farmshold intermediate characteristics between different groups these farms representboundary conditions of groups and as such they were considered in our study A furtherscrutiny was carried out on single groups based on dissimilarities of presenceabsencevariables calculated with the Jaccard coefficient However this analysis did not produceadditional results in terms of identification of sub-groups perhaps because of the lownumber of farm samples compared to the poor information content of binary variables
Table 1 reports the results of ANOSIM The R statistics of each couple of identifiedgroups is strongly significant for almost all of the group combinations with lower butstill significant dissimilarities between the couples CndashE (R = 0711) and EndashD (R =0591) Overall the ANOSIM confirmed the groups obtained in the preceding steps
Characterization of representative farms and farm typology In Table 2 group averageaverage similarities single and cumulative contribution to within-group similarity ofeach variable per group are reported for the mid-Zambezi Valley farm dataset Thefirst column can be used to support the selection of a representative farm amongthe farm samples as indicated by the average values of variables Farm samples closeto the centre of the groups in the MDS plot (Figure 2) hold values that are closeto group averages Such farms can be used as pilot (group representative) farms for
httpwwwcambridgeorgcoreterms httpdxdoiorg101017S0014479713000495Downloaded from httpwwwcambridgeorgcore Open University Libraryy on 22 Dec 2016 at 180450 subject to the Cambridge Core terms of use available at
388 G C PA C I N I et al
Table 2 Results of similarity percentage (SIMPER) analysis for the farm sample of the mid-Zambezi ValleyZimbabwe (farm group average similarities A = 689 B = 62 9 C = 682 D = 703 E = 603)
Average Average Contribution to CumulativeVariable mode similarity group similarity () contribution ()
Farm group AOff-farm (no of adults) 10 438 635 635Workers (no of adults) 28 56 81 716hh (no of members) 58 52 76 792Cult (ha) 75 41 60 852Cot (ha) 36 29 42 894Rum (no of ruminants) 46 23 34 927Landprep (index) 05 17 24 951Casual (no of adults) 07 13 18 970Fert (no of applications) 05 11 16 986Draft (no of adult cattle and donkeys) 20 10 14 1000
Farm group BWorkers (no of adults) 20 199 316 316hh (no of members) 44 194 308 624Cult (ha) 47 160 254 878Cot (ha) 15 52 82 960Rum (no of ruminants) 14 25 40 1000
Farm group CCasual (no of adults) 18 286 419 419Workers (no of adults) 23 138 203 622hh (no of members) 56 137 201 824Cult (ha) 44 73 107 931Rum (no of ruminants) 17 23 34 965Cot (ha) 13 23 33 998Landprep (index) 01 01 02 1000Draft (no of adult cattle and donkeys) 01 00 00 1000
Farm group DDraft (no of adult cattle and donkeys) 169 174 248 248Fert (no of applications) 21 133 189 437Cot (ha) 180 93 133 569Cult (ha) 263 77 109 679Rum (no of ruminants) 131 75 107 785Landprep (index) 14 54 77 862hh (no of members) 116 49 70 932Workers (no of adults) 59 48 68 1000
Farm group ELandprep (index) 12 141 234 234Cult (ha) 98 84 140 374Cot (ha) 55 84 138 513hh (no of members) 62 78 129 641Workers (no of adults) 29 75 124 766Rum (no of ruminants) 45 46 75 841Draft (no of adult cattle and donkeys) 25 41 68 909Fert (no of applications) 06 29 49 958Casual (no of adults) 08 26 42 1000
detailed analyses Furthermore lsquovirtualrsquo farms can be constructed based on averagesof variables retrieved from SIMPER analysis or in case of qualitative class variables oncorresponding modal values Local experts identified five types of farms correspondingto the above identified groups (a) farms receiving off-farm income and using (some
httpwwwcambridgeorgcoreterms httpdxdoiorg101017S0014479713000495Downloaded from httpwwwcambridgeorgcore Open University Libraryy on 22 Dec 2016 at 180450 subject to the Cambridge Core terms of use available at
Typology of rural households 389
sort of) animal draught power (b) hand-hoe-based farms with family labour (c) hand-hoe-based farms selling out a large part of their labour (casual work for other farms) (d)large commercial enterprises mainly cotton-based using large quantities of fertilizersand manure and (e) farms using animal draught power and farming large cotton areas
This typology reveals the paramount importance of powerlabour available atfarm level ndash both human powerlabour and animal draught power ndash in shaping thefarmsrsquo heterogeneity in the area which corresponds to findings of previous studies(Baudron et al 2011) Indeed Table 2 shows that variables related to labour andanimal draught power (also reflected in the index of land preparation) are the mainvariables contributing to the similarity of all the groups but farm group D Thisillustrates the fact that the area under study can be considered an agricultural frontierie that the farming systems are limited by mananimal power more than by land(Baudron et al 2011) It can also be observed from Figure 2 that farm groups A and Dform quite distinct clouds of points whilst farm groups C B and E overlap strongly Thecontinuum created by farm groups C B and D illustrates the typical farm developmentpathway observed in the area most farms start as a hand-hoe-based farms selling alarge proportion of their labour (farm group C) develop progressively into a hand-hoe-based farm investing most of its available labour on farm activity increasing itscultivated surface (particularly cotton) and investing in draught animals (farm group B)and later develop into a farm using animal draught power with bigger surface undercultivation (mostly cotton farm group D) However this typical development pathwayis inhibited in tsetse-infested areas as cattle a source of draught power cannot be keptCotton is the cash crop permitting wealth accumulation and increasing productioncapacity particularly in the form of purchase of draught animals and hiring of labour(Baudron et al 2011) Farm groups A and D form distinct clouds on the MDS plotwhich illustrates their functional differences the farming system represented by farmgroup A depends mostly on off-farm income (for hiring labour purchasing inputs andacquiring draught animals) whilst the farming system represented by farm group Drepresents large commercial enterprises which are very different from peasant farmsthat make up the other groups
Comparison with latent class analysis
The results obtained using latent class analysis are summarized in Table 3 withreference to four models corresponding to 3 4 5 and 6 farm groups AIC and BICvalues of the four models are reported together with the resultant rate of consistencywith the MDSCA typology
AIC-based ranking suggests N = 4 and N = 5 as the best choices (AIC valuesequal to 5944 and 5942 respectively) with N = 3 and N = 6 performing worse Thisobservation would support the evidence coming from the approach presented aboveand approved by experts Besides experts would reject any grouping with three classes(suggested by the BIC criterion) or less as corresponding groups would not lead to anyuseful typology due to low within-group similarity A six-class model seems to be theleast appropriate according to both criteria
httpwwwcambridgeorgcoreterms httpdxdoiorg101017S0014479713000495Downloaded from httpwwwcambridgeorgcore Open University Libraryy on 22 Dec 2016 at 180450 subject to the Cambridge Core terms of use available at
390 G C PA C I N I et al
Table 3 Summary statistics for latent class analysismodels of the dataset of the mid-Zambezi Valley
Zimbabwe various N
Nlowast = 3 N = 4 N = 5 N = 6
Rate 065 068 053 047AIC 5961 5944 5942 5949BIC 6333 6442 6566 6699
lowastNumber of classes
Consistency rates between latent class analysis and MDSCA are considerably highfor the N = 3 and N = 4 models (065 and 068 respectively) but decrease noticeablyfor the N = 5 and N = 6 models (053 and 047 respectively)
Comparison with expert-based and participatory methods
In Figure 4 a MDS plot representing the sample of western Kenya is reported wherefarms were labelled with symbols representing classes identified in a participatoryapproach (ie farmersrsquo self-ranking into wealth classes) The method producedfarm groups that were able to capture variation while keeping in evidence theactual continuum that may exist between and within the groups The distributionof wealth classes is well represented in the plot by a gradient of wealth withwealthier farms (wealth class 1) located at the bottom of the plot and farms withlow resource endowment at the top (wealth class 3) After excluding groups of farmscomposed by one or two individuals five main groups were identified at 92 ofwithin-group similarity by superimposing groups of farm individuals obtained fromthe corresponding cluster analysis dendrogram Again the composition of thesegroupings significantly matches the description of the five farm types obtained throughconceptual categorization in Tittonell et al (2005) Farm group 1 is composed mainlyof farms with high resource endowment (Wealth Class 1) and a few farms with mediumendowment but all of them with significant access to off-farm income (Wealth Class2 3 farms out of 13) Farm group 2 comprises farms with high endowment andgrowing cash crops (all but one) Farm group 3 has farms with medium endowmentmarketing food crops (all but one) Farm group 4 represents farms with mediumand low endowment practicing non-farm activities (and only 2 out of 16 belongto the wealthier class) and Farm group 5 is mainly composed of farms with lowendowment and working as casual workers for wealthier farmers (9 out of 12) Suchcategorization allows going beyond the structural classification by asset endowmenttowards a more functional typology of households that reveals livelihood strategies aswell
D I S C U S S I O N
The method has been implemented on two farm samples from African areasencompassing extensive land use with small-scale and diffuse settlement patternscharacterized by complex interactions between the socio-economic and biophysical
httpwwwcambridgeorgcoreterms httpdxdoiorg101017S0014479713000495Downloaded from httpwwwcambridgeorgcore Open University Libraryy on 22 Dec 2016 at 180450 subject to the Cambridge Core terms of use available at
Typology of rural households 391
Figure 4 (Colour online) Superimposition of wealth ranking classes on the multi-dimensional scaling plot of the farmsample of western Kenya The stress value of the representation is 006 Results were obtained after standardizationby percentage of the variables and calculation of a similarity matrix based on the BrayndashCurtis coefficient Fivemain groups were identified at 92 of within-group similarity by superimposing farm groupings obtained fromthe corresponding cluster analysis dendrogram Group compositions correspond to five types as identified with aconceptual categorization by Tittonell et al (2005 Table 3) Legend farm code letters location codes namely A
Aludeka E Emuhaia S Shinyalu
environments This application allowed us to assess the potential of the method itsstatistical reliability its pertinence vis-agrave-vis local rural livelihood strategies and itsstrength and weaknesses with regard to other methods as discussed below
The potential of MDS for typology delineation
Methodologies similar to the one we used have been applied for classification inthe field of ecology and biology (eg Catalaacuten et al 2006 Selleslagh and Amara 2008Stergiou et al 2006) but to the best of our knowledge they have never been used infarming systems analysis Besides the applications in Zimbabwe and Kenya presentedin this study the method has been applied to a total of 18 studies in 11 countries ofAfrica and Latin America with datasets ranging from ad hoc field surveys to structuredinformation from national statistical census (eg Righi et al 2011b for the case ofSouth Uruguay) The method has been shown to cope with such heterogeneity indata sources and to capture location-specific diversity in terms of farm structure (egin Righi et al 2011a for the case of South Patagonia)
The outcomes of the method in all the studies were validated by local expertsKobrich et al (2003) suggest that a good procedure to validate farm types is to contrastthem with (expert-based) existing hypotheses about their structure as well as withresearchersrsquo perception about the variety of farming systems that have been observedempirically Moreover they argue that for classes to be meaningful and useful theyhave to be related to the purposes for which they are being created therefore thefact that they serve the purposes for which they are intended provides the most
httpwwwcambridgeorgcoreterms httpdxdoiorg101017S0014479713000495Downloaded from httpwwwcambridgeorgcore Open University Libraryy on 22 Dec 2016 at 180450 subject to the Cambridge Core terms of use available at
392 G C PA C I N I et al
meaningful way of testing their conceptual validity In the case of mid-Zambezi Valleytwo experienced researchers from the area acted as experts They were supported bya number of researchers and technicians in group discussions assessed positively thefive-group classification and described the corresponding farm types coherent withthe purpose of the typology and previous studies (Baudron et al 2011)
Statistical reliability
Besides expert validation the reliability of the method was tested in comparison toa mixture model using latent class analysis along the lines of Kostov and McErlean(2006) Within this analysis the AIC criterion suggests N = 4 and N = 5 as optimalnumber of groups (with a slight preference for the five-group model) Concerning thesetwo class sizes the consistency rates of the (best fitting) estimates differ considerablyie 068 for N = 4 versus 053 for N = 5 being lower than the value of the classsize identified with MDSCA and favourably evaluated by experts (ie 5) The modelwith four groups also fares well with respect to the BIC criterion A farm typologyconsisting of four groups could also be obtained with MDSCA (results not shown) bymerging farm groups B and C of Figure 4 at a within-group similarity level of 52This alternative farm grouping could be considered for further analysis
MDS versus current methods relevance and robustness
In the case of western Kenya farm groupings obtained with MDS and CA matcheda classification based on wealth ranking and a conceptual categorization based onproduction goals main types of constraints faced position in the farm developmentcycle and main source of income (Figure 4) Our results however constituted animprovement in terms of objective reproducibility and of possibility of making efficientuse of information This is in line with what Iraizoz et al (2007) found regarding thedescriptive strength of MVA techniques Additional features of MVA techniques ascompared to expert-based classifications are the graphical visualization of farm typegroupings the possibility of selecting candidate representative farms for in-depthanalyses and the systematization of information through SIMPER analysis Indeedobjective reproducibility is one noteworthy improvement over qualitative participatorymethods such as wealth ranking According to Adams et al (1997) the sensitivity ofthe wealth ranking method to the number age and gender of key informants or tothe attributes of facilitators may jeopardize its reliability Other limitations of wealthranking are the inability to identifyquantify differences in specific dimensions ofhousehold wealth and in supporting meaningful cross-regional comparisons On theother hand the great strength of wealth ranking lies in its sensitivity to local contextsand its emphasis on local expertise (Chambers 1994)
Several features of our method have the potential to improve effectiveness ofstatistical analyses in the field of farm typology identification An example of sucha potential as compared to current methods is again given by the study in westernKenya where the typology based on wealth ranking and conceptual categorization wasfurther developed and extended to six sub-regions of East Africa (Tittonell et al 2010)
httpwwwcambridgeorgcoreterms httpdxdoiorg101017S0014479713000495Downloaded from httpwwwcambridgeorgcore Open University Libraryy on 22 Dec 2016 at 180450 subject to the Cambridge Core terms of use available at
Typology of rural households 393
PCA and CA were used to identify non-correlated variables and to group householdsin homogeneous classes However in Tittonell et al (2010) the clustering obtainedwas refined through reclassification of cases lying in fuzzy areas after examinationof corresponding variables which requires detailed field knowledge on the systemsbeing analysed This is one of the fields where the combined use of MDS and CAshown here could complement classical CA or qualitative approaches by representingthe farm sample as a continuum on an MDS plot where clusters are superimposedAlthough this represents a strength of the present approach we recommend its use ascomplementary rather than alternative to other methods
Towards a stakeholder-oriented approach visualization and communication
In the context of this paper stakeholder-orientation refers to the need to cooperatewith the stakeholders during the analysis and to consider the knowledge of the contextwhile taking into account the level of technical background required to correctly readand interpret the results This is in line with findings by Blazy et al (2009) in the caseof banana systems in Guadeloupe where all the experts involved in the developmentof a farm typology with PCA and CA were scientists Blazy et al (2009) report thatit was not possible to bring on board professional actors the process of farm typeidentification being unusual and time-consuming for professional actors like farmersThey conclude that their methodological framework would therefore be improved bycollaboration with ergonomists and participatory research scientists to determine howto facilitate the participation of professional actors
Different understanding of a farm typology between scientists and otherstakeholders can result in an information imbalance that would lead to a research-driven (scientistsrsquo perspective) instead of a problem-driven (farmersrsquo perspective)approach In the applications of MDS and CA reported and cited in the presentpaper the stakeholder understanding of the typology and the inclusion of localknowledge were promoted by working on two main aspects the visualization oftypology groupings (as compared to PCA and simple CA) and the exclusion of datareduction prior to the application of MDS and CA (as compared to methods implyingreduction with PCA correspondence or factor Analysis)
One major advantage of MDS as compared to PCA in visualizing farm groupingslies in the preservation of distances (representing dissimilarities between sampleindividuals) when the information is difficult to represent on a low number ofdimensions (Clarke and Warwick 1994) Indeed the ability of PCA to preservedistances is poor when the variation among sample individuals is distributed onmultiple dimensions which is instead a feature of MDS
The level of agreement between CA and MDS is higher than that between CAand PCA as the data input is the same for CA and MDS (similarity coefficients)which does not happen with PCA In the present approach the PCA is limited toa preliminary exploration of the multivariate data structure therefore it is useful togenerate questions about variable selection to be addressed during further elicitationwith the expert
httpwwwcambridgeorgcoreterms httpdxdoiorg101017S0014479713000495Downloaded from httpwwwcambridgeorgcore Open University Libraryy on 22 Dec 2016 at 180450 subject to the Cambridge Core terms of use available at
394 G C PA C I N I et al
Concerning the visualization potential of the approach as compared to simple CAthe combined use of MDS and CA can account for fine distinctions between farmgroupings in relatively homogeneous farm populations According to Clarke andWarwick (2001) methods based on cluster analysis fail in graphically representingthe two-way inter-relations within the sample on a continuous scale and especially innon-dispersed populations tend to impose a rather arbitrary grouping on what maybe a continuum of change CA groups the samples into discrete clusters but is notable to display a steady gradation in the database structure In contrast MDS is ableto represent the farm sample as a continuum this feature of MDS visualization isparticularly important to visualize inter-relations among farms as witnessed by otherstudies in the literature For instance Madsen and Adriansen (2004) reported that thebest way to describe the relation between the different landowner types of a land-usestudy carried out in Denmark seemed to be the concept of continuum because therewas a gradual transition from one landowner type to the other The description oflandowner types in terms of continua could possibly be enhanced by displaying thecontinua of farms on an MDS plot with CA clusters superimposed
To keep a straightforward communication with non-technical experts (eg farmerstechnicians etc) we avoided any database reduction prior to the application of MDSand CA assuming that presenting the results of the classification of farms in the formof the original variables would be more meaningful for MVA non-practitioners Inorder to mitigate the effects of retaining non-reduced variables in terms of redundancyof information we chose to use PCA to uncover highly correlated variables and helpexpert knowledge to avoid duplications if any (Clarke and Gorley 2006)
Madsen and Adriansen (2004) advocate the use of multi-methods encompassingqualitative and quantitative approaches to understand the use of rural spaceCombined used of CA and MDS for the applications presented and cited in thispaper showed a high visualization and communication potential Although it is notpossible to generalize this potential in the areas under study and with correspondingstakeholders combined use of CA and MDS proved to be able to supply entry pointsfor facilitated stakeholder knowledge inclusion and could be integrated in a multi-method framework together with more qualitative and participatory approaches
C O N C L U S I O N S
In this paper we aimed to bridge the recurrent gap in typology delineation betweenstatistical soundness and the need to consider expert knowledge on the drivers of rurallivelihood diversity The additional application of MDS to classical non-parametricmultivariate approaches based on cluster analysis is geared towards the incorporationof sensitivity to local peculiarities and expertise typical of participatory methods intoan objectively reproducible MVA tool-kit Indeed the results of any classificationprocess are influenced by its eventual purposes and by the variables chosen whichshould ultimately both be defined by the local stakeholders Hence the inclusion oflocal knowledge in the classification process should be eased through the adoption ofappropriate stakeholder-oriented devices
httpwwwcambridgeorgcoreterms httpdxdoiorg101017S0014479713000495Downloaded from httpwwwcambridgeorgcore Open University Libraryy on 22 Dec 2016 at 180450 subject to the Cambridge Core terms of use available at
Typology of rural households 395
In conclusion facilitating participatory identification of farm typologies whileretaining objectivity and replicability of sound statistical tools is the main advantageof the method described here Its main limitation as compared to other approachesentailing variable reduction prior to clustering is that redundancy of informationis only partially taken into consideration A further disadvantage of the method ascompared to parametric methods is that the evidence gathered for a representativefarm cannot trivially be scaled up to aggregate levels given that strong assumptionson key variables distributions (such as normality) are typically not borne out by thedata However the latter can be also considered as a potential advantage in the sensethat often variables from farm databases are not normally distributed which poseslimitations to the application of parametric methods
In general we believe that the method presented is an acceptable compromisebetween the need to guarantee the properties of replicability and objectivity ensuredby statistical tools and the necessity to facilitate inclusion of expert knowledgewithin a multi-method framework As far as sustainable development is a processdetermined by negotiations among local stakeholders it is of vital importance thatsuch stakeholders including farmers technicians and policymakers are aware of thediversity of production and livelihood systems that can be put in place to realizetransition pathways towards sustainability With its focus on communication andvisualization of results the method described in the present paper aims at involvinglocal stakeholders in the process of capturing heterogeneity of farming systems and atraising awareness of the diversity of possible solutions
Acknowledgements This study has been realized as part of the Project EULACIAS(INCO-dev) Sixth Framework Programme of the European Union contractno 0032387
R E F E R E N C E S
Adams A M Evans T G Mohammed R and Farnsworth J (1997) Socioeconomic stratification by wealthranking is it valid World Development 25(7)1165ndash1172
Andersen E Elbersen B Godeschalk F and Verhoog D (2007) Farm management indicators and farm typologiesas a basis for assessments in a changing policy environment Journal of Environmental Management 82(3)353ndash362
Baudron F Corbeels M Andersson J A Sibanda M and Giller K E (2011) Delineating the drivers of waningwildlife habitat the predominance of cotton farming on the fringe of protected areas in the Mid Zambezi ValleyZimbabwe Biological Conservation 144(5)1481ndash1493
Blazy J M Ozier-Lafontaine H Doregrave T Thomas A and Wery J (2009) A methodological framework thataccounts for farm diversity in the prototyping of crop management systems Application to banana-based systemsin Guadeloupe Agricultural Systems 10130ndash41
Block S and Webb P (2001) The dynamics of livelihood diversification in post-famine Ethiopia Food Policy 26(4)333ndash350
Bray J R and Curtis J T (1957) An ordination of the upland forest communities of Southern Wisconsin Ecological
Monographs 27325ndash349Catalaacuten I A Jimeacutenez M T Alconchel J I Prieto L and Muntildeoz J L (2006) Spatial and temporal changes
of coastal demersal assemblages in the Gulf of Cadiz (SW Spain) in relation to environmental conditions Deep Sea
Research Part II Topical Studies in Oceanography 531402ndash1419Chambers R (1994) Participatory rural appraisal challenges potentials and paradigm World Development
22(10)1437ndash1451
httpwwwcambridgeorgcoreterms httpdxdoiorg101017S0014479713000495Downloaded from httpwwwcambridgeorgcore Open University Libraryy on 22 Dec 2016 at 180450 subject to the Cambridge Core terms of use available at
396 G C PA C I N I et al
Clarke K R (1993) Non-parametric multivariate analyses of changes in community structure Australian Journal of
Ecology 18117ndash143Clarke K R and Gorley R N (2006) PRIMER v6 User ManualTutorial Plymouth UK PRIMER-EClarke K R and Warwick R M (1994) Change in Marine Communities An Approach to Statistical Analysis and Interpretation
Plymouth UK Plymouth Marine LaboratoryClarke K R and Warwick R M (2001) Change in Marine Communities An Approach to Statistical Analysis and Interpretation
2nd edn Plymouth UK PRIMER-EDecision 85377EEC (1985) Commission decision of the 7 June 1985 establishing a Community typology for
agricultural holdings Official Journal of the European Communities L 2201 (1781985)Dempster A P Laird N M and Rubin D B (1977) Maximum likelihood from incomplete data via the EM
algorithm Journal of the Royal Statistical Society B 39(1)1ndash38Dice L R (1945) Measures of the amount of ecologic association between species Ecology 26(3)297ndash302Ellis F (2000) Rural Livelihoods and Diversity in Developing Countries Oxford Oxford University PressField J C Clarke K R and Warwick R M (1982) A practical strategy for analysing multispecies distribution
patterns Marine Ecology Progress Series 837ndash52Gaspar P Escribano M Mesiacuteas F J Rodriguez de Ledesma A and Pulido F (2008) Sheep farms in the Spanish
rangelands (dehesas) typologies according to livestock management and economic indicators Small Ruminant
Research 7452ndash63Giller K E Tittonell P Rufino M C van Wijk M T Zingore S Mapfumo P Adjei-Nsiah S Herrero
M Chikowo R Corbeels M Rowe E C Baijukya F Mwijage A Smith J Yeboah E van der Burg WJ Sanogo O M Misiko M de Ridder N Karanja S Kaizzi C Krsquoungu J Mwale M Nwaga D PaciniC and Vanlauwe B (2011) Communicating complexity integrated assessment of trade-offs concerning soilfertility management within African farming systems to support innovation and development Agricultural Systems
104(2)191ndash203Gower J C (1971) A general coefficient of similarity and some of its properties Biometrics 27(4)857ndash871Iraizoz B Gorton M and Davidova S (2007) Segmenting farms for analysing agricultural trajectories a case study
of the Navarra region in Spain Agricultural Systems 93143ndash169Jaccard P (1901) Eacutetude comparative de la distribution florale dans une portion des Alpes et des Jura Bulletin de la
Socieacuteteacute Vaudoise des Sciences Naturelles 37547ndash579Kobrich C Rehman T and Khan M (2003) Typification of farming systems for constructing representative farm
models two illustrations of the application of multi-variate analyses in Chile and Pakistan Agricultural Systems
76141ndash157Kostov P and McErlean S (2006) Using the mixtures-of-distributions techniques for the classification of farms into
representative farms Agricultural Systems 88528ndash537Kruskal J B (1964) Multidimensional scaling by optimizing goodness of fit to a non-metric hypothesis Psychometrika
291ndash27Kruskal J B and Wish M (1978) Multidimensional Scaling Beverly Hills California (USA) Sage PublicationsLaurent C Cartier S Fabre C Mundler P Ponchelet D and Remy J (1998) Lrsquoactiviteacute agricole des meacutenages
ruraux et la cohesion eacuteconomique et sociale Eacuteconomie Rurale 22412ndash21Madsen L M and Adriansen H K (2004) Understanding the use of rural space the need for multi-methods
Journal of Rural Studies 20485ndash497Paumgarten F and Shackleton C M (2009) Wealth differentiation in household use and trade in non-timber forest
products in South Africa Ecological Economics 68(12)2950ndash2959R Development Core Team (2009) R a Language and Environment for Statistical Computing R Foundation for
Statistical Computing Vienna Austria available at httpwwwR-projectorgRighi E Cittadini E D Mundet C San Martino L Sanz C and Baltuska N (2011a) Tipologiacutea predial del
sector productor de cerezas del sur de la Patagonia argentina Agriscientia 2685ndash97Righi E Dogliotti S Stefanini F M and Pacini G C (2011b) Capturing farm diversity at regional level to
up-scale farm level impact assessment of sustainable development options Agriculture Ecosystems and Environment
142(1ndash2)63ndash74Ruben R and Pender J (2004) Rural diversity and heterogeneity in less-favoured areas the quest for policy targeting
Food Policy 29303ndash320Selleslagh J and Amara R (2008) Environmental factors structuring fish composition and assemblages in a small
macrotidal estuary (eastern English Channel) Estuarine Coastal and Shelf Science 79507ndash517
httpwwwcambridgeorgcoreterms httpdxdoiorg101017S0014479713000495Downloaded from httpwwwcambridgeorgcore Open University Libraryy on 22 Dec 2016 at 180450 subject to the Cambridge Core terms of use available at
Typology of rural households 397
Solano C Leon H Perez E and Herrero M (2001) Characterising objective profiles of Costa Rican dairy farmersAgricultural Systems 67(3)153ndash179
Soslashrensen T (1957) A method of establishing groups of equal amplitude in plant sociology based on similarity ofspecies and its application to analyses of the vegetation on Danish commons Biologiske Skrifter Kongelige Danske
Videnskabernes Selskab 5(4)1ndash34Stergiou K I Moutopoulos D K Soriguer M C Puente E Lino P G Zabala C Monteiro P Errazkin L
A and Erzini K (2006) Trammel net catch species composition catch rates and meacutetiers in southern Europeanwaters a multivariate approach Fisheries Research 79170ndash182
Tesfaye L T Perret S and Kirsten J F (2004) Diversity in livelihoods and farmersrsquo strategies in the HarargheHighlands Eastern Ethiopia International Journal of Agricultural Sustainability 2(2)133ndash146
Tittonell P Muriuki A Shepherd K D Mugendi D Kaizzi K C Okeyo J Verchot L Coe R andVanlauwe B (2010) The diversity of rural livelihoods and their influence on soil fertility in agricultural systemsof East Africa ndash A typology of smallholder farms Agricultural Systems 10383ndash97
Tittonell P Vanlauwe B Leffelaar P A Rowe E C and Giller K E (2005) Exploring diversity in soilfertility management of smallholder farms in western Kenya I Heterogeneity at region and farm scale Agriculture
Ecosystems and Environment 110(3ndash4)149ndash165Tittonell P van Wijk M T Herrero M Rufino M C de Ridder N and Giller K E (2009) Beyond resource
constraints ndash exploring the physical feasibility of options for the intensification of smallholder crop-livestock systemsin Vihiga district Kenya Agricultural Systems 1011ndash19
Van der Ploeg J D Laurent C Blondeau F and Bonnafous P (2009) Farm diversity classification schemes andmultifunctionality Journal of Environmental Management 90(Supplement 2)124ndash131
Zimmermann A Heckelei T and Peacuterez Domiacutenguez I (2009) Modelling farm structural change for integratedex-ante assessment review of methods and determinants Environmental Science and Policy 12(5)601ndash618
Zingore S Murwira H K Delve R J and Giller K E (2007) Influence of nutrient management strategieson variability of soil fertility crop yields and nutrient balances on smallholder farms in Zimbabwe Agriculture
Ecosystems and Environment 119112ndash126
httpwwwcambridgeorgcoreterms httpdxdoiorg101017S0014479713000495Downloaded from httpwwwcambridgeorgcore Open University Libraryy on 22 Dec 2016 at 180450 subject to the Cambridge Core terms of use available at
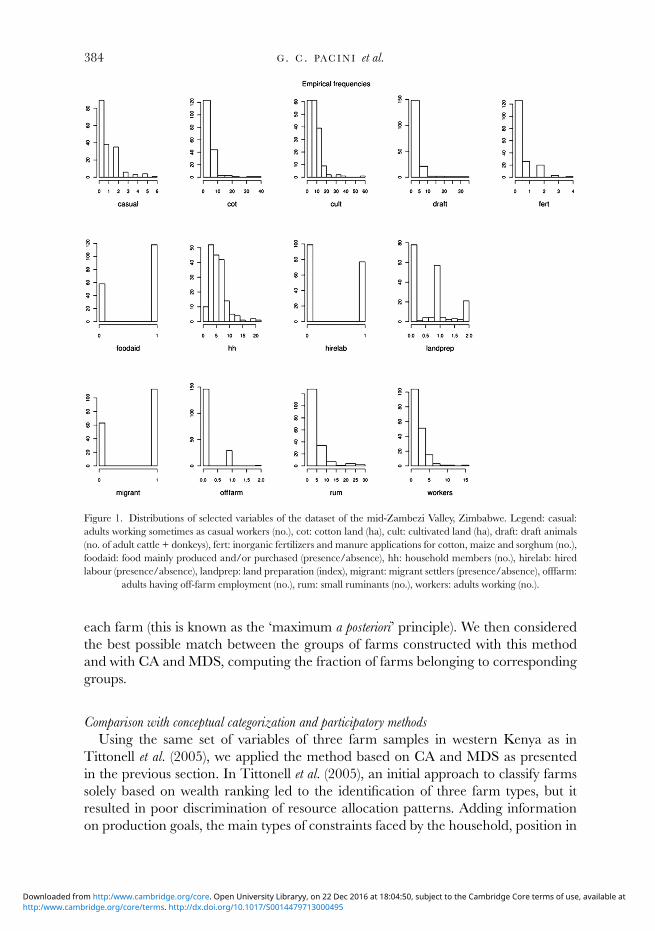