combining froth flotation with reflux classification to … · flotation process was sufficient to...
TRANSCRIPT
Univers
ity of
Cap
e Tow
n
COMBINING FROTH FLOTATION WITH REFLUX CLASSIFICATION TO
MITIGATE ARD GENERATING POTENTIAL OF THE WATERBERG AND
WITBANK COAL ULTRAFINES VIA SULFIDE REMOVAL
ONYINYE JUDITH IROALA
Dissertation submitted to the Faculty of Engineering and the Built
Environment, University of Cape Town
In fulfillment of the requirements for the degree of Master of Science in
Engineering
Department of Chemical Engineering
December 2014

The copyright of this thesis vests in the author. No quotation from it or information derived from it is to be published without full acknowledgement of the source. The thesis is to be used for private study or non-commercial research purposes only.
Published by the University of Cape Town (UCT) in terms of the non-exclusive license granted to UCT by the author.
Univers
ity of
Cap
e Tow
n

i
DECLARATION
I declare that this thesis, submitted for the degree of Master of Science in Engineering at the
University of Cape Town, is my own work and has not been submitted prior to this for any
degree at this university or any other institution. I know the meaning of plagiarism and declare
that all the work in the document, save for that which is properly acknowledged, is my own.
Name: Onyinye Judith Iroala
Signature:

ii
ACKNOWLEDGEMENTS
I am utmost grateful to God for the strength and ability he gave me throughout the course of
my work.
I wish here to express my heartfelt appreciation to my supervisors: Professor Jean-Paul
Franzidis for his guidance, invaluable input in the different stages of my work and for his
availability to discuss the progress of my work; Professor Sue Harrison for her guidance in
interpreting some of my results; Professor Quentin Campbell and Dr. Marco Le Roux for their
support and guidance during my experimental work at North West University, Potchefstroom. I
would also like to thank Dr Megan Becker for her help in interpreting the microscopic view of
my samples.
I would like to acknowledge the financial support from the South African Mineral to Metals
Research Institute (SAMMRI) and the South African National Research Foundation (NRF).
I would like to extend my gratitude to the following people for their assistance:
The staff of the Centre for Minerals Research (CMR) Laboratory, in particular, Shireen Govender
(Manager), Lorraine Nkemba, Kenneth Maseko and Monde Bekaphi.
The staff of the Centre for Bioprocess Engineering Research (CeBER), in particular, Emmanuel
Ngoma and Alex Opitz.
The staff of the Analytical Laboratory in the Department of Chemical Engineering UCT for
performing LECO analysis on all my samples.
The staff of North West University Chemical Engineering department workshop, Potchefstroom
Campus, in particular, Jan Kroeze. To Theron Smith for his immense help during my
experiments.
I wish to express my love and appreciation to my family: my father and mother Mr and Mrs
Chris Iroala, and my sisters and brothers, Chinwe, Nnanna, Nkemakolam and Chukwuebuka for
all their support and prayers.
This work is based on research supported by SAMMRI, NRF and the Department of Science and
Technology (DST). Any opinion, finding, conclusion or recommendation expressed in this
material is that of the authors and SAMMRI and NRF do not accept any liability in this regard.

iii
ABSTRACT
In South Africa, over 10 million tons of ultrafine coal wastes are discarded every year, typically
in the form of ultrafine slurries. These fines have a high calorific value, and contain sulfur
minerals, particularly pyrite. The high calorific value of these discards leads to a waste of energy
that could be harnessed and used, while the high sulfur content contributes to adverse
environmental effects such as acid rock drainage (ARD).
The University of Cape Town (UCT) has developed a two-stage flotation process, which involves
coal flotation in the first stage and pyrite flotation of the tailings in the second stage, for
mitigating the ARD potential of ultrafine wastes. Research has shown that this two stage froth
flotation process was sufficient to render the tailings non-acid forming. At the same time, North
West University (NWU) has been carrying out research on coal fines using the recently invented
reflux classifier. The reflux classifier is claimed to be capable of separating particles down to 38
µm in size; however, no work has been done using the reflux classifier to separate pyrite from
coal.
This dissertation investigates the effectiveness of combining flotation and reflux classification
for removing sulfide minerals from two South African coal ultrafines, whilst recovering valuable
coal, and compares the results to those obtained using the UCT two-stage flotation process. As
no previous work has been done using reflux classification to remove sulfide minerals from
coal, this is the first time that the reflux classifier will be investigated for this purpose. Two
process routes were investigated: (i) froth flotation followed by reflux classification of the
tailings (process route 1), and (ii) reflux classification followed by froth flotation of the overflow
(process route 2).
Coal flotation, sulfide flotation and reflux classification were conducted on samples of
Waterberg and Witbank coals, using a 3 L Leeds-type flotation cell and a 10 L batch reflux
classifier constructed at NWU. Acid base accounting (ABA) and net acid generating (NAG) static
characterization tests were performed on the products and feeds from all three process routes.
The as-received samples were found to contain high ash and sulfur contents (51 % and 2.04 %
for the Waterberg coal; 48 % and 4.18 % for the Witbank coal, respectively). Preliminary batch
tests showed that both coals were difficult to float as the yields were very small. Optimization
of the coal flotation stage using various collectors and MIBC frother at different dosages
showed that Nalflote 9858 collector at 1.4 kg/t gave the optimum result for both coal samples.
Four-stage collector addition at 0.11 kg/t MIBC dosage was used for the Waterberg coal, and
single stage collector addition at 0.28 kg/t MIBC for the Witbank coal.

iv
SIBX at 2.33 kg/t was found to be the optimum collector type and dosage for sulfide flotation of
both coal samples. In the sulfide flotation step, 0.93 kg/t dextrin was used as coal depressant
for both samples.
After optimization, discrete runs were carried out using the reflux classifier on the as-received
and coal flotation tailing samples of both coals, at 50 L/min water flow rate for the as-received
samples, and 100 L/min water flow rate do the coal flotation tailings samples. The reflux
classifier separated the ash and sulfur from the coal samples very efficiently, producing clean
coal overflow products with ash contents below 25 % and sulfur grades below 1.1 %.
The hypothesis, that ‘Combining reflux classification and froth flotation will give better results
(coal recovery and desulfurization) compared to the UCT two-stage froth flotation process’ was
supported by the investigation. Only 50 % and 60 % sulfur removal was achieved using the UCT
two-stage process for the Witbank and Waterberg coal samples, respectively, while
approximately 90 % sulfur removal was achieved using the combined process routes, for both
samples.
While process routes 1 and 2 were equally efficient at producing sulfide-rich and sulfide-lean
streams, process route 2 was better in producing clean coal with low ash and sulfur content.
Furthermore, when using process route 2, reflux classification was found to perform sufficiently
well on its own (for the two samples investigated), as not much separation was achieved in the
coal flotation stage after reflux classification. Therefore, the coal flotation stage can be omitted
from this process route.
In terms of producing benign tailings, low sulfur content was found to be an insufficient
criterion for ARD classification. This was seen with the Witbank sample, as all samples from all
process routes were acid forming, irrespective of their sulfur content, due to the very small
concentrate of acid neutralizing minerals. The Waterberg sample contained sufficient
neutralizing minerals, and as a result, most of the samples, with low sulfur contents, were non-
acid forming.
Recommendations to continue this work include sulfur speciation analysis of the reflux classifier
overflows to determine the different forms of sulfur occurring in the individual flow rate
fractions, and the application of the UCT biokinetic test to validate the results from the static
ARD tests. A plant trial using the reflux classifier only should also be carried out to validate the
excellent results obtained using this unit. Finally, a new combined reflux classification-flotation
process route is recommended for investigation: reflux classification followed by sulfide
flotation. This is in order to further reduce the sulfur content in the final tailings for benign
disposal, and further increase the grade of sulfur in the sulfide-rich stream. This

v
recommendation stems from the high sulfur grades produced in the sulfide flotation step in the
second stage of the UCT process route.

vi
TABLE OF CONTENTS DECLARATION ........................................................................................................................ i
ACKNOWLEDGEMENTS .......................................................................................................... ii
ABSTRACT ............................................................................................................................ iii
TABLE OF CONTENTS ............................................................................................................ vi
LIST OF FIGURES ...................................................................................................................xii
LIST OF TABLES ..................................................................................................................... xv
ABREVIATIONS .................................................................................................................. xviii
1. CHAPTER ONE - INTRODUCTION ...................................................................................... 1
1.1. Background ....................................................................................................................... 1
1.2. Environmental Issues Associated with Ultrafine Coal Wastes ......................................... 2
1.3. Desulfurization of Coal by Flotation ................................................................................. 2
1.4. Gravity Separation of Coal Using Reflux Classification .................................................... 4
1.5. Combining Froth Flotation and Reflux Classification ....................................................... 4
1.6. Problem Statement .......................................................................................................... 5
1.7. Research Approach .......................................................................................................... 5
1.7.1. Objectives and key questions ................................................................................... 6
1.7.2. Hypothesis................................................................................................................. 6
1.7.3. Scope of thesis .......................................................................................................... 7
2. CHAPTER TWO - LITERATURE REVIEW ............................................................................. 8
2.1. Introduction...................................................................................................................... 8
2.2. Fundamental Concept of Acid Rock Drainage (ARD) ....................................................... 8
2.2.1. ARD overview ............................................................................................................ 8
2.2.2. Factors affecting ARD ................................................................................................ 9
2.2.3. Prevention of ARD ..................................................................................................... 9
2.2.3.1. Desulfurization of coal ..................................................................................... 10
2.2.4. ARD characterization tests ...................................................................................... 11
2.2.4.1. Acid base accounting (ABA) ............................................................................. 12
2.2.4.2. Net acid generating (NAG) test ....................................................................... 12
2.3. Characteristics of South African Coals ........................................................................... 14

vii
2.3.1. Waterberg coalfield ................................................................................................ 16
2.3.2. Witbank coalfield .................................................................................................... 16
2.4. Beneficiation of South African Coals .............................................................................. 18
2.5. Desulfurization of South African Coal by Flotation ........................................................ 19
2.5.1. Flotation overview .................................................................................................. 19
2.5.2. Factors affecting coal and mineral flotation ........................................................... 20
2.5.2.1. Flotation reagents............................................................................................ 21
2.5.2.2. Material parameters ........................................................................................ 22
2.5.2.3. Coal rank .......................................................................................................... 22
2.5.3. Flotation work carried out at UCT .......................................................................... 22
2.5.3.1. Coal flotation ................................................................................................... 22
2.5.3.2. Pyrite flotation work ........................................................................................ 24
2.5.4. Two-stage coal desulfurization by flotation ........................................................... 26
2.6. Gravity Separation of Coal and Pyrite ............................................................................ 29
2.6.1. Enhanced gravity separation techniques................................................................ 29
2.6.2. Reflux classifier ....................................................................................................... 29
2.6.2.1. Effect of channel spacing ................................................................................. 30
2.6.2.2. Effect of angle of inclination and number of inclined channels ...................... 31
2.7. Chapter Summary........................................................................................................... 33
3. CHAPTER THREE - EXPERIMENTAL DETAILS .................................................................... 34
3.1. Introduction.................................................................................................................... 34
3.2. Coal Characterization ..................................................................................................... 34
3.2.1. Coals used in experiments ...................................................................................... 35
3.2.2. Particle size analysis ................................................................................................ 36
3.2.3. X-ray Diffraction (XRD) analysis .............................................................................. 36
3.2.4. Proximate and ultimate analysis ............................................................................. 36
3.2.5. Sulfur speciation ..................................................................................................... 36
3.2.6. Determination of ash content ................................................................................ 36
3.2.7. Microscopic Viewing ............................................................................................... 37

viii
3.2.8. Determination of sample density ........................................................................... 37
3.2.9. ARD characterization tests ...................................................................................... 37
3.3. Flotation Tests ................................................................................................................ 38
3.3.1. Flotation reagents ................................................................................................... 38
3.3.2. Flotation procedure ................................................................................................ 39
3.3.2.1. Coal flotation procedure ................................................................................. 39
3.3.2.2. Sulfide flotation ............................................................................................... 40
3.3.2.3. Two-stage flotation procedure ........................................................................ 40
3.3.2.4. Release analysis ............................................................................................... 40
3.4. Reflux Classification ........................................................................................................ 41
3.4.1. Fractionation tests .................................................................................................. 41
3.4.2. Discrete tests .......................................................................................................... 43
3.4.3. Procedure for two-stage tests ................................................................................ 43
3.5. ARD Characterization Tests ............................................................................................ 43
3.5.1. Acid-base accounting (ABA) .................................................................................... 43
3.5.1.1. Maximum potential acidity (MPA) .................................................................. 43
3.5.1.2. Acid neutralizing capacity (ANC) ..................................................................... 44
3.5.1.3. Fizz rating ......................................................................................................... 44
3.5.2. Net acid generating test (NAG) ............................................................................... 45
3.5.2.1. Sequential NAG test......................................................................................... 45
4. CHAPTER FOUR – CHARACTERIZATION AND FLOTATION RESULTS .................................. 46
4.1. Introduction.................................................................................................................... 46
4.2. Coal Characterization ..................................................................................................... 46
4.2.1. Size analysis ............................................................................................................. 46
4.2.2. XRD analysis ............................................................................................................ 48
4.2.3. Proximate and ultimate analysis ............................................................................. 48
4.2.4. Sulfur speciation ..................................................................................................... 49
4.2.5. Flotation release analysis ........................................................................................ 49
4.2.6. Petrographic analysis .............................................................................................. 50

ix
4.3. Coal Flotation Results ..................................................................................................... 51
4.3.1. Flotation of Waterberg and Witbank coal samples using dodecane collector ...... 52
4.3.2. Flotation of Waterberg and Witbank coal samples using oleic acid ...................... 54
4.3.3. Flotation of Waterberg and Witbank coal samples using Nalflote 9858 collector 56
4.3.4. Comparison of Nalflote 9858 and oleic acid collectors .......................................... 57
4.3.5. Process improvement experiments ........................................................................ 59
4.3.6. Flotation in 8 L flotation cell: generation of samples for reflux classifier work ..... 61
4.3.7. Coal flotation of reflux classifier overflow samples (F-OF) ..................................... 61
4.4. Sulfide Flotation Results ................................................................................................. 62
4.4.1. Effect of collector type ............................................................................................ 62
4.4.2. Effect of frother dosage .......................................................................................... 64
4.4.3. Effect of depressant dosage ................................................................................... 65
4.4.4. Effect of collector dosage ....................................................................................... 66
4.5. UCT Two-Stage Flotation Process Results ...................................................................... 67
4.6. Chapter Summary........................................................................................................... 69
5. CHAPTER FIVE - RESULTS AND DISCUSSION: REFLUX CLASSIFICATION ............................ 71
5.1. Material Screening ......................................................................................................... 72
5.2. Fractionation Runs ......................................................................................................... 72
5.2.1. Fractionation run on Waterberg feed and tailing samples .................................... 73
5.2.2. Fractionation run on Witbank feed and tailing samples ....................................... 75
5.2.3. Microscopic analysis ............................................................................................... 77
5.3. Discrete Runs .................................................................................................................. 77
6. CHAPTER SIX - RESULTS OF ARD CHARACTERIZATION TESTS .......................................... 80
6.1. Introduction.................................................................................................................... 80
6.2. Characterization Tests on Waterberg Coal Samples ...................................................... 83
6.2.1. Acid base accounting (ABA) test results on Waterberg coal .................................. 83
6.2.2. Net acid generating (NAG) test results on Waterberg coal .................................... 84
6.2.3. Combination of ABA and NAG tests: Waterberg coal............................................. 86
6.3. Characterization Tests on Witbank Coal Samples .......................................................... 87

x
6.3.1. Acid base accounting (ABA) test results on Witbank coal ...................................... 87
6.3.2. Net acid generating (NAG) test results on Witbank coal ........................................ 88
6.3.3. Combination of ABA and NAG tests: Witbank coal ................................................ 90
6.4. Chapter Summary........................................................................................................... 91
7. CHAPTER SEVEN – COMPARISON OF PROCESS ROUTES ................................................. 92
7.1. Introduction.................................................................................................................... 92
7.2. Comparison of Process Route 1 and Route 2: Waterberg Coal ..................................... 92
7.3. Comparison with the UCT Two-Stage Process: Waterberg Coal ................................... 94
7.4. Comparison of Process Route 1 and Route: Witbank Coal ............................................ 95
7.5. Comparison with the UCT Two-Stage Process: Witbank Coal ....................................... 97
7.6. Summary and Proposed Way Forward .......................................................................... 98
8. CHAPTER EIGHT: SUMMARY, CONCLUSIONS AND RECOMMENDATIONS ....................... 99
8.1. Summary ........................................................................................................................ 99
8.2. Conclusions and Recommendations ............................................................................ 100
9. REFERENCES ............................................................................................................... 102
10. APPENDICES ............................................................................................................... 111
A. SAMPLE ANALYSIS ...................................................................................................... 111
A.1. Particle Size Analysis ........................................................................................................ 111
A.2. Ash Analysis ..................................................................................................................... 111
A.3. Sulfur Analysis .................................................................................................................. 112
A.4. Release Flotation Analysis................................................................................................ 113
B. FLOTATION PROCEDURE ............................................................................................. 114
B.1. Coal Flotation Procedure ................................................................................................. 114
B.2. Sulfide Flotation Procedure ............................................................................................. 115
C. REFLUX CLASSIFICATION PROCEDURE ......................................................................... 116
C.1. Determination of Sample Density using pycnometer ...................................................... 117
D. EXPERIMENTAL RESULTS ............................................................................................. 118
D.1. Flotation Results .............................................................................................................. 119
D.1.1. Coal flotation results ................................................................................................. 119

xi
D.1.2. Process Improvement: 4 stage flotation process ..................................................... 130
D.1.3. Sulfide Flotation Results ............................................................................................ 134
D.1.4. Two stage flotation ................................................................................................... 137
D.1.5. Coal flotation of reflux classification feed overflow product ................................... 139
D.1.6. Coal flotation with no collector ................................................................................ 140
D.2. Reflux Classification Results ............................................................................................. 141
D.3. Characterization Test Results .......................................................................................... 144
D.3.1. Acid Base Accounting test results ............................................................................. 144
D.3.2. Net Acid Generating test results ............................................................................... 147

xii
LIST OF FIGURES
Figure 1-1: UCT two-stage flotation process showing alternative process routes (Harrison et al.,
2010; Kazadi Mbamba et al., 2012) ................................................................................................ 3
Figure 1-2: Process circuit for the beneficiation of ultra-fine coal in order to mitigate ARD ........ 5
Figure 2-1: Desulfurization technique (Bois et al., 2004) ............................................................. 11
Figure 2-2: ARD classification plot showing pH verse NAPP value (Stewart et al., 2009) ............ 14
Figure 2-3: Location of the Waterberg and Witbank coalfields in South Africa (Pinetown et al.,
2007; Eberhard, 2011) .................................................................................................................. 17
Figure 2-4: Block flow diagram of a typical South African coal washing plant adapted from
(Reddick et al., 2008) .................................................................................................................... 18
Figure 2-5: Factors affecting flotation process adapted from (Polat et al., 2003) ....................... 20
Figure 2-6: Coal flotation of Witbank coal using oily collectors (Kazadi Mbamba et al., 2013) ... 23
Figure 2-7: Combustible recoveries of clean coal during flotation with Nalflote collectors and
Montanol 800 on Witbank (Exxaro) coal (Mashilo & Modukanele, 2012) ................................... 23
Figure 2-8: Product ash content of clean coal with Nalflote collectors and Montanol 800 during
floation of Witbank coal at 0.28 kg/t MIBC frother (Mashilo & Modukanele, 2012) .................. 24
Figure 2-9: Comparison of sulfur recovery of three xanthate collectors for the Witbank coal.
MIBC frother and dextrin kept constant at 0.11 and 0.93 kg/t respectively (Kazadi Mbamba et
al., 2013) ....................................................................................................................................... 25
Figure 2-10: Comparison of total sulfur recovery of three xanthate collectors for the Waterberg
coal sample. MIBC kept constant for the first 4 dosages at 0.11 kg/t, and increased to 0.28 kg/t.
Dextrin dosage kept constant at 0.93 kg/t (Fisher and Toms, 2013) ........................................... 26
Figure 2-11: Reflux classifier adapted from (Galvin et al., 2010) ................................................. 30
Figure 2-12: Comparison of reflux classifier fractionation test and conventional float sink on
Soutpansberg coal of size range -600 + 500 µm (Rakgase et al., 2012). ...................................... 33
Figure 3-1: Stereopycnometer equipment used to determine sample density ........................... 37
Figure 3-2: 3 L Leeds-type laboratory flotation cell used ............................................................. 38
Figure 3-3: Reflux classifier experimental setup (Smith, 2014) .................................................... 42
Figure 4-1: Particle size distributions of the as-received coal samples ........................................ 47
Figure 4-2: Flotation release results on the as-received coal samples, and release analysis
results of the Witbank sample used by Kazadi Mbamba et al. (2012) for comparison ............... 50
Figure 4-3: Combined flotation-reflux classification process routes highlighting coal flotation
stages ............................................................................................................................................ 51
Figure 4-4: Coal flotation result for the Waterberg and Witbank coal samples with no collector
at 0.11 kg/t MIBC dosage .............................................................................................................. 52
Figure 4-5: Yields obtained in the coal flotation of the Waterberg and Witbank coal samples
using 0.28 kg/t MIBC dosage and oleic acid collector at various dosages ................................... 55

xiii
Figure 4-6: Yield obtained in the coal flotation of the Waterberg and Witbank coal samples
using Nalflote 9858 collector at 0.28 kg/t MIBC dosage .............................................................. 57
Figure 4-7: Comparison of oleic acid and Nalflote 9858 collectors on coal flotation of the
Waterberg coal sample at 0.28 kg/t MIBC dosage ....................................................................... 58
Figure 4-8: Comparison of oleic acid and Nalflote 9858 collectors on coal flotation of the
Witbank coal sample at 0.28 kg/t MIBC dosage ........................................................................... 58
Figure 4-9: Recoveries and grades (cumulative values on the right) obtained from sulfide
flotation results using PAX and SIBX at 2.33 kg/t dosage. Dextrin depressant and MIBC frother
dosages kept constant at 0.93 kg/t and 0.11 kg/t respectively .................................................... 64
Figure 4-10: Effect of MIBC frother dosage on sulfide flotation of the Waterberg and Witbank
coal samples: SIBX collector and dextrin depressant dosages kept constant at 2.33 kg/t and 0.93
kg/t respectively............................................................................................................................ 65
Figure 4-11: Effect of dextrin depressant dosage on sulfide flotation of the Waterberg and
Witbank coal samples: SIBX collector and MIBC frother dosages kept constant at 2.33 kg/t and
0.11 kg/t respectively.................................................................................................................... 66
Figure 5-1: Process route highlighting reflux classification stage ................................................ 71
Figure 5-2: Figure relating water flow rate to the sample density of each overflow products
obtained from fractionation runs on feed and tailings samples of the Waterberg and Witbank
coals .............................................................................................................................................. 73
Figure 5-3: Washability curve of the Waterberg feed and tailing samples obtained from
fractionation experiment using the reflux classifier. The 20 L/min data point has been excluded
....................................................................................................................................................... 74
Figure 5-4: Washability curve of the Witbank feed and tailing samples obtained from
fractionation experiment using the reflux classifier. The 20 L/min data point has been excluded
....................................................................................................................................................... 76
Figure 5-5: Microscopic view of fractionation run samples of the Waterberg feed. Microscopic
size for all samples was at 500µm ................................................................................................ 79
Figure 5-6: Microscopic view of fractionation run samples of the Witbank feed. Microscopic size
for all samples was at 500 µm ...................................................................................................... 79
Figure 6-1: Schematic showing process routes 1 and 2 and the UCT two-stage process ............ 81
Figure 6-2: Combination of ABA and NAG tests on the Waterberg coal sample: NAG pH versus
NAPP ............................................................................................................................................. 87
Figure 6-3: Combination of ABA and NAG tests on the Witbank coal sample: NAG pH versus
NAPP ............................................................................................................................................. 91
Figure 7-1: Results from process route 1 (coal flotation and reflux classification) of the
Waterberg coal sample. Green: NAF, gray: uncertain, red: AF .................................................... 93
Figure 7-2: Results from process route 2 (reflux classification and coal flotation) of the
Waterberg coal sample. Green: NAF, gray: uncertain, red: AF .................................................... 94

xiv
Figure 7-3: Results of the UCT two-stage flotation process of the Waterberg coal sample.
Green: NAF, gray: uncertain, red: AF ............................................................................................ 94
Figure 7-4: Results from process route 1 (coal flotation and reflux classification) of the Witbank
coal sample. Red: AF ..................................................................................................................... 95
Figure 7-5: Results from process route 2 (reflux classification and coal flotation) of the Witbank
coal sample. Red: AF ..................................................................................................................... 96
Figure 7-6: Results of the UCT two-stage flotation process of the Witbank coal, green. Red: AF 97
Figure 7-7: Proposed research route for future work .................................................................. 98
Figure D-1: Microscopic view of reflux classification runs performed on the Witbank tails ..... 143
Figure D-2: Microscopic view of reflux classification runs performed on the Waterberg tails.. 143

xv
LIST OF TABLES
Table 2-1: ARD classification using ABA and NAG static tests (Stewart et al., 2009) ................... 13
Table 2-2: South African coal relative density, maceral and sulfur content with respect to other
regions in the world (Falcon, 1977; Sanders & Brookes, 1986; Kalenga, 2011; Thomas, 2013;
Eberhard, 2011) ............................................................................................................................ 15
Table 2-3: Petrography differences in South African coals adapted from (Gray et al., 1980) ..... 18
Table 2-4: Two stage flotation results (first stage: coal flotation; second stage: sulfide flotation)
of the Witban coal (Kazadi Mbamba et al., 2012) (PAF: potentially acid forming, UC: uncertain,
NAF: non acid forming) ................................................................................................................. 27
Table 2-5: Two stage flotation results (first stage: coal flotation; second stage: sulfide flotation)
of a Witbank coal (Amaral Filho et al., 2011) (AF: acid forming, NAF: non acid forming) ........... 28
Table 3-1: Explanation on the relevance of the coal characterization techniques used in the
research ........................................................................................................................................ 34
Table 3-2: Reagent types and dosages used in the experiments ................................................. 39
Table 3-3: Reflux classifier at North West University ................................................................... 41
Table 3-4: Determination of amount of HCl and NaOH concentrations needed according to Fizz
rating (Sobek et al., 1978; IWRI & EGI, 2002). .............................................................................. 45
Table 4-1: Size and ash distributions of the as-received coal samples ........................................ 47
Table 4-2: XRD results of the as-received coal samples ............................................................... 48
Table 4-3: Proximate and ultimate analysis of the as-received coal samples .............................. 49
Table 4-4: Sulfur speciation of the as-received coal samples ....................................................... 49
Table 4-5: Coal flotation results for the Waterberg coal sample at different dosages of dodecane
collector using 0.28 kg/t MIBC dosage ......................................................................................... 53
Table 4-6: Coal flotation results for the Witbank coal sample at different dosages of dodecane
collector using 0.28 kg/t MIBC dosage ......................................................................................... 54
Table 4-7: Coal flotation results for the Waterberg coal sample at different dosages of oleic acid
collector using 0.11 and 0.28 kg/t MIBC dosages ........................................................................ 54
Table 4-8: Coal flotation results for the Witbank coal sample at different dosages of oleic acid
collector using 0.11 and 0.28 kg/t MIBC dosages ........................................................................ 54
Table 4-9: Coal flotation results for the Waterberg coal sample at different dosages of Nalflote
9858 collector using 0.11 and 0.28 kg/t MIBC dosages ............................................................... 56
Table 4-10: Coal flotation results for the Witbank coal sample at different dosages of Nalflote
9858 collector using 0.11 and 0.28 kg/t MIBC dosages ............................................................... 56
Table 4-11: Comparison of 4-stage and single stage coal flotation of the Waterberg coal sample
....................................................................................................................................................... 59
Table 4-12: Comparison of 4-stage and single stage coal flotation of the Witbank coal sample
(N: Nalflote 9858; O: oleic acid; M: Montanol 800) ..................................................................... 60

xvi
Table 4-13: Summary of reagent conditions and results of the coal flotation of the Waterberg
and Witbank samples used the 8 L Leads-type flotation cell ....................................................... 61
Table 4-14: Results of the coal flotation tests carried out on the reflux classification overflow
streams of the Waterberg and Witbank coal samples using optimized reagent type and dosages
....................................................................................................................................................... 62
Table 4-15: Sulfide flotation results using PAX and SIBX at 2.33 kg/t dosage. Dextrin depressant
and MIBC at 0.93 kg/t and 0.11 kg/t dosage, respectively ........................................................... 63
Table 4-16: Sulfide flotation of Waterberg coal sample using different SIBX collector dosages.
MIBC and Dextrin dosages kept constant at 0.11 kg/t and 0.93 kg/t respectively ...................... 67
Table 4-17: Sulfide flotation of Witbank coal sample using different SIBX collector dosages.
MIBC and Dextrin dosages kept constant at 0.28 kg/t and 0.93 kg/t respectively ...................... 67
Table 4-18: Results of two-stage flotation tests on the Waterberg coal sample. Stage-wise
collector addition in coal flotation stage ...................................................................................... 68
Table 4-19: Results of two-stage flotation tests on the Witbank coal sample. Single-stage
collector addition in coal flotation stage ...................................................................................... 68
Table 5-1: Results of the screening process carried out on the as-received feed and coal
flotation tailing samples of the Waterberg and Witbank coals .................................................... 72
Table 5-2: Cumulative fractionation run results on the Waterberg coal feed and flotation tailings
....................................................................................................................................................... 75
Table 5-3: Cumulative fractionation run results on the Witbank coal feed and flotation tailings76
Table 5-4: Discrete run results of the Waterberg feed and tailing samples at 50 and 100 L/min
flow rate respectively ................................................................................................................... 78
Table 5-5: Discrete run results of the Witbank feed and tailing samples at 50 and 100 L/min flow
rate respectively ........................................................................................................................... 78
Table 6-1: ARD classification using ABA and NAG static tests (Stewart et al., 2009) ................... 80
Table 6-2: Sulfur content of all samples used in ARD characterization tests ............................... 82
Table 6-3: Acid base accounting results for the Waterberg experimental products. AF: Acid
forming; NAF: Non-acid forming ................................................................................................... 83
Table 6-4: Net acid generation test results for the Waterberg experimental products. AF: Acid
forming; NAF: Non-acid forming ................................................................................................... 85
Table 6-5: Sequential NAG test results for selected Waterberg samples with high sulfur content
....................................................................................................................................................... 86
Table 6-6: Acid base accounting results for the Witbank experimental products ....................... 88
Table 6-7: Net acid generation test results for the Witbank experimental products .................. 89
Table 6-8: Sequential NAG test results for the Witbank samples ................................................ 90
Table A-1: Release flotation test results of the as-received Waterberg sample ........................ 113
Table A-2: Release flotation test results of the as-received Witbank sample ............................ 113

xvii
Table D-1: Waterberg and Witbank coal flotation results using dodecane, Nalflote 9858 and
oleic acid collector ...................................................................................................................... 119
Table D-2: 4-stage flotation results of the Waterberg and Witbank coal samples at selected
reagent types and dosages ......................................................................................................... 130
Table D-3: Sulfide flotation results of the Waterberg and Witbank coal samples ..................... 134
Table D-4: Two-stage flotation results of the Waterberg and Witbank coal samples ............... 137
Table D-5: RC feed overflow coal flotation results of the Waterberg and Witbank coal samples
..................................................................................................................................................... 139
Table D-6: Coal flotation tests with no collector ........................................................................ 140
Table D-7: Witbank feed fractionation results ........................................................................... 141
Table D-8: Witbank tails fractionation results ............................................................................ 141
Table D-9: Waterberg feed fractionation results........................................................................ 142
Table D-10: Waterberg tails fractionation results ...................................................................... 142
Table D-11: Stream abbreviations .............................................................................................. 144
Table D-12: ABA results for the Witbank coal samples .............................................................. 145
Table D-13: ABA results for the Waterberg coal samples .......................................................... 146
Table D-14: NAG test results for the Waterberg coal samples ................................................... 147
Table D-15: Sequential NAG test results for Waterberg 2T ........................................................ 148
Table D-16: Sequential NAG test results for Waterberg 4C ....................................................... 148
Table D-17: Sequential NAG test results for Witbank Feed (F) .................................................. 148
Table D-18: Sequential NAG test results for Witbank feed +53 µm ........................................... 149
Table D-19: Sequential NAG test results for Witbank feed -53 µm ............................................ 149
Table D-20: Sequential NAG test results for Witbank tails (1T) ................................................. 150
Table D-21: Sequential NAG test results for Witbank tails +53 µm ........................................... 150
Table D-22: Sequential NAG test results for Witbank tails -53 µm ............................................ 151
Table D-23: Sequential NAG test results for Witbank 1C ........................................................... 151
Table D-24: Sequential NAG test results for Witbank 1T-OF ...................................................... 152
Table D-25: Sequential NAG test results for Witbank 1T-UF ...................................................... 152
Table D-26: Sequential NAG test results for Witbank F - UF ...................................................... 153
Table D-27: Sequential NAG test results for Witbank F - OF ...................................................... 153
Table D-28: Sequential NAG test results for Witbank 2C ........................................................... 154
Table D-29: Sequential NAG test results for Witbank 2T ........................................................... 154
Table D-30: Sequential NAG test results for Witbank 4C ........................................................... 155
Table D-31: Sequential NAG test results for Witbank 4T ........................................................... 155
xviii
ABREVIATIONS
ABA acid base accounting
AF acid forming
AMD acid mine drainage
ANC acid neutralizing capacity
AP Acid potential
ARD acid rock drainage
CMR Centre for Minerals Research
C1 first flotation concentrate
C2 second flotation concentrate
C3 third flotation concentrate
C4 fourth flotation concentrate
EPA United States Environmental Protection Agency
g gram
g/t gram/ ton
kg kilogram
kg/t kilogram per ton
kg H2SO4/t kilogram of sulfuric acid per ton
h hour
HCl hydrochloric acid
L/min liter per minute
M molarity
MEND Mine Environment Neutral Drainage

xix
MIBC methyl isobutyl carbinol
min minute
MJ/kg mega joule per kilogram
mm millimetre
MPA maximum potential acidity
NaCl sodium hydroxide
NAF non-acid forming
NAG net acid generation
NAPP net acid producing potential
NP neutralization potential
NWU North West University
PAF potentially acid forming
pH measure of acid concentration
PSD particle size distribution
RC Reflux Classifier
SACRM South African coal roadmap
SG specific gravity
UC uncertain
UCT University of Cape Town
Wt weight
µm micron

1
1. CHAPTER ONE - INTRODUCTION
1.1. Background
In South Africa, over 10 million tons of ultrafine coal wastes are discarded every year, typically
in the form of ultrafine slurries (Reddick et al., 2007). These fines have an average calorific
value of about 24.7 MJ/kg, and contain sulfur minerals, particularly pyrite, constituting about
0.6 – 0.7 % (Eberhard, 2011). The high calorific value of these discards leads to a waste of
energy that could be harnessed and used, while the high sulfur content contributes to adverse
environmental effects such as acid rock drainage (ARD).
Some coal washing plants in South Africa have incorporated processes such as froth flotation,
gravity separation and dense medium beneficiation in order to recover valuable coal from the
fines and ultrafines (Peatfield, 2003; Fourie et al., 1980; De Korte, 2010). Other plants filter the
ultrafines, and add them to the coarse products to be sold as steam coal, or discard them onto
slime dams. It is worth noting that no circuit exists to recover sulfur minerals from ultrafine
wastes prior to disposal: however, the increasing awareness of ARD has led to measures being
taken to prevent and treat it. These measures include physical barriers such as covers, as well
as chemical and biological treatment (Johnson & Hallberg, 2005).
In the area of research, the University of Cape Town (UCT) has developed a two-stage flotation
process (Harrison et al., 2010), which involves coal flotation in the first stage and pyrite
flotation of the tailings in the second stage, for mitigating the ARD potential of ultrafine wastes.
This process differs from the two-stage coal desulfurization by flotation process developed by
Miller (1975), which involves the flotation of sulfide from the first stage coal concentrate.
In the first stage of the UCT process, high grade salable coal is recovered; in the second stage,
the tailing of the first stage is further floated to produce an enriched sulfur stream and a tailings
containing a negligible amount of sulfur. In experiments using a sample of Witbank coal
ultrafines (thickener underflow), Kazadi Mbamba et al. (2012) showed that this two stage froth
flotation process was sufficient to render the tailings non-acid forming.
At the same time, North West University (NWU) has been carrying out research on coal fines
using the recently invented reflux classifier. Gravity separators such as jigs and spirals have
been used to beneficiate fine coal; however, these methods are not efficient when dealing with
ultrafines. The reflux classifier is claimed to be capable of separating particles down to 38 µm in
size (Galvin et al., 2010). However, no work has been done using the reflux classifier to separate
pyrite from coal.
This objective of the research is to combine flotation and reflux classification for the effective
removal of sulfide minerals from coal ultrafines, whilst recovering valuable coal; and to

2
compare the results with the UCT two-stage flotation process. As no previous work has been
done using reflux classification to remove sulfide minerals from coal, this is the first time that
the reflux classifier will be investigated for this purpose.
1.2. Environmental Issues Associated with Ultrafine Coal Wastes
Acid rock drainage (ARD) involves a chain of reactions that are difficult to stop or control once
started. ARD is a condition that occurs when sulfur bearing minerals oxidize in the presence of
water, oxygen and bacteria to produce acids and cause the leaching of heavy metals such as
calcium, magnesium, lead, cadmium, zinc and silver. The adverse effect of ARD is seen by the
reduction of pH and the presence of toxic heavy metals in the surrounding water and aquifers.
Flowing water becomes contaminated when contacted with ARD, and streams and rivers
become toxic when near the site of production. ARD has become a problem in the South
African mining industry, particularly in the gold and coal mining sector. This is because large
amounts of sulfur-containing wastes have been and are still being discarded without treatment.
These discards are expected to increase due to the rising need for coal in South Africa.
Current treatment methods such as chemical treatment involve the use of neutralizing
minerals, such as limestone (CaCO3), which react with the acid to form neutral compounds,
thereby increasing the pH of the surroundings. The downside of the treatment methods
presently used is that they address the issue of ARD on a short term basis, without completely
eliminating the problem. A better approach would be to prevent the production at-source and
provide a long-term solution to the problem, as opposed to short-term solutions such as
chemical or biological treatment.
Desulfurization is a useful means of completely eliminating the threat of ARD; the UCT two-
stage process prevents at-source production of ARD using flotation. This process is discussed
further in the section below.
1.3. Desulfurization of Coal by Flotation
Froth flotation is a physico-chemical process for separating fine particles based on their surface
properties. Flotation is the primary method of separating ultrafine coal from ash-forming
minerals and relies on the natural hydrophobicity of coal (Kawatra & Eisele, 1997). In mineral
flotation, valuable minerals are rendered hydrophobic and non-valuable (gangue) minerals
hydrophilic by the addition of chemical reagents termed collectors and depressants,
respectively. In the case of coal flotation, the non-valuables are usually already hydrophilic,
while oily collectors are used as reagents to create or enhance the hydrophobicity of coal.
Froth flotation consists of two phases, namely a pulp and a froth phase. The hydrophobic
particles become attached to air bubbles in the pulp phase, and are carried to the froth phase
where they are collected as concentrate. Frothers are used to enhance the stability of froths
3
formed, ensuring good recovery to the concentrate. The gangue minerals remain in the pulp
phase and constitute the tailings.
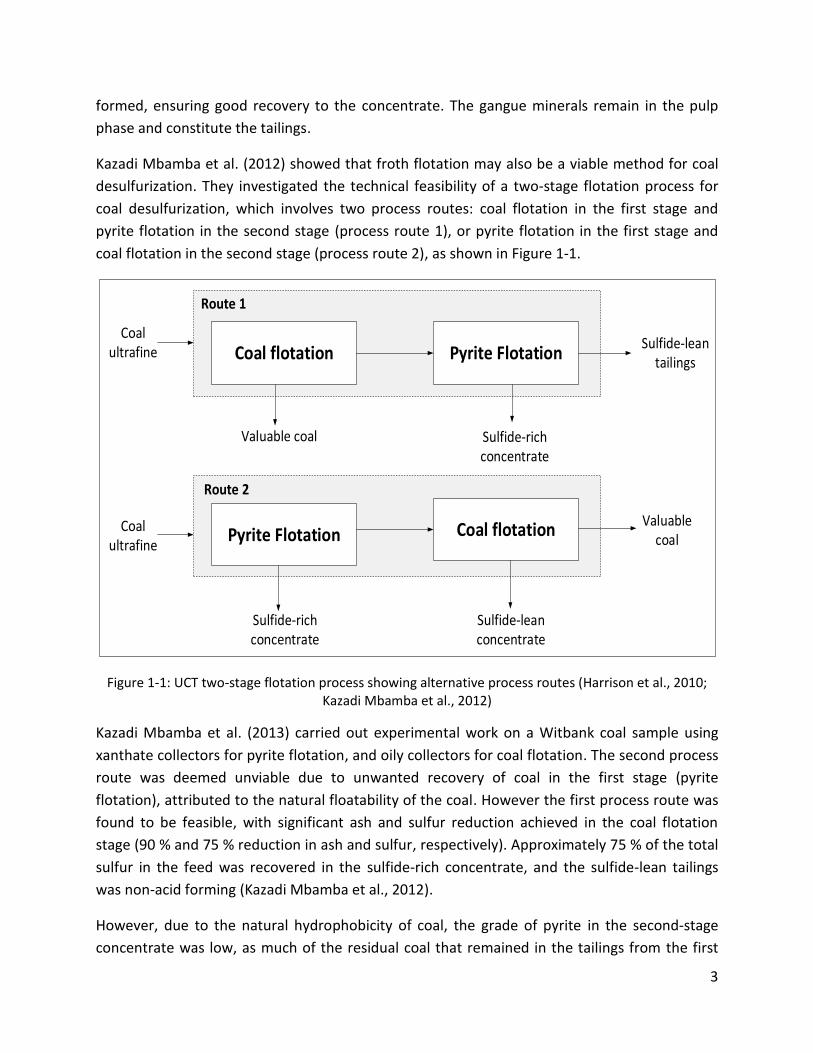
Kazadi Mbamba et al. (2012) showed that froth flotation may also be a viable method for coal
desulfurization. They investigated the technical feasibility of a two-stage flotation process for
coal desulfurization, which involves two process routes: coal flotation in the first stage and
pyrite flotation in the second stage (process route 1), or pyrite flotation in the first stage and
coal flotation in the second stage (process route 2), as shown in Figure 1-1.
Coal ultrafine
Coal ultrafine
Sulfide-lean tailings
Sulfide-rich concentrate
Coal flotation Pyrite Flotation
Pyrite Flotation Coal flotation
Valuable coal
Route 1
Route 2
Sulfide-rich concentrate
Valuable coal
Sulfide-lean concentrate
Figure 1-1: UCT two-stage flotation process showing alternative process routes (Harrison et al., 2010; Kazadi Mbamba et al., 2012)
Kazadi Mbamba et al. (2013) carried out experimental work on a Witbank coal sample using
xanthate collectors for pyrite flotation, and oily collectors for coal flotation. The second process
route was deemed unviable due to unwanted recovery of coal in the first stage (pyrite
flotation), attributed to the natural floatability of the coal. However the first process route was
found to be feasible, with significant ash and sulfur reduction achieved in the coal flotation
stage (90 % and 75 % reduction in ash and sulfur, respectively). Approximately 75 % of the total
sulfur in the feed was recovered in the sulfide-rich concentrate, and the sulfide-lean tailings
was non-acid forming (Kazadi Mbamba et al., 2012).
However, due to the natural hydrophobicity of coal, the grade of pyrite in the second-stage
concentrate was low, as much of the residual coal that remained in the tailings from the first

4
flotation stage continued to float naturally, despite the addition of dextrin depressant. In
addition, the xanthate collectors for pyrite flotation are known to be environmentally
hazardous, and expensive (Jera, 2013; Liu et al., 2013), as they are required in very large
quantities during this flotation step for coal desulfurization. Because of these limitations, the
aim of this research is to develop a better process route based on froth flotation and gravity
separation.
1.4. Gravity Separation of Coal Using Reflux Classification
Gravity separation is a method of separating particles based on differences in their relative
densities. Most gravity separation techniques are only applicable to coarse and fine particles;
however, the reflux classifier (RC) is claimed to be able to treat very fine particles, of 38 µm in
size (Galvin et al., 2005). The RC consists of a fluidized bed located underneath a number of
parallel inclined plates. The particles are suspended in the fluidized bed and conveyed to the
inclined plates where faster settling particles segregate on the inclined surfaces and are
retained within the system while slower settling particles are conveyed to the overflow.
The RC has been used successfully by Galvin and his team to separate ash from coal, with ash
recoveries up to 70 %; it is currently used in coal processing plants in Australia, China and
Mozambique (Orupold et al., 2014), and is cheap to operate as water is the only variable
needed. Due to the large difference in density between coal and pyrite, the RC should be a very
useful means of desulfurization, although it has not been previously used in separating pyrite
from coal.
North West University in Potchefstroom, South Africa, has carried out coal research using a
laboratory scale reflux classifier. Rakgase et al. (2012) and Smith (2014) have used the reflux
classifier unit at NWU to successfully generate washability curves as an alternative to the
conventional float and sink technique which uses heavy liquids. However no work has been
done to separate pyrite from coal.
1.5. Combining Froth Flotation and Reflux Classification
As mentioned in Section 1.3, the performance of the UCT two-stage coal desulfurization by
flotation process is limited because coal is not sufficiently depressed in the pyrite flotation
stage, which results in a low sulfide grade in the sulfide-rich concentrate. Furthermore, the
process incorporates the use of xanthate collectors which are environmentally hazardous and
expensive. A combination of coal flotation and gravity separation can potentially address these
limitations as coal flotation takes advantage of the natural hydrophobicity of coal, and gravity
separation would take advantage of the density difference between coal and pyrite.

5
1.6. Problem Statement
The UCT two-stage flotation process has been shown to be successful in mitigating ARD, but
there are limitations such as the low grade of pyrite in the sulfide-rich concentrate due to the
difficulty in suppressing the natural hydrophobicity of coal, and the use of environmentally
hazardous xanthate collectors. In addition, xanthate collectors are expensive, and are required
in very high quantities during flotation; on the other hand, reflux classification is cheap to
operate as water is the only variable needed. Better results may be achievable by using a
combination of froth flotation and reflux classification.
1.7. Research Approach
The objective of the research descried in this thesis is to combine froth flotation and gravity
separation (in particular, reflux classification) to recover valuable coal and remove pyrite from
ultrafine coal wastes, producing tailings that are potentially non-acid forming. This research
extends the work done by Kazadi Mbamba et al. (2012) by replacing the sulfide flotation stage
in the UCT two-stage coal desulfurization process with reflux classification, as shown in Figure
1-2.
Sulfide-lean tailingsSulfide-rich concentrate
Feed
Feed
Sulfide-rich concentrate
Valuable coal
Coal Flotation Reflux Classification
Route 1
Valuable coal
Sulfide-lean tailings
Reflux Classification Coal Flotation
Route 2
Figure 1-2: Process circuit for the beneficiation of ultra-fine coal in order to mitigate ARD
The new process route 1 involves the froth flotation of coal and subsequent reflux classification
to produce a sulfide-rich concentrate and a sulfide-lean tailings.

6
The new process route 2 uses reflux classification to produce a sulfide-rich concentrate
followed by flotation to recover valuable coal and a sulfide-lean tailings.
Both process routes take advantage of the natural hydrophobicity of coal, and the difference in
densities between coal and sulfide minerals.
The two-stage froth flotation process described in Figure 1-1 (route 1) can be used as a bench
mark to assess the performance of the two new process routes in relation to the ‘standard
method’.
1.7.1. Objectives and key questions
The following are key questions related to this research:
Does combining reflux classification and froth flotation yield better results than either of
these processes on their own?
Are the sulfide-lean tailings from the two process routes in Figure 1-2 non-acid forming?
Do both process routes yield better results than the ‘standard’ UCT two-stage flotation
process?
Thus, the main objective of this research is to determine whether mitigating the ARD
generating potential of coal ultrafines and the concomitant recovery of saleable coal can be
improved by employing:
• Froth flotation followed by reflux classification, or • Reflux classification followed by froth flotation (Figure 1-2), compared to • Either of these on their own, or • Froth flotation followed by froth flotation (Figure 1-1)
The performance of each process route will be assessed based on:
• Coal recovery in the ‘valuable coal’ streams, and • ARD generating potential of the ‘sulfide-lean tailings’ streams.
1.7.2. Hypothesis
1. Combining reflux classification and froth flotation (Figure 1-2) will give better results in
terms of mitigating the ARD generating potential of coal ultrafines and enhancing coal recovery
compared to the UCT two-stage froth flotation process (Figure 1-1). This is because, during
flotation, it is difficult to depress coal when floating sulfur, as coal is naturally hydrophobic,
while on the other hand, gravity separation takes advantage of the large difference in density
between coal and pyrite.

7
2. In addition, as reflux classification is expected to perform better at desulfurization than
froth flotation, because of the large difference in density between coal and pyrite, the
sulfide-lean tailings from the process routes in Figure 1-2 are expected to be non-acid
forming.
1.7.3. Scope of thesis
The scope of this thesis is to determine whether a combination of froth flotation and reflux
classification is better at mitigating ARD and recovering valuable coal than the UCT two-stage
flotation process.
The major equipment used in this study are a laboratory scale batch flotation cell, and a reflux
classifier. Froth flotation was conducted at UCT, and reflux classification at NWU. Standard
static ARD tests were conducted at UCT to determine the acid generating potential of all
samples in the process (feed, concentrate and tailings) from both stages of both process routes.
Samples of coal from the Waterberg and Witbank coalfields were used in this study. Most coal
production in South Africa at present is from the Witbank coalfield. However, future coal
production will come from the Waterberg coalfield, which contains a large amount of South
Africa’s remaining in situ bituminous coal reserves (Jeffrey, 2006). Both samples were provided
by Exxaro.
In the flotation test work, the study did not attempt to convert the sulfur-rich concentrate into
saleable products or conduct research pertaining to it. However, attempts were made to
optimize the flotation process in terms of reagent types and dosages, with all other factors kept
constant.

8
2. CHAPTER TWO - LITERATURE REVIEW
2.1. Introduction
This chapter presents a brief overview of literature in the areas of acid rock drainage, coal
flotation and reflux classification (ARD). The review begins by describing the concept of ARD,
the mitigation of ARD and characterization test methods available. This is followed by a
discussion of South African coals and current beneficiation methods. Coal flotation and
desulfurization by flotation are then discussed, with particular reference to the research at UCT.
Finally, a review is given on reflux classification.
2.2. Fundamental Concept of Acid Rock Drainage (ARD)
2.2.1. ARD overview
Acid rock drainage (ARD), also known as acid mine drainage (AMD) is generated as a result of
the oxidation of sulfide minerals in the presence of water, oxygen and sulfur oxidizing bacteria.
In coal mining operations, ultrafine coal wastes are generated and consequently disposed of in
slimes dams. These disposed wastes contain sulfide minerals, particularly pyrite, which when
oxidized in the presence of water and oxygen produces ARD.
The presence of ARD reduces the pH of the surrounding soil to as low as 2-3 and the reaction
can cause heavy metals such as iron, copper and silver to leach from the waste and
consequently pollute the environment.
It is known that coal ultrafine tailings also contain alkaline minerals that are capable of reducing
the acidic drainage to maintain a neutral pH for weeks or months depending on the type of
alkaline material (Broughton, 1992); however, these minerals are often insufficient to
completely neutralize the acid formed. As a result the pH drops, leading to more rapid
oxidation reactions, which increase the rate of acid production.
According to EPA (1994), the following reaction occurs between pyrite, oxygen and water:
2FeS2 + 2H20 + 7O2 → 4H+ + 4SO42− + 2Fe2+ (2-1)
There are other sulfide minerals present in coal, but pyrite is the most important mineral
associated with ARD (Gray, 1997). The oxidation of pyrite as shown in Equation 2-1 produces
hydrogen, sulfate ions and iron (II) known as ferrous ions.
As the pH reduces further, ferrous ions are further oxidized to ferric ions as shown:
4H++O2 + 4Fe2+ → 2H2O + 4Fe3+ (2-2)

9
The above reaction is catalyzed by Thiobacillus ferroxidans; a bacteria that is effective at low pH
of about 3.5.
When non-contaminated water flows past the drainage path, the water becomes acidic and
consequently contaminates the soil and aquifer. Due to the increasing concern about ARD in
South Africa, studies have been carried out to ascertain the impact on South African soil.
Geldenhuis & Bell (1998) highlighted that the Witbank coalfield is highly affected by ARD, as a
result of the high sulfur content generally found in coals from the Witbank area (Gray, 1980;
Bergh et al., 2013).
2.2.2. Factors affecting ARD
There are various factors affecting ARD generation, one of which is the secondary factor, which
contributes to the reduction of acid generation either by reacting with the acid produced or by
reacting with the minerals (pyrite) that cause the production of acid (Ferguson et al., 2009;
Broughton, 1992). The main factor is the reaction of alkaline (carbonate) minerals such as
calcium carbonate/ calcite (CaCO3), magnesium carbonate/dolomite (CaMg(CO3)2) and
magnesite (MgCO3) with the acid to form neutral compounds which effectively increase the pH
and reduces the generation of acid. The reaction below depicts the neutralization that occurs
in the presence of these alkaline minerals, particularly calcite:
4𝐹𝑒𝑆2 + 8𝐶𝑎𝐶𝑂3 + 6𝐻2𝑂 + 15𝑂2 → 4𝐹𝑒(𝑂𝐻)3 + 8𝐶𝑎2+ + 8𝐶𝑂2 + 8𝑆𝑂42− (2-3)
Although these minerals are present in coal, more alkaline minerals are required to neutralize a
certain amount of pyrite (the reaction between the alkaline (CaCO3) and the pyrite is on a ratio
of 2:1). Table 4-2 shows the minerals present in the coal samples used in the experimental work
of this thesis, and it is seen that the Witbank sample does not contain sufficient neutralizing
minerals.
2.2.3. Prevention of ARD
An understanding of the factors contributing to ARD is important when considering preventive
measures to control ARD. Primary factors such as water and oxygen are known to contribute to
the generation of ARD, so controlling the presence of these factors will effectively control the
rate of acid generation.
Control of ARD maybe undertaken in two ways: at-source control, which deals with the
treatment of the acid-producing rock directly thereby stopping the production of acid, and
mitigation control, which is further divided into active and passive processes (Johnson &
Hallberg, 2005). Active processes deal with the addition of alkaline minerals to increase the pH
of water and consequently precipitate metals, while passive processes deal with the use of
natural or constructed wetland ecosystems (Johnson & Hallberg, 2005; Luptakova et al., 2012).
At-source control is preferable to the treatment options as the progress of ARD once started is

10
difficult and very expensive to control. In addition, most treatment options do not address the
problem on a long-term basis, but rather seek to control the problem rather than completely
eliminating the production of acid.
The following are primary measures currently used in mitigating ARD (MEND, 1994; Skousken et
al., 2000; Akcil & Koldas, 2006; Johnson and Hallberg, 2005):
1. Addition or application of bactericides: control the bacteria required for reaction 2
(Equation 2-2). The inhibition of the bacteria results in the suppression of reaction 2,
and consequently leads to the control of ARD.
2. Disposal of waste under wet cover, which reduces the availability of oxygen
3. Removal of sulfide minerals from waste before disposal
4. Converting ultrafine wastes to useful products
5. Controlling the availability of water to pyritic materials
6. Underground storage of mine tailings
7. Blending mineral wastes
8. Addition of anionic surfactant
9. Installation of dry barriers: wastes are disposed of in materials that hinder the
movement of water and oxygen
Currently, over 10 million tons of ultrafine coal (<150 µm) is discarded in South Africa every
year (Reddick et al., 2007). Due to the high sulfur content of these ultrafine discards, there is
need for at-source prevention of ARD. Desulfurization is known to be an effective way of
mitigation and several methods such as flotation has been extensively studied, and are
explained in Section 2.5. However, no circuit or plant exists in South Africa specifically for coal
desulfurization. In this thesis, the focus will be on the removal of sulfide minerals from waste
before disposal (desulfurization).
2.2.3.1. Desulfurization of coal
As mentioned above, there is a need to mitigate ARD generation due to the increasing
generation of ultrafine coal wastes in South Africa containing pyritic sulfur. Most of the
methods currently used to control ARD are insufficient in terms of their ability to effectively
inhibit the production of ARD on a long term basis. Desulfurization is known to be the only
effective method of ARD control (Benzaazoua et al., 2000). Figure 2-1 shows the outcome
expected in a coal ultrafine waste desulfurization process, where AP and NP represent the acid
potential and neutralizing potential of the sample, respectively.
The desulfurization process consists of separating an initial acid generating waste into a sulfide
concentrate and a tailings containing negligible amount of sulfide, which can be considered
harmless. The desulfurized tailings from the process should contain sufficient neutralizing

11
minerals to nullify the acid producing potential of the remaining sulfide minerals; this is
measured using various characterization test methods described in the sections that follow.
Research in coal desulfurization is discussed in Section 2.6 below.
Initial acid generating waste
AP
NP
AP + Security = NP
Non acid generating desulfurized tailings
Sulfide concentrate
AP > NP
Figure 2-1: Desulfurization technique (Bois et al., 2004)
2.2.4. ARD characterization tests
The ability to accurately predict the acid potential of a sample is important in mitigating ARD.
Static tests, kinetic tests and mathematical modeling are the three commonly used methods of
characterization (MEND, 1994).
Static tests are preliminary indicators, and are easy, quick and inexpensive to conduct. Static
tests determine both the total acid potential (reactive sulfide minerals) and neutralizing
potential (acid consuming minerals) of a sample. From the values obtained, the capacity of the
sample to generate ARD is determined either as the ratio of the two values or from the
difference in the values. Drawback in the use of static tests is that they do not distinguish
between the various acid consuming minerals and their neutralizing potentials (Coastech
Research, 1991). In the light of this short coming, Paktunc (1999) showed that mineralogical NP
(identifying minerals present in the sample) makes it possible to interpret the meaning of NP in
terms of its ability to control ARD; this is termed mathematical modelling. Kinetic tests are
useful in providing more information on the rate of sulfide oxidation and neutralization, the
drainage chemistry and the predicted time of ARD generation (Price et al., 1997). The biokinetic
test is a kinetic test method developed at UCT, which provides information on the relative
kinetics of acid neutralizing and generating reactions based on microbial activities (Hesketh et

12
al., 2010). This test is also time consuming, requiring some 70 days to complete (Kazadi
Mbamba et al., 2012).
Thus the ARD characterization tests to be employed in this thesis will be the static tests. There
are a number of static tests, each addressing the same variable with minor deviations in the
procedures (Broughton, 1992). These methods are discussed below:
2.2.4.1. Acid base accounting (ABA)
Acid base accounting (ABA) is a widely used method for the classification of AP and NP of a
sample (Lawrence et al., 1989). This method was invented in 1974, and was modified in 1978 by
Sobek et al. (1978). Equation 2-3 is used in the determination of the net acid producing
potential (NAPP):
𝑁𝐴𝑃𝑃 = 𝑀𝑃𝐴 − 𝐴𝑁𝐶 (2-4)
As seen from Equation 2-4, the NAPP of a sample is determined as the difference between the
maximum potential acidity (MPA) and the acid neutralizing capacity (ANC) of the sample
(Stewart et al., 2009).
The MPA, often referred to as the acid producing potential APP, is determined by multiplying
the total sulfur content in the sample by a factor of 30.6, with the assumptions that two moles
of acid will be produced per mole of sulfur and that all the sulfur in the sample reacts (Coastech
Research, 1989). The ANC, also referred to as the neutralizing potential (NP), is determined
either by direct titration with an acid or back titration with a strong acid such as HCl and a
strong base such as NAOH. The resulting amount of acid in the sample is determined in the
reaction between the acid and the sample. The NAPP value obtained could be negative or
positive depending on the values of the MPA and ANC.
A major setback in using the ABA is the tendency to overestimate the ANC value due to the use
of a strong acid (HCl). This acid can dissolve minerals which would not otherwise react to
maintain a drainage pH within an environmentally acceptable range. The ANC value can also be
underestimated by the influence of metal hydroxides formed during the titration process with a
strong base such as NAOH (Stewart et al., 2009). The ANC value does not provide an indication
of the reactivity of the acid neutralizing capacity of the sample, nor its availability to completely
neutralize the acids produced within the sample. Hence the net acid generating (NAG) test is
often used together with ANC test to give a more accurate description of the acid producing
potential of the sample.
2.2.4.2. Net acid generating (NAG) test
This test gives a value for the net acid or neutralizing capacity of a sample. It does not provide a
measure of the total sulfur content as the ABA test does, but is based on the oxidation of

13
sulfide minerals with hydrogen peroxide. The pH of the solution is determined, and then
titrated to pH 7, and the resulting value obtained is the NAPP value of the sample.
Table 2-1 summarizes the results expected for both tests individually and as a combination.
Table 2-1: ARD classification using ABA and NAG static tests (Stewart et al., 2009)
ARD characterization
method
Result
Unit
Classification
Acid Base
Accounting
NAPP > 20 -20 < NAPP < 20
NAPP < -20
kg H2SO4/t
Acid forming Potentially acid forming
Non-acid forming
Net Acid
Generation
NAG pH < 4 & NAG pH7 > 10 NAG pH < 4 & NAG pH7 = 5-10
NAG pH > 4
kg H2SO4/t kg H2SO4/t
pH
Acid forming Potentially acid forming
Non-acid forming
Combined static tests
NAG pH < 4.5 and NAPP > 0 NAG pH > 4.5 and NAPP < 0
Potentially acid forming Non-acid forming
From Table 2-1, a sample with NAG pH less than 4 is classified either acid forming or potentially
acid forming depending on the NAGpH7 value, while a sample with NAG pH greater than 4 is
classified non-acid forming. As oxidation of sulfide minerals with hydrogen peroxide yields acids
which react with the neutralizing minerals in a particular sample, a sample with high
neutralizing capacity or low acid production should have a high pH, thus making it non-acid
forming and vice versa. From the ABA test indicators, an NAPP value greater than 20 kg H2SO4/t
indicates that there are more acids than neutralizing minerals present in the sample. An NAPP
value lower than -20 kg H2SO4/t indicates a non-acid forming sample. NAPP values ranging from
-20 to 20 kg H2SO4/t indicate samples that have the potential to generate acids.
Figure 2-2 is an ARD classification plot showing acid forming and non-acid forming regions
based on the pH and the NAPP value of a sample. This is obtained by combining both ABA and
NAG tests, as in Table 2-1. As seen from Figure 2-2, a sample is classified NAF (non-acid
forming) when it lies above pH ≥ 4.5 and has a negative NAPP value, and a sample is classified
PAF (potentially acid forming) when it lies below pH ≤4.5 and has a positive NAPP value.
Samples are classified as uncertain when they lie above pH ≥ 4.5 and have a positive NAPP
value, or below pH ≤ 4.5 and have a negative NAPP value.
These tests will be used in this thesis to determine the performance of flotation and reflux
classification in desulfurizing South African coal wastes.
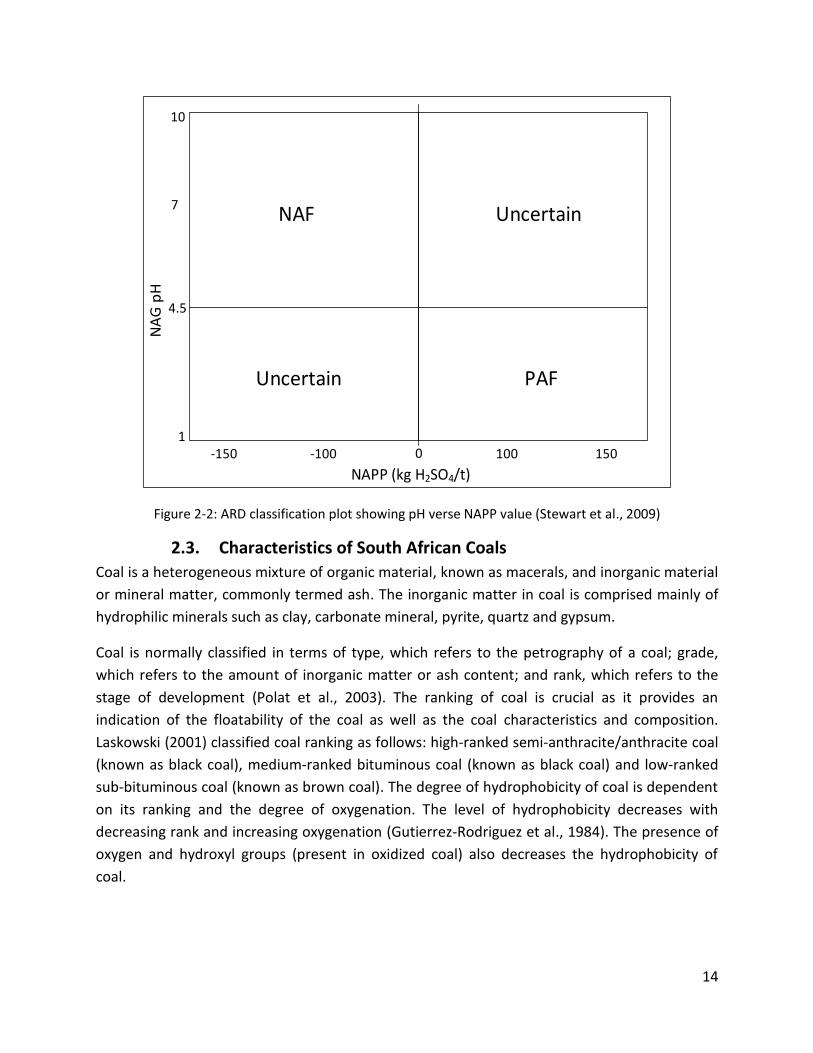
14
0-100-150 150100
7
10
1
4.5
NA
G p
H
NAPP (kg H2SO4/t)
NAF
PAFUncertain
Uncertain
Figure 2-2: ARD classification plot showing pH verse NAPP value (Stewart et al., 2009)
2.3. Characteristics of South African Coals
Coal is a heterogeneous mixture of organic material, known as macerals, and inorganic material
or mineral matter, commonly termed ash. The inorganic matter in coal is comprised mainly of
hydrophilic minerals such as clay, carbonate mineral, pyrite, quartz and gypsum.
Coal is normally classified in terms of type, which refers to the petrography of a coal; grade,
which refers to the amount of inorganic matter or ash content; and rank, which refers to the
stage of development (Polat et al., 2003). The ranking of coal is crucial as it provides an
indication of the floatability of the coal as well as the coal characteristics and composition.
Laskowski (2001) classified coal ranking as follows: high-ranked semi-anthracite/anthracite coal
(known as black coal), medium-ranked bituminous coal (known as black coal) and low-ranked
sub-bituminous coal (known as brown coal). The degree of hydrophobicity of coal is dependent
on its ranking and the degree of oxygenation. The level of hydrophobicity decreases with
decreasing rank and increasing oxygenation (Gutierrez-Rodriguez et al., 1984). The presence of
oxygen and hydroxyl groups (present in oxidized coal) also decreases the hydrophobicity of
coal.

15
The presence of macerals determines the petrography or type of coal. Macerals are discrete
organic entities and are classified into three main groups, each having different physical and
chemical characteristics:
1. Inertinite: Inertinite has higher carbon content than the other maceral types, and is
more aromatic, hence containing a low content of volatile matter (Falcon & Ham, 1988).
Inertinite is more prone to oxidation (due to the presence of oxygen), and is commonly
found in the Witbank coalfield (Jeffrey, 2005).
2. Vitrinite: This is the most abundant maceral in coal and its presence determines the
floatability of the coal. According to Faure & Willis (1996), vitrinite is the dominant
maceral group in the Waterberg coalfield, particularly in the Grootegeluk formation.
3. Exinite: This is not commonly found in bituminous coals (Falcon & Ham, 1988). Coals
high in exinite are more floatable than coals containing vitrinite and inertinite macerals.
Table 2-2 compares South African coals with coals from other parts of the world in terms of
their relative density, maceral, mineral and sulfur content.
Table 2-2: South African coal relative density, maceral and sulfur content with respect to other regions in the world (Falcon, 1977; Sanders & Brookes, 1986; Kalenga, 2011; Thomas, 2013; Eberhard, 2011)
Location
Macerals
Carboniferous coal, Germany
Permian, South Africa
Permian Tertiary, America
Vitrinite 70 40 82
Exinite 15 0 40
Inertinite 15 60 10
Minerals 3 14 2
Sulfur content 0.3 - 2 % 0.2 - 1 % 3 - 7 %
Relative density < 1.4 >1.4 -
South African coals clearly have a higher mineral content (mainly clay), about 90 % of which is
intergrown in the coals (Sanders & Brookes, 1986), which results in a high content of true
middlings (due to high intergrown minerals). Therefore, gravity separation becomes difficult as
unwanted particles inevitably report to the overflow (South African coals are classified as ‘very’
difficult to beneficiate). Table 2-2 also shows that South African coals have a high content of
inertinite macerals, which poses a problem in flotation as inertinite macerals are the least
hydrophobic and more prone to oxidation.

16
Another significant property of South African coals is their high relative density ranging from 1.4
to 2.0 (Sanders & Brookes, 1986), on account of the high ash content (relative density is
indicative of ash content). The high density (mainly due to the presence of true middlings) is
similar to the density of inertinite macerals, which makes beneficiation even more difficult.
Kalenga (2011) performed analysis of coal samples from six collieries in South Africa; he found
that the average sulfur content was about 0.92 %. This shows that South African coals generally
have a low sulfur content (<2 %) compared to coals from other parts of the world (Snyman &
Botha, 1993).
The most important coalfields in South Africa are the Waterberg and Witbank coalfields. These
are used in the experimental work in this thesis, and are discussed in the sections that follow.
2.3.1. Waterberg coalfield
The Waterberg coalfield is found in the Kalahari basin in the northwest of South Africa, as
shown in Figure 2-3. It differs from other coalfields in South Africa as it contains interlocked
carbonaceous mudstones, with thickness varying from tens of millimetres to a few metres, as
well as more vitrinite macerals (Faure & Willis, 1996, Fabiańska & Kruszewska, 2003). It is
subdivided into two sections: the Grootegeluk formation, which constitutes the upper section
of the coalfield, and the Vryheid formation, which constitutes the lower section (carbonaceous
shale and sandstone with five coal seams).
Mining operations in the Grootegeluk formation have shown that the yield of clean coal is
usually less than 50%, with an ash content of about 35% after beneficiation (Jeffrey, 2006). The
Vryheid formation has been less explored, but is expected to produce higher grade coal than
the Grootegeluk formation (Jeffrey, 2006).
Mining operations in the Waterberg coalfield commenced in the early 1980s (Peatfield, 2003),
to supply Eskom’s 3.7 GW Matimba power station. Exxaro’s greenfield Thabametsi mine in the
Grootegeluk region is expected to supply 17 million tons per year to the new 4.8 GW Medupi
power plant when it is fully commissioned (Mining News, 2014). In light of current and future
activities in the Waterberg coalfield, it is expected to be the future major source of coal in
South Africa as it contains a large amount the country’s remaining in situ bituminous coal
reserves (Jeffrey, 2005). This reserve is estimated at 48.3 billion tons, accounting for 72% of the
country’s total estimated coal reserves (Mining News, 2014).
2.3.2. Witbank coalfield
The Witbank coalfield has been exploited over many years and has been the main source of
coal for power generation in South Africa; however, its coal reserves are nearing depletion
(Jeffrey, 2005). The coalfield lies towards the northern extent of the Karoo basin to the east of
Johannesburg. There are five coal seams, named consecutively from 1 to 5. Seam 1 contains

17
high grade steam coal, suitable for export. Seam 2 contains good quality coal with discrete coal
zones of varying coal quality. The upper part of the seam is normally unmineable, while the
lower part of the seam contains coal of high quality (mined for export purposes since the early
1970s), and is the main source of most of the steam coal burned by Eskom. Seam 3 is of high
quality, but known to be uneconomic, while coal in seam 4 is economically important, but of
lower quality than seam 2. Coal seam 5 is of higher quality, having the highest calorific value; it
is mined as a source of blend coking and for metallurgical purposes (Jeffrey, 2005).
Figure 2-3: Location of the Waterberg and Witbank coalfields in South Africa (Pinetown et al., 2007; Eberhard, 2011)
The differences between Waterberg and Witbank coal are summarized below:
Petrography: Table 2-3 shows the petrography and sulfur content of different South
African coals in terms of their maceral content. Witbank coal consists largely of
inertinite macerals while Waterberg coal is high in vitrinite macerals (Fabiańska &
Kruszewska, 2003). In addition, the sulfur content of Witbank coal is generally higher
than that of the Waterberg coal.
Ash content: The ash content in Waterberg coal is over 50 % while that of the Witbank
coal is below 40 % (Jeffrey, 2005). The greater the ash content, the less hydrophobic the
coal, which would require relatively high reagent dosage to float.
Floatability: Waterberg coal is more floatable as it contains more vitrinite macerals.
Waterberg
Witbank

18
Coal reserves: Witbank coal reserves are nearing depletion while the Waterberg
coalfield will be the future major source of coal as it contains a large amount of South
Africa’s remaining in situ bituminous coal reserves (Jeffrey, 2005).
Table 2-3: Petrography differences in South African coals adapted from (Gray et al., 1980)
Coal Maceral Analysis
Vitrinite (%)
Exinite (%)
Inertinite (%)
Sulfur (%)
Waterberg 83.2 4.2 5.7 1.04
Witbank 50.8 12.1 21.5 2.88
Sigma (Free State) 27.9 3.1 58.9 1.08
2.4. Beneficiation of South African Coals
Because of their poor quality, South African coals generally require beneficiation;
unfortunately, they are of low grade, and generally contain highly intergrown mineral matter,
which makes them difficult to beneficiate. A typical flow sheet for a washing plant treating
South African coal at different particle sizes is shown in Figure 2-4.
Product
Discards
Product
Discards
Product
Discards
Product
Discards
Crushing and Screening
Dense Medium Baths
Dense Medium Cyclones
Dense Medium Cyclones Spirals
Thickening and Filtration Flotation
Coarse coal>25 mm
Intermediate coal1 - 25 mm
Fine coal0.15 – 1 mm
Ultra-fine coal<0.15 mm
Coal
Figure 2-4: Block flow diagram of a typical South African coal washing plant adapted from (Reddick et al., 2008)
Coarse particles greater than 25 mm are normally cleaned using dense medium baths. Small or
intermediate particles between 1 and 25 mm are washed using dense medium cyclones. Most
19
plants utilize single or double stage washing, depending on the ease of separation (SACRM,
2011).
Fine coal refers to the underflow of a screen with 1 mm aperture size, and has typically been
beneficiated using spirals in most South African coal plants in the 1970s. The Greenside colliery
was the first to install a dense medium cyclone circuit to treat fines (Fourie et al., 1980), for the
production of low ash coal. Spirals cannot produce low ash coal of export quality (De Korte,
2002) because of their poor efficiency of separation.
The best established method for ultrafine coal beneficiation is froth flotation, which is used
widely in Europe and Australia which have high grade coals. The limitation of froth flotation in
low ash production is the poor liberation of minerals (intergrown minerals) present in South
African coals even at small particle sizes. Thus froth flotation is only suitable when products of
higher ash content are acceptable (Horsfall, 1980). In most cases, ultrafine particles with size
less than 0.1 mm, were typically de-watered using a thickener, and disposed of in slimes dams.
Recently, however, some plants in the Witbank coalfield have started beneficiating fines and
ultrafines via flotation. The first multicell flotation plant was installed at Greenside colliery in
2002, which consists of four primary and secondary cells (Swanepoel, 2012; Peatfield, 2003). In
2007, the Goedehoop fines plant was commissioned, with the aim of making use of flotation
and filtration to produce good quality coal. It consists of nine multicell flotation units, two
plate-and-frame presses and a tailings thickener. In 2012, the plant was upgraded to the
ENPROTEC Dual Cell Technology to increase production output by 50 % (Swanepoel, 2012).
Other plants, depending on the grade of the ultrafines, have installed filter presses, and the
material too fine to be treated in spirals is filtered and added to steam coal production, which
reduces the amount of tailings disposed. No plant, however, attempts to desulfurize ultrafine
tailings, although this has been shown to be possible using flotation. This is discussed in the
next section.
2.5. Desulfurization of South African Coal by Flotation
2.5.1. Flotation overview
Flotation is a versatile method of separating valuable minerals from non-valuable minerals
based on differences in surface properties. The mechanism of flotation involves the coexistence
of solid (ore particles), liquid (water) and gas (air bubbles). The particles are suspended in the
liquid, while gas bubbles are dispersed into the system, leading to the attachment of desired
particles on to the rising air bubbles and the consequent retention of undesired particles in the
liquid (Kawatra, 1995). The flotation process consists of two discrete phases: the pulp phase in
which the valuable minerals are attached to the air bubbles due to their hydrophobicity, and
the froth phase in which the minerals are separated and recovered (Kawatra, 1995). The

20
agitator in the pulp phase provides the energy for collision of particles and bubbles to occur,
which results in the attachment of the air bubbles on to the particles.
The valuable minerals are rendered hydrophobic by the addition of reagents known as
collectors, which enables these minerals to adhere to the air bubbles. This method of recovery
is known as true flotation. The non-valuable minerals, which are hydrophilic, or may be
rendered so by the addition of different reagents known as depressants, do not attach to the
air bubbles and consequently remain in the pulp phase where they are recovered as tailings.
In addition to true flotation, some particles report to the froth phase via entrainment and
entrapment. Entrainment is a non-selective method of particle recovery in which particles
suspended in the water are carried with the air bubbles from the pulp phase to the froth phase
(Kirjavainen, 1996). Entrapment is a phenomenon that occurs when the particles are trapped
between the air bubbles in the froth phase.
2.5.2. Factors affecting coal and mineral flotation
There are many factors affecting flotation, some of which are described in Figure 2-5. For the purpose of this thesis, only the chemical and material parameters will be discussed in the sections that follow.
FLOTATION SYSTEM
CHEMICAL PARAMETERS Type of reagent Reagent concentration Mineral solution chemistry
MATERIAL PARAMETERS Particle size and composition Mineralogy Coal ranking and petrography
EQUIPMENT PARAMETERS Airflow and cell design Agitation and Solids suspension
OPERATIONAL PARAMETERS Condition time Froth removal rate Impeller speed, froth height Method of chemical addition Temperature
Figure 2-5: Factors affecting flotation process adapted from (Polat et al., 2003)

21
2.5.2.1. Flotation reagents
A. Collectors
Collectors are reagents used to induce hydrophobicity of particles. This is achieved by rendering
the mineral surface water-repelling (Bulatovic, 2007).
There exist four classes of collectors namely: cationic, anionic, amphoteric and oily or non-
ionizing collectors (Stonestreet & Franzidis, 1988; Bulatovic, 2007). In this thesis, anionic and
oily collectors are of interest. Anionic collectors are used when dealing with mineral surfaces
that are positively charged; collectors such as metal xanthates are used as sulfide collectors. In
the case of coal, oily collectors such as kerosene and diesel have been predominately used
because of their low cost to render the coal particles more hydrophobic in order to achieve
greater recovery (Jia et al., 2002).
However, with the increasing demand on high quality coal and environmental considerations,
novel collectors such as Nalflote are now been considered. Nalflote 9858 is a synthetic collector
manufactured by NALCO Company, and amongst other novel collectors shows promise in terms
of its high selectivity, high yield and low dosages required in the flotation process (Eraydin et
al., 2012; Mashilo & Modukanele, 2012; Howlett & Marsden, 2013).
B. Frothers
Frothers are surface-active reagents used to stabilize air bubbles. The stability of the bubbles is
crucial in froth flotation, and frothers help strengthen the bubbles to prevent collapse or
coalescence. Frothers accumulate at the water/gas interface and interact with collector
molecules that are attached on to the particles. Alcohol frothers such as MIBC are more
effective when dealing with fines because they produce smaller bubble size (Kawatra, 1995;
Gupta et al., 2009; Klimpel, 1992). MIBC will be used in the experimental work in this thesis as it
is the most commonly used frother and was used before in coal desulfurization flotation work
at UCT (Stonestreet & Franzidis, 1988; Kawatra, 1995; Kazadi Mbamba et al., 2012).
C. Depressants
Depressants prevent particles from floating by making the surfaces hydrophilic (Kawatra, 1995).
In the case of coal flotation, depressant is not used due to the natural hydrophilicity of the
unwanted minerals; however, when floating pyrite from coal, depressant is needed to suppress
the coal. This is not always effective as coal tends to float regardless of the addition of
depressant (due to its hydrophobic nature), thereby decreasing the grade of pyrite in the
concentrate.
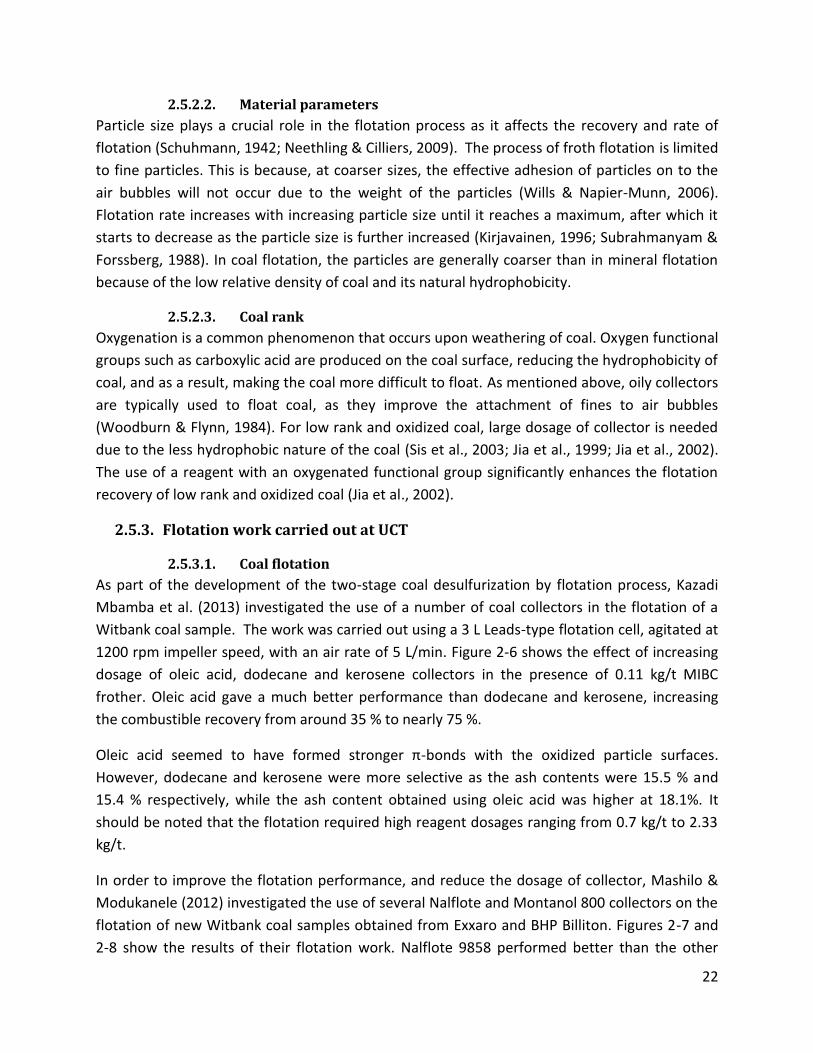
22
2.5.2.2. Material parameters
Particle size plays a crucial role in the flotation process as it affects the recovery and rate of
flotation (Schuhmann, 1942; Neethling & Cilliers, 2009). The process of froth flotation is limited
to fine particles. This is because, at coarser sizes, the effective adhesion of particles on to the
air bubbles will not occur due to the weight of the particles (Wills & Napier-Munn, 2006).
Flotation rate increases with increasing particle size until it reaches a maximum, after which it
starts to decrease as the particle size is further increased (Kirjavainen, 1996; Subrahmanyam &
Forssberg, 1988). In coal flotation, the particles are generally coarser than in mineral flotation
because of the low relative density of coal and its natural hydrophobicity.
2.5.2.3. Coal rank
Oxygenation is a common phenomenon that occurs upon weathering of coal. Oxygen functional
groups such as carboxylic acid are produced on the coal surface, reducing the hydrophobicity of
coal, and as a result, making the coal more difficult to float. As mentioned above, oily collectors
are typically used to float coal, as they improve the attachment of fines to air bubbles
(Woodburn & Flynn, 1984). For low rank and oxidized coal, large dosage of collector is needed
due to the less hydrophobic nature of the coal (Sis et al., 2003; Jia et al., 1999; Jia et al., 2002).
The use of a reagent with an oxygenated functional group significantly enhances the flotation
recovery of low rank and oxidized coal (Jia et al., 2002).
2.5.3. Flotation work carried out at UCT
2.5.3.1. Coal flotation
As part of the development of the two-stage coal desulfurization by flotation process, Kazadi
Mbamba et al. (2013) investigated the use of a number of coal collectors in the flotation of a
Witbank coal sample. The work was carried out using a 3 L Leads-type flotation cell, agitated at
1200 rpm impeller speed, with an air rate of 5 L/min. Figure 2-6 shows the effect of increasing
dosage of oleic acid, dodecane and kerosene collectors in the presence of 0.11 kg/t MIBC
frother. Oleic acid gave a much better performance than dodecane and kerosene, increasing
the combustible recovery from around 35 % to nearly 75 %.
Oleic acid seemed to have formed stronger π-bonds with the oxidized particle surfaces.
However, dodecane and kerosene were more selective as the ash contents were 15.5 % and
15.4 % respectively, while the ash content obtained using oleic acid was higher at 18.1%. It
should be noted that the flotation required high reagent dosages ranging from 0.7 kg/t to 2.33
kg/t.
In order to improve the flotation performance, and reduce the dosage of collector, Mashilo &
Modukanele (2012) investigated the use of several Nalflote and Montanol 800 collectors on the
flotation of new Witbank coal samples obtained from Exxaro and BHP Billiton. Figures 2-7 and
2-8 show the results of their flotation work. Nalflote 9858 performed better than the other

23
collectors, with combustible recovery of 80 %, at low collector dosage of about 0.3 kg/t.
Montanol 800 was less selective than the others, as the ash content was higher at all dosages,
as shown in Figure 2-8.
Figure 2-6: Coal flotation of Witbank coal using oily collectors (Kazadi Mbamba et al., 2013)
Figure 2-7: Combustible recoveries of clean coal during flotation with Nalflote collectors and Montanol 800 on Witbank (Exxaro) coal (Mashilo & Modukanele, 2012)
15
25
35
45
55
65
75
0.5 1.0 1.5 2.0 2.5 3.0
Com
bu
stib
le
reco
ver
y,
%
Collector dosage, kg/t
Dodecane
Oleic acid
Kerosene

24
Figure 2-8: Product ash content of clean coal with Nalflote collectors and Montanol 800 during floation of Witbank coal at 0.28 kg/t MIBC frother (Mashilo & Modukanele, 2012)
It is worth noting that the high recoveries were obtained using these novel collectors at low
collector dosages between 0.1 and 0.5 kg/t (Figure 2-7), compared to the high dosages required
when using oily collectors and oleic acid to obtain lower yields as seen in Figure 2-6. In addition,
lower ash contents were obtained when using novel collectors, as indicated in Figure 2-8. This
shows that these novel collectors are much more efficient in interacting with the coal surfaces
and rendering them hydrophobic. The lower dosages also lead to significant cost reduction.
Further flotation tests were carried out in the Department of Chemical Engineering at UCT by
Amaral Filho et al. (2011) on a Brazillian coal, and on a number of South African coal discards
using dodecane and oleic acid collectors. The results on the Brazilain coal showed that oleic acid
performed better in terms of yield (increase from 35 % to 56 %) than dodecane, however, the
ash content increased from 24.7 % to 42.4 % when going from dodecane to oleic acid. This
suggests that dodecane was much more selective than oleic acid. The coal flotation results on
the South African coal discards showed that oleic acid performed better in terms of recovery
and yield.
2.5.3.2. Pyrite flotation work
In parallel with the coal flotation work, Kazadi Mbamba et al. (2013) carried out research on
pyrite flotation at UCT primarily to mitigate ARD by removing the pyrite minerals from ultrafine
coal wastes. Xanthate collectors were predominantly used as they are typical sulfide collectors,
with increase in performance as the hydrocarbon chain increases (Dimou, 1986). In both

25
studies, yellow dextrin depressant was used as it was found to be the most effective coal
depressant.
Figure 2-9 shows the sulfur recoveries obtained using three xanthate collectors in the flotation
of the same Witbank coal on which coal flotation was carried out (Figure 2-6). As seen from the
figure, potassium amyl xanthate (PAX) produced the best recovery compared to sodium
isobutyl xanthate (SIBX) and sodium ethyl xanthate (SEX), with SEX performing the poorest.
PAX is known to be a stronger collector than the others due the presence of longer carbon
chains.
It should be noted that the flotation required high reagent dosages ranging from 0.7 kg/t to
2.33 kg/t, which would be uneconomical as xanthate collectors are expensive, costing ZAR
23,300/ton (Jera, 2013).
Figure 2-9: Comparison of sulfur recovery of three xanthate collectors for the Witbank coal. MIBC frother and dextrin kept constant at 0.11 and 0.93 kg/t respectively (Kazadi Mbamba et al., 2013)
Subsequent sulfide flotation carried out by Fisher and Toms (2013) on a sample of Waterberg
coal, using the same collectors as investigated by Kazadi Mbamba et al. (2013), showed similar
trends, as shown in Figure 2-10. Again, PAX was seen to perform better than SIBX and SEX,
however, the performance of PAX was poor on increasing the MIBC frother dosage from
0.11 kg/t to 0.28 kg/t. Again, low sulfur recoveries were obtained with SEX at the different
dosages investigated.

26
Comparing Figures 2-9 and 2-10, the high collector dosages used to achieve yields less than
30 % is very apparent. This is a limitation in using froth flotation, as the financial implication is
very high. In addition, xanthate collectors are environmentally hazardous (Liu et al., 2013). Due
to these limitations, the need to use other cost effective methods of desulfurization and
beneficiation is important. Gravity separation shows great promise with this regard, and is
explained in the next section.
Figure 2-10: Comparison of total sulfur recovery of three xanthate collectors for the Waterberg coal sample. MIBC kept constant for the first 4 dosages at 0.11 kg/t, and increased to 0.28 kg/t. Dextrin
dosage kept constant at 0.93 kg/t (Fisher and Toms, 2013)
2.5.4. Two-stage coal desulfurization by flotation
Miller (1975) investigated the use of two-stage flotation on American coal samples in an
attempt to remove pyrite from the clean coal product. The first stage involved coal flotation
and second stage sulfide flotation of the clean coal concentrate. Approximately 50 % of the
pyrite in the feed was reduced in the tailing of the first stage, and approximately 75 % of the
sulfur was further reduced in the second stage, leaving behind a benign tailings suitable for
disposal.
Other methods have been developed to improve desulfurization of fine and ultrafine coal. For
example, Demirbas & Balat (2004) compared the use of column and conventional flotation on
the sulfide flotation of low rank lignites. They found that sulfide flotation using columns can
produce a cleaner coal product than conventional flotation. In addition, the use of micro-

27
organisms and leaching has been shown to improve desulfurization, with over 90 % sulfur
removal (El Zeky & Attia, 1987; Ohmura & Saiki, 1994; Abdollahy et al., 2006).
The University of Cape Town has developed a two-stage flotation process for coal
desulfurization (Harrison et al., 2010), which involves two process routes: coal flotation in the
first stage and pyrite flotation of the tailings in the second stage (process route 1), and pyrite
flotation in the first stage and coal flotation of the tailings in the second stage (process route 2),
as shown in Figure 1-1. In process route 1, high grade salable coal is recovered in the first stage;
in the second stage, the tailing is further floated to produce an enriched sulfide stream and a
tailings containing negligible amount of sulfur. The second process route was deemed unviable
due to unwanted recovery of coal in the first stage (pyrite flotation), attributed to the natural
floatability of the coal. It should be noted that these processes differ from the two-stage
flotation process carried out by Miller (1975), which involves a second stage sulfide flotation of
the coal concentrate from the first stage.
Kazadi Mbamba et al. (2012) carried out the UCT two- stage process on a Witbank coal sample
containing 1.08 % sulfur, using static and biokinetic tests for ARD characterization.
Approximately 75 % of the total sulfur in the feed was recovered in the sulfide-rich concentrate,
leaving a non-acid forming (NAF) tailing sample. In the coal flotation stage, the sulfur and ash
recovered to the concentrate was about 90 %, which suggests that the coal flotation stage was
highly effective. The results are shown in Table 2-4.
Table 2-4: Two stage flotation results (first stage: coal flotation; second stage: sulfide flotation) of the Witban coal (Kazadi Mbamba et al., 2012) (PAF: potentially acid forming, UC: uncertain, NAF: non acid
forming)

28
Amaral Filho et al. (2011) continued work on four South African coal samples from the Witbank
coalfield, and a Brazilian coal sample. The results of the two stage flotation test on one of the
South African coal discards are shown in Table 2-5.
In all samples, over 75 % of the total sulfurs in the feeds were reduced in the benign, non-acid
forming, tailings. One of the samples contained 5.1 % sulfur, and approximately 94 % of the
total sulfur in the feed was recovered in the sulfide-rich concentrate, leaving a benign tailing
containing 0.2 % sulfur and 82 % ash. However, the coal flotation stage showed that the clean
concentrate still contained a large amount of sulfide and ash minerals (only about 20 %
reduction). This is seen to be a limitation as the performance of flotation is highly dependent on
a lot of factors as explained in Section 2.5.
Table 2-5: Two stage flotation results (first stage: coal flotation; second stage: sulfide flotation) of a Witbank coal (Amaral Filho et al., 2011) (AF: acid forming, NAF: non acid forming)
These discrepancies in the performances of both processes led to an investigation by Magabane
and Naidoo (2011). They investigated coal flotation performance on a series of South African
coal, and ascertained that, for some samples, the pyrite content was only reduced in the
tailings at the second stage, while for other samples, the pyrite was effectively removed after
the coal flotation stage. This difference was attributed to differences in the petrographic
nature, coal rank and sulfur deportment of the samples. This is a limitation in using the UCT
two-stage process in mitigating ARD, as in some cases, the clean coal could remain acid forming
depending on the coal type. Another limitation is the inefficient depression of coal in the
second stage flotation, and the large amount of xanthate collector dosages required.

29
Thus, froth flotation may be used in the desulfurization of coal; however, flotation
desulfurization has some serious limitations. Gravity separation, with particular reference to
the reflux classifier, has shown great promise in reducing the ash content in fine and ultrafine
coal wastes, and is not dependent on coal type and reagent dosages. Its performance in coal
desulfurization (although no work has yet been done on coal desulfurization) is expected to
show similar trends with its current application.
2.6. Gravity Separation of Coal and Pyrite
Gravity separation techniques are used to separate particles based on differences in their
relative densities. These methods are widely used due to their low capital and operating costs
as well their environmentally friendly operating conditions (Falconer, 2003). Gravity separation
technologies include: teetered bed separators (Nicol, 1998), conventional and centrifugal jigs,
shaking tables, hydro cyclones and cyclones, trays and cones, spirals and dense medium
separators.
Gravity separation of coal and pyrite could be a viable method compared to flotation due to the
large SG difference between pyrite (5.2) and coal (1.3-1.7). However, the efficiency of
traditional gravity separation equipment relies heavily on the particle size, with efficiency
decreasing for fine particles of about 100 µm (Laskovski et al., 2006).
New gravity separation technologies to improve the low efficiency on fines and ultrafines
separation have been developed and are discussed below:
2.6.1. Enhanced gravity separation techniques
These include the Falcon Separator, Knelson Concentrator and Mozley Multi-Gravity Separator,
all of which use centrifugal force to improve the separation of fines (down to 38 µm) based on
differences in specific gravity. This is achieved by applying artificial centrifugal force to enhance
particle settling velocities and in effect, increase the size range over which fine particles can be
effectively separated (Luttrell et al., 2000).
2.6.2. Reflux classifier
The reflux classifier is a novel piece of equipment designed to separate particles based on
density differences, with little or no dependence on particle size. The RC consists of a fluidizing
section and a lamellar section containing parallel inclined plates as illustrated in Figure 2-11.
Fluidization is a phenomenon that occurs when particles suspended in a fluid become
nonresistant to fluid flow (Richardson et al., 2002). The phenomenon of incline plates was first
discovered by Boycott (1920), who noticed that blood cells settled faster in test tubes that were
inclined than in tubes that were upright. Particles move up with the fluid via the inclined plates
where separation between low density and high density particles takes place. Low density
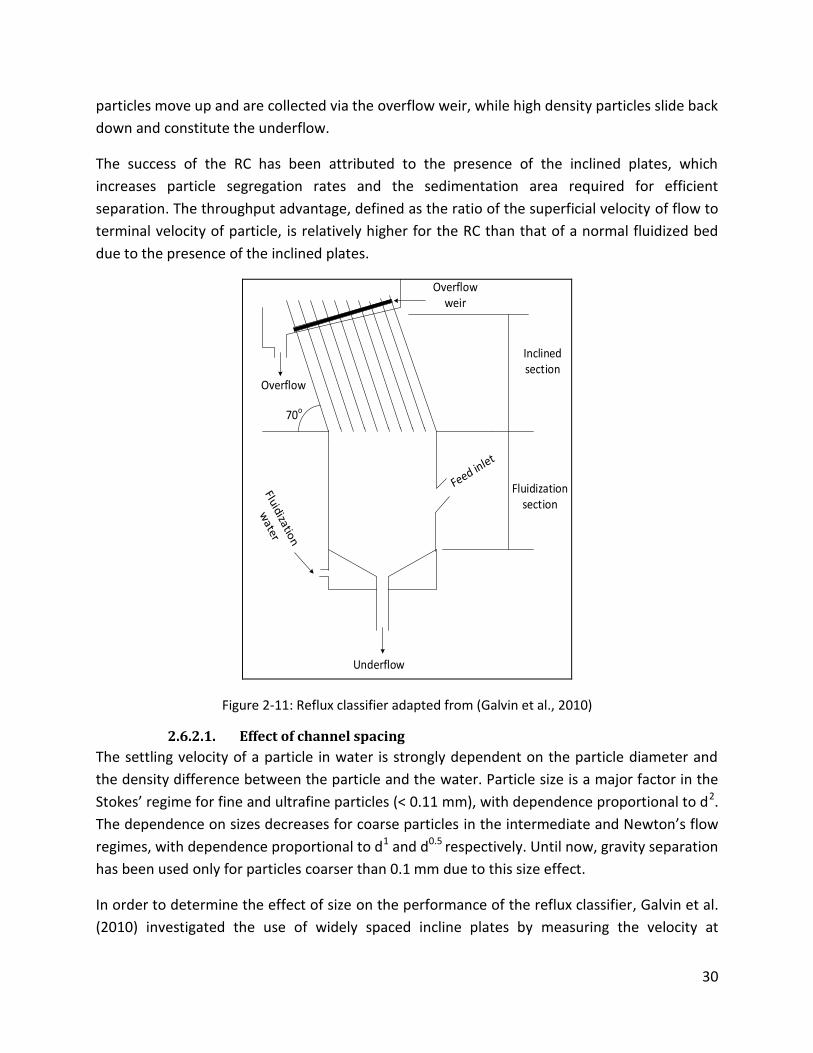
30
particles move up and are collected via the overflow weir, while high density particles slide back
down and constitute the underflow.
The success of the RC has been attributed to the presence of the inclined plates, which
increases particle segregation rates and the sedimentation area required for efficient
separation. The throughput advantage, defined as the ratio of the superficial velocity of flow to
terminal velocity of particle, is relatively higher for the RC than that of a normal fluidized bed
due to the presence of the inclined plates.
Inclined section
Fluidization section
Underflow
Overflow
Overflow weir
70o
Figure 2-11: Reflux classifier adapted from (Galvin et al., 2010)
2.6.2.1. Effect of channel spacing
The settling velocity of a particle in water is strongly dependent on the particle diameter and
the density difference between the particle and the water. Particle size is a major factor in the
Stokes’ regime for fine and ultrafine particles (< 0.11 mm), with dependence proportional to d2.
The dependence on sizes decreases for coarse particles in the intermediate and Newton’s flow
regimes, with dependence proportional to d1 and d0.5 respectively. Until now, gravity separation
has been used only for particles coarser than 0.1 mm due to this size effect.
In order to determine the effect of size on the performance of the reflux classifier, Galvin et al.
(2010) investigated the use of widely spaced incline plates by measuring the velocity at
31
different particle sizes. They found that as the particle size increased to about 2 mm, the
superficial velocity approached a constant value independent of particle size. This led to the
conclusion that widely spaced inclined plates are suitable for particles of -0.1 mm + 2 mm in
size.
Galvin et al. (2009) also investigated the use of closely space inclined plates in the separation of
ultrafine particles (< 0.1 mm). The system geometry consisted of 24 inclined plates each 1 mm
long with perpendicular spacing of 1.77 mm. It was shown that the use of closely spaced
inclined plates promotes a stable laminar flow condition, a shear induced lift force and a local
elutriation velocity near the surface of the inclined plates that is directly proportional to the
particle diameter. As the particles achieve the required inertial lift force, the contact force
responsible for friction and lubrication between the particles and the wall becomes negligible.
This effect, coupled with the local velocity associated with the particles, is sufficient to oppose
the terminal settling velocity of the particles, and suppresses the strong effect of particle size.
Other advantages achieved when using closely spaced inclined plates include:
Increased sedimentation area due to the use of inclined plates. It is also shown that
high density fine particles convey at the same velocity as lower density coarse particles
due to the inclination of the plates.
Increased pressure drop across the plates. This leads to separation solely based on the
density of particles and a more uniform flow across the unit, preventing blockage of
particle.
In general, reflux classification has been shown to be effective in separating particles of sizes
from as fine as 0.075 mm to coarse particles of about 8 mm. The success of RC is due to the
inclined plates that increase the sedimentation area and nullify the effect of particle size.
Research has primarily been performed on the separation of coal from mineral matter such as
ash. The results show a high recovery of up to 80 % in the size range of 2 mm to 0.25 mm
(Galvin et al., 2005); however, no work has been done on separating pyrite from coal.
2.6.2.2. Effect of angle of inclination and number of inclined channels
Laskovski et al. (2006) investigated the effect of increasing the number of inclined plates in the
reflux classifier. This investigation was performed on PVC, ilmenite and silica sand particles at
the same superficial velocity. The results showed that as the number of inclined channels
increased, the separation size decreased. Further increase in the number of plates resulted in a
significant increase in separation size. This implies that, as the number of plates increases,
lower density particles tend to undergo hydraulic conveying through the plates while higher
density particles segregate onto the plates and are reported to the underflow.

32
An experiment to investigate the effect of inclination angle was carried out by Laskovski et al.
(2006). The experiments were carried out at inclination angles of 70 0C, 60 0C and 45 0C. It was
found that at an angle of 70 0C, the separation was much sharper, as lower density particles
reported to the overflow.
At North West University (NWU), Rakgase et al. (2012) carried out settling tests using silica of
size range -300 + 53 µm. The sample was mixed and allowed to settle, and the distance was
recorded at different time intervals. The results showed that maximum settling occurred
between 600 and 80 0 inclination, with maximum separation achieved at 700 inclination.
2.6.2.3. Coal beneficiation using the reflux classifier
The application of the reflux classifier for coal beneficiation has been extensively studied. As
mentioned in Section 1, the reflux classifier has been used widely in ash and slime reduction.
Iveson et al. (2014) studied the use of two 600 mm X 600 mm pilot-scale reflux classifiers in
series for the beneficiation of -2 mm coal sample. Both reflux classifiers had close channel
inclined plates of 6 mm and 12 mm respectively. The first stage reflux classifier performed a
density separation producing a coal product containing fine high-ash slimes (-38 µ + 75 µm).
The second reflux classifier then washed the contaminated stream to produce clean coal
product. The result showed that a product ash of 16.5 % was achieved from a feed ash of 42 %.
The reject and slimes ash contents were 77 and 64 % respectively.
Prior to the investigation carried out by Iveson et al. (2014), Galvin et al. (2002) also performed
experiments on a 0.6 m X 0.6 m reflux classifier to assess its gravity separation and throughput
performance on a pilot scale using a -2 mm feed coal. The results showed a remarkable gravity
separation at high feed throughput and solids loading of 75 m3/m2 h and 47 t/m2 h respectively.
In addition, the product yield and ash contents were 87 % and 9 % respectively.
The performance of the reflux classifier has also been investigated at NWU by Rakgase et al.
(2012), using a laboratory scale 104 mm X 105 mm reflux classifier. Figure 2-12 shows the
washability curves obtained from fractionation tests and normal float and sink tests carried out
on Soutpansberg coal. The results showed good agreement at narrow size ranges. The major
advantage of fractionation tests over float and sink analysis is that it is less expensive, not time
consuming and does not require chemicals.

33
Figure 2-12: Comparison of reflux classifier fractionation test and conventional float sink on Soutpansberg coal of size range -600 + 500 µm (Rakgase et al., 2012).
Also at NWU, Smith et al. (2014) carried out laboratory scale reflux classification experiments
on two coal samples with size ranges from -1400 + 500 µm and -1400 + 0 µm. He confirmed
that the laboratory scale reflux classifier unit successfully generated coal washability curves,
and found that a linear relationship exists between sample density and volumetric flow rate.
This linear relationship suggests that as the volumetric flow rate increases, high density
particles report to the overflow. To date, no work has been done using the reflux classifier for
coal desulfurization.
2.7. Chapter Summary
This chapter has presented findings into the fundamentals of ARD generation and prevention
methods, with particular reference to desulfurization. The nature of South African coals has
been discussed, with emphasis on its floatability and density. This is of particular interest as this
research is focused on coal desulfurization using flotation and gravity technique. A review on
desulfurization by flotation work carried out at UCT and reflux classification, carried out at
NWU have been presented. The findings of this literature review provide a basis for
investigating the process routes as shown in Section 1.7.

34
3. CHAPTER THREE - EXPERIMENTAL DETAILS
3.1. Introduction
The research is aimed at establishing a circuit using froth flotation and reflux classification that
will reduce the sulfur content in coal tailings and recover salable coal. The performance of the
circuit will be determined in terms of the acid generating potential of the final tailings.
This chapter describes the experimental work carried out in order to achieve the above
objectives. Coal flotation, sulfide flotation and reflux classification were conducted on samples
of Waterberg and Witbank coals, individually and according to the process routes depicted in
Figure 1-2. Acid base accounting (ABA) and net acid generating (NAG) characterization tests
were performed on the products and feeds from all three process routes.
Preliminary work consisted of sample preparation and characterization, which involved sample
splitting and determining the particle size distribution and the ash and sulfur contents of the
‘as-received’ samples. Coal and sulfide flotation tests were conducted on both Waterberg and
Witbank coal samples, varying reagent type and dosage to improve the recoveries and yields.
Reflux classification was carried out on the fresh feeds and on the tailings obtained from the
‘optimum’ flotation tests; flotation tests were carried out on the fresh feeds and on the
overflow product from the reflux classifier. Finally, acid characterization tests were carried out
on all products.
3.2. Coal Characterization
Characterization tests were carried out on the coal samples to determine their properties with
respect to beneficiation and desulfurization. As explained in Section 2-3, coals are highly
variable, and it is important to have a full knowledge of the coal characteristics to aid in
explaining the results of the beneficiation processes.
Table 3-1 provides a summary of the techniques used to characterize the coal samples.
Table 3-1: Explanation on the relevance of the coal characterization techniques used in the research
Coal characterization
techniques
Principle behind technique
Particle size analysis
This method is used to obtain the particle size distribution of a sample. Flotation is highly dependent on size (see Section 2.5.2), therefore, knowing the size distribution will significantly aid in predicting the performance of flotation. Although reflux classification is known to be size dependent, the classifier unit used in the experimental procedure in this thesis is, to an extent, dependent on size. Results of size analysis are shown in Table 4-1.

35
Coal characterization
techniques
Principle behind technique
XRD XRD analysis provides the minerals present in a sample and their composition. This is important because the presence or absence of neutralizing minerals in a sample will significantly affect the ARD classification of a sample (acid forming, non acid forming or uncertain). From Table 4-2, the Waterberg sample contains significant amount of neutralizing minerals (Calcite and Dolomite), while the Witbank sample does not.
Proximate and Ultimate analysis
Proximate analysis provides ash, moisture, volatile matter and fixed carbon content of a sample. The ultimate analysis includes carbon, sulfur, hydrogen, nitrogen and oxygen content. Knowledge of the ash content is important as flotation performance is highly dependent on ash content - the higher the ash content, the more difficult to float (Sanders & Brookes, 1986). The sulfur content is also very important as the main objective of the research is to mitigate ARD generation by reducing the sulfur content in the samples.
Sulfur speciation The ultimate analysis provides the total sulfur content, however, it is important to know the composition of the forms of sulfur (sulphide, sulphate and organic sulfur) present in the samples; sulfur speciation analysis provides this information. ARD is generated mainly due to the presence of sulphide sulfur such as pyrite.
Flotation release analysis
Flotation release analysis was carried out on the as-received coal samples to determine the optimum performance that could be obtained by flotation
3.2.1. Coals used in experiments
The two coal samples used in this investigation were obtained from North West University, who
in turn obtained them from Exxaro. They were received in the following form:
71 kg dried cyclone discharge (-500 µm) from the Inyanda colliery (Witbank coalfield)
64 kg dried thickener feed (-180 µm) from a colliery in the Waterberg coalfield
Each sample was blended and passed through a Dickie & Stockler rotary splitter, dividing it into
ten equal portions. Two samples from adjacent positions were then combined and further
divided into smaller samples. This procedure was repeated until the samples were grouped into
bags of approximately 210 g and 700 g, suitable for flotation and reflux classification
respectively. All of the work carried out in this thesis was conducted on these samples.

36
3.2.2. Particle size analysis
The particle size analysis of the as-received samples was carried out in the Centre for Minerals
Research (CMR) laboratory of the Department of Chemical Engineering at UCT, using the dry
test sieving method described in ISO 153:1993. Due to the inaccuracy involved with dry
screening fines, wet screening was used to screen the -53 µm particles.
The procedure began with desliming (wet screening) a 100 g representative sample using a
25 µm sieve. A 53 µm sieve was used to separate the -53 µm fraction from the deslimed
(+25 µm) material. The -53 µm fraction was then passed through a 38 µm sieve, which
separated the -38 µm fraction from the +38 µm fraction. All samples were dried overnight in an
oven operating at 80 0C and weighed. Dry screening was then conducted on the +53 µm
particles using an automatic shaker, which consisted of 25 µm, 38 µm, 53 µm, 75µm, 106 µm,
150 µm, 212 µm, 300 µm and 425 µm sieves. The results are presented in Section 4.2.1.
3.2.3. X-ray Diffraction (XRD) analysis
XRD analysis was carried out to determine the minerals present in the as-received coal samples.
This was performed at the Centre for Bioprocess Engineering Research laboratory in the
Department of Chemical Engineering at UCT, using a Bruker D8 Advance powder XRD. The
results are presented in Section 4.2.2.
3.2.4. Proximate and ultimate analysis
Proximate and ultimate analyses on the as-received samples were carried out at the ALS
Laboratory in Witbank, South Africa. Proximate analysis involves the determination of the coal
ash, volatile matter, fixed carbon and moisture content. The ash, volatile matter and moisture
content were determined according to ISO 1171:1997, ISO 589:2008 and ISO 1171:1997
respectively. The ultimate analysis was performed according to ASTM D 5373. The results are
presented in Section 4.2.3.
3.2.5. Sulfur speciation
Sulfur analysis to determine the total % sulfur of all samples from both process routes was
carried out using the LECO analyzer at the Analytical Laboratory in the Department of Chemical
Engineering at UCT. The results are shown in Section 4.2.4. Sulfur speciation was carried out on
both as-received feed samples at the ALS laboratory in Witbank according to the ISO 157:1996
standard Australia method. These results are shown in Table 4-4.
3.2.6. Determination of ash content
The ash contents of all samples from both process routes were determined in the Centre for
Minerals Research laboratory at the Department of Chemical Engineering at UCT. A sample
between 0.7 g and 1 g was weighed into a crucible and placed in a Carbolite furnace,
manufactured by Electrohear Products, for a period of 1 hour at a temperature of 500 0C, which

37
was then raised to 815 0C for 2 hours; and then cooled and reweighed to determine the residual
ash content. Detailed experimental procedures and calculations are outlined in Section A.2 of
the Appendix. The ash contents of the as-received samples are shown in Table 4-1.
3.2.7. Microscopic Viewing
Samples from the fractionation runs performed on the reflux classifier (see section 3.4.1 below)
were mounted and viewed under an optical Olympus CX41 microscope. The procedure was
performed in the Department of Chemical Engineering at UCT.
Representative sub samples of 1 g were obtained using a rotary splitter, and placed in carefully
labelled blocks. The desired amount of resin was then added into each block, and mixed in a
figure of eight pattern. The sample blocks were placed into a vacuum chamber for 15 minutes,
and then in a pressure pot overnight. The moulds were then removed from the blocks and
polished in a series of grinding and polishing steps until a 1 µm polish was obtained. The moulds
were rinsed and placed in an ultrasonic bath for approximately 10 min, and then carefully
cleaned with ethanol, and dried in the oven at 30 0C for 1 hour, to be ready for viewing under
the microscope. Results are shown in Section 5.2.3.
3.2.8. Determination of sample density
Figure 3-1 shows the Quanta Chrome stereopycnometer used to determine the densities of
samples from the fractionation runs performed on the reflux classifier. The procedures and
equations used are presented in Appendix C.
Figure 3-1: Stereopycnometer equipment used to determine sample density
3.2.9. ARD characterization tests
ARD tests were carried out on all samples from both process routes in order to determine their
acid producing potential. The procedures for the ARD tests are described in Section 3.5.

38
3.3. Flotation Tests
Laboratory batch flotation tests were carried out using a bottom-driven 3 L Leeds-type sub-
aeration flotation cell equipped with electronic impeller and air flow rate meter as seen in
Figure 3-2. The same cell was used for coal and sulfide flotation tests.
Figure 3-2: 3 L Leeds-type laboratory flotation cell used
The following variables were kept constant throughout the experiments:
Impeller speed (1200 rpm)
Froth height (30 mm)
Pulp density (approximately 6 % solids)
Reagent conditioning time
Frother type (MIBC)
aeration rate: 5 L/min for coal flotation and 6 L/min for sulfide flotation
3.3.1. Flotation reagents
Table 3-2 shows the reagents that were used in coal and sulfide flotation tests.
The frother type remained constant throughout the experiments. MIBC is commonly used in
coal and sulfide flotation due to its ability to effectively stabilize the froth (Kawatra, 1995). It
has been used in all similar work done at UCT to date.
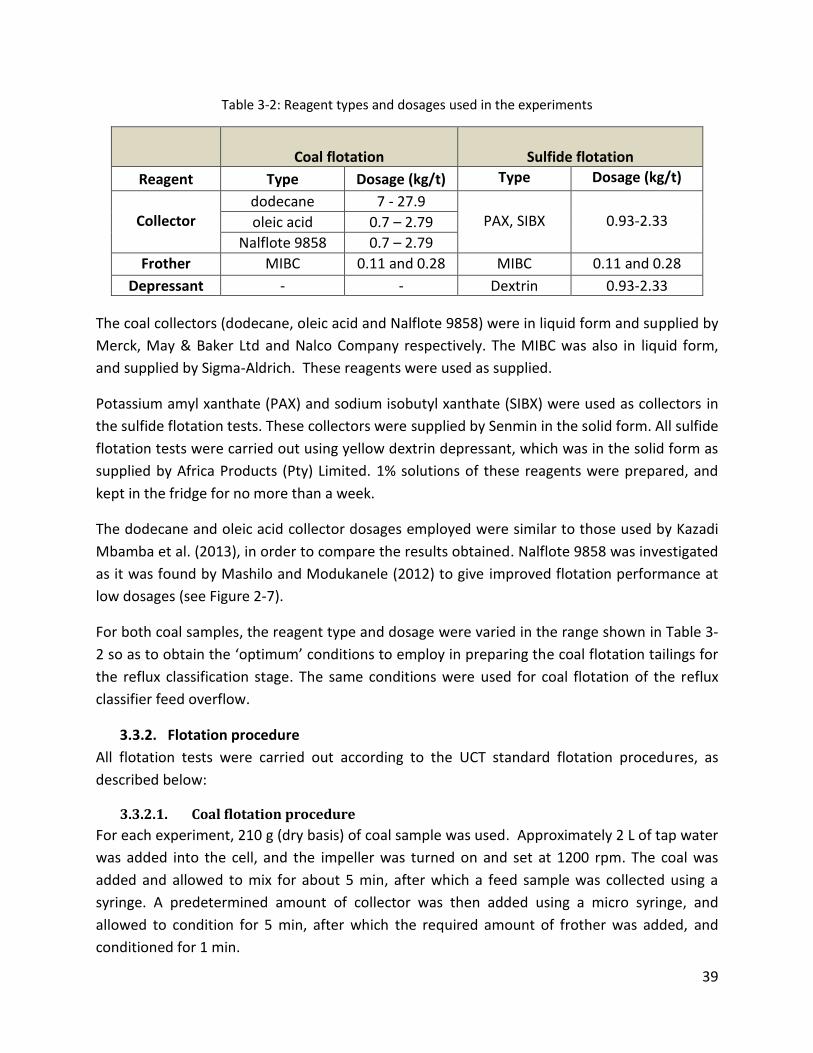
39
Table 3-2: Reagent types and dosages used in the experiments
Coal flotation
Sulfide flotation
Reagent Type Dosage (kg/t) Type Dosage (kg/t)
Collector
dodecane 7 - 27.9 PAX, SIBX
0.93-2.33 oleic acid 0.7 – 2.79
Nalflote 9858 0.7 – 2.79
Frother MIBC 0.11 and 0.28 MIBC 0.11 and 0.28
Depressant - - Dextrin 0.93-2.33
The coal collectors (dodecane, oleic acid and Nalflote 9858) were in liquid form and supplied by
Merck, May & Baker Ltd and Nalco Company respectively. The MIBC was also in liquid form,
and supplied by Sigma-Aldrich. These reagents were used as supplied.
Potassium amyl xanthate (PAX) and sodium isobutyl xanthate (SIBX) were used as collectors in
the sulfide flotation tests. These collectors were supplied by Senmin in the solid form. All sulfide
flotation tests were carried out using yellow dextrin depressant, which was in the solid form as
supplied by Africa Products (Pty) Limited. 1% solutions of these reagents were prepared, and
kept in the fridge for no more than a week.
The dodecane and oleic acid collector dosages employed were similar to those used by Kazadi
Mbamba et al. (2013), in order to compare the results obtained. Nalflote 9858 was investigated
as it was found by Mashilo and Modukanele (2012) to give improved flotation performance at
low dosages (see Figure 2-7).
For both coal samples, the reagent type and dosage were varied in the range shown in Table 3-
2 so as to obtain the ‘optimum’ conditions to employ in preparing the coal flotation tailings for
the reflux classification stage. The same conditions were used for coal flotation of the reflux
classifier feed overflow.
3.3.2. Flotation procedure
All flotation tests were carried out according to the UCT standard flotation procedures, as
described below:
3.3.2.1. Coal flotation procedure
For each experiment, 210 g (dry basis) of coal sample was used. Approximately 2 L of tap water
was added into the cell, and the impeller was turned on and set at 1200 rpm. The coal was
added and allowed to mix for about 5 min, after which a feed sample was collected using a
syringe. A predetermined amount of collector was then added using a micro syringe, and
allowed to condition for 5 min, after which the required amount of frother was added, and
conditioned for 1 min.

40
The air was turned on and maintained at a flow rate of 5 L/min. The froth was scraped every 5
seconds. Concentrates were collected after 0.5 min, 1 min, 2 min and 5 min. The overall
flotation time was 5 min. The concentrate and feed samples were weighed wet, filtered on a
Buchner funnel using pre-weighed filter papers and dried at 80 0C overnight. The tailings were
filtered in a pressure filter and also dried in the oven at 80 0C overnight. The dried concentrates
and tailings were weighed in order to obtain the yield of coal and tailings, and were prepared
for ash content determination.
3.3.2.2. Sulfide flotation
The procedure for sulfide flotation was the same as that for coal flotation with the following
exceptions:
After the collector had been allowed to condition for 5 min, depressant was added using a
syringe, and conditioned for an additional 5 min. Next, the frother was added using a micro
syringe and allowed to condition for 1 min. The air was then turned on and maintained at a flow
rate of 6 L/min.
The froth was scraped every 15 seconds. Concentrates were collected after 2 min, 6 min, 12
min and 20 min. The overall flotation time was 20 min.
3.3.2.3. Two-stage flotation procedure
Two stage flotation experiments were carried out on both coal samples according to process
route 1 (Figure 1-1) so as to compare with the proposed research approach outlined in Figure 1-
2. In the first stage, coal flotation was carried out to recover a coal concentrate. Sulfide (pyrite)
flotation was subsequently performed on the tailings to recover a sulfide-rich concentrate and
a sulfide-lean tailings. 300 g feed samples were used in the two-stage flotation experiments (10
% pulp density).
3.3.2.4. Release analysis
Release analysis was used to determine the best practicable results that could be achieved
through flotation for each of the two as-received coals. A 200 g sample was placed in the
flotation cell, which was filled with water. The air and impeller speed were kept constant at
5 L/min and 1200 rpm, respectively. Starvation amount of MIBC and Nalflote 9858 were added
in stages. In the first stage, concentrates were collected with no reagent addition; the step was
terminated when no more solids were recovered to the froth. In the second stage, a drop of
MIBC was added and conditioned for 1 min, after which the air was switched on and
concentrate collected. In the third stage, a drop of Nalflote 9858 was added and conditioned
for 5 min, after which the air was turned on and concentrate collected. The stages that followed
were carried out by adding drops of Nalflote 9858. Eleven stages were performed after which

41
the final tailing was collected. The flotation concentrates and tailings were filtered and dried
overnight at 80 0C, and analyzed for ash content. The results are presented in Section 4.2.5.
3.4. Reflux Classification
Reflux classification was performed on fresh feed samples of Waterberg and Witbank coals, and
on the tailings from coal flotation of both samples. These experiments were conducted in the
Department of Chemical Engineering at North West University (Potchefstroom campus) using a
laboratory scale reflux classifier. All experiments were carried out using this 10 L batch reflux
classifier, the dimensions of which are shown in Table 3-3 below:
Table 3-3: Reflux classifier at North West University
Variables Description
Equipment type Batch
Inner cross sectional area 105 mm X 105 mm normal to plate section
Plate spacing 3.5 mm
Plate thickness 0.9 mm
Number of plates 23
Angle of inclination 70 0C
Figure 3-3 shows a photograph of the RC used, which consists of the fluidization section and the
inclined section. Water flows with the particles from the bottom to the top of the overflow
weir. The particles are collected on a sieve stack located on top of the water tank, while the
water is recycled back to the process.
The procedures used in the reflux classification tests were obtained from Smith (2014), and are
described below.
A 75 µm sieve is located at the bottom of the fluidization section of the RC. In order to avoid
blockage of the sieve, and enable recycle of water, all samples were deslimed to -53 µm using a
53 µm sieve. The -53 µm material was collected and analyzed for ash content, sulfur content
and ARD generation capacity. The +53 µm samples were used in the test work.
3.4.1. Fractionation tests
Fractionation tests were carried out to determine a suitable flow rate to produce a density cut
point that would separate a high sulfide fraction from the rest of the material (Section 3.4.1).
The flow rate was varied from 20 to 100 L/min, in increments of 20 L/min. A stack of sieves was
arranged (25 µm, 45 µm, 75 µm, 106 µm and 212 µm) on top of the water tank to collect the
overflow.
In each test, a dry feed sample (between 500 g and 1 kg) of +53 µm was inserted into the
system via the feed port. The tank was filled with water, with valve 1 completely closed, while

42
valve 2 was half opened. The pump was switched on, and the desired flow rate was selected
using the flow rate meter by slowly closing valve 2 and simultaneously opening valve 1. The
system was then allowed to run for 10 minutes while collecting the overflow from the overflow
weir. The overflow was collected, filtered on a Buchner funnel and dried at 100 0C overnight.
The same procedure was performed at the different flow rates, each run lasting for 10 minutes.
On completion of each run, the underflow was collected by opening the underflow valve. All
samples from the overflows and underflows were filtered and dried. Ash and sulfur analysis
were then performed on the samples.
Figure 3-3: Reflux classifier experimental setup (Smith, 2014)
Valve 1 Valve 2
Sieve
stack
43
3.4.2. Discrete tests
Discrete tests were performed at the ‘optimum’ flow rates determined using the fractionation
tests. The procedure for the discrete test is similar to that of the fractionation test. Discrete
tests were carried out on the +53 µm feed and flotation tailing samples of both coals. The time
allocated for each run was about 30 minutes, after which there were no more particles
reporting to the overflow. The -53 µm fractions of the feed and flotation tailings samples were
kept for ash, sulfur and acid characterization analysis. The overflow products from the RC were
brought back to UCT for coal flotation, using the ‘optimum’ reagents and dosages as
determined from the preliminary flotation test work. The results of these experiments are
reported in Chapter 5.
3.4.3. Procedure for two-stage tests
As depicted in Figure 1-2, the research approach involves two process routes. Route 1 involves
coal flotation of feed and subsequent reflux classification of tailings, while route 2 involves
reflux classification of feed and coal flotation of RC overflow. Coal flotation of both coal
samples was performed at UCT, as outlined in Section 3.3. Tailings samples were taken to North
West University where reflux classification was carried out as outlined above. Reflux
classification was also carried out at North West University on fresh (as-received) Waterberg
and Witbank coal samples. Coal flotation was carried out on the reflux classifier overflow
products at UCT. The overall results of the two-stage tests are presented in Chapter 7.
3.5. ARD Characterization Tests
Static ARD characterization tests were carried out on all the samples obtained from the
experiments, as described below:
3.5.1. Acid-base accounting (ABA)
The acid-base accounting method evaluates the balance between the maximum potential
acidity and the acid neutralizing capacity of a sample, as described in Equation 2-5.
3.5.1.1. Maximum potential acidity (MPA)
The maximum potential acidity (MPA) of a sample was determined from the total sulfur content
as measured by the LECO analysis described in Section 3.2.5. The calculation assumes that the
measured sulfur content occurs as pyrite, and that the pyrite reacts under oxidizing conditions
to generate acid. The MPA of the sample was calculated as:
𝑀𝑃𝐴𝑘𝑔𝐻2𝑆𝑂4
𝑡= (𝑇𝑜𝑡𝑎𝑙 %𝑆) × 30.6 (3-1)

44
3.5.1.2. Acid neutralizing capacity (ANC)
Acid produced from pyrite oxidation will, to some degree, react with acid neutralizing minerals
contained within the sample. The acid neutralizing capacity (ANC) aids in quantifying the acid-
buffering capacity of the sample.
The ANC method employed in this research is the hydrogen peroxide (H2O2) siderite correction
test, adapted from Skousken et al. (1997). This method was chosen because the ANC is affected
by iron carbonates such as siderite, which react with the acid produced and may contribute to
the alkaline-producing potential of the sample, thereby resulting in an over estimation of the
ANC (Stewart et al., 2006; Skousken et al., 2004).
Each run was carried out in duplicate using 2 g of coal sample. Three Erlenmeyer flasks were
used, with samples placed in two of the flasks and the third one serving as a blank. Hydrochloric
acid (HCl) was added to all the flasks: the amount and strength determined according to the fizz
rating as described in Table 3-4. 100 mL of water was added to the sample, which was then
boiled and filtered. The filtration was carried out to eliminate any likelihood of pyrite oxidation
associated with the addition of H2O2. The residue from the filtration was discarded.
The filtered liquor was back-titrated with NaOH to pH 4.5, after which 5 mL of 30 % hydrogen
peroxide was added in order to enhance the oxidation of dissolved Fe (II) and the precipitation
of Fe (III) oxyhydroxide. The solution was then boiled for further 5 min and allowed to cool
before back titrating to pH 7 with NaOH. The solution was left overnight for 24 h after which
further titration to pH 7 was conducted if required. 5 mL of hydrogen peroxide was added again
and samples were boiled for 5 min; the sample was allowed to cool and then titrated to pH 7.
The samples were left overnight again, after which further titration to pH 7 was conducted if
required.
The ANC value was calculated as:
𝐴𝑁𝐶 =[(𝑉𝐻𝐶𝑙 × 𝑀𝑎)−𝑉𝑁𝑎𝑂𝐻×𝐶]
𝑊× 4.9 (3-2)
𝐶 =𝑀𝑎×𝑉𝐻𝐶𝑙 𝑖𝑛 𝑏𝑙𝑎𝑛𝑘
𝑉𝑁𝑎𝑂𝐻 𝑡𝑖𝑡𝑟𝑎𝑡𝑒𝑑 𝑖𝑛 𝑏𝑙𝑎𝑛𝑘 (3-3)
where Ma = molarity of HCl; W = weight of sample (g) and C accounts for the differences in
stoichiometry in the acid and base solutions.
3.5.1.3. Fizz rating
The fizz rating (Sobek et al., 1978; IWRI & EGI, 2002) is used to determine the amount and strength
of acid required to dissolve the carbonates, whose presence is indicated by bubbling or
effervescence when reacted with HCl. 0.5 g of sample was placed in a plastic bowl to which one

45
or two drops of 7.4 M HCl were added. The fizz rating was evaluated according to the
conditions outlined in Table 3-4.
Table 3-4: Determination of amount of HCl and NaOH concentrations needed according to Fizz rating (Sobek et al., 1978; IWRI & EGI, 2002).
Reaction Scale
Fizz rating HCl Molarity (M)
Volume (mL)
NaOH Molarity (M)
Non 0 0.5 4 0.1
Slight 1 0.5 8 0.1
Moderate 2 0.5 20 0.5
Strong 3 0.5 40 0.5
Very strong 4 1.0 40 0.5
Carbonate 5 1.0 60 0.5
3.5.2. Net acid generating test (NAG)
In this test, hydrogen peroxide is reacted with a sample to promote the oxidation of sulfide
minerals. Unlike the ANC test, the NAG test involves simultaneous acid generation and
neutralization, giving an end result of the net acid generated by the sample. The NAG test may
involve single or sequential addition. The sequential addition NAG test is used on samples with
high sulfide content (normally greater than 1 %), and with samples having a NAG pH less than
4.5 (Stewart et al., 2006). In the case of this thesis, all tests were performed using the
sequential NAG test.
3.5.2.1. Sequential NAG test
This test involves a series of single-addition tests. 15 % H2O2 was added to 2.5 g of sample in a
500 mL Erlenmeyer flask. The solution was then allowed to stand in a fume-hood for 24 hours.
The pH of the reacted solution was measured; the solution was then heated gently until
effervescence had stopped (no reaction) or for a minimum of 2 hours. This step ensured the
removal of any H2O2 left unreacted. The solution was then allowed to cool. The cooled sample
was filtered, and the liquor was then titrated to pH 4.5 and 7.
Titration using 0.1 M NaOH was performed when NAG pH was greater than 2; and 0.5 M NAOH
was used when NAG pH was equal to 2. The filtered residue was then used in another single
addition test until such a time when NAG pH was greater than 4.5 The NAG values at pH 4.5 and
7 were calculated according to Equation 3-4.
The NAG pH was measured as:
𝑁𝐴𝐺 𝑝𝐻 =𝑉×𝑀
𝑊× 49 (3-4)
where V = volume of NaOH used in titration (mL); M = molarity of NaOH and W = weight of
sample (g).

46
4. CHAPTER FOUR – CHARACTERIZATION AND FLOTATION RESULTS
4.1. Introduction
The objective of this research was to investigate the effectiveness of using a combination of
flotation and reflux classification for desulfurization of South African coal in comparison to the
UCT two-stage flotation process. This chapter presents the results obtained from the coal and
sulfide flotation tests carried out on the Waterberg and Witbank coal samples.
The chapter begins by reporting the results of the characterization tests on the as-received
samples which include size analysis, XRD, proximate and ultimate analysis, sulfur speciation and
release analysis. This is followed by the results obtained from the laboratory batch coal
flotation tests, in which collector types and dosages were varied to find the optimum
combinations that would be used in the coal flotation stage of the combined flotation-reflux
classification process routes. The results of staged-reagent flotation tests, carried out to
improve the coal flotation performance of both samples, are also presented. The optimum
conditions were used in the first stage of process route 1 and the second stage of process route
2. The latter results are also presented in this chapter.
This chapter also reports the results of the sulfide flotation tests on the as-received samples to
determine the collector type and dosage to be used in the sulfide flotation stage of the UCT-
two stage process. The results of experiment to determine the effect of frother and depressant
dosage on sulfur recovery and grade are also reported. Finally, the results of the two-stage
flotation process are presented, for each of the two coal samples. The results are used as a
baseline for comparison with the flotation-reflux classification process routes outlined in Figure
1-2.
4.2. Coal Characterization
4.2.1. Size analysis
Figure 4-1 shows the particle size distributions of the as-received samples of the Waterberg and
Witbank coals.
It is clear that the Waterberg sample was very fine, with more than 50 % passing 100 µm, and
only 28 % greater than 106 µm; whilst the Witbank sample was relatively coarse, with only 25 %
passing 100 µm and 68 % greater than 106 µm. The particle size distributions of both samples
are suitable for flotation (Kawatra, 1995). It should be noted that the Witbank sample used by
Kazadi Mbamba et al. (2012) was milled to 75 % passing 150 µm.
The size distributions and ash-by-size contents of the as-received samples are shown in Table
4-1 below. It can be seen that the -25 µm size fraction of the Waterberg sample had the highest
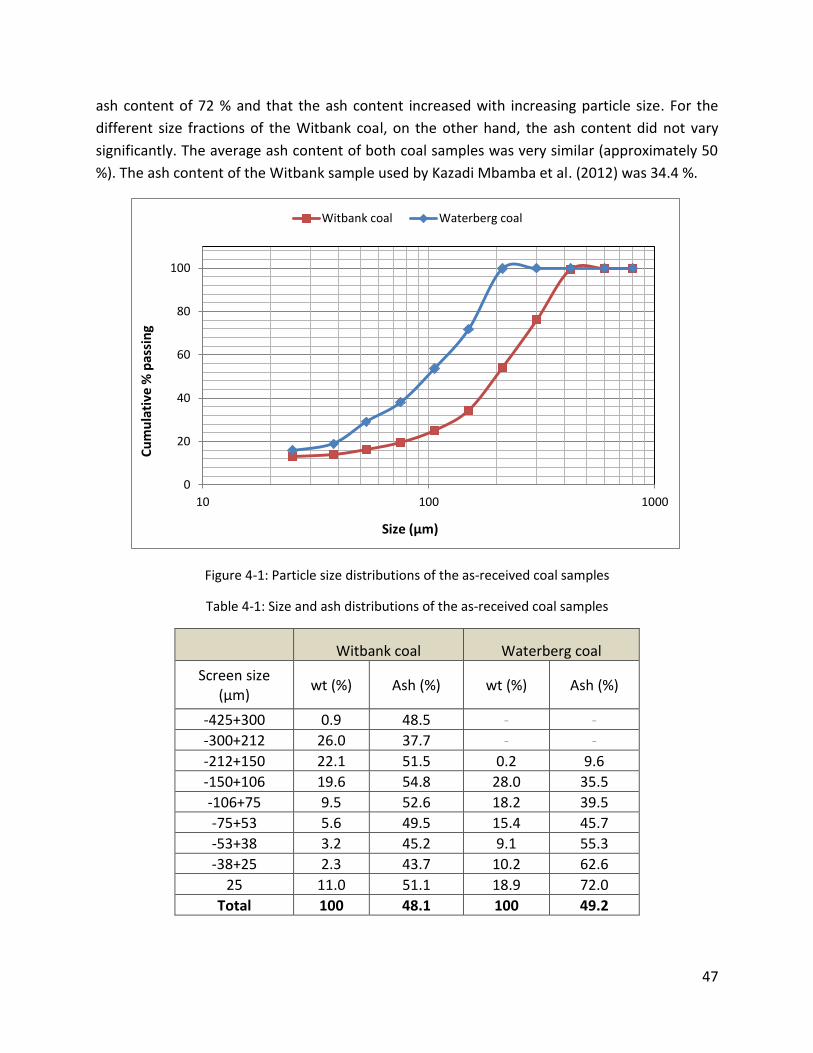
47
ash content of 72 % and that the ash content increased with increasing particle size. For the
different size fractions of the Witbank coal, on the other hand, the ash content did not vary
significantly. The average ash content of both coal samples was very similar (approximately 50
%). The ash content of the Witbank sample used by Kazadi Mbamba et al. (2012) was 34.4 %.
Figure 4-1: Particle size distributions of the as-received coal samples
Table 4-1: Size and ash distributions of the as-received coal samples
Witbank coal Waterberg coal
Screen size (µm)
wt (%) Ash (%) wt (%) Ash (%)
-425+300 0.9 48.5 - -
-300+212 26.0 37.7 - -
-212+150 22.1 51.5 0.2 9.6
-150+106 19.6 54.8 28.0 35.5
-106+75 9.5 52.6 18.2 39.5
-75+53 5.6 49.5 15.4 45.7
-53+38 3.2 45.2 9.1 55.3
-38+25 2.3 43.7 10.2 62.6
25 11.0 51.1 18.9 72.0
Total 100 48.1 100 49.2
0
20
40
60
80
100
10 100 1000
Cu
mu
lati
ve %
pas
sin
g
Size (µm)
Witbank coal Waterberg coal

48
4.2.2. XRD analysis
Table 4-2 shows the mineral composition of each of the two samples. The minerals listed in
Table 4-2 belong to different classes, comprising mainly silicates (quartz) and oxyhydroxides
(kaolinite), which together represented about 80 % of the coal samples. It is known that quartz
is the most abundant mineral in coal (Vassilev & Vassileva, 1996); this is evident from Table 4-2.
The approximate quantitative distribution of minerals in both coals in descending order is:
quartz > kaolinite > dolomite > gypsum > calcite > pyrite > others. For the Waterberg coal
sample, dolomite was found to be the most abundant carbonate (acid neutralizing mineral)
constituting 7.9 % followed by calcite, constituting 4.2 % of the sample. The acid neutralizing
minerals (calcite and dolomite) were not present in the Witbank sample.
The acid forming minerals present in the samples were jarosite (constituting < 2 % in both
samples) and, of particular interest, pyrite, which is high in the Witbank sample (5%), and lower
in the Waterberg sample (2%). According to Gray et al. (1980), Witbank coals are known to
contain higher amount of sulfur, especially discards. In the work of Kazadi Mbamba et al. (2012)
performed on a different sample from the Witbank coalfield, the as-received sulfur content was
low (1.08 %).
Table 4-2: XRD results of the as-received coal samples
Concentration in coal (wt %)
Mineral Mineral composition Witbank Waterberg
Quartz 𝑆𝑖𝑂2 41 41
Kaolinite 𝐴𝑙2𝑆𝑖2𝑂5(𝑂𝐻)4 46 38
Epsomite 𝑀𝑔𝑆𝑂4. 7(𝐻2𝑂) <2 <2
Gypsum 𝐶𝑎𝑆𝑂4. 2𝐻2𝑂 5 5
Jarosite 𝐾𝐹𝑒33+(𝑂𝐻)6(𝑆𝑂4)2 <2 <2
Pyrite 𝐹𝑒𝑆2 5 <2
Siderite 𝐹𝑒𝐶𝑂3 Not-detectable <2
Calcite 𝐶𝑎𝐶𝑂3 <2 4
Dolomite 𝐶𝑎𝑀𝑔(𝐶𝑂3)2 Not-detectable 8
4.2.3. Proximate and ultimate analysis
The results of the proximate and ultimate analyses carried out on both as-received samples at
the ALS laboratory in Witbank are shown in Table 4-3. Waterberg contained more volatiles,
which is consistent with having a higher proportion of vitrinite.
Both coal samples had high ash content, greater than 45 %, as confirmed from Table 4-1, with
gross CV’s of 12.91 and 13.34 MJ/kg for the Waterberg and Witbank coals, respectively. Once
again, the sulfur contents of the Witbank and Waterberg samples were found to be relatively

49
high, with values of 4.18 % and 2.04 %, respectively, as confirmed from Table 4-2. According to
Kalenga (2011), samples with sulfur > 2% are classified as having high sulfur content.
Table 4-3: Proximate and ultimate analysis of the as-received coal samples
Witbank Waterberg
Proximate analysis (% air-dry basis)
Ash (bulk) 47.8 51.0
Volatile matter 17.6 23.9
Moisture 3.4 3.5
Fixed carbon 31 21.8
Ultimate analysis (% air-dry basis)
Total sulfur 4.18 2.04
Carbon 33.3 34.1
Hydrogen 2.1 2.4
Nitrogen 0.6 0.4
Oxygen 8.5 7.9
Calorific value (MJ/kg) 13.3 12.9
4.2.4. Sulfur speciation
Table 4-4 shows the results of the sulfur speciation analysis performed on the Waterberg and
Witbank coal samples at the ALS laboratory in Witbank.
Table 4-4: Sulfur speciation of the as-received coal samples
Witbank Waterberg
Forms of Sulfur Average amount (%)
Sulfide 2.58 0.98
Sulfate 1.44 0.5
Organic 0.16 0.56
Total 4.18 2.04
Organic sulfur is generally located in the vitrinite macerals of coal samples (Barry & Ledda,
1997); therefore, it is not unexpected that the organic sulfur was higher in the Waterberg coal
sample than in the Witbank coal, which is consistent with the Waterberg coal containing more
vitrinite macerals (Jeffrey, 2005). The sulfide (pyritic) sulfur made up a large proportion of the
coals (about 50 %), suggesting that both coals are highly acid forming. The results of the ARD
tests on the two coal samples are presented in Section 6.2 and Section 6.3 below.
4.2.5. Flotation release analysis
Flotation release analysis was carried out on the as-received coal samples to determine the
optimum performance that could be obtained by flotation. The procedure used is described in

50
Section 3.3 above. The results were obtained using Nalflote 9858 collector and MIBC frother in
starvation amounts, and are plotted in Figure 4-2. Detailed results are presented in Appendix
A. The results obtained by Kazadi Mbamba et al. (2012) for a different Witbank coal are plotted
in the same figure for comparison.
From the figure, it can be seen that it is possible to obtain high flotation yields, up to about 60
%, from the Waterberg and Witbank coal samples, but at high ash contents of around 30 %. A
better release curve was obtained for the Witbank coal, which was unexpected, as the
Waterberg coal contains more floatable vitrinite. This can possibly be explained by the very
high ash content in the -25 µm size fraction of the Waterberg coal as shown in Table 4-1. This
shows that the floatability of both samples was poor. The Witbank coal used by Kazadi Mbamba
et al. (2012) contained a much lower ash content (34.4 %), and as a result, the release curve
was much better, with ash content as low as 16 %.
Figure 4-2: Flotation release results on the as-received coal samples, and release analysis results of the Witbank sample used by Kazadi Mbamba et al. (2012) for comparison
4.2.6. Petrographic analysis
Petrographic analysis could not be carried out because of the fine particle size of the as-
received samples (-300 µm). However, from Table 2-3, it is known that Waterberg coals
generally contain more vitrinite macerals, and the Witbank samples more inertinite.
10
15
20
25
30
35
10 20 30 40 50 60 70
Cu
mu
lati
ve a
sh (
%)
Cumulative yield (%)
Waterberg coal Witbank coal Kazadi-Mbamba et al (2012) Witbank coal
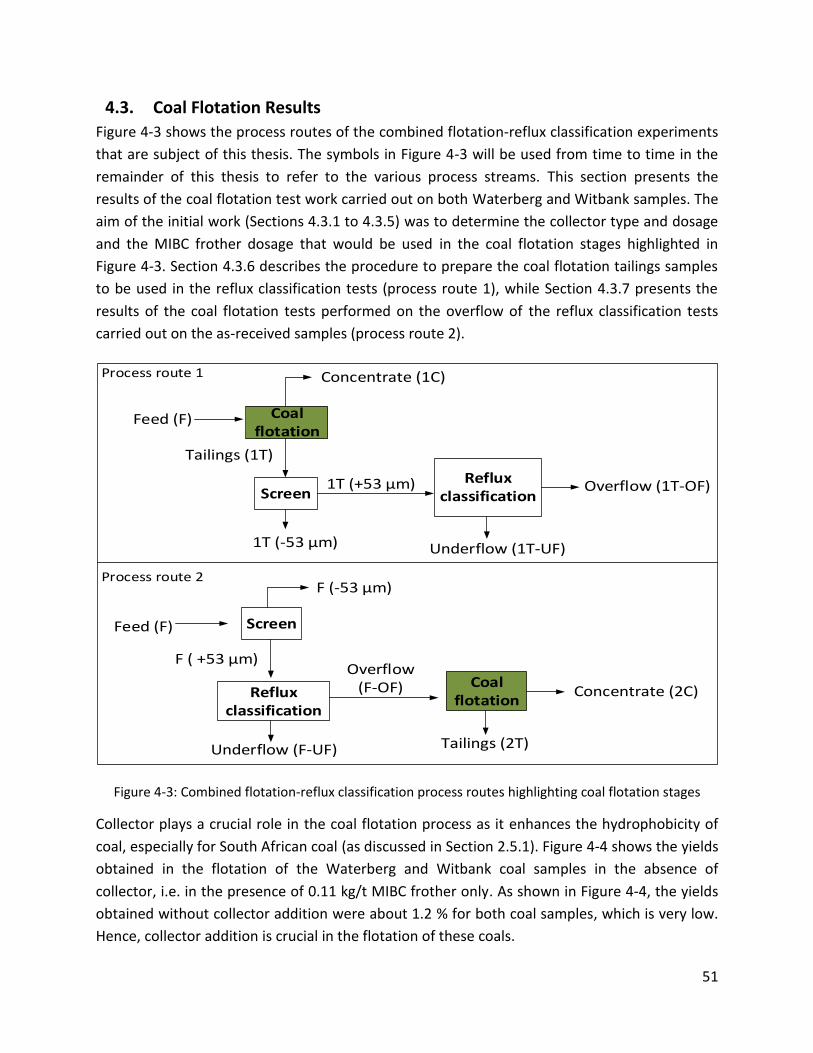
51
4.3. Coal Flotation Results
Figure 4-3 shows the process routes of the combined flotation-reflux classification experiments
that are subject of this thesis. The symbols in Figure 4-3 will be used from time to time in the
remainder of this thesis to refer to the various process streams. This section presents the
results of the coal flotation test work carried out on both Waterberg and Witbank samples. The
aim of the initial work (Sections 4.3.1 to 4.3.5) was to determine the collector type and dosage
and the MIBC frother dosage that would be used in the coal flotation stages highlighted in
Figure 4-3. Section 4.3.6 describes the procedure to prepare the coal flotation tailings samples
to be used in the reflux classification tests (process route 1), while Section 4.3.7 presents the
results of the coal flotation tests performed on the overflow of the reflux classification tests
carried out on the as-received samples (process route 2).
Feed (F) Coal flotation
ScreenReflux
classification
1T (-53 µm)
1T (+53 µm)
Underflow (1T-UF)
Overflow (1T-OF)
Concentrate (1C)
Tailings (1T)
Process route 1
Feed (F) Screen
Reflux classification
Coal flotation
F (-53 µm)
F ( +53 µm)
Underflow (F-UF)
Overflow (F-OF) Concentrate (2C)
Tailings (2T)
Process route 2
Figure 4-3: Combined flotation-reflux classification process routes highlighting coal flotation stages
Collector plays a crucial role in the coal flotation process as it enhances the hydrophobicity of
coal, especially for South African coal (as discussed in Section 2.5.1). Figure 4-4 shows the yields
obtained in the flotation of the Waterberg and Witbank coal samples in the absence of
collector, i.e. in the presence of 0.11 kg/t MIBC frother only. As shown in Figure 4-4, the yields
obtained without collector addition were about 1.2 % for both coal samples, which is very low.
Hence, collector addition is crucial in the flotation of these coals.

52
In the sections which follow, the results of flotation experiments are presented in which
different dosages of various collectors (dodecane, oleic acid and Nalflote 9858) were
investigated at 0.11 kg/t and 0.28 kg/t dosage of MIBC frother. This closely follows work done
by Kazadi Mbamba et al. (2013), Amaral Filho et al. (2012) and Mashilo & Modukanele (2012),
reviewed in Section 2.5.3 above.
Dodecane is not a conventional reagent (i.e. it is not used in industry) but it is used extensively
at UCT as it is the prescribed collector for the Australian standard method for coal flotation and
was shown by Kazadi Mbamba et al. (2013) to give results similar to kerosene (see Figure 2-6).
Oleic acid is also not a commonly used coal collector, but has been shown to perform better
than oily collectors for a number of South African coals (Kazadi Mbamba et al., 2013). Nalflote
9858 has also been shown to significantly improve the grades and recoveries of South African
coals (Mashilo & Modukanele, 2012; Howlett & Marsden, 2013).
MIBC is commonly used in coal and sulfide flotation due to its ability to effectively stabilize the
froth (Kawatra, 1995). It has been used in all similar work done at UCT to date.
Figure 4-4: Coal flotation result for the Waterberg and Witbank coal samples with no collector at 0.11 kg/t MIBC dosage
4.3.1. Flotation of Waterberg and Witbank coal samples using dodecane
collector
Kazadi Mbamba et al. (2013) carried out flotation tests using dodecane at low dosages of 0.7 to
2.79 kg/t; he found that combustible recoveries were much lower compared to those obtained
0.4
0.6
0.8
1
1.2
1.4
0 1 2 3 4 5 6
Co
al y
ield
(%
)
Time (min)
Waterberg coal Witbank coal

53
using oleic acid. In light of his findings, coal flotation tests were conducted at much higher
dosages of 7 to 27.9 kg/t to investigate the flotation performance. 0.28 kg/t MIBC frother was
used because Kazadi Mbamba et al. (2013) showed that high frother dosage improved coal
flotation performance. The results are presented in Table 4-5 and Table 4.6 for the Waterberg
and Witbank samples, respectively.
Table 4-5 shows the results for the Waterberg coal sample. The highest yield of 6.6 % was
obtained at the highest dosage of 27.9 kg/t, with an ash content of 31.8 %. The low yield
obtained in this result is consistent with the high ash content of the Waterberg coal sample
shown in Table 4-1 (the higher the ash content the more difficult a coal is to float). It is
interesting that the ash content improved (decreased) as reagent dosage and yield increased,
which is unusual, and may be due to agglomeration of the particles at the higher collector
dosage.
The sulfur content of the clean coal was also found to be relatively high, ranging from 1.7 % to
1.1 % with increasing collector dosages, compared to the feed sulfur of 2.04 %. The decrease in
sulfur content corresponds to an increase in coal content of the concentrate (decrease in ash
content).
Table 4-5: Coal flotation results for the Waterberg coal sample at different dosages of dodecane collector using 0.28 kg/t MIBC dosage
Reagent dosage kg/t Yield % Ash % Sulfur %
7 2.4 41.6 1.7
14 3.6 37.4 1.2
18 5.8 39.1 1.1
27.9 6.6 31.8 1.1
Table 4-6 shows the flotation results for the Witbank coal sample. The product yields were also
low, at around 6 %, but remained fairly constant irrespective of the collector dosage. However,
the ash contents were much lower at around 22 %, which is less than half of the feed ash, and
in agreement with the release curve (see Section 4.2.5). The sulfur content was still relatively
high, and did not change significantly with dosage. From the results obtained from both coals,
dodecane was considered a poor collector because of the low yields and high ash contents
obtained, and thus was not used in any further experimental work.
In contrast to results obtained from both coal samples in this thesis, Kazadi Mbamba et al.
(2013) obtained combustible recoveries of approximately 30 % in the flotation of a Witbank
coal using dodecane at low dosages of 0.7 to 2.79 kg/t. These differences in dodecane
performance may be attributed to the large difference in the ash contents of the coal samples
(34.4 % vs 48 % in this test work), as shown in the release curve in Figure 4-2.

54
Table 4-6: Coal flotation results for the Witbank coal sample at different dosages of dodecane collector using 0.28 kg/t MIBC dosage
Reagent dosage kg/t Yield % Ash % Sulfur %
7 5.1 23.4 3.2
14 6.0 21.5 3.8
18 6.5 20.1 3.0
27.9 6.7 22.9 3.4
4.3.2. Flotation of Waterberg and Witbank coal samples using oleic acid
Kazadi Mbamba et al. (2013) found that the use of oleic acid in the flotation of Witbank coal
gave a much better performance compared to dodecane and kerosene at dosages between 0.7
and 2.79 kg/t (see Figure 2-6), which was confirmed by Amaral Filho et al. (2012) on Witbank
and Brazilian coal samples. Hence, flotation test were conducted using oleic acid at dosages
between 0.7 and 2.79 kg/t and MIBC frother dosages of 0.11 and 0.28 kg/t.
Tables 4-7 and 4-8 show the results obtained for both coal samples using oleic acid at 0.11 and
0.28 kg/t MIBC dosages.
Table 4-7: Coal flotation results for the Waterberg coal sample at different dosages of oleic acid collector using 0.11 and 0.28 kg/t MIBC dosages
0.11 kg/t MIBC 0.28 kg/t MIBC
Reagent dosage kg/t Yield % Ash % Sulfur Yield % Ash % Sulfur %
0.7
10.8 44.4 1.2
1.4 12.4 33.2 0.5 18.0 40.6 0.8
1.8 15.3 41.0 0.98 19.0 45.3 0.7
2.79 15.5 45.2 0.8 27.5 42.6 1.4
Table 4-8: Coal flotation results for the Witbank coal sample at different dosages of oleic acid collector using 0.11 and 0.28 kg/t MIBC dosages
0.11 kg/t MIBC 0.28 kg/t MIBC
Reagent dosage (kg/t) Yield % Ash % Sulfur % Yield % Ash % Sulfur %
0.7
5.8 22.0 2.9
1.4 20.9 22.9 2.7 31.5 24.0 2.8
1.8 32.6 24.0 2.7 38.4 22.8 3.2
2.79 39.0 25.2 2.9 43.5 22.1 4.1

55
For both coals, the flotation performance using 0.7 kg/t collector dosage at 0.11 kg/t MIBC
dosage was extremely poor, hence was not analyzed further. The yields increased as the
collector and frother dosages increased. The ash contents of the concentrates for the
Waterberg coal remained relatively high owing to poor selectivity when using oleic acid,
whereas the ash contents of the Witbank coal concentrates were significantly lower, with much
higher yields obtained. At the higher frother dosage, the sulfur contents of the Witbank coal
increased as the collector dosage increased.
Figure 4-5 plots the yields obtained for both coal samples using oleic acid collector at different
dosages. The flotation of the Waterberg and Witbank coal samples using oleic acid at 0.28 kg/t
MIBC showed a steady increase in yield as the collector dosage was increased. The yields
obtained from the Witbank coal were greater than those obtained from flotation of the
Waterberg coal.
Figure 4-5: Yields obtained in the coal flotation of the Waterberg and Witbank coal samples using 0.28 kg/t MIBC dosage and oleic acid collector at various dosages
The yields obtained at much lower collector dosages than those obtained using dodecane
confirm that oleic acid is a much better collector than dodecane. According to Jia et al. (1999),
hydrogen bonding occurs between reagent molecules containing oxygenated groups, which is a
much stronger bond than the Van der Waals interaction of reagent aliphatic chains and
carbonaceous portions of the coal surface. Hence, since oleic acid contains an oxygenated
group, it is believed to form stronger bonds with the coal surface than dodecane which contains
0
5
10
15
20
25
30
35
40
45
0.7 1.4 1.8 2.79
Yie
ld %
Collector dosage (kg/t)
Waterberg coal Witbank coal

56
only aliphatic chains. In addition, work done by Kazadi Mbamba et al. (2013) showed that the
coal recovery obtained using oleic acid was approximately 40 % higher than that obtained using
dodecane and kerosene (Figure 2-6 above).
4.3.3. Flotation of Waterberg and Witbank coal samples using Nalflote 9858
collector
Mashilo & Modukanele (2012) and Howlett & Marsden (2013) investigated the use of several
Nalflote collectors and Montanol 800 in the flotation of Waterberg and Witbank coal samples;
they found that Nalflote 9858 performed very well at low dosages between 0.1 kg/t and 0.5
kg/t (see Figure 2-7). Tables 4-9 and 4-10 show the flotation results for the Waterberg and
Witbank coal using Nalflote 9858 collector at 0.11 kg/t and 0.28 kg/t MIBC dosage.
Table 4-9: Coal flotation results for the Waterberg coal sample at different dosages of Nalflote 9858 collector using 0.11 and 0.28 kg/t MIBC dosages
0.11 kg/t MIBC 0.28 kg/t MIBC
Reagent dosage kg/t Yield % Ash % Sulfur % Yield % Ash % Sulfur %
0.7 15.4 20.9 1.7 26.6 25.9 1.6
1.4 30.3 27.7 1.4 37.6 28.3 1.4
1.8 40.1 31.2 1.8 43.4 30.3 1.6
2.79 45.6 34.2 2.1 54.6 35.1 2.0
Table 4-10: Coal flotation results for the Witbank coal sample at different dosages of Nalflote 9858 collector using 0.11 and 0.28 kg/t MIBC dosages
0.11 kg/t MIBC 0.28 kg/t MIBC
Reagent dosage kg/t
Yield % Ash % Sulfur % Yield % Ash % Sulfur %
0.7 7.4 19.4 2.7 13.0 20.8 2.7
1.4 16.7 23.4 2.4 27.4 23.4 2.6
1.8 20.5 23.8 2.8 30.1 22.2 2.4
2.79 25.3 20.4 3.2 34.6 25.7 3.3
The results for the Waterberg coal sample (Table 4-9) show a marked increase in yield and
reduction in ash content of the clean coal compared to the results obtained using oleic acid.
The ash contents increased as the collector and frother dosages increased. In comparison, for
the Witbank coal sample, the yields obtained using Nalflote 9858 collector were lower than
those obtained with oleic acid collector, while the ash contents were comparable. In general,
the sulfur contents of the Waterberg sample using Nalflote 9858 were much higher than those
obtained using oleic acid, but lower for the Witbank samples.

57
Figure 4-6 shows the yields obtained from both coal samples using Nalflote 9858 collector at
0.28 kg/t MIBC dosage.
Figure 4-6: Yield obtained in the coal flotation of the Waterberg and Witbank coal samples using Nalflote 9858 collector at 0.28 kg/t MIBC dosage
A steady increase in yield was seen as the collector dosage was increased from 0.7 to 2.79 kg/t.
Comparison with Figure 4-5 clearly shows that Nalflote 9858 was a much better collector for
the Waterberg coal, while oleic acid produced higher yields for the Witbank coal. However, the
sulfur contents were much lower using Nalflote 9858 for the Witbank coal sample.
4.3.4. Comparison of Nalflote 9858 and oleic acid collectors
The performance of oleic acid and Nalflote 9858 has been analyzed individually in terms of
flotation yields, ash and sulfur contents of the clean coal samples. However, it is also important
to determine the best collector suitable for both coal samples to take into the combined
flotation-reflux classification work.
Figure 4-7 shows the flotation results obtained for the Waterberg coal sample using different
dosages of Nalflote 9858 and oleic acid collector, at 0.28 kg/t MIBC dosage. It is clear that
Nalflote 9858 is a better collector than oleic acid for the Waterberg coal, as higher yields and
lower ash contents of clean coal were obtained. Nalflote 9858 is more selective, confirming its
supremacy over other conventional reagents.
0
10
20
30
40
50
60
0.7 1.4 1.8 2.79
Yie
ld %
Collector dosage (kg/t)
Waterberg coal Witbank coal

58
Figure 4-8 shows the flotation results obtained for the Witbank coal sample using different
dosages of Nalflote 9858 and oleic acid, at 0.28 kg/t MIBC dosage. At 0.7 kg/t collector dosage,
Nalflote 9858 was seen to perform better than oleic acid, giving 10 % higher yield of clean coal.
However, at higher dosages, oleic acid performed much better than Nalflote 9858 collector.
Figure 4-7: Comparison of oleic acid and Nalflote 9858 collectors on coal flotation of the Waterberg coal sample at 0.28 kg/t MIBC dosage
Figure 4-8: Comparison of oleic acid and Nalflote 9858 collectors on coal flotation of the Witbank coal sample at 0.28 kg/t MIBC dosage
0
10
20
30
40
50
60
0
10
20
30
40
50
60
0 0.5 1 1.5 2 2.5 3
Yie
ld %
Ash
%
Collector dosage (kg/t)
Nalflote 9858 (% ash) Oleic acid (% ash)
Nalflote 9858 (% yield) Oleic acid (% yield)
0
10
20
30
40
50
60
0
10
20
30
40
50
60
0 0.5 1 1.5 2 2.5 3
Yie
ld %
Ash
%
Collector dosage (kg/t)
Nalflote 9858 (% ash) Oleic acid (% ash)
Nalflote 9858 (% yield) Oleic acid (% yield)

59
4.3.5. Process improvement experiments
From Section 4.3.4, it is clear that Nalflote 9858 is suitable for the Waterberg coal, while oleic
acid is suitable for the Witbank coal at higher collector dosages. However, the ash and sulfur
contents obtained were still very high. Therefore, attempts were made to improve the process
and obtain lower ash and sulfur contents at high yields.
Stage wise addition of reagent has been shown to improve flotation performance, especially for
coarser coal particles (Kazadi Mbamba et al., 2013; Stonestreet & Franzidis, 1988; Banerjee et
al., 2007). Stage wise addition of collector was investigated at 0.11 and 0.28 kg/t MIBC dosage.
A low frother dosage was used in order to lower the ash content of the concentrates. Stage
wise addition of oleic acid and Nalflote 9858 was carried out at dosages of 2.79 kg/t, 1.4 kg/t
and 0.7 kg/t, while stage-wise addition of Montanol 800 was investigated at 0.7 kg/t. Montanol
800 was investigated as it was found previously to improve flotation performance (Mashilo, &
Modukanele, 2012).
The experimental procedure was similar to that of a single stage flotation test as outlined in
Section 3.3.2, except that the collector was added incrementally, with the same conditioning
time of 5 min for every addition. The frother was added in the beginning of the first stage and
conditioned for 1 min. For the stage wise addition of 0.7 kg/t, dosages of 0.2, 0.2, 0.2 and 0.1
kg/t were added to obtain flotation concentrates 1, 2, 3 and 4 respectively. Higher dosages
were used for concentrate 1 and 2 to account for the short flotation time of 30 sec. For 1.4 kg/t
collector dosage, 0.35 kg/t was added in each stage. For 2.79 kg/t collector dosage, 0.7, 0.7, 0.8
and 0.59 kg/t were added to obtain flotation concentrates 1, 2, 3 and 4 respectively.
Table 4-11 shows the results obtained from flotation of the Waterberg coal sample using stage
wise collector addition
Table 4-11: Comparison of 4-stage and single stage coal flotation of the Waterberg coal sample
(N: Nalflote 9858; O: oleic acid; M: Montanol 800)
4 stage 1 stage
Reagent Type and dosage (kg/t) Yield % Ash % Sulfur % Yield % Ash %
Sulfur %
MIBC: 0.11 kg/t
N (0.7) 9.6 19.8 1.3 15.4 20.9 1.7
N (1.4) 40.6 25.3 1.4 30.3 27.7 1.4
N (2.79) 58.4 33.2 1.6 45.6 34.2 2.1
O (2.79) 65.8 39.6 1.6 15.5 45.2 0.8
M (0.7) 21.6 29.1 1.2 38.3 31.2 1.2
MIBC: 0.28 kg/t N (0.7) 17.5 22.4 1.3 26.6 25.9 1.6

60
The results show a significant increase in yield, at similar ash contents, from 0.7 kg/t to 1.4 kg/t
of Nalflote 9858 collector. Although oleic acid gave a remarkably better yield of 65 % at a 4-
stage addition of 2.79 kg/t, the ash and sulfur contents were greater than those obtained using
Nalflote 9858 at the same total dosage. Montanol 800 was seen not to perform well: a high ash
content of 29.1 % was obtained at a low dosage of 0.7 kg/t compared to an ash content of 19.8
% using Nalflote 9858 at the same dosage.
Comparing the 4-stage and single stage flotation, the yields increased except for Nalflote 9858
at 0.7 kg/t (0.11 and 0.28 kg/t MIBC) and Montanol 800 at 0.7 kg/t. In terms of ash content, no
meaningful difference was seen between the 4-stage and single stage processes. However, the
sulfur contents in the 4-stage samples were generally lower than those in the single stage
samples.
Table 4-12 shows the flotation results for the 4-stage and single stage flotation of the Witbank
coal sample. Comparing the single stage and 4-stage processes, the yields obtained at higher
collector dosages were significantly higher except for oleic acid. The ash contents, as with the
Waterberg coal sample, did not vary significantly.
Oleic acid was found to give the highest ash content of 28.5 % at a dosage of 2.79 kg/t,
suggesting that stage wise addition using oleic acid did not favor selectivity. The ash and sulfur
contents using Nalflote also increased as the collector dosage increased. Montanol 800 was
found to perform better on the Witbank coal than on the Waterberg coal; however, the ash
content was relatively high in comparison to that obtained using Nalflote 9858 at similar
dosage.
Table 4-12: Comparison of 4-stage and single stage coal flotation of the Witbank coal sample (N: Nalflote 9858; O: oleic acid; M: Montanol 800)
4 stage 1 stage
Reagent Type and dosage kg/t Yield % Ash % Sulfur % Yield % Ash % Sulfur %
MIBC: 0.11 kg/t
N (0.7) 16.1 17.6 2.0 7.4 19.4 2.7
N (1.4) 36.2 23.3 2.5 16.7 23.4 2.4
N (2.79) 53.0 25.0 3.4 25.3 20.4 3.2
O (2.79) 54.1 28.5 3.5 39.0 25.2 2.9
M (0.7) 24.0 22.4 3.2 38.5 26.0 2.9
MIBC: 0.28 kg/t N (0.7) 32.9 20.1 2.1 13.0 20.8 2.7
In the light of these results, Nalflote 9858 at 1.4 kg/t was selected as the ‘optimum’ collector
type and dosage for both coal samples, for use in the combined flotation-reflux classification
work. Although oleic acid performed better for the Witbank coal, the sulfur contents were very

61
high. Stage wise collector addition was chosen for the Waterberg coal, and single stage
collector addition for the Witbank coal. As discussed, increasing frother dosage had a greater
effect on the Witbank coal, hence 0.28 kg/t MIBC was chosen as the ‘optimum’ frother dosage
for the Witbank coal, and 0.11 kg/t for the Waterberg coal.
4.3.6. Flotation in 8 L flotation cell: generation of samples for reflux classifier
work
Coal flotation experiments (process route 1 in Figure 4-3) were carried out using the reagent
types and dosages discussed in the preceding section to generate the tailings samples (1T)
taken to NWU for reflux classification. The summary of the reagent types and conditions
obtained from Section 4.3 are shown in Table 4-13. In order to produce enough material for the
reflux classification experiments, flotation tests were carried out on the as-received feed
samples, on a larger scale, using the 8 L Leeds-type flotation cell in the Centre for Minerals
Research (CMR) laboratory at UCT. All material values were scaled up by a factor of three;
hence instead of using 200 g of coal sample, 600 g was used. The impeller speed and air flow
rate were kept constant at 1200 rpm and 10 L/min, respectively. The results are presented in
Table 4-13 and in Appendix D of this thesis. The reflux classification and ARD characterization
tests carried out on these concentrates are described in Chapters 5 and 6, respectively. It
should be noted that the flotation results achieved in the 8 L cell differed slightly from those
obtained in the 3 L flotation cell, as presented in Tables 4-10 and 4-11 above.
Table 4-13: Summary of reagent conditions and results of the coal flotation of the Waterberg and Witbank samples used the 8 L Leads-type flotation cell
Witbank Waterberg
Reagent conditions
MIBC frother dosage (kg/t) 0.11 0.28
Collector type and dosage Nalflote 9858 (1.4 kg/t)
Collector addition 4-stage single stage
Results
(coal concentrate)
% yield 32.9 44.1
% ash 24.5 25.1
% sulfur 2.6 1.4
4.3.7. Coal flotation of reflux classifier overflow samples (F-OF)
As shown in Figure 4-3, coal flotation tests were also carried out on the reflux classifier
overflow streams generated when performing process route 2 at NWU. These samples were
brought back to UCT, and the flotation tests were carried out in the 3 L Leeds-type cell, using
Nalflote 9858 reagent at 1.4 kg/t, as it was found to be the best collector for both coal samples
(as explained in the preceding sections). MIBC frother at dosages of 0.11 kg/t and 0.28 kg/t was
used in the flotation of the Waterberg and Witbank samples, respectively. Table 4-14 shows the
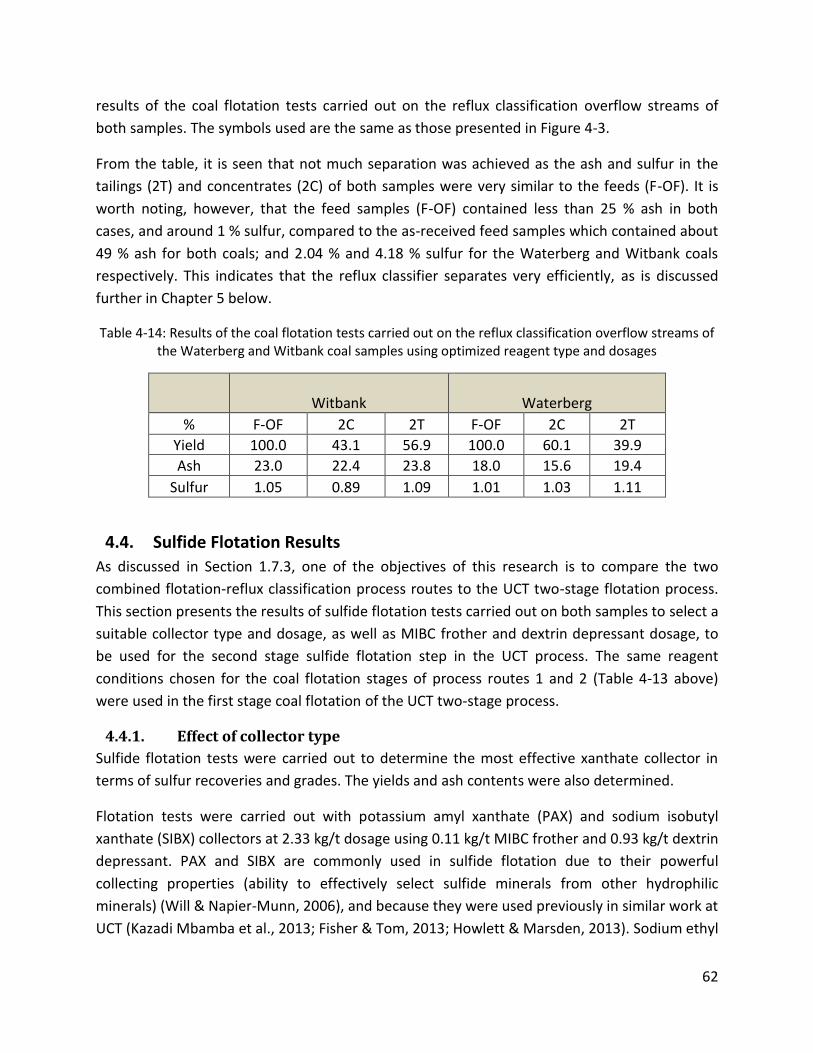
62
results of the coal flotation tests carried out on the reflux classification overflow streams of
both samples. The symbols used are the same as those presented in Figure 4-3.
From the table, it is seen that not much separation was achieved as the ash and sulfur in the
tailings (2T) and concentrates (2C) of both samples were very similar to the feeds (F-OF). It is
worth noting, however, that the feed samples (F-OF) contained less than 25 % ash in both
cases, and around 1 % sulfur, compared to the as-received feed samples which contained about
49 % ash for both coals; and 2.04 % and 4.18 % sulfur for the Waterberg and Witbank coals
respectively. This indicates that the reflux classifier separates very efficiently, as is discussed
further in Chapter 5 below.
Table 4-14: Results of the coal flotation tests carried out on the reflux classification overflow streams of the Waterberg and Witbank coal samples using optimized reagent type and dosages
Witbank
Waterberg
% F-OF 2C 2T F-OF 2C 2T
Yield 100.0 43.1 56.9 100.0 60.1 39.9
Ash 23.0 22.4 23.8 18.0 15.6 19.4
Sulfur 1.05 0.89 1.09 1.01 1.03 1.11
4.4. Sulfide Flotation Results
As discussed in Section 1.7.3, one of the objectives of this research is to compare the two
combined flotation-reflux classification process routes to the UCT two-stage flotation process.
This section presents the results of sulfide flotation tests carried out on both samples to select a
suitable collector type and dosage, as well as MIBC frother and dextrin depressant dosage, to
be used for the second stage sulfide flotation step in the UCT process. The same reagent
conditions chosen for the coal flotation stages of process routes 1 and 2 (Table 4-13 above)
were used in the first stage coal flotation of the UCT two-stage process.
4.4.1. Effect of collector type
Sulfide flotation tests were carried out to determine the most effective xanthate collector in
terms of sulfur recoveries and grades. The yields and ash contents were also determined.
Flotation tests were carried out with potassium amyl xanthate (PAX) and sodium isobutyl
xanthate (SIBX) collectors at 2.33 kg/t dosage using 0.11 kg/t MIBC frother and 0.93 kg/t dextrin
depressant. PAX and SIBX are commonly used in sulfide flotation due to their powerful
collecting properties (ability to effectively select sulfide minerals from other hydrophilic
minerals) (Will & Napier-Munn, 2006), and because they were used previously in similar work at
UCT (Kazadi Mbamba et al., 2013; Fisher & Tom, 2013; Howlett & Marsden, 2013). Sodium ethyl

63
xanthate (SEX) was not investigated due to its poor performance in previous studies (Kazadi
Mbamba et al., 2013; Fisher & Tom, 2013), as shown in Figures 2-9 and 2-10 above. The
procedure for carrying out these tests is described in Section 3.3.2.2 above.
Table 4-15 shows the yields, ash contents, sulfur recoveries and grades of the concentrates
from the sulfide flotation of as-received samples of both coals using PAX and SIBX at 2.33 kg/t
dosage.
Table 4-15: Sulfide flotation results using PAX and SIBX at 2.33 kg/t dosage. Dextrin depressant and MIBC at 0.93 kg/t and 0.11 kg/t dosage, respectively
Witbank Waterberg
Reagent type Yield % Ash %
Sulfur recovery
%
Sulfur grade
% Yield % Ash %
Sulfur recovery
%
Sulfur grade
%
SIBX 3.2 37.2 16.8 15.3 13.1 36.7 75.6 6.3
PAX 5.2 27.4 12.2 8.5 17.5 35.5 72.4 4.8
The ash contents obtained using PAX collector were generally lower than those obtained using
SIBX for both coals, suggesting that PAX might have been behaving as a coal collector.
Although a higher yield was obtained using PAX in both cases, the sulfur grades and recoveries
were higher when using SIBX. For the Witbank coal, a sulfur content of 15.3 % was obtained
using SIBX and only 8.5 % using PAX. For the Waterberg coal, the corresponding values were 6.3
% with SIBX and 4.8 % with PAX (also highlighted in Figure 4-9 below). These are significant
differences, confirming that SIBX is more selective than PAX. PAX is a more expensive collector
than SIBX and SEX (Jera, 2013), which is also worth taking into account.
As seen from Figure 4-9 the recoveries of sulfur obtained from flotation of the Waterberg coal
were much higher than those obtained from the Witbank coal, using both collectors. This could
be because the Witbank sample was coarser than the Waterberg sample (see Table 4-1). Froth
recovery of coarse particles is known to be poorer than that of fines. In light of these results,
SIBX was chosen to be the collector used for the UCT two-stage flotation process, as it gave the
highest sulfur recoveries and grades for both coal samples. All subsequent experimental work
was performed using SIBX as collector.
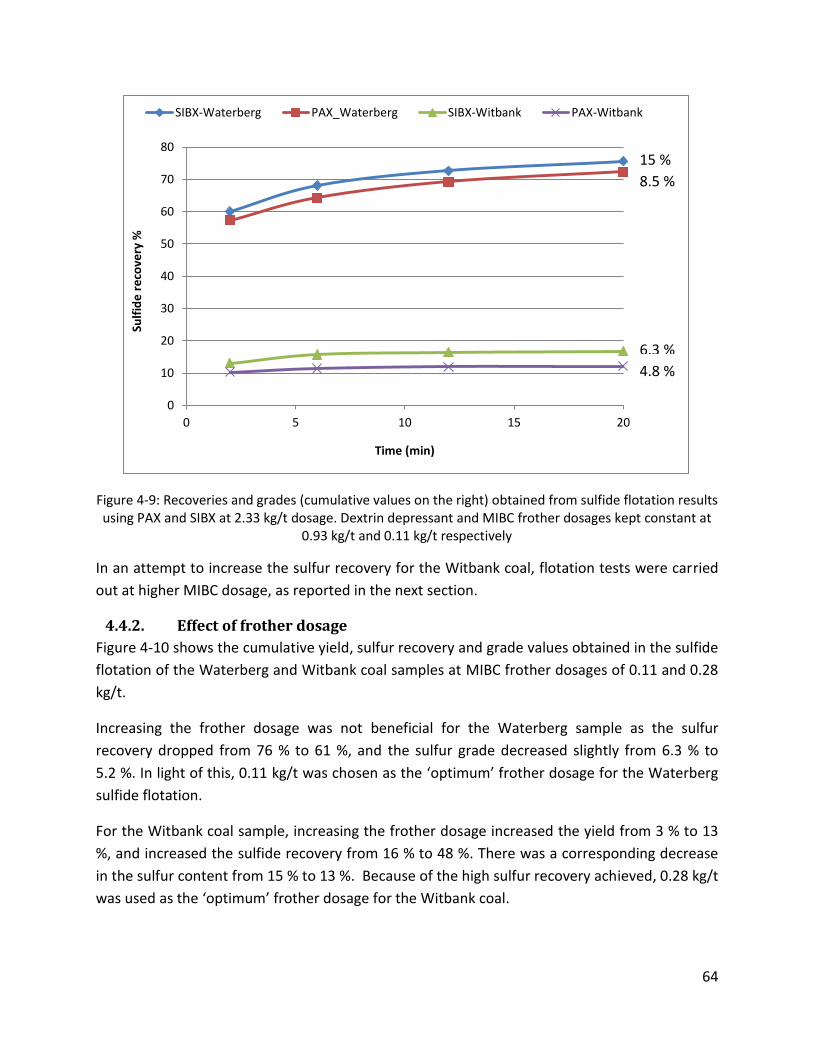
64
Figure 4-9: Recoveries and grades (cumulative values on the right) obtained from sulfide flotation results using PAX and SIBX at 2.33 kg/t dosage. Dextrin depressant and MIBC frother dosages kept constant at
0.93 kg/t and 0.11 kg/t respectively
In an attempt to increase the sulfur recovery for the Witbank coal, flotation tests were carried
out at higher MIBC dosage, as reported in the next section.
4.4.2. Effect of frother dosage
Figure 4-10 shows the cumulative yield, sulfur recovery and grade values obtained in the sulfide
flotation of the Waterberg and Witbank coal samples at MIBC frother dosages of 0.11 and 0.28
kg/t.
Increasing the frother dosage was not beneficial for the Waterberg sample as the sulfur
recovery dropped from 76 % to 61 %, and the sulfur grade decreased slightly from 6.3 % to
5.2 %. In light of this, 0.11 kg/t was chosen as the ‘optimum’ frother dosage for the Waterberg
sulfide flotation.
For the Witbank coal sample, increasing the frother dosage increased the yield from 3 % to 13
%, and increased the sulfide recovery from 16 % to 48 %. There was a corresponding decrease
in the sulfur content from 15 % to 13 %. Because of the high sulfur recovery achieved, 0.28 kg/t
was used as the ‘optimum’ frother dosage for the Witbank coal.
0
10
20
30
40
50
60
70
80
0 5 10 15 20
Sulf
ide
re
cove
ry %
Time (min)
SIBX-Waterberg PAX_Waterberg SIBX-Witbank PAX-Witbank
15 %
8.5 %
6.3 %
4.8 %

65
Figure 4-10: Effect of MIBC frother dosage on sulfide flotation of the Waterberg and Witbank coal samples: SIBX collector and dextrin depressant dosages kept constant at 2.33 kg/t and 0.93 kg/t
respectively
4.4.3. Effect of depressant dosage
The depressant dosage was increased from 0.93 kg/t to 1.4 kg/t in an attempt to improve the
sulfur grades in the concentrates (i.e. by preventing the coal from floating). Figure 4-11 shows
the cumulative yield, sulfur recovery and grade values obtained in the sulfide flotation of both
coal samples at different dextrin depressant dosages.
For the Waterberg coal, a decrease in yield and recovery was seen in going from 0.93 to 1.4 kg/t
depressant dosage, whilst the sulfur grade increased. For the Witbank coal, the opposite effect
occurred; a slight increase in yield and recovery was seen, with a slight decrease in sulfur
content.
0
10
20
30
40
50
60
70
80
0.11 0.28 0.11 0.28
% c
um
ula
tive
val
ue
frother dosage (kg/t)
% yield % sulfur grade % sulfur recovery
Waterberg Witbank

66
Figure 4-11: Effect of dextrin depressant dosage on sulfide flotation of the Waterberg and Witbank coal samples: SIBX collector and MIBC frother dosages kept constant at 2.33 kg/t and 0.11 kg/t respectively
According to Miller et al. (1983), the use of dextrin depressant is only successful in non-oxidized
coals as an increase in the oxygen functional group causes a reduction in the hydrophobic
properties of the coal (see Section 2.5.2), thus reducing the extent of dextrin adsorption onto
the coal surface. Consequently, 0.93 kg/t dextrin depressant dosage was used as the ‘optimum’
depressant dosage for both coal samples. Although for the Witbank sample, 1.4 kg/t depressant
dosage gave better results than 0.93 kg/t dosage, the increases in yield, recovery and grade
were not significant compared to the increase in dosage.
4.4.4. Effect of collector dosage
Having selected the collector type, and the MIBC frother and dextrin depressant dosages
(Sections 4.3.5.1-4.3.5.3 above), some tests were carried out at reduced SIBX collector dosages
to investigate whether the high collector dosage of 2.33 kg/t was required. Table 4-16 and
Table 4-17 show the results of the sulfide flotation tests performed on the Waterberg and
Witbank coal samples, respectively, at reduced collector dosages whilst keeping the depressant
and frother dosages constant at the predetermined levels.
0
10
20
30
40
50
60
70
80
0.93 1.4 0.93 1.4
% c
um
ula
tive
val
ue
Depressant dosage (kg/t)
% yield % sulfur grade % sulfur recovery
Waterberg Witbank

67
Table 4-16: Sulfide flotation of Waterberg coal sample using different SIBX collector dosages. MIBC and Dextrin dosages kept constant at 0.11 kg/t and 0.93 kg/t respectively
Waterberg
Reagent dosage kg/t Yield % Ash %
Sulfur recovery %
Sulfur grade %
1.4 10.3 45.8 53.0 5.8
1.8 11.5 44.1 62.5 6.1
2.33 13.0 36.6 75.6 6.4
Table 4-17: Sulfide flotation of Witbank coal sample using different SIBX collector dosages. MIBC and Dextrin dosages kept constant at 0.28 kg/t and 0.93 kg/t respectively
Witbank
Reagent dosage kg/t Yield % Ash %
Sulfur recovery %
Sulfur grade %
1.4 11.7 30.0 27.1 8.8
1.8 12.9 29.1 33.8 10.2
2.33 13.5 30.8 48.8 13.1
From Table 4-16 and Table 4-17, it is clear that collector dosage at 2.33 kg/t gave optimum
results in terms of high sulfur recoveries and grades. Therefore, 2.33 kg/t was used in the two
stage flotation process.
4.5. UCT Two-Stage Flotation Process Results
Kazadi Mbamba et al. (2012) and Amaral Filho et al. (2011) established the feasibility of the UCT
two-stage flotation process to recover clean coal and a sulfur-rich stream from ultrafine coal
wastes, as well as a sulfur-lean, non-acid forming tailings. The aim of this research is to
investigate whether the incorporation of reflux classification yields better results in terms of
sulfide removal and valuable coal recovery. In order to ascertain this, the UCT two stage
flotation process was carried out on both Waterberg and Witbank coal samples, to enable
comparison with the two combined new flotation-reflux classification process routes. In the
first stage, valuable coal was recovered through coal flotation (taking advantage of the natural
hydrophobicity of coal), while in the second stage, the tailings from the first stage was further
floated (sulfide flotation) to recover pyrite to the concentrate.
The first stage was performed following the same procedure as outlined in Section 3.3.2.1,
using the same reagent conditions as obtained in Section 4.3 (Table 4-13), with the exception of
increased pulp density from 6 to 10 % (300 g of coal sample used instead of 200 g). Upon
completion of the first stage, sulfide flotation reagents for the second stage were introduced

68
into the flotation cell, and sulfide flotation was carried out according to the procedure outlined
in Section 3.3.2.2. The reagents used in the sulfide flotation were as selected in Section 4.4.4.
Table 4-18 and Table 4-19 show the results of the two-stage flotation tests performed on the
Waterberg and Witbank coal samples, respectively. The mass balances are based on 100 units
of feed.
Table 4-18: Results of two-stage flotation tests on the Waterberg coal sample. Stage-wise collector addition in coal flotation stage
Reagent info Amount % Ash % Total sulfur %
1st stage - Coal flotation 1.4 kg/t Nalflote 9858
0.11 kg/t MIBC
Feed 100 50 1.11
Coal concentrate 30.2 24.5 1.28
Tailings 69.8 61.1 0.92
2nd stage – Sulfide flotation
2.33.kg/t SIBX 0.11 kg/t MIBC
0.93 kg/t Dextrin
Feed 69.8 61.1 0.92
Sulfide concentrate 2.2 60.0 17.6
Tailings 67.6 62.7 0.65
Table 4-19: Results of two-stage flotation tests on the Witbank coal sample. Single-stage collector addition in coal flotation stage
Reagent info Amount % Ash % Total sulfur %
1st stage - Coal flotation 1.4 kg/t Nalflote 9858
0.28 kg/t MIBC
Feed 100 44.5 3.1
Coal concentrate 26 22.2 2.16
Tailings 74 54.0 3.43
2nd stage – Sulfide flotation
2.33.kg/t SIBX 0.28 kg/t MIBC
0.93 kg/t Dextrin
Feed 74 54.0 3.43
Sulfide concentrate 11 36.0 10.7
Tailings 63 56.5 2.37
The clean coal yield from the Waterberg coal sample was approximately 30 %, which is lower
than the 40 % obtained previously in the ‘process improvement experiments’ (Table 4-11). This
could be due to the higher pulp density used (300 g of sample instead of 200 g), which could
have resulted in froth crowding and a lower yield. (The figures in the table average of duplicate
tests which produced very similar results, as may be seen in Table D-4 in the Appendix). The
sulfur content of 1.28 % and ash content of 24.5 % are similar to the values obtained previously.
69
As anticipated, the second stage recovered a low volume sulfide rich concentrate with a high
sulfur content of 17.6 %, corresponding to an overall sulfur recovery of 40 % (although there
are some questions regarding the sulfur assays, as discussed below). The final tailings contained
around 70 % of the mass of the feed, with a sulfur content of 0.65 %.
The clean coal yield from the Witbank coal sample was approximately 26 %, with an ash
content of 22.2 % and a sulfur content of 2.2 %. These results are very similar to what was
obtained previously (Table 4-10); froth crowding may not have occurred, as it tends to happen
only when the flotation yield is high. Once again, the second stage recovered a low volume
sulfide-rich concentrate with a high sulfur content of 10.7 %, corresponding to an overall sulfur
recovery of around 50 %; however, the final tailings still contained reasonably high sulfur
content of 2.37 %.
The UCT two-stage flotation revealed that the sulfur content was reduced by approximately 60
% in the benign tailings for both coal samples. The results of the UCT two-stage process will be
compared with the results of the combined flotation-reflux classification tests in Chapter 7
below.
It should be noted that some of the sulfur mass balances in Tables 4-18 and 4-19 are poor,
particularly for the Waterberg coal sample, which contained a high proportion of sulfate sulfur.
Kazadi Mbamba et al. (2012) had similar sulfur imbalance that was attributed to the dissolution
of sulfate sulfur during the flotation stage. The discrepancy may also be due to the mode of
collection of the feed sample during the flotation stage, which was taken using a syringe as
described in Section 3.3.2.1. This practice has been discontinued in the Centre for Minerals
Research Laboratory at UCT. These discrepancies should not adversely affect the integrity of
the results in this thesis.
4.6. Chapter Summary
Sample characterization analysis carried out on the as-received samples revealed that both
samples contained about 50 % ash and high sulfur contents of 2.04 % and 4.18 % for the
Waterberg and Witbank coal, respectively, about 50 % of which was attributed to pyritic sulfur.
The XRD analysis performed on both samples showed that the Witbank sample did not contain
sufficient acid neutralizing minerals (dolomite and calcite), while the acid neutralizing minerals
in the Waterberg sample constituted about 11 % of the total sample. Release analysis and
preliminary flotation work carried out using dodecane collector at high dosages of 7 to 27.9 kg/t
showed that both samples were difficult to float due to low recoveries and yields obtained.
Additional tests were carried out using Nalflote 9858 and oleic acid collectors in order to
further improve the flotation performance. Results showed that Nalflote 9858 at 1.4 kg/t gave
better results in terms of coal recovery and sulfur reduction for both coal samples.

70
Consequently, this collector was selected for use in all the coal flotation tests, employing stage-
wise collector addition at 0.11 kg/t MIBC frother dosage for the Waterberg sample and single-
stage collector addition at 0.28 kg/t MIBC frother dosage for the Witbank coal. These conditions
were used in the combined flotation-reflux classification tests and in the coal flotation stage of
the UCT two-stage process.
For the sulfide flotation experiment, SIBX at 2.33 kg/t was found to perform better that PAX
collector. Dextrin depressant at 0.93 kg/t dosage was used for both coal samples, while 0.11
and 0.28 kg/t MIBC frother dosage were used for the Waterberg and Witbank coal samples
respectively.

71
5. CHAPTER FIVE - RESULTS AND DISCUSSION: REFLUX CLASSIFICATION
To facilitate the discussion, the flow sheets of the two process routes first presented in Figure
4-3 are reproduced in Figure 5-1, highlighting the reflux classification steps reported in this
chapter.
Feed (F) Coal flotation
ScreenReflux
classification
1T (-53 µm)
1T (+53 µm)
Underflow (1T-UF)
Overflow (1T-OF)
Concentrate (1C)
Tailings (1T)
Process route 1
Feed (F) Screen
Reflux classification
Coal flotation
F (-53 µm)
F ( +53 µm)
Underflow (F-UF)
Overflow (F-OF) Concentrate (2C)
Tailings (2T)
Process route 2
Figure 5-1: Process route highlighting reflux classification stage
Reflux classification was carried out on the as-received feed samples of the Waterberg and
Witbank coals, and on the tailings of the coal flotation tests performed on each sample as
described in Chapter 4. These experiments correspond to process routes 2 and 1, respectively,
in the combined flotation-reflux classification col desulfurization process being investigated in
this thesis. The work on these four samples was carried out at NWU using a laboratory scale
reflux classifier (RC) unit designed and constructed at NWU.
Two different types of runs were carried out: fractionation runs to determine the optimum
water flow rate at which to operate the reflux classifier for each sample, and discrete runs at
the set flow rates obtained from the fractionation runs to produce sulfide-rich concentrates and
sulfide-rich tailings (process route 1) and desulfurization material to take back to UCT for coal
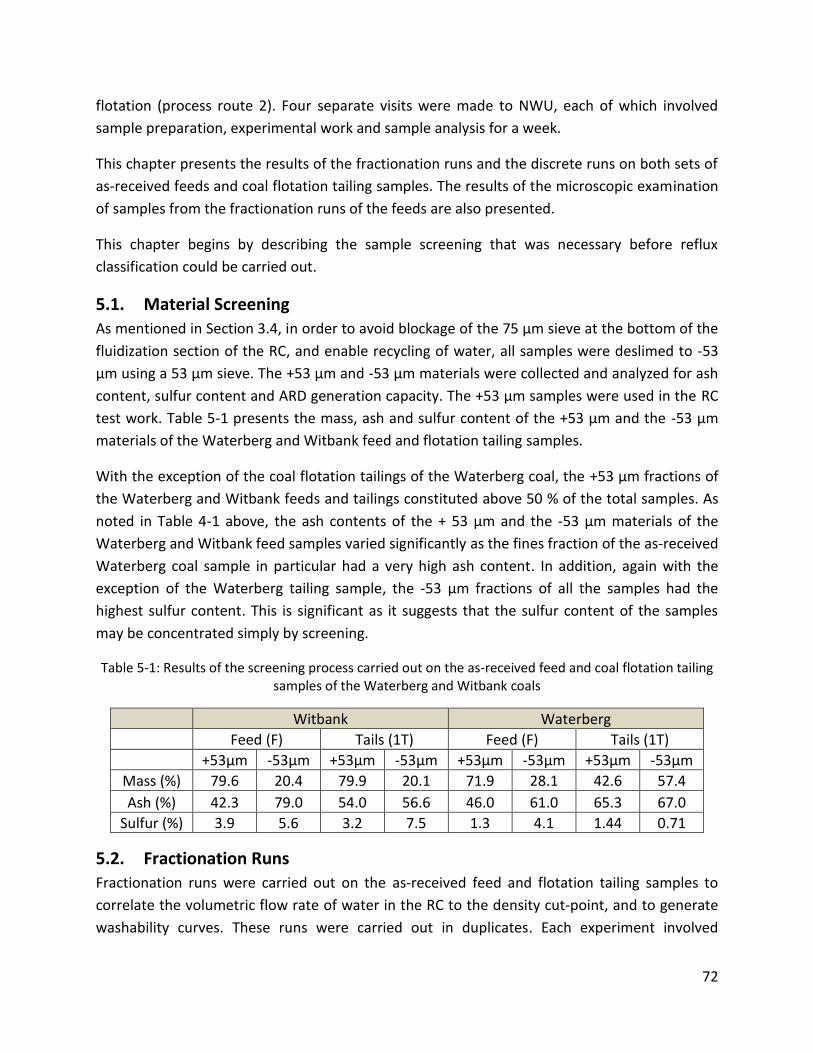
72
flotation (process route 2). Four separate visits were made to NWU, each of which involved
sample preparation, experimental work and sample analysis for a week.
This chapter presents the results of the fractionation runs and the discrete runs on both sets of
as-received feeds and coal flotation tailing samples. The results of the microscopic examination
of samples from the fractionation runs of the feeds are also presented.
This chapter begins by describing the sample screening that was necessary before reflux
classification could be carried out.
5.1. Material Screening
As mentioned in Section 3.4, in order to avoid blockage of the 75 µm sieve at the bottom of the
fluidization section of the RC, and enable recycling of water, all samples were deslimed to -53
µm using a 53 µm sieve. The +53 µm and -53 µm materials were collected and analyzed for ash
content, sulfur content and ARD generation capacity. The +53 µm samples were used in the RC
test work. Table 5-1 presents the mass, ash and sulfur content of the +53 µm and the -53 µm
materials of the Waterberg and Witbank feed and flotation tailing samples.
With the exception of the coal flotation tailings of the Waterberg coal, the +53 µm fractions of
the Waterberg and Witbank feeds and tailings constituted above 50 % of the total samples. As
noted in Table 4-1 above, the ash contents of the + 53 µm and the -53 µm materials of the
Waterberg and Witbank feed samples varied significantly as the fines fraction of the as-received
Waterberg coal sample in particular had a very high ash content. In addition, again with the
exception of the Waterberg tailing sample, the -53 µm fractions of all the samples had the
highest sulfur content. This is significant as it suggests that the sulfur content of the samples
may be concentrated simply by screening.
Table 5-1: Results of the screening process carried out on the as-received feed and coal flotation tailing samples of the Waterberg and Witbank coals
Witbank Waterberg
Feed (F) Tails (1T) Feed (F) Tails (1T)
+53µm -53µm +53µm -53µm +53µm -53µm +53µm -53µm
Mass (%) 79.6 20.4 79.9 20.1 71.9 28.1 42.6 57.4
Ash (%) 42.3 79.0 54.0 56.6 46.0 61.0 65.3 67.0
Sulfur (%) 3.9 5.6 3.2 7.5 1.3 4.1 1.44 0.71
5.2. Fractionation Runs
Fractionation runs were carried out on the as-received feed and flotation tailing samples to
correlate the volumetric flow rate of water in the RC to the density cut-point, and to generate
washability curves. These runs were carried out in duplicates. Each experiment involved

73
collecting overflow product samples at 20, 40, 60, 80 and 100 L/min water flow rate, and an
underflow product. All samples were analyzed for density (using the pycnometer described in
Section 3.4), ash and sulfur content. Details of the experimental procedure are outlined in
Section 3.4.
Figure 5-2 shows a graph of the density of each overflow fraction vs water flow rate obtained
from the fractionation of the Waterberg and Witbank feed and flotation tailing samples.
Figure 5-2: Figure relating water flow rate to the sample density of each overflow products obtained from fractionation runs on feed and tailings samples of the Waterberg and Witbank coals
Research carried out at NWU by Rakgase et al. (2012) showed a linear relationship between the
sample density and the water flow rate (see Figure 2-12). However, the results from Figure 5-2
show that the relationship does not completely follow a linear pattern, although the R2 values
ranges from 0.92 to 0.97. The densities of the sample obtained at 20 L/min were about 1.4 g/cc,
which corresponds to the density of good quality coal (see Table 2-2). Increasing the water flow
rate increased the density to as about 2.7 g/cc. This indicates that as the water flow rate
increases, more ash and sulfide minerals were recovered in the overflow product. This is
discussed in more detail in the sections below.
5.2.1. Fractionation run on Waterberg feed and tailing samples
Figure 5-3 shows the cumulative % yield vs the cumulative % ash from the fractionation runs
carried out on the Waterberg as-received feed and coal flotation tailings samples. It is clear that
reflux classification gave much better results than flotation (refer to Chapter 4). It must be
R² = 0.9324 R² = 0.9177 R² = 0.9459 R² = 0.9657
1.0
1.2
1.4
1.6
1.8
2.0
2.2
2.4
2.6
2.8
0 20 40 60 80 100
Sam
ple
de
nsi
ty (
g/cc
)
Water flow rate (L/min)
Waterberg feed Waterberg tails Witbank feed Witbank tails
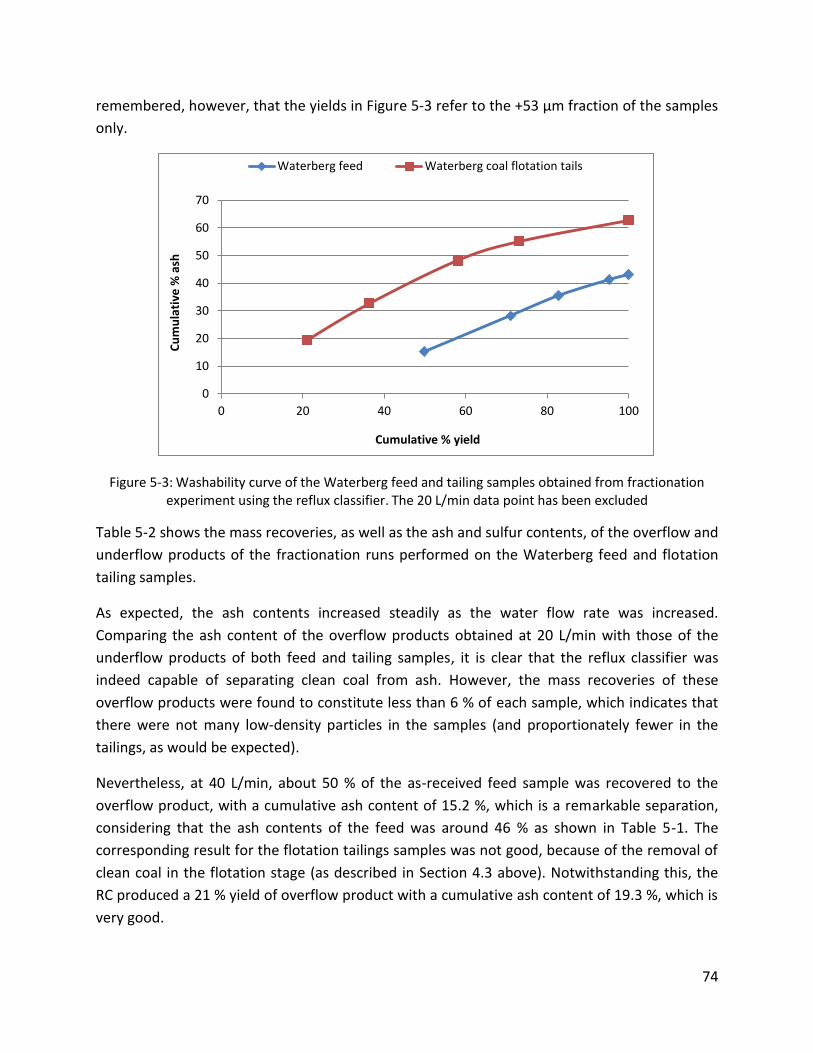
74
remembered, however, that the yields in Figure 5-3 refer to the +53 µm fraction of the samples
only.
Figure 5-3: Washability curve of the Waterberg feed and tailing samples obtained from fractionation experiment using the reflux classifier. The 20 L/min data point has been excluded
Table 5-2 shows the mass recoveries, as well as the ash and sulfur contents, of the overflow and
underflow products of the fractionation runs performed on the Waterberg feed and flotation
tailing samples.
As expected, the ash contents increased steadily as the water flow rate was increased.
Comparing the ash content of the overflow products obtained at 20 L/min with those of the
underflow products of both feed and tailing samples, it is clear that the reflux classifier was
indeed capable of separating clean coal from ash. However, the mass recoveries of these
overflow products were found to constitute less than 6 % of each sample, which indicates that
there were not many low-density particles in the samples (and proportionately fewer in the
tailings, as would be expected).
Nevertheless, at 40 L/min, about 50 % of the as-received feed sample was recovered to the
overflow product, with a cumulative ash content of 15.2 %, which is a remarkable separation,
considering that the ash contents of the feed was around 46 % as shown in Table 5-1. The
corresponding result for the flotation tailings samples was not good, because of the removal of
clean coal in the flotation stage (as described in Section 4.3 above). Notwithstanding this, the
RC produced a 21 % yield of overflow product with a cumulative ash content of 19.3 %, which is
very good.
0
10
20
30
40
50
60
70
0 20 40 60 80 100
Cu
mu
lati
ve %
ash
Cumulative % yield
Waterberg feed Waterberg coal flotation tails

75
In Table 5-2, the sulfur contents are seen to decrease from 20 L/min to 80 L/min, and then
increase. It was expected that the samples at the 20 L/min water flow rate would have the
lowest sulfur content due to the high density difference between coal and pyrite. The
unexpected results may be due to the effect of size and shape of particles, or the presence of
organic sulfur in the clean coal. It is worth noting that the sulfur recoveries at the 20 L/min flow
rate constituted less than 6 % of the total sulfur in the samples. Looking at the sulfur
deportment, it can be speculated that the high sulfur contents in the 20 and 40 L/min flow rate
samples represent mainly organic sulfur, while the sulfur in the 100 L/min and underflow
samples represent mainly pyritic sulfur.
Table 5-2: Cumulative fractionation run results on the Waterberg coal feed and flotation tailings
Feed (F) Tailing 1T(+53µm)
Mass recovery
% Ash % Sulfur
%
Sulfur recovery
%
Mass recovery
% Ash %
Sulfur %
Sulfur recovery
%
20 5.2 9.8 1.1 4.7 3.0 15.4 1.7 3.0
40 49.8 15.2 0.8 33.0 21.0 19.3 1.1 13.9
60 71.1 28.1 0.7 39.8 36.3 32.7 0.8 16.6
80 82.8 35.5 0.6 42.9 58.0 48.2 0.6 20.3
100 95.2 41.3 0.8 63.0 73.2 55.2 0.6 25.7
underflow 100.0 43.1 1.2 100.0 100.0 62.7 1.7 100.0
5.2.2. Fractionation run on Witbank feed and tailing samples
Figure 5-4 shows the cumulative % yield vs the cumulative % ash from the fractionation runs
carried out on the Witbank as-received feed and coal flotation tailings samples. It is clear that
reflux classification gave much better results than flotation. It must be remembered, however,
that the yields in Figure 5-3 refer to the +53 µm fraction of the samples only.
Table 5-3 shows the mass recoveries, ash contents and sulfur contents of the fractionation runs performed on the Witbank feed and flotation tailing samples.
The same trends may be seen as with the Waterberg feed and tailing samples. The ash contents
increased steadily from below 10 % in the overflow products obtained at 20 L/min flow rate, to
as high as 70 % in the underflow products. This confirms the fact that the reflux classifier is very
good at separating ash from coal.

76
Figure 5-4: Washability curve of the Witbank feed and tailing samples obtained from fractionation experiment using the reflux classifier. The 20 L/min data point has been excluded
Table 5-3: Cumulative fractionation run results on the Witbank coal feed and flotation tailings
Feed (F) Tailing 1T (+53 µm)
Mass recovery
% Ash % Sulfur
%
Sulfur recovery
%
Mass recovery
% Ash %
Sulfur %
Sulfur recovery
%
20 1.5 8.7 1.8 0.9 0.5 9.8 1.9 0.3
40 36.4 14.9 1.2 14.6 12.9 13.2 1.0 4.0
60 64.2 28.5 1.2 25.1 37.6 37.3 1.0 11.2
80 85.0 38.6 1.5 42.8 70.0 49.0 1.1 23.5
100 96.9 43.2 2.2 69.0 91.8 55.1 1.3 34.8
underflow 100.0 44.1 3.0 100.0 100.0 56.3 3.3 100.0
The sulfur analyses also produced some unexpected results, in that at 20 L/min, the sulfur
contents were about 1.85 for both samples, and significantly less at the 40 and 60 L/min water
flow rate. The variation in the sulfur content could again be due to the different forms of sulfur
occurring in the overflow products obtained at the different flow rates. However, unlike the
sulfur deportment in the Waterberg samples (Table 5-2), the sulfur values in the Witbank feed
and coal flotation tailing samples were evenly distributed in the overflow products from 20
L/min to 80 L/min flow rates, and only increased dramatically in the underflow fraction.
0
10
20
30
40
50
60
70
0 20 40 60 80 100
Cu
mu
lati
ve %
ash
Cumulative % yield
Witbank feed Witbank coal flotation tails

77
5.2.3. Microscopic analysis
In order to further understand the unexpectedly high sulfur contents of the overflow products
obtained at 20 L/min water flow rate, samples from the underflows and all overflow products
for both coals were mounted in blocks and viewed under a microscope. Details of the
procedure are described in Section 3.2.7 above. A better approach would have been to
determine the different forms of sulfur via sulfur speciation analysis, but this was not feasible
due to insufficient sample mass of the overflow product at 20 l/min water flow rate.
Figure 5-5 shows microscopic views of samples from the RC fractionation runs carried out on
the as-received samples of the Waterberg coal. Each micrograph represents a view of 500 µm
across. The ‘bright yellow’ minerals are assumed to be pyrite. From the figure, it is clear that
the samples from the 20 L/min water flow rate contained more bright yellow minerals than
samples at 40 L/min, 60 L/min and 80 L/min, which corresponds with Table 5-2. The underflow
product contained much more bright yellow minerals indicative of high sulfur content of about
10 % from Table 5-2.
Figure 5-6 shows similar results from the RC fractionation runs on the as-received sample of the
Witbank coal. As with the Waterberg coal feed, more ‘bright yellow’ minerals were found in
the 20 L/min water flow rate than in the 40 and 60 L/min water flow rate samples, which is in
line with Table 5-3. The overflow and underflow products from the RC fractionation runs on the
coal tailing samples of the Waterberg and Witbank coals also showed similar trends. These
results are presented in Appendix D.
5.3. Discrete Runs
Discrete runs were performed at specific water flow rates on the +53 µm fractions of both as-
received feed and coal flotation tailing samples of the Waterberg and Witbank coals, to obtain
samples for process routes 2 and 1 respectively (see Figure 5-1). 50 L/min water flow rate was
used for both the as-received feed samples, while 100 L/min was used for both flotation tailing
samples. The main aim of the tailings reflux classification was to achieve a sulfide-rich
underflow product, and a sulfide-lean overflow product; hence, a flow rate of 100 L/min was
chosen to achieve this separation. A flow rate of 50 L/min was chosen for the feed samples as it
was ideal to operate between 20 and 60 L/min.
Table 5-4 shows the results obtained from the discrete run experiment carried out on the
Waterberg coal sample at 50 L/min water flow rate for the feed sample and 100 L/min for the
coal flotation tailing sample. The feed (+53 µm) ash and sulfur contents were 46 % and 1.3 %
respectively, while the tailing sample (+53 µm) ash and sulfur contents were 65 % and 1.44 %
respectively (see Table 5-1).

78
As discussed earlier, the reflux classifier effectively separated the ash from coal, which is seen
in the feed overflow and underflow ash contents of 18 % and 87 % respectively. The sulfur
content also reduced from 1.44 % to 1.01 % in the overflow. The sulfur recovery of the tailing
underflow was remarkably high at a value of 73 %, with a high sulfur content of 3.3 %.
Table 5-4: Discrete run results of the Waterberg feed and tailing samples at 50 and 100 L/min flow rate respectively
Feed Coal flotation tailing
Overflow Underflow Overflow Underflow
Sulfur (%) 1.01 2.02 0.6 3.3
Ash (%) 18.0 87.5 56.0 78.0
Mass recovery (%) 62.4 37.6 67.2 32.8
Sulfur recovery (%) 45.4 54.6 27.1 72.9
Table 5-5 shows the results obtained from the discrete run experiment carried out on the
Witbank coal feed and tailing samples. The feed (+53 µm) ash and sulfur contents were 42.3 %
and 3.9 % respectively, while the tailing sample (+53 µm) ash and sulfur contents were 54 %
and 3.2 % respectively (see Table 5-1).
The sulfur recoveries and sulfur contents of the underflows of both feed and tailings were
found to be very high compared to those of the overflow products, from this, it is clear that the
reflux classifier effectively separates the sulfur from the coal, with high sulfur recoveries up to
80 %.
Table 5-5: Discrete run results of the Witbank feed and tailing samples at 50 and 100 L/min flow rate respectively
Feed Coal flotation tailing
Overflow Underflow Overflow Underflow
Sulfur (%) 1.05 8.7 1.01 8.3
Ash (%) 23.0 75.4 45.0 75.0
Mass recovery (%) 60.0 40.0 65.3 34.7
Sulfur recovery (%) 15.3 84.7 18.6 81.4
In summary, the reflux classifier separated the ash and sulfur from the coal samples very
efficiently, producing clean coal overflow products with ash contents below 25 % and sulfur
grades below 1.1 %.
However, although the sulfur contents in these streams were found to be low, this does not
conclusively indicate that they are non-acid forming. Consequently, ARD characterization tests
were performed on the samples to ascertain their acid producing capacity. The results are
shown in Chapter 6.

79
20 L/min 40 L/min 60 L/min
Underflow100 L/min80 L/min
Figure 5-5: Microscopic view of fractionation run samples of the Waterberg feed. Microscopic size for all samples was at 500µm
20 L/min 40 L/min 60 L/min
Underflow100 L/min80 L/min
Figure 5-6: Microscopic view of fractionation run samples of the Witbank feed. Microscopic size for all samples was at 500 µm

80
6. CHAPTER SIX - RESULTS OF ARD CHARACTERIZATION TESTS
6.1. Introduction
The previous chapters presented the results of the investigations into the use of froth flotation
and reflux classification in the desulfurization of ultrafine coal wastes. The main objective is to
produce salable coal, sulfide-rich concentrate and benign tailings that can be disposed of
without risk of ARD generation. Two process routes were established, as shown in Figure 1-2, in
order to ascertain the effectiveness of both methods in coal desulfurization. The second
objective of the research described in this thesis is to compare both process routes with the
UCT two-stage process (see Figure 1-1).
A further objective of the research is to determine the acid generating potential of all samples
obtained from the flotation and reflux classification process routes in order to ensure that the
objective has been accomplished. According to Lawrence et al. (1989), two or more tests should
be used together in ARD classification to provide a more confident assessment. This chapter
presents results obtained from the acid base accounting (ABA) and the net acid generating
(NAG) tests performed on all samples from process routes 1 and 2, and the UCT two-stage
process, to quantify and classify their acid producing potential. Figure 6-1 shows a schematic of
both process routes and the UCT two-stage process. The abbreviations of each stream will be
used throughout this chapter.
The criteria for the static tests are outlined in Table 2-1, but have been presented again in Table
6-1 below for ease of reference. The net acid production potentials (NAPP) obtained from the
ABA tests and the NAG pH results obtained from the NAG tests were combined to provide a
more accurate classification.
Table 6-1: ARD classification using ABA and NAG static tests (Stewart et al., 2009)
ARD characterization
tests
Result
Units
Classification
Acid Base Accounting
NAPP > 20 -20 < NAPP < 20
NAPP < -20
kg H2SO4/t
Acid forming Potentially acid forming
Non-acid forming
Net Acid Generation
NAG pH < 4 & NAG pH7 > 10 NAG pH < 4 & NAG pH7 = 5-10
NAG pH > 4
kg H2SO4/t kg H2SO4/t
pH
Acid forming Potentially acid forming
Non-acid forming
Combined static tests
NAG pH < 4.5 and NAPP > 0 NAG pH > 4.5 and NAPP < 0
Potentially acid forming Non-acid forming
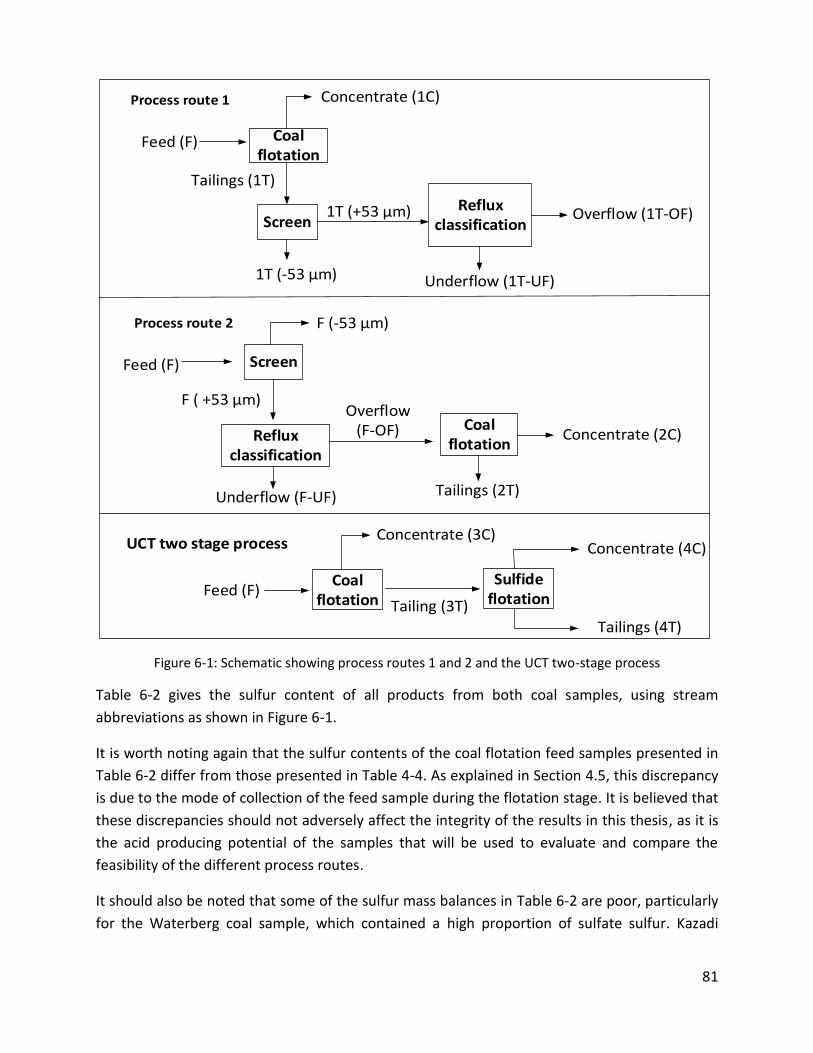
81
Feed (F)Coal
flotation
Concentrate (3C)
Tailings (4T)
SulfideflotationTailing (3T)
Concentrate (4C)UCT two stage process
Feed (F) Coal flotation
ScreenReflux
classification
1T (-53 µm)
1T (+53 µm)
Underflow (1T-UF)
Overflow (1T-OF)
Concentrate (1C)
Tailings (1T)
Process route 1
Feed (F) Screen
Reflux classification
Coal flotation
F (-53 µm)
F ( +53 µm)
Underflow (F-UF)
Overflow (F-OF) Concentrate (2C)
Tailings (2T)
Process route 2
Figure 6-1: Schematic showing process routes 1 and 2 and the UCT two-stage process
Table 6-2 gives the sulfur content of all products from both coal samples, using stream
abbreviations as shown in Figure 6-1.
It is worth noting again that the sulfur contents of the coal flotation feed samples presented in
Table 6-2 differ from those presented in Table 4-4. As explained in Section 4.5, this discrepancy
is due to the mode of collection of the feed sample during the flotation stage. It is believed that
these discrepancies should not adversely affect the integrity of the results in this thesis, as it is
the acid producing potential of the samples that will be used to evaluate and compare the
feasibility of the different process routes.
It should also be noted that some of the sulfur mass balances in Table 6-2 are poor, particularly
for the Waterberg coal sample, which contained a high proportion of sulfate sulfur. Kazadi

82
Mbamba et al. (2012) had similar sulfur imbalance that was attributed to the dissolution of
sulfate sulfur during the flotation stage.
Because of the discrepancies noted above, static ARD characterization tests were not carried
out on the feed samples from process route 1 and the UCT two-stage process (highlighted in
Table 6-2); ABA and NAG tests were performed only on the Waterberg and Witbank feed
samples from process route 2. In addition, the coal flotation tests performed to generate
samples 1C and 1T were conducted in a similar fashion to obtain 3C and 3T (same reagent
conditions and feed samples), therefore, ARD characterization tests were only carried out for
samples 1C and 1T, and it is assumed that 3C and 3T will show similar trends.
Table 6-2: Sulfur content of all samples used in ARD characterization tests
Legend Samples Sulfur content %
Waterberg Witbank
Process route 1
F Feed 1.2 3.6
1C Coal flotation concentrate 1.4 2.6
1T Coal flotation tailing 1.02 4.2
1T (+53 µm) Coal flotation deslimed tailing (+53 µm) 1.44 3.2
1T (-53 µm) Coal flotation deslimed tailing (-53 µm) 0.71 7.5
1T - OF RC deslimed tailing overflow 0.6 1.01
1T - UF RC deslimed tailing underflow 3.3 8.3
Process route 2
F Feed 2.04 4.18
F (+53 µm) Deslimed feed (+53 µm) 1.3 3.9
F (-53 µm) Deslimed feed (-53 µm) 4.1 5.6
F - UF RC deslimed feed underflow 2.0 8.7
F - OF RC deslimed feed overflow 1.01 1.05
2C RC deslimed feed overflow, coal flotation concentrate 1.03 0.9
2T RC deslimed feed overflow, coal flotation tailing 1.1 1.09
UCT two-stage process
F Feed 1.11 3.1
3C Coal flotation concentrate (same as 1C) 1.28 2.16
3T Coal flotation tailing (same as 1T) 0.92 3.43
4C UCT two-stage sulfide flotation concentrate 17.6 10.7
4T UCT two-stage sulfide flotation tailing 0.65 2.37
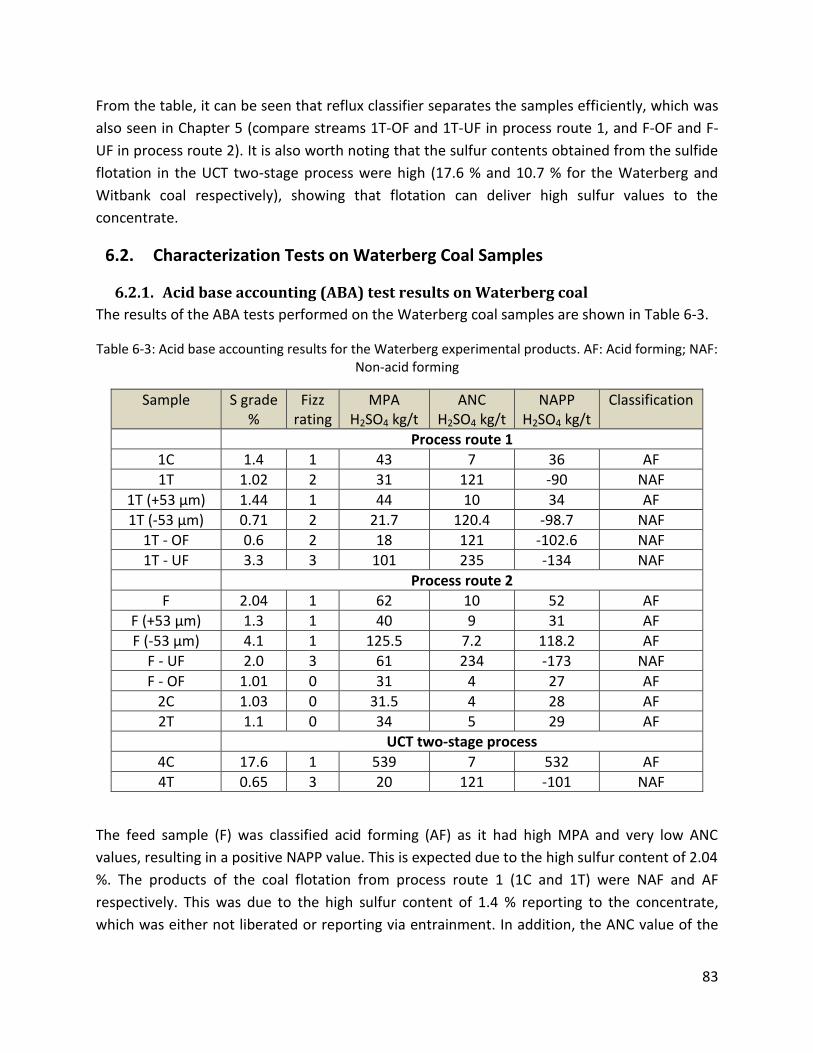
83
From the table, it can be seen that reflux classifier separates the samples efficiently, which was
also seen in Chapter 5 (compare streams 1T-OF and 1T-UF in process route 1, and F-OF and F-
UF in process route 2). It is also worth noting that the sulfur contents obtained from the sulfide
flotation in the UCT two-stage process were high (17.6 % and 10.7 % for the Waterberg and
Witbank coal respectively), showing that flotation can deliver high sulfur values to the
concentrate.
6.2. Characterization Tests on Waterberg Coal Samples
6.2.1. Acid base accounting (ABA) test results on Waterberg coal
The results of the ABA tests performed on the Waterberg coal samples are shown in Table 6-3.
Table 6-3: Acid base accounting results for the Waterberg experimental products. AF: Acid forming; NAF: Non-acid forming
Sample S grade %
Fizz rating
MPA H2SO4 kg/t
ANC H2SO4 kg/t
NAPP H2SO4 kg/t
Classification
Process route 1
1C 1.4 1 43 7 36 AF
1T 1.02 2 31 121 -90 NAF
1T (+53 µm) 1.44 1 44 10 34 AF
1T (-53 µm) 0.71 2 21.7 120.4 -98.7 NAF
1T - OF 0.6 2 18 121 -102.6 NAF
1T - UF 3.3 3 101 235 -134 NAF
Process route 2
F 2.04 1 62 10 52 AF
F (+53 µm) 1.3 1 40 9 31 AF
F (-53 µm) 4.1 1 125.5 7.2 118.2 AF
F - UF 2.0 3 61 234 -173 NAF
F - OF 1.01 0 31 4 27 AF
2C 1.03 0 31.5 4 28 AF
2T 1.1 0 34 5 29 AF
UCT two-stage process
4C 17.6 1 539 7 532 AF
4T 0.65 3 20 121 -101 NAF
The feed sample (F) was classified acid forming (AF) as it had high MPA and very low ANC
values, resulting in a positive NAPP value. This is expected due to the high sulfur content of 2.04
%. The products of the coal flotation from process route 1 (1C and 1T) were NAF and AF
respectively. This was due to the high sulfur content of 1.4 % reporting to the concentrate,
which was either not liberated or reporting via entrainment. In addition, the ANC value of the
84
tailing was quite high, suggesting that much of the acid neutralizing minerals were retained in
the tails.
As mentioned in Section 3.4 and Chapter 5, in order to run the RC, the samples had to be
deslimed by screening out the -53 µm fraction. The deslimed tailings, 1T (+53 µm), was seen to
have a higher sulfur content of 1.44 %, and a low neutralizing capacity of 10 kg H2SO4/t. The
acid neutralizing minerals (in stream 1T) seem to have reported to the -53 µm fraction, which is
evident from the high ANC value of the 1T (-53 µm) stream.
However, the ANC values obtained for the 1T-OF and 1T-UF samples were significantly higher
(121 and 235 kg H2SO4/t respectively) than the ANC value of the feed 1T (+53 µm). This
impacted on the ARD classification of the samples as both samples (1T-OF and 1T-UF) were
found to be NAF, while 1T (+53µm) was found to be acid forming due to the low ANC value. As
1T-UF had a high sulfur content of 3.3 %, it may be suspected that the end result classification
of NAF is false and would need to be verified using other characterization tests.
In process route 2, the feed overflow and underflow products (F-OF and F-UF) were classified
AF and NAF respectively. This is unexpected as an AF classification would be expected for a
sample with high sulfur content; however, due to the high ANC value of 234 kg H2SO4/t
obtained in the underflow product (F-UF), the end result was NAF. The ANC of a sample is
dominated by the dissolution of carbonate minerals present in the sample, and it is believed
that silicate minerals typically have a greater overall ANC compared to calcite minerals (Weber
et al., 2005). Silicate minerals report to the underflow during coal classification and thus give a
higher ANC value. However, it would be useful to verify this further by comparison with other
characterization tests.
As discussed in Section 4.3.7, not much separation was achieved by coal flotation of the RC feed
overflow products (2C and 2T) from process route 2, hence, the classification still remained acid
forming, as was the feed (F-OF).
As expected, the concentrate from the UCT two-stage sulfide flotation (4C) was highly acid
forming, with a high MPA value of 532 kg/t H2SO4 and a low ANC value of 7 kg/t H2SO4.
6.2.2. Net acid generating (NAG) test results on Waterberg coal
Table 6-4 shows the result of the net acid generation (NAG) tests for the Waterberg samples.

85
Table 6-4: Net acid generation test results for the Waterberg experimental products. AF: Acid forming; NAF: Non-acid forming
Sample S grade %
NAG pH NAG pH 4.5 H2SO4 kg/t
NAG pH 7 H2SO4 kg/t
Classification
Process route 1
1C 1.4 5.25 - 12.1 NAF
1T 1.02 5.55 - 7.1 NAF
1T (+53 µm) 1.44 6.55 - 1.0 NAF
1T (-53 µm) 0.71 5.33 15.1 NAF
1T - OF 0.6 5.60 - 12.9 NAF
1T - UF 3.3 7.19 - - NAF
Process route 2
F 2.04 6.48 - 0.6 NAF
F (+53 µm) 1.3 5.25 - 9.1 NAF
F (-53 µm) 4.1 5.3 11.8 NAF
F - UF 2.0 7.09 - - NAF
F - OF 1.01 4.23 4.6 23.0 AF
2C 1.03 5.19 - 73.0 NAF
2T 1.1 3.93 5.7 26.7 AF
UCT two-stage process
4C 17.6 2.18 120 21.9 AF
4T 0.65 6.26 - 0.5 NAF
As mentioned in Section 2.2.4, the NAG test measures the overall acid potential and acid
neutralizing capacity of a sample, which results in a value of the net acid generated by the
sample.
According to the criteria outlined in Table 6-1, the feed samples (F, F (+53 µm) and F (-53 µm))
were classified NAF as they had NAG pH > 4.5. All tailings from both process routes were
classified NAF except for 2T with a NAG pH < 4.5, although it had a low NAG pH4.5 of 5.7 kg
H2SO4/t. It is worth noting the high NAG pH values of the reflux classification underflow
products (1T-UF and F-UF) of 7.19 and 7.09, respectively, despite their relatively high sulfur
content; this confirms the ABA test as there are likely to be more acid neutralizing minerals in
the underflow products.
As with the ABA test, the feed underflow and overflow products from the RC of process route 2
were NAF and AF respectively, even though the underflow had much higher sulfur content. As
expected, the concentrate from the UCT two-stage sulfide flotation (4C) was found to be AF,
with a high net acid generating value of 120 kg H2SO4/t and a NAGpH of 2.18. All other samples
were classified non-acid forming due to their high NAG pH values > 4.5.

86
As mentioned in Section 3.5.2, sequential NAG test is normally performed on samples with
pyrite or total sulfur greater than 0.7 % (Stewart et al., 2006). Table 6-5 shows the total number
of sequential NAG tests as well as the total NAG pH at 4.5 and 7 performed on three samples
with NAG pH < 4.5. Details of each step are given in Appendix D.
Table 6-5: Sequential NAG test results for selected Waterberg samples with high sulfur content
Number of sequential NAG
Total NAG pH 4.5 H2SO4 kg/t
Total NAG pH 7 H2SO4 kg/t
F – OF (process route 2) 2 4.6 45.1
2T (process route 2) 5 14.7 110.3
4C (UCT two-stage process) 7 205.6 132.0
The total number of sequential stages required for the 4C sample was 7, with total NAG pH
values at 4.5 and 7 of 206 kg H2SO4/t and 132 kg H2SO4/t, respectively. The total NAG pH 4.5 for
F-OF was 4.6 kg H2SO4/t, indicating that the acid generating capacity of the sample was low
compared to that of the 4C sample.
6.2.3. Combination of ABA and NAG tests: Waterberg coal
Figure 6-2 shows the combination of ABA and NAG tests for the Waterberg coal samples.
Feed samples (F, F (+53 µm) and F (-53 µm)), as well as 1C, 2C and 1T (+53 µm) were found to
be in the uncertain region. This is because they were classified AF in the ABA test but had NAG
pH > 4.5 in the NAG test. This discrepancy can be attributed to the different forms of sulfur in
the samples as the ABA method assumes that the total sulfur is all pyrite and does not take into
account the organic or sulfate sulfur.
According to Caruccio et al. (1988), organic or sulfate sulfur does not take part in the acid
generation process. Therefore, the MPA may overestimate the acid generation potential of a
sample due to the presence of non-acid forming sulfur-bearing minerals (Stewart et al., 2006).
On the other hand, the reflux classification underflow products (1T-UF and F-UF) were both
found to be NAF in both the ABA and NAG tests, despite their high sulfur contents of 3.3 % and
2.0 % respectively. This was attributed to their high ANC and NAG pH values leading to negative
NAPPs. However, another explanation for this could again be the different forms of sulfur; the
total sulfur reported combines all forms of sulfur, and there could be more organic sulfur in the
underflow products than there is pyrite.
It is recommended that a kinetic test, with particular reference to the UCT biokinetic test, be
performed on all the products to confirm their acid producing potential (refer to Section 2.2.4).

87
Figure 6-2: Combination of ABA and NAG tests on the Waterberg coal sample: NAG pH versus NAPP
6.3. Characterization Tests on Witbank Coal Samples
6.3.1. Acid base accounting (ABA) test results on Witbank coal
The results of the ABA tests performed on the Witbank coal samples are shown in Table 6-6. All
samples were classified acid forming, having NAPP values greater than 20 kg H2SO4/t. It is worth
noting that the ANC values of all the samples were very low (less than 5 kg H2SO4/t) suggesting
that no matter how low the MPA or total sulfur content of a particular sample, the NAPP value
will most likely be greater than 20 kg H2SO4/t due to the lack of acid neutralizing minerals
0
1
2
3
4
5
6
7
8
-300 -200 -100 0 100 200 300 400 500
NA
G p
H (
kg H
2SO
4/t
)
NAPP (kg H2SO4/t)
F
F (+53 µm)
1C
1T
1T (+53 µm)
1T (OF)
1T (UF)
F (OF)
F(UF)
2C
2T
4C
4T
UC
UC
PAF
NAF

88
present in that particular sample (refer to Table 4-2). An example of this is the 2C sample with a
low sulfur content of 0.9 %, but a positive NAPP value.
The fizz ratings of all the samples were found to be zero, which is reflected in the similar ANC
values obtained in all samples, i.e. the amount of acid added corresponds to the stoichiometric
neutralization potential of the samples (Lawrence & Wang, 1997). This implies that there were
insufficient acid neutralizing minerals in the samples. This is evident in Table 4-2 as the Witbank
feed sample lacked the presence of dolomite and calcite which are the main acid neutralizing
minerals. Again, as with the Waterberg coal, not much separation was achieved by coal
flotation of the RC feed overflow products (2C and 2T) from process route 2.
As expected, the concentrate from the UCT two-stage sulfide flotation (4C) was highly acid
forming, with a high MPA of 327 kg H2SO4/t and a low ANC value of 4.1 kg H2SO4/t.
Table 6-6: Acid base accounting results for the Witbank experimental products
Sample S grade %
Fizz rating
MPA H2SO4 kg/t
ANC H2SO4 kg/t
NAPP H2SO4 kg/t
Classification
Process route 1
1C 2.6 0 79.6 4.1 75.5 AF
1T 4.21 0 129 4.2 124.6 AF
1T (+53 µm) 3.2 0 98 4.2 93.8 AF
1T (-53 µm) 7.5 0 229.5 4.1 225.4 AF
1T - OF 1.01 0 31 4.2 26.8 AF
1T - UF 8.3 0 254 4.2 250.0 AF
Process route 2
F 4.18 0 128 3.8 124.0 AF
F (+53 µm) 3.9 0 119 4.2 115.0 AF
F (-53 µm) 5.6 0 171.4 4.0 167.3 AF
F - UF 8.7 0 266 4.2 262.0 AF
F - OF 1.05 0 32 4.2 27.8 AF
2C 0.9 0 27 4.2 22.8 AF
2T 1.09 0 33 4.2 28.8 AF
UCT two-stage process
4C 10.7 0 327 4.1 323.0 AF
4T 2.37 0 73 4.2 68.8 AF
6.3.2. Net acid generating (NAG) test results on Witbank coal
Table 6-7 shows the result of the net acid generating (NAG) tests for the Witbank coal samples.
The NAG tests revealed that all samples were acid forming, i.e. they had NAG pH values less
than 4.5. In fact, the NAG pH values were all less than 2.6, suggesting that the samples were
highly acid forming; which was also confirmed by the amount of acid neutralizing base needed
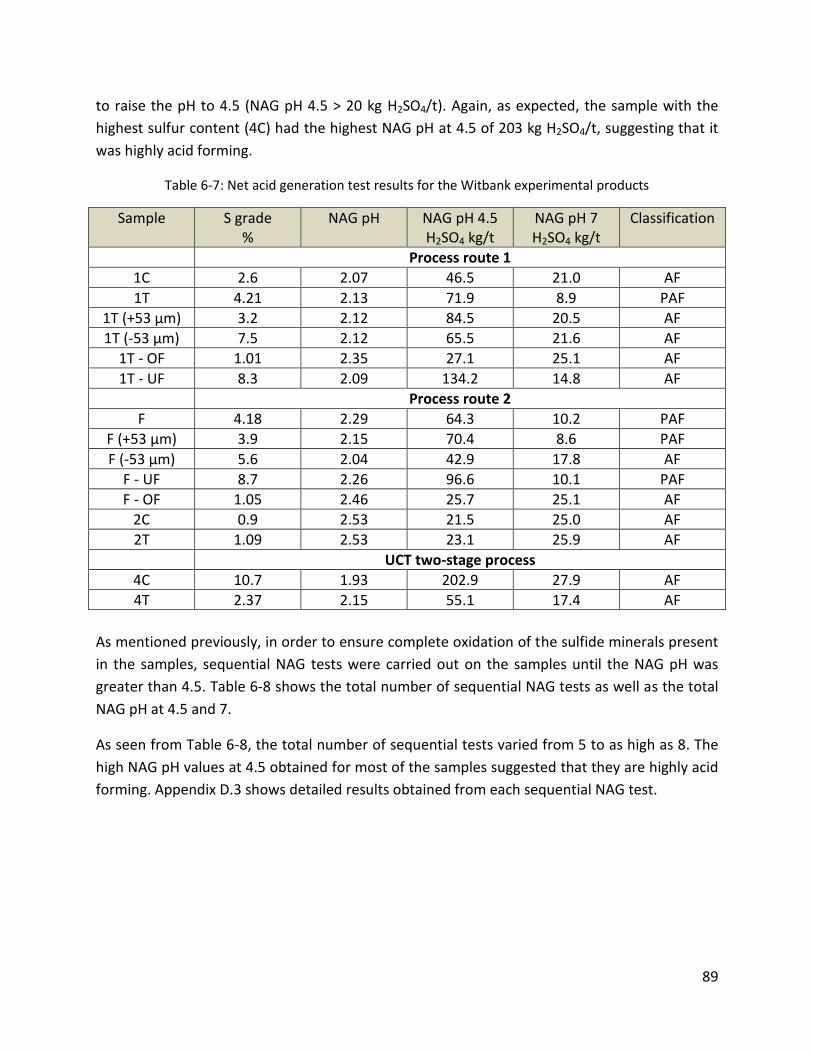
89
to raise the pH to 4.5 (NAG pH 4.5 > 20 kg H2SO4/t). Again, as expected, the sample with the
highest sulfur content (4C) had the highest NAG pH at 4.5 of 203 kg H2SO4/t, suggesting that it
was highly acid forming.
Table 6-7: Net acid generation test results for the Witbank experimental products
Sample S grade %
NAG pH NAG pH 4.5 H2SO4 kg/t
NAG pH 7 H2SO4 kg/t
Classification
Process route 1
1C 2.6 2.07 46.5 21.0 AF
1T 4.21 2.13 71.9 8.9 PAF
1T (+53 µm) 3.2 2.12 84.5 20.5 AF
1T (-53 µm) 7.5 2.12 65.5 21.6 AF
1T - OF 1.01 2.35 27.1 25.1 AF
1T - UF 8.3 2.09 134.2 14.8 AF
Process route 2
F 4.18 2.29 64.3 10.2 PAF
F (+53 µm) 3.9 2.15 70.4 8.6 PAF
F (-53 µm) 5.6 2.04 42.9 17.8 AF
F - UF 8.7 2.26 96.6 10.1 PAF
F - OF 1.05 2.46 25.7 25.1 AF
2C 0.9 2.53 21.5 25.0 AF
2T 1.09 2.53 23.1 25.9 AF
UCT two-stage process
4C 10.7 1.93 202.9 27.9 AF
4T 2.37 2.15 55.1 17.4 AF
As mentioned previously, in order to ensure complete oxidation of the sulfide minerals present
in the samples, sequential NAG tests were carried out on the samples until the NAG pH was
greater than 4.5. Table 6-8 shows the total number of sequential NAG tests as well as the total
NAG pH at 4.5 and 7.
As seen from Table 6-8, the total number of sequential tests varied from 5 to as high as 8. The
high NAG pH values at 4.5 obtained for most of the samples suggested that they are highly acid
forming. Appendix D.3 shows detailed results obtained from each sequential NAG test.

90
Table 6-8: Sequential NAG test results for the Witbank samples
Number of sequential
NAG
Total NAG pH 4.5 H2SO4 kg/t
Total NAG pH 7 H2SO4 kg/t
Process route 1
1C 6 88.3 132.6
1T 6 97.7 112.2
1T (+53 µm) 7 136.5 142.2
1T (-53 µm) 4 77.8 81.3
1T - OF 5 34.8 102.0
1T - UF 7 211.3 116.8
Process route 2
F 7 94.5 123.3
F (+53 µm) 8 111.3 156.2
F (-53 µm) 4 65.1 80.2
F - UF 6 133.7 102.0
F - OF 6 39.2 128.4
2C 6 38.1 124.1
2T 5 43.51 103.7
UCT two-stage process
4C 7 289.0 149
4T 6 80.2 114
6.3.3. Combination of ABA and NAG tests: Witbank coal
Figure 6-3 shows the combination of ABA and NAG tests for the Witbank coal samples. All
samples were acid forming as indicated on the graph. As discussed in the preceding section,
most samples, irrespective of their low sulfur content, yielded a positive NAPP value due to
their low ANC values. The NAG pH of all samples were found to be low (< 2.6), which also
indicates that there were not enough acid neutralizing minerals present to consume the acid
generated during the oxidation process.

91
Figure 6-3: Combination of ABA and NAG tests on the Witbank coal sample: NAG pH versus NAPP
6.4. Chapter Summary
Static tests (ABA and NAG) were carried out to determine the acid generating potential of all
samples obtained from the flotation and reflux classification process routes, and the UCT two-
stage flotation process. For the Waterberg coal sample, the results showed that all the tailings
from the processes, except 2T, were non-acid forming. F, F(-53 µm), F(+53 µm), 1C, 2C and 1T
were all found to be in the uncertain region as their ABA test results showed they were acid
forming whilst their NAG pH values were greater than 4.5.
For the Witbank coal sample, the results showed that all samples were acid forming, having
positive NAPP values and NAG pH values less than 4.5. It was concluded there were not enough
neutralizing minerals to consume the acid produced; therefore, all samples were acid forming
irrespective of their sulfur contents.
0
1
2
3
4
5
6
7
8
-300 -200 -100 0 100 200 300 400 500
NA
G p
H (
Kg
H2S
O4/
t)
NAPP (kg H2SO4/t)
FF (+53 µm)1C1T1T (+53 µm)1T (OF)1T (UF)F (OF)F(UF)2C2T4C4T
UC
UC
PAF
NAF

92
7. CHAPTER SEVEN – COMPARISON OF PROCESS ROUTES
7.1. Introduction
The main aim of this project is to determine the effectiveness of combining reflux classification
and froth flotation in terms of mitigating ARD potential and recovering valuable coal. The main
objective is to produce a benign tailing that is safe for disposal; a rich sulfide concentrate that
may be treated further or upgraded to a commercial product; and valuable coal concentrate
that can be sold for its thermal use. This chapter combines the results presented in Chapters 4,
5 and 6 to evaluate and compare the two process routes for the Waterberg and Witbank coal
samples studied in this thesis. The process routes are evaluated as flow diagrams, with
particular reference to the weight %, ash %, sulfur content and ARD potential of each product
stream. In addition, the process routes are compared to the UCT two-stage desulfurization by
flotation process.
The stream abbreviations in all figures presented in this chapter are detailed in Figure 6-1 and
Table 6-2 above. The colors of the diamond shapes in all the diagrams indicate the outcome of
the characterization tests carried out on the sample streams. Red indicates acid forming, green
indicates non-acid forming and grey indicates uncertainty.
7.2. Comparison of Process Route 1 and Route 2: Waterberg Coal
Figure 7-1 and Figure 7-2 show the flow diagrams of process routes 1 and 2, respectively, for
the Waterberg coal sample. The boxes next to each stream provide information on the mass,
ash and sulfur content in each stream. The mass of each stream is represented as a percent of
the feed sample (feed = 100 mass units). The diamond-shaped symbols denote the acid
producing potential of each stream.
From Figures 7-1 and 7-2, the following observations can be made:
In both process routes, approximately 90 % of the sulfur was removed in going from the
feed to the tailings (1T-OF and 2T). All tailings from process route 1 (1T, 1T (-53 µm) and
1T-OF) were found to be non-acid forming. As explained in Section 6.2, the tailing from
process route 2 (2T) was acid forming, due to the lack of neutralizing minerals in the
sample.
Comparing the clean coal concentrates from both process routes (1C and 2C), it is clear
that the concentrate from process route 2 (2C) contained a lower ash (and sulfur)
content. This shows that route 2 gave a better result in terms of producing saleable coal
concentrate.
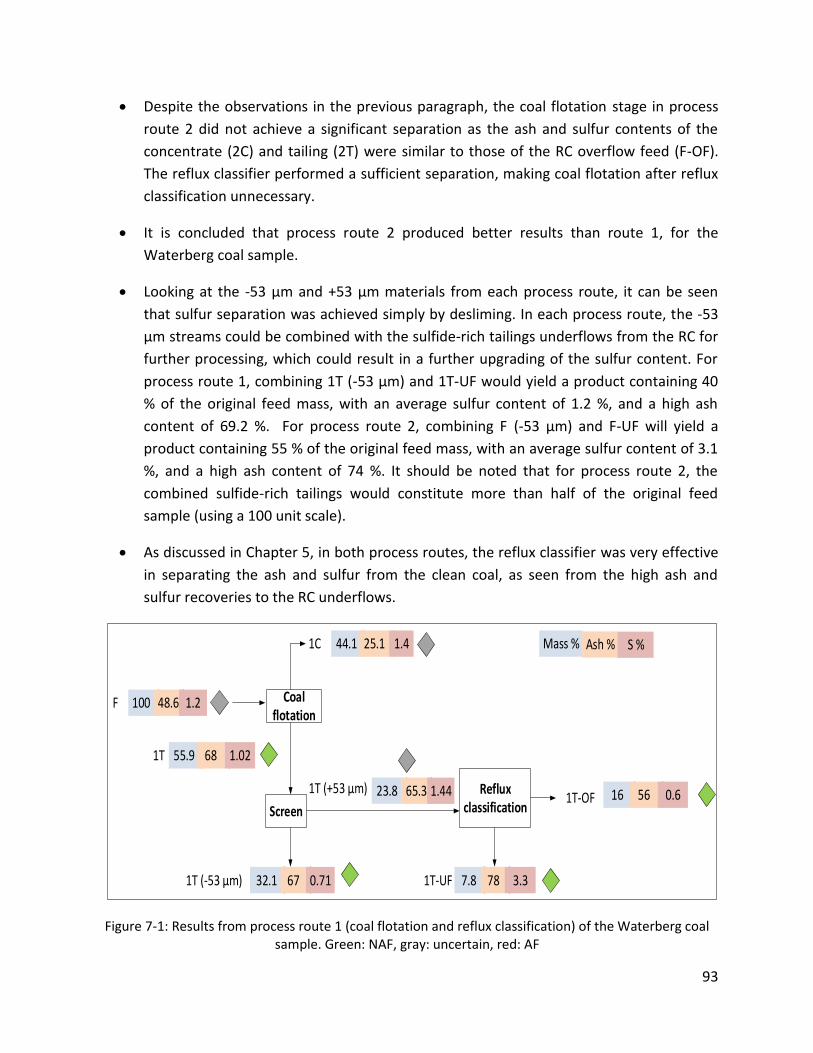
93
Despite the observations in the previous paragraph, the coal flotation stage in process
route 2 did not achieve a significant separation as the ash and sulfur contents of the
concentrate (2C) and tailing (2T) were similar to those of the RC overflow feed (F-OF).
The reflux classifier performed a sufficient separation, making coal flotation after reflux
classification unnecessary.
It is concluded that process route 2 produced better results than route 1, for the
Waterberg coal sample.
Looking at the -53 µm and +53 µm materials from each process route, it can be seen
that sulfur separation was achieved simply by desliming. In each process route, the -53
µm streams could be combined with the sulfide-rich tailings underflows from the RC for
further processing, which could result in a further upgrading of the sulfur content. For
process route 1, combining 1T (-53 µm) and 1T-UF would yield a product containing 40
% of the original feed mass, with an average sulfur content of 1.2 %, and a high ash
content of 69.2 %. For process route 2, combining F (-53 µm) and F-UF will yield a
product containing 55 % of the original feed mass, with an average sulfur content of 3.1
%, and a high ash content of 74 %. It should be noted that for process route 2, the
combined sulfide-rich tailings would constitute more than half of the original feed
sample (using a 100 unit scale).
As discussed in Chapter 5, in both process routes, the reflux classifier was very effective
in separating the ash and sulfur from the clean coal, as seen from the high ash and
sulfur recoveries to the RC underflows.
F Coal flotation
Screen
Reflux classification
100 48.6 1.2
1T (-53 µm)
44.1 25.1 1.4
1T (+53 µm)
55.9 68 1.02
1T-UF32.1 67 0.71
1T-OF23.8 65.3 1.44
1C
16 56 0.6
1T
7.8 78 3.3
Mass % Ash % S %
Figure 7-1: Results from process route 1 (coal flotation and reflux classification) of the Waterberg coal sample. Green: NAF, gray: uncertain, red: AF

94
F Screen
Reflux classification
Coal flotation
100 51 2.04
F (-53 µm) 28.1 61 4.1
F (+53 µm) 71.9 46 1.3
F-UF 27 87.5 2.02
F-OF 45 18 1.01
2C 26.6 15.6 1.03
2T 18.2 19.4 1.1
Mass % Ash % S %
Figure 7-2: Results from process route 2 (reflux classification and coal flotation) of the Waterberg coal sample. Green: NAF, gray: uncertain, red: AF
7.3. Comparison with the UCT Two-Stage Process: Waterberg Coal
One of the objectives of this research is to compare the new process routes with the ‘standard’
UCT two-stage flotation process. Figure 7-3 shows the flow sheet of the UCT two-stage process
for the Waterberg coal sample, obtained by combining the results presented in Chapters 4 and
6.
FCoal
flotation100 50 1.11
30.2 24.5 1.283C
4T
Sulfideflotation
67.6 62.7 0.65
2.2 60 17.64C
69.8 61.1 0.923T
Mass % Ash % S %
1Figure 7-3: Results of the UCT two-stage flotation process of the Waterberg coal sample. Green: NAF, gray: uncertain, red: AF
1 It should be noted that the coal flotation results presented here differ from those in Figure 7-1, which were obtained when carrying out
flotation in the 8 L cell, to prepare the sample for reflux classification.

95
Approximately 60 % of the sulfur was removed in going from the feed to the sulfur-lean tailings
(4T), which is 30 % less than was achieved in process routes 1 and 2. The coal concentrate (3C),
as with process route 1, contained a high sulfur content of 1.3 % in comparison with the tailings
(3T) of 0.92 %; this suggests that significant amount of sulfur reports to the concentrate during
the flotation process either due to entrainment or the presence of true middlings. Thus,
process route 2 should be chosen for future work.
However, the low yield of 2.2 % and high sulfur content of 17.6 % in the second stage suggest
that sulfide flotation is highly selective and efficient in recovering the sulfide minerals from a
high-ash feed (3T). It is thus recommended that sulfide flotation be employed to further
concentrate the combined sulfide-rich (1T-UF and F-UF) and -53 µm streams from process
routes 1 and 2.
7.4. Comparison of Process Route 1 and Route: Witbank Coal
Figure 7-4 and Figure 7-5 show the flow diagrams of process routes 1 and 2 respectively for the
Witbank coal samples, in the same form as the Waterberg sample in Section 7.2.
Coal flotation
ScreenReflux
classification
100 41.2 3.6
1T(-53 µm)
32.9 24.5 2.6
1T (+53 µm)
67.1 50.9 4.2
1T-UF14.4 56.6 7.5
1T-OF
53.7 54 3.2
1C
35.1 45 1.01
1T
18.6 75 8.3
Mass % Ash % S %
Figure 7-4: Results from process route 1 (coal flotation and reflux classification) of the Witbank coal sample. Red: AF

96
Screen
Reflux classification
Coal flotation
F 100 47.7 4.18
F (-53 µm) 20.4 79 5.6
F (+53 µm) 79.6 42.3 3.9
F-UF 31.9 75.4 8.7
F-OF 47.8 23 1.05
2C 20.5 22.4 0.89
2T 27.3 23.8 1.09
Mass % Ash % S %
Figure 7-5: Results from process route 2 (reflux classification and coal flotation) of the Witbank coal sample. Red: AF
The following observations can be made from Figures 7-4 and 7-5:
Approximately 90 % of the sulfur was removed in going from the feed to the tailings, in
both process routes (1T-OF and 2T). As explained in Section 6.3, all tailings from both
process routes were acid forming, which was due to the lack of neutralizing minerals in
the sample (see Table 4-2).
Comparing the clean coal concentrates from both process routes (1C and 2C), it is clear
that the concentrate from process route 2 (2C) contains a lower ash (and sulfur)
content. This shows that route 2 gave a better result in terms of producing clean coal
concentrate.
The same trends were seen as for the Waterberg coal sample. The reflux classifier
separated the sulfide minerals and ash efficiently from the clean coal, as seen from the
high sulfur and ash recoveries to the underflow products.
The coal flotation from process route 2 did not achieve a significant separation as the
ash and sulfur contents of the concentrate (2C) and tailing (2T) were similar to those of
the RC overflow feed (F-OF). This observation is similar to that made for process route 2
of the Waterberg sample.
It is therefore concluded that process route 2 produces better results than process route
1, for the Witbank coal sample.
Looking at the -53 µm and + 53 µm materials from each process route, it can be seen
that sufficient sulfur separation was achieved simply by desliming. In each process
route, as with the Waterberg coal sample, the -53 µm streams could be combined with

97
the sulfide-rich tailings underflows from the RC for further processing, which could
result in a further upgrading of the sulfur content. For process route 1, combining
1T (-53 µm) and 1T-UF would yield a product containing 33 % of the original feed mass,
with an average sulfur content of 6.7 %, and a high ash content of 79.6 %. For process
route 2, combining F(-53 µm) and F-UF would yield a product containing 52 % of the
original feed mass, with an average sulfur content of 7.9 %, and a high ash content of
67 %.
As explained in Chapter 6, all samples from both process routes were acid forming due
to the very small concentrate of acid neutralizing minerals in the Witbank coal sample.
Therefore, irrespective of the low sulfur contents attained in the sulfur-lean tailings
streams, the samples were still acid forming.
7.5. Comparison with the UCT Two-Stage Process: Witbank Coal
Figure 7-6 shows the flow sheet of the UCT two-stage process for the Witbank coal sample.
FCoal
flotation100 44.5 3.1
26 22 2.163C
4T
Sulfideflotation
63 56.5 2.37
11 36 10.74C
74 54 3.433T
Mass % Ash % S %
2
Figure 7-6: Results of the UCT two-stage flotation process of the Witbank coal, green. Red: AF
Approximately 50 % of the sulfur was removed in going from the feed to the sulfur-lean tailings
(4T), which is significantly less than was achieved in both combined process routes. The high
sulfur content in the concentrate (3C) suggest that significant amount of sulfur reports to the
concentrate during the flotation process either due to entrainment or the presence of true
2 It should be noted that the coal flotation results presented here differ from those in Figure 7-4, which were obtained when carrying out
flotation in the 8 L cell, to prepare the sample for reflux classification.

98
middlings. In addition, the final tailing sample (4T) had a high sulfur content of 2.37 %, and was
acid forming, i.e. not benign. In light of these, process route 2 should be chosen for future work.
Nevertheless, as with the Waterberg coal sample, the sulfide flotation yielded significant sulfur
recovery to the sulfide-rich concentrate, with a sulfur content of 10.7 % at a mass yield of 11 %.
In comparison, the results obtained by Amaral Filho et al. (2011) in the two-stage flotation of an
ESKOM coal sample (see Table 2-5) containing 5.1 % sulfur showed approximately 90 % removal
of the total sulfur in the benign tailings. That sample, however, was ground to 75 % passing
-150 µm, which is much finer than the Witbank sample used in this study (approximately 50 %
passing 150 µm). The improved performance obtained by Amaral Filho et al. (2011) might have
been due to better liberation of sulfide minerals at the finer grind.
7.6. Summary and Proposed Way Forward
It appears that the reflux classifier can perform both coal recovery and desulfurization by itself
(i.e. without flotation), as seen in process route 2 for both coal samples. However, as
mentioned previously, it might be possible to combine the -53 µm fraction from each process
routes with the respective reflux classifier underflow, and float this to produce a sulfide-rich
concentrate. The schematic is shown in Figure 7-7. It is recommended that this process route
be investigated, as it may well give the best process result because the sulfide flotation stage of
the UCT process gave significant sulfur recoveries and grade (see Figures 7-3 and 7-6).
Feed ScreenReflux
classification
Sulfide flotation
-53 µm
+53 µm
Underflow
Overflow
Sulfide-rich concentrate
Sulfide-lean tailings
Figure 7-7: Proposed research route for future work
Irrespective of the above, it will not be possible to produce a benign tailing if there are no acid
neutralizing minerals present in the feed, as with the Witbank coal sample.

99
8. CHAPTER EIGHT: SUMMARY, CONCLUSIONS AND RECOMMENDATIONS
8.1. Summary
The objective of this research was to investigate the effectiveness of using a combination of
flotation and reflux classification for desulfurization of South African coals in comparison to the
UCT two-stage flotation process. The experimental work carried out on the Waterberg and
Witbank coal samples, and reported in Chapters 4 to 7 of this thesis, may be summarized as
follows:
The as-received samples were found to contain high ash and sulfur contents (51 % and
2.04 % for the Waterberg coal; 48 % and 4.18 % for the Witbank coal, respectively).
Preliminary batch tests performed on both coal samples using dodecane at high dosages
showed that the coals were difficult to float as the yields were very small. Flotation
release analysis of the coal samples confirmed that they were of poor quality due to the
high ash contents obtained at starvation amounts of reagents.
Laboratory batch flotation tests carried out to optimize the coal flotation stage using
various collectors and MIBC frother, at different dosages showed that Nalflote 9858 at
1.4 kg/t gave the optimum result for both coal samples. Further flotation improvement
tests resulted in the selection of four-stage collector addition at 0.11 kg/t MIBC for use
for the Waterberg coal, and single stage Nalflote 9858 collector addition at 0.28 kg/t
MIBC for the Witbank coal.
SIBX at 2.33 kg/t was found to be the optimum collector type and dosage for sulfide
flotation of both coal samples. MIBC at 0.28 and 0.11 kg/t dosages was used for the
Witbank and Waterberg coals, respectively, while 0.93 kg/t dextrin was used as
depressant for both coal samples.
Fractionation runs carried out using the reflux classifier on the as-received and coal
flotation tailing samples of both coals revealed that the overflow at 20 L/min water flow
rate contained more sulfur than at 40 and 60 L/min water flow rates. This was
confirmed by the microscopic view of the samples. The anomaly was attributed to the
effect of particle size. Despite this, most of the sulfur reported to the underflow for both
coal samples.
Discrete runs performed at 50 L/min and 100 L/min flow rates for the as-received feed
and coal flotation tailing samples of both coal samples, respectively, showed that the
100
reflux classifier separated ash and sulfur from clean coal very effectively, as seen from
the high ash and sulfur recoveries to the underflows and the low ash content of the
overflows. Approximately 90 % of the sulfur was removed in going from the feed to the
tailings in both process routes, for both coal samples.
Process route 2 (reflux classification followed by coal flotation) was found to give better
ash and sulfur recoveries than process route 1 (coal flotation followed by reflux
classification). In process route 2, coal flotation was found to be unnecessary as the RC
produced a separation of coal from ash that subsequent flotation could not really
improve upon.
In comparison, in the UCT two-stage flotation process, approximately 50 to 60 % of the
sulfur was removed in going from the feed to the tailings, for both coal samples. The
process was less efficient when dealing with the coarser sample with high sulfur content
(the Witbank coal sample).
Static tests (ABA and NAG) carried out on the Witbank coal sample revealed that all
streams in all process routes were acid forming. This was due to the lack of acid
neutralizing minerals in the sample; hence, even at low sulfur content, samples were
still acid forming. For the Waterberg coal sample, the tailings from all process routes
were found to be non-acid forming, with the exception of the RC feed overflow (F-OF)
and subsequent coal flotation tailing (2T); this was attributed to the lack of neutralizing
minerals.
8.2. Conclusions and Recommendations
One of the hypothesis presented in Section 1.6.2, which states that ‘Combining reflux
classification and froth flotation (Figure 1-2) will give better results in terms of mitigating the
ARD generating potential of coal ultrafines and enhancing coal recovery compared to the UCT
two-stage froth flotation process (Figure 1-1)’ has been supported by the investigation. Only 50
% and 60 % sulfur removal was achieved using the UCT two-stage process for the Witbank and
Waterberg coal samples, respectively, while approximately 90 % sulfur removal was achieved
using the combined process routes, for both samples.
Although process routes 1 and 2 were equally efficient at producing sulfide-rich and sulfide-lean
streams, process route 2 was better in producing clean coal with low ash and sulfur content.
Furthermore, when using process route 2, reflux classification was found to perform sufficiently
well on its own (for the two samples investigated), as not much separation was achieved in the
coal flotation stage after reflux classification. Therefore, the coal flotation stage can be omitted
from the process route.
101
In terms of producing benign tailings, low sulfur content was found to be an insufficient
criterion for ARD classification. This was seen with the Witbank sample, as all samples from all
process routes were acid forming, irrespective of their sulfur content, due to the very small
concentrate of acid neutralizing minerals.
Therefore, hypothesis 2 was not adequately supported by the investigation. Although the reflux
classifier was found to be much better for coal desulfurization than flotation, the sulfide-lean
streams of the Witbank samples were still found to be acid forming.
Finally, while reflux classification was found to be very good for separating coal from ash and
sulfur, sulfide flotation produced the highest sulfur grades. This suggests a new process route
that might produce better results than any of the processes investigated in this thesis (see
recommendations below).
Based on the findings of this research, the following recommendations can be made:
The design of the reflux classifier rig should be revisited to see whether it can be
changed so as to accommodate the presence of fines in the feed. In this work, -53 µm
material had to be screened out of samples prior to experiments using the reflux
classifier. Subsequently, a plant trial using the reflux classifier only should be carried out
to validate the excellent results obtained using this unit. In addition, other novel gravity
separation equipment such as the Falcon separator or the Knelson concentrator could
be investigated.
Sulfur speciation should be carried out on the reflux classifier overflows to determine
the different forms of sulfur occurring in the individual flow rate fractions. This is
because, in this work, fractionation runs carried out on the feed and coal flotation tailing
samples of both coals, using the reflux classifier at NWU, showed that the overflow at 20
L/min water flow rate contained more sulfur than at 40 and 60 L/min flow rates.
In order to further reduce the sulfur content in the final tailings samples for benign
disposal, a new combined reflux classification-flotation process route should be
investigated, in which the sulfide-rich stream from the reflux classifier is combined with
the -53 µm material from pre-screening and subjected to sulfide flotation, to recover
the sulfide minerals at a high grade (as shown in Figure 7-7).
A kinetic test, in particular the UCT biokinetic test, should be carried out to validate the
results from the static tests. Some samples, like the Waterberg feed from the static
tests, were found to be in the uncertain region, while some were ‘falsely’ acid forming
due to their low acid neutralizing potential (ANC), thus giving a positive net acid
producing potential (NAPP).

102
9. REFERENCES
Abdollahy, M., Moghaddam, A. Z., Rami, K., 2006. Desulfurization of Menzino coal using combination of 'flotation' and 'leaching' with potassium hydroxide/methanol. Fuel, 85 (7-8), pp. 1117-24.
Akcil, A., Koldas, S., 2006. Acid Mine Drainage ( AMD ): Causes , treatment and case studies. Journal of Cleaner Production, 14, pp. 1139–45.
Amaral Filho, J., Broadhurst, J., Franzidis, J. P., 2011. Preliminary study of the separation of coal sulfide and ash-forming minerals from coal discards by flotation. South Africa, University of Cape Town (Technical Report).
Banerjee, P. K., Gupta, A. K., Mukherjee, A. K., Das, P., Singh, N. P., Singh, R. S., 2007. Optimization of reagents distribution down a coal flotation bank to improve recovery of coarser particles. International Journal of Coal Preparation and Utilization, 27 (1-3), pp. 39-56.
Barry, R., Ledda, A., 1997. A review of sulfur in coal: with specific reference to the Telkwa deposit, North-Western British Columbia. British Columbia Geological Survey and Manalta Coal Limited, Calgary. Available at: http://citeseerx.ist.psu.edu/viewdoc/download?doi=10.1.1.176.6366&rep=rep1&type=pd, pp. 1-21.
Benzaazoua, M., Bussiere, B., Kongolo, M., 2000. Environmental desulfurization od four Canadian mine tailings using froth flotation. International Journal of Mineral Processing, 45, pp. 195-216.
Bergh, J. P., Falcon, R. M. S., Falcon, L. M., 2013. Techno-economic impact of optimized low-grade thermal coal export production through beneficiation modelling. Journal of the Southern African Institute of Mining and Metallurgy, 113 (11), pp. 1- 15.
Bois, D., Poirier, P., Benzaazoua, M., Bussiere, B., Kongolo, M., 2004. Feasibility Study on the Use of Desulphurized Tailings to Control Acid Mine Drainage. Available at: http://www.polymtl.ca/enviro-geremi/pdf/articles/CIM%20final%20version.pdf, pp. 361-380.
Boycott, A. E., 1920. Sedimentation of blood corpuscles. Nature, 104 (2621), pp. 532.
Broughton, L., 1992. Acid Rock Drainage From Mines-Where We Are Now. IMM Minerals, Metal and the Environment Conference, Manchester, UK. Available at: https://www.rgc.ca/files/publications/ard_mines.pdf, pp. 1–19.

103
Bulatovic, S. M., 2007. Handbook of flotation reagents. First edition. Netherlands. Elsevier, pp. 11-43.
Caruccio, F. T., Hossner, L. R., Geidel, G., 1988. Pyritic materials: acid drainage, soil acidity and liming. Reclamation of Surface-Mined Lands , 1, pp. 159-189.
Coastech Research., 1989. Investigation of prediction techniques for acid mine drainage. Energy mines and resources. Canada. MEND Report 1.16.1 (a), pp. 1-50.
Coastech Research., 1991. Acid Rock Drainage Prediction Manual. Energy Mines and Resources. MEND Project Report 1.16.1b, Canada. Available at: http://www.mendnedem.org, pp. 1-35.
De Korte, G, J., 2002. Dense-medium beneficiation of fine coal revisited. Journal of the Southern African Institute of Mining and Metallurgy, pp. 393-396.
De Korte, G.J., 2010. Coal preparation research in South Africa. Journal of the Southern African Institute of Mining and Metallurgy, 110, pp.361–364.
Demirbas, A., Balat, M., 2004. Coal desulfurization via different methods. Energy Sources, 26 (6), pp. 541-550.
Dimou, A., 1986. The flotation of pyrite using xanthate collectors. South Africa, University of Cape Town (MA- thesis), pp. 1-100.
Eberhard, A., 2011. The future of South African coal: Market, investment and policy challenges. Programme on Energy and Sustainable Development. Available at: http://iis-db.stanford.edu/pubs/23082/WP_100_Eberhard_Future_of_South_African_Coal.pdf, pp. 1-45.
El Zeky, M., Attia, Y. A., 1987. Coal slurries desulfurization by flotation using thiophilic bacteria for pyrite depression. Coal Preparation, 5(1-2), pp. 112-8.
Enviromental Protection Agency (EPA)., 1994. TECHNICAL DOCUMENT: ACID MINE DRAINAGE PREDICTION. Avialble at: http://water.epa.gov/polwaste/nps/upload/amd.pdf, pp 9-29.
Eraydin, M. K., Zhang, J., Blubaugh, S., 2012. Benefits of using novel collectors in cleaning fine coal. The Society for Mining, Metallurgy, and Exploration, pp. 149-153.
Fabiańska, J. M., Kruszewska. K. K., 2003. Relationship between petrographic and geochemical characterisation of selected South African coals. International Journal of Coal Geology, 54 (1-2), pp. 95-114.

104
Falcon, R. M. S., 1977. Coal in South Africa-Part 1: The quality of South African coal in relation to its uses and world energy. Minerals Science and Engineering, 9 (4), pp. 1998-217.
Falcon, R., Ham, A. J., 1988. The characteristics of Southern African coals. Journal of the South African Institute of Mining and Metallurgy, 88(5), pp. 145-161.
Falconer, A., 2003. Gravity separation: old techniques/new methods. Physical Separation in Science and Engineering, 12 (1), pp. 31–48.
Faure, K., Willis, J., 1996. The Grootegeluk formation in the Waterberg coalfield, South Africa: facies, palaeoenvironment and thermal history-evidence from organic and clastic matter. International Journal of Coal Geology, 29, pp. 147–186.
Ferguson, K. Borden, R., Verburg, R. Bezuidenhout, N., 2009. INAP ’ s Global Acid Rock Drainage Guide 1. Available at: http://www.gardguide.com/index.php?title=Chapter_1, pp. 1–14.
Fisher, H., Tom, E., 2013. Desulfurization of Waterberg and Witbank coal tailings by froth flotation. South Africa, University of Cape Town, (Vacation work studies).
Fourie, P. J. F., Van Der Walt, P. J., Falcon, L. M., 1980. The beneficiation of fine coal by dense-medium cyclone. Journal of the South African Institute of Mining and Metallurgy, 1, pp. 357-361.
Galvin, K P., Callen, A., Spear, S., Walton, K., 2010. Gravity Separation of Coal in the Reflux Classifier – New Mechanisms for Suppressing the Effects of Particle Size. International Journal of Coal Preparation and Utilization, 30, pp. 133-144.
Galvin, K. P., Callen, A., Zhou, J., Doroochi, E., 2005. Performance of the reflux classifier for gravity separation at full scale. Minerals Engineering, 18, pp. 19-24.
Galvin, K. P., Doroodchi, E., Callen, A., Lambert, N., Pratten, S. J., 2002. Pilot plant trial of the reflux classifier. Minerals Engineering, 15, pp. 19–25.
Galvin, K. P., Walton, K., Zhou, J., 2009. How to elutriate particles according to their density. Chemical engineering Science, 64, pp. 2003-10.
Geldenhuis, S., Bell, F. G., 1998. Acid mine drainage at a coal mine in the Eastern Transvaal, South Africa. Environmental Geology, 34 (2/3), pp. 234-242.
Gray, N. F., 1997. Environmental impact and remediation of acid mine drainage : a management problem. Enviromental Geology, 30, pp. 62–71.
Gray, D., Barrass, G., Jezko, J., 1980. Relationship between coal liquefaction behaviour and the composition of South African coals. Fuel Research Institute, pp. 1-11.

105
Gupta, A. K., Banerjee, P. K., Mishra, A., 2009. Influence of chemical parameters on selectivity and recovery of fine coal through flotation. International Journal of Mineral Processing, 92(1-2), pp. 1–6.
Gutierrez-Rodriguez, J. A., Purcel, R. J., Aplan, F. F., 1984. Estimating the hydrophobicity and floatability of coal. Colloids and Surfaces, 12, pp. 1-25 Harrison, S. T. L., Broadhurst, J. L., Van Hille, R. P., Oyekola, O. O., Bryan, C., Hesketh, A., Optiz, A., 2010. A systematic approach to sulphidic waste rock and tailings management to minimize ARD formation. WRC K5/1831/3. June 2010, pp. 64-55.
Hesketh, A.H., Broadhurst, J., Bryan. C., Hille, R. P., Harrison, S. T. L.., 2010. Hydrometallurgy Biokinetic test for the characterisation of AMD generation potential of sulfide mineral wastes. Hydrometallurgy, 104, pp. 459-464.
Horsfall, D. W., 1980. A general review of coal preparation in South Africa. Journal of the South African Institute of Mining and Metallurgy, pp. 257-268.
Howlett, N., Marsden, A., 2013. Desulfurization of coal by two-stage froth flotation. South Africa, University of Cape Town, (4th year thesis project).
Ian Wark Research Institute and Environmental Geochemistry International (IWRI & EGI)., 2002. ARD test handbook. P387A project. Prediction and kinetic control of acid mine drainage. AMIRA International. Melbourne, pp. 1-20.
Iveson, S. M., Mason M., Galvin, K. P., 2014. Gravity separation and desliming of fine coal: Pilot-plant study using refluc classifiers in series. International Journal of Coal Preparation and Utilization, 34, pp. 239-259.
Jeffrey, L.S., 2005. Characterization of the coal resources of South Africa. Journal of the South African Institute of Mining and Metalurgy, 105 (2), pp. 95–102.
Jeffrey, L. S., 2006. Challenges associated with further development of the Waterberg Coalfield. Journal of South African Institute of Mining and Metallurgy, 105, pp. 453–458.
Jera, M, K., 2013. An economic analysis of coal desulfurization by froth flotation to prevent Acid Rock Drainage (ARD) and an economic review of capping covers and ARD treatment processes. South Africa, University of Cape Town (MA- thesis), pp. 1-110.
Jia, R., Harris, G. H., Douglas, W. F., 1999. An improved class of universal collectors for the flotation of oxidized and/or low-rank coal. International Journal of Mineral Processing, 58, pp. 99-118.

106
Jia, R., Harris, G.H., Douglas, W. F., 2002. Chemical Reagents for Enhanced Coal Flotation. International Journal of Coal Preparation and Utilization, 22, pp. 123-149.
Johnson, D. B., Hallberg, K. B., 2005. Acid mine drainage remediation options: a review. Science of Total Environment, 338 (1-2), pp. 3-14.
Kalenga, P. M., 2011. Determination and characterization of sulphur in South African coal. South Africa, University of Witwatersrand, School of Chemistry (MA-thesis), pp 1-70.
Kawatra, K., 1995. Froth Flotation – Fundamental Principles Flotation System. Minerals Engineering, pp. 1–30.
Kawatra, S. K., Eisele, T. C., 1997. Pyrite recovery mechanisms in coal flotation. International Journal of Mineral Processing, 50 (3), pp. 187–201.
Kazadi Mbamba, C., Harrison, S. T. L., Franzidis, J., Broadhurst, J. L., 2012. Mitigating acid rock drainage risks while recovering low-sulfur coal from ultrafine colliery wastes using froth flotation. Minerals Engineering, 29, pp. 13–21.
Kazadi Mbamba, C., Harrison, S. T. L., Franzidis, J., Broadhurst, J. L., 2013. Flotation of coal and sulfur from South African ultrafine colliery wastes. Journal of the South African Institute of Mining and Metallurgy, 113 (5), pp. 399-405.
Kirjavainen, V. M., 1996. Review and analysis of factors controlling the mechanical flotation of gangue minerals. International Journal of Mineral Processing, 46 (1-2), pp. 21–34.
Klimpel, R. R., 1992. Some Results of Various New Chemical Reagents for Modifying Coal Flotation Performance. International Journal of Coal Preparation and Utilization, 10, pp. 37–41.
Laskovski, D., Duncan, P., Tevenson, P., Zhou, J., Galvin, K. P., 2006. Segregation of hydraulically suspended particles in inclined channels. Chemical Engineering Science, 61 (22), pp. 7269–78.
Laskowski, J. S., 2001. Coal flotation and fine coal utilization. First edition. Amsterdam. Elsevier, pp. 1-200.
Lawrence, R. W., Ritcey, G. M., Poling, G. W., 1989. Strategies for the prediction of acid mine drainage. 13th Annual British Columbia Mine Reclamation Symposium, Vernon, BC, June 7-9, pp. 1-50. Lawrence, R. W., Wang, Y., 1997. Determination of neutralization potential in the prediction of acid rock drainage. Proceedings of the Fourth International Conference on Acid Rock Drainage. Vancouver B.C. Canada, 1, pp. 451-464.

107
Liu, X., Chen, B., Li, W., Song, Y., Wen, J., Wang, D., 2013. Recycle of Wastewater from Lead-Zinc sulfide ore flot-tation process by ozone/BAC technology. Journal of Environmental Protection, 4 (1B), pp. 5-9.
Luptakova, A., Ubaldini, S., Macingova, E., Fornari, P., Giuliano, V., 2012. Application of physical-chemical and biological-chemical methods for heavy metals removal from acid mine drainage. Process Biochemistry, 47, pp. 1633-39.
Luttrell, G., Honaker, R., Philips, D., 2000. Enhanced Gravity Separators. New Alternatives for FIne Coal Cleaning. Available at: http://www.seprosystems.com/russian/images/falcon-g/pdf/egs.pdf, pp. 1-7.
Magabane, J. H., Naidoo, R., Franzidis, J. P., Kazadi Mbamba, C., 2011. Mitigation of ARD potential of coal by means of froth flotation. South Africa, University of Cape Town, (4th year thesis project).
Mashilo, T., Modukanele, K., 2012. Investigation of flotation reagents for the beneficiation of coal colliery wastes. South Africa, University of Cape Town, (4th year thesis project).
Miller, K. J., 1975. Coal-pyrite flotation. Transactions of the American Institute of Mining, Metallurgical, and Petroleum Engineers, 258, pp. 30-33.
Miller, J. D., Laskowski, J. S., Chang, S. S., 1983. Dextrin adsorption by oxidized coal. Colloids and Surfaces, 8, pp. 137-161.
Mine Environment Neutral Drainage (MEND)., 1994. Evaluation of alternative dry covers for the inhibition of acid mine drainage from tailings. Available at: http://mend-nedem.org/wp-content/uploads/2013/01/2.20.1.pdf, pp 20-100.
Mining News., 2014. How viable is the Waterberg coalfield?. Available at: http://www.miningne.ws/2014/04/29/how-viable-is-the-waterberg-coalfield/.
Neethling, S. J., Cilliers, J. J., 2009. The entrainment factor in froth flotation: Model for particle size and other operating parameter effects. International Journal of Mineral Processing, 93 (2), pp. 141-8.
Nicol, S., 1998. A case study in the implementation of novel technology" Teetered bed separators. The Australian Coal Review, pp. 1-4.
Ohmura, N., Saiki, H., 1994. Desulfurization of coal by microbial column flotation. Biotechnol Bioeng, 44 (1), pp. 125-31.
108
Orupold, T., Starr, D., Kenefick, T., 2014. The lamella high shear rate REFLUX TM Classifier. Journal of the South African Institute of Mining and Metallurgy, 114, pp. 511-518.
Paktunc, A. D., 1999. Mineralogical constraints on the determination of neutralization potential and prediction of acid. Environmental Geology, 39 (2), pp. 103–112.
Peatfield, D., 2003. Coal and coal preparation in South Africa — A 2002 review. Journal of the South African Institute of Mining and Metallurgy, pp. 355–372.
Pinetown, K. L., Ward, C. R., Van der Westhuzen, W. A., 2007. Quantitative evalutation of minerals in coal deposits in the Witbank and Highveld coalfields, and the potential inpact on acid mine drainage. International Journal of Coal Geology, 72, pp. 166-183.
Polat, M., Polat, H., Chander, S., 2003. Physical and chemical interactions in coal flotation. International Journal of Mineral Processing, 72, pp. 199–213.
Price, W. A., Moring, K., Hutt, N., 1997. Guidelines for the prediction of acid rock drainage and metal leaching for mines in British Columbia: Part II Recommended procedures for static and kinetic testign, 4th International Conference on Acid Rock Drianage, Vancouver, British Columbia, May 31-June 6, pp. 15-30.
Rakgase, K. E., Campbell, Q. P., Le Roux, M., 2012. Applications of the reflux classifier on SA coals. Coaltech Research Association Annual Colloquium, 31 August, 2012. Available at: http://www.coaltech.co.za/Annual_Colloquium/2012/Applications%20of%20the%20Reflux%20Classifier%20on%20SA%20coals.pdf, pp. 1-24.
Reddick, J. F., Von Blottnitz, H., Kothuis, B., 2007. A cleaner production assessment of the ultra-fine coal waste generated in South Africa. Journal of the South African Institute of Mining and Metallurgy, 107, pp. 811–816.
Reddick, J. F., Von Blottnitz, H., Kothuis, B., 2008. Cleaner production in the South African coal mining and processing industry: A case study investigation. International Journal of Coal Preparation and Utilization, 28 (4), pp. 224-236.
Richardson, J. F., Harker, J. H., Backhurst, J. R., 2002. Coulson & Richardson's Chemical Engineering. 5th edition. London. Elsevier Science & Technology Book, pp. 291-7
Sanders, G. J., Brookes, G. F., 1986. Preparation of the 'Gondwana' coals. I. Washability characteristics. Coal Preparation, 3 (3), pp. 105-132.
Schuhmann, R., 1942. Flotation kinetics: Methods for steady-state study of flotation problems. The Journal of Physical Chemistry, 46 (8), pp. 891-902.

109
Sis, H., Ozbayoglu, G., Sarikaya, M., 2003. Comparison of non-ionic and ionic collectors in the flotation of coal fines. Minerals Enginnering, 16, pp. 399-401.
Skousken, J. G., Renton, J., Brown, H., Evans, P., Leavitt, B., Brandy, K., Cohen, L., Ziemkiewicz, P., 1997. Neutralization potential of overburden samples containing siderite. Journal of Environmental Quality, 16 (3), pp. 673-81.
Skousken, J. G., Sexstone, A., Ziemkiewicz, P. F., 2000. Acid mine drainage control and treatment. American Society of Agronomy and American Society for Surface Mining and Reclamation. Available at: http://www.wvu.edu/~agexten/landrec/Chap6.pdf, pp. 1-29.
Skousken, J., Simmins, J., Ziemkiewicz, P. F., 2004. The use of acid-base accounting to predict post-mining drainage quality on West Virginia surface mines, pp. 1-15.
Smith, I. G., 2014. Correlating laboratory and pilot reflux classification of fine coal. South Africa, North-West University, Potchefstroom Campus (MA-thesis), pp. 1-96.
Snyman, C. P., Botha, W. J., 1993. Coal in South Africa. Journal of African Earth Sciences (and the Middle East), 16 (1-2), pp. 171-180.
Sobek, A. A., Schuller, W. A., Freeman, J. R., 1978. Field and laboratory methods applicable to overburdens and minesoils. US Environmental Protection Agency. Available at: http://nepis.epa.gov/Adobe/PDF/91017FGB.PDF, pp. 47-50.
South African Coal Roadmap (SACRM)., 2011. Overview of the South African coal value chain: prepared as a basis for the development of the Soth African coal roadmap. Available at: http://www.sanedi.org.za/archived/wp-content/uploads/2013/08/sacrm%20value%20chain%20overview.pdf, pp. 15-55.
Stewart, W., Schuman, R., Miller, S., Smart, S., 2006. Advances in acid rock drainage (ARD) characterization of mine wastes, The American Society of Mining and Reclamation (ASMR), pp. 2098-2116.
Stewart, W. A., Schuman, R., Miller, S. D., Smart, R., 2009. Development of Prediction Methods for ARD Assessment of Coal Process Wastes. 8th ICARD International Conference on Acid Rock Drainage, Sweden. Available at: http://www.acarp.com.au/abstracts.aspx?repId=C15034, pp. 1-14.
Stonestreet, P., Franzidis, J. P., 1988. Reverse flotation of coal-A novel way for the beneficiation of coal fines. Minerals Engineering, 1 (4), pp. 343-349.
Subrahmanyam, T. V., Forssberg, E., 1988. Froth stability, particle entrainment and drainage in flotation - A review. International Journal of Mineral Processing, 23 (1-2), pp. 33-53.
110
Swanepoel, C., 2012. Fine coal processing developments in Anglo American thermal coal South Africa. The Society of Mining, Metalurgy and Exploration, pp. 95-120.
Thomas, L., 2013. Coal geology. 2nd edition. USA. John Wiley & Sons, Ltd, pp. 66-78.
Vassilev, S. V., Vassileva, C. G., 1996. Occurrence, abundance and origin of minerals in coals and coal ashes. Fuel Processing Technology, 48 (2), pp. 85-106.
Weber, P. A., Thomas, J. E., Skinner, W. M., Smart, R. S., 2005. A methodology to determine the acid-neutralization capacity of rock samples. The Canadian Mineralogist, 43, pp. 1183-92.
Wills, B. A., Napier-Munn, T., 2006. Mineral Processing Technology. 7th edition. Washington. Elsevier Science & Technology Books, pp. 50-100.
Woodburn, E. T., Flynn, S. A., 1984. The Effect of Froth stability on the beneficiation of low-rank coal by flotation. Powder Technology, 40, pp. 167–177.

111
10.APPENDICES
A. SAMPLE ANALYSIS
A.1. Particle Size Analysis
Performing a particle size analysis on the feed sample is important in order to obtain data on
the various size distributions in the sample. The dry test sieving method was used throughout
the experiment based on the Standard Method SANS 1953:1993 (ISO 153:1993). The screen
sizes used were 850, 600, 425, 300, 212, 150, 106, 75, 53, 38 and 25 µm. the following
procedure was followed:
1. Place sieves in a stack of decreasing aperture size from top to bottom (a collecting plate
should be placed below the stack to collect particles of -25 µm), and place a lid over the
top of the stack to prevent loss of samples.
2. Place 250 g of coal sample into the top sieve. Place content (sieve stack + sample) on an
automatic vibrating shaker. Let content shake for about 10 - 20 min at 1.8 rpm. Remove
the content from shaker, and weigh the amount of coal retained on each sieve.
% 𝑟𝑒𝑡𝑎𝑖𝑛𝑒𝑑 𝑖𝑛 𝑠𝑖𝑧𝑒 𝑐𝑙𝑎𝑠𝑠 𝑖 = 𝑀𝑎𝑠𝑠 𝑖𝑛 𝑠𝑖𝑧𝑒 𝑐𝑙𝑎𝑠𝑠 𝑖
𝑇𝑜𝑡𝑎𝑙 𝑚𝑎𝑠𝑠 × 100
𝐶𝑢𝑚𝑢𝑙𝑎𝑡𝑖𝑣𝑒 % 𝑝𝑎𝑠𝑠𝑖𝑛𝑔 𝑖𝑛 𝑠𝑖𝑧𝑒 𝑐𝑙𝑎𝑠𝑠 𝑖
= 𝐶𝑢𝑚𝑢𝑙𝑎𝑡𝑖𝑣𝑒 % 𝑝𝑎𝑠𝑠𝑖𝑛𝑔 𝑖𝑛 𝑠𝑖𝑧𝑒 𝑐𝑙𝑎𝑠𝑠𝑖−1 − % 𝑟𝑒𝑡𝑎𝑖𝑛𝑒𝑑 𝑖𝑛 𝑠𝑖𝑧𝑒 𝑐𝑙𝑎𝑠𝑠 𝑖
A.2. Ash Analysis
The ash content of the concentrate, feed and tailings samples were determined according to
the following procedure based on the Standard Method SANS 131:1997:
1. Weigh the empty crucibles and record the mass
2. Zero the weighing balance and add about 0.7 to 1 g of sample, record the mass of
sample
3. Place content (Crucible + sample) in a furnace, and raise the temperature to 500 oC over
a period of 60 min. Leave the content in the furnace for 1 hr:15 min (the 15 min is added
so as to cater for the temperature rise).
4. Increase temperature to 815 oC, and leave for 1 hr:15 min; as mentioned above, the 15
min is added to cater for the rise in temperature.
5. Remove the crucible from the furnace after the required time has elapsed. Place
content in a desiccator, and allow cooling to room temperature.
6. Weigh the cooled content to determine the mass of ash present in the crucible.

112
𝐴𝑠ℎ 𝑐𝑜𝑛𝑡𝑒𝑛𝑡(%) =𝑀𝑎𝑠𝑠 𝑜𝑓 𝑎𝑠ℎ 𝑖𝑛 𝑐𝑟𝑢𝑐𝑖𝑏𝑙𝑒
𝑀𝑎𝑠𝑠 𝑜𝑓 𝑐𝑜𝑎𝑙 𝑖𝑛 𝑐𝑟𝑢𝑐𝑖𝑏𝑙𝑒× 100
𝐴𝑠ℎ 𝑑𝑖𝑠𝑡𝑟𝑖𝑏𝑢𝑡𝑖𝑜𝑛 (%) =𝑀𝑎𝑠𝑠 𝑜𝑓 𝑎𝑠ℎ
𝑇𝑜𝑡𝑎𝑙 𝑎𝑠ℎ× 100
𝐶𝑜𝑛𝑚𝑏𝑢𝑠𝑡𝑖𝑏𝑙𝑒 (𝑐𝑜𝑎𝑙) 𝑝𝑒𝑟𝑐𝑒𝑛𝑡𝑎𝑔𝑒 = 100 − 𝐴𝑠ℎ 𝑐𝑜𝑛𝑡𝑒𝑛𝑡 (%)
A.3. Sulfur Analysis
The sulfur content of all samples from the experiment was determined using the LECO S 632 at
Mineral Processing Laboratory in the Chemical Engineering Department at the University of
Cape Town. The following procedure was followed:
1. Open medical oxygen and synthetic air cylinders.
2. Open LECO programme: perform system check by clicking on diagnostics
3. Load 3 x Conditioning Samples of about 0.3 g.
4. Load 3 x Blank crucibles from Sample Login Screen.
5. Load 3 x Drift Samples from specific calibration.
6. Configuration – Blank first (Highlight results & click): perform low and high tests
separately
7. Load samples by login or manual – check method & calibration.
8. Perform drift correction for each calibration before analysing samples.
9. Use a calibration method as close to the expected results as possible. Regulate sample
mass to fit “Calibration Area”.
10. Switch off gas, and close program.
11. Close Oxygen & Syn Air at cylinders.
12. Empty bucket and clean boats.
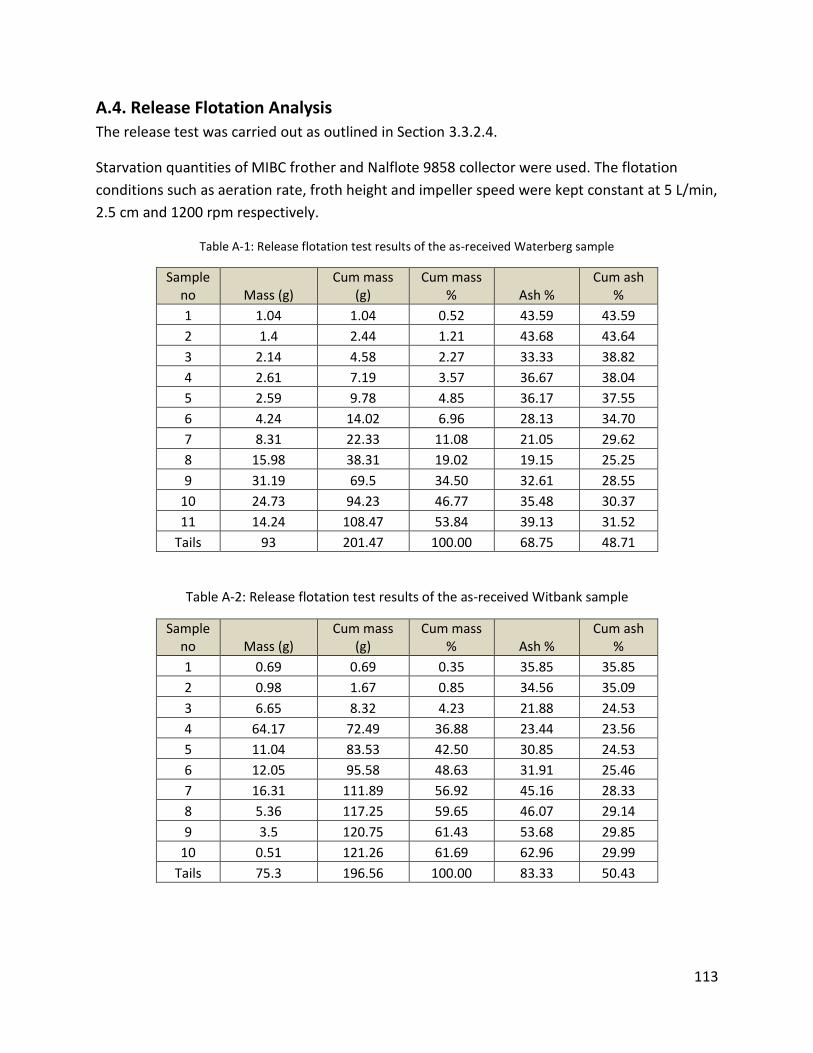
113
A.4. Release Flotation Analysis
The release test was carried out as outlined in Section 3.3.2.4.
Starvation quantities of MIBC frother and Nalflote 9858 collector were used. The flotation
conditions such as aeration rate, froth height and impeller speed were kept constant at 5 L/min,
2.5 cm and 1200 rpm respectively.
Table A-1: Release flotation test results of the as-received Waterberg sample
Sample no Mass (g)
Cum mass (g)
Cum mass % Ash %
Cum ash %
1 1.04 1.04 0.52 43.59 43.59
2 1.4 2.44 1.21 43.68 43.64
3 2.14 4.58 2.27 33.33 38.82
4 2.61 7.19 3.57 36.67 38.04
5 2.59 9.78 4.85 36.17 37.55
6 4.24 14.02 6.96 28.13 34.70
7 8.31 22.33 11.08 21.05 29.62
8 15.98 38.31 19.02 19.15 25.25
9 31.19 69.5 34.50 32.61 28.55
10 24.73 94.23 46.77 35.48 30.37
11 14.24 108.47 53.84 39.13 31.52
Tails 93 201.47 100.00 68.75 48.71
Table A-2: Release flotation test results of the as-received Witbank sample
Sample no Mass (g)
Cum mass (g)
Cum mass % Ash %
Cum ash %
1 0.69 0.69 0.35 35.85 35.85
2 0.98 1.67 0.85 34.56 35.09
3 6.65 8.32 4.23 21.88 24.53
4 64.17 72.49 36.88 23.44 23.56
5 11.04 83.53 42.50 30.85 24.53
6 12.05 95.58 48.63 31.91 25.46
7 16.31 111.89 56.92 45.16 28.33
8 5.36 117.25 59.65 46.07 29.14
9 3.5 120.75 61.43 53.68 29.85
10 0.51 121.26 61.69 62.96 29.99
Tails 75.3 196.56 100.00 83.33 50.43
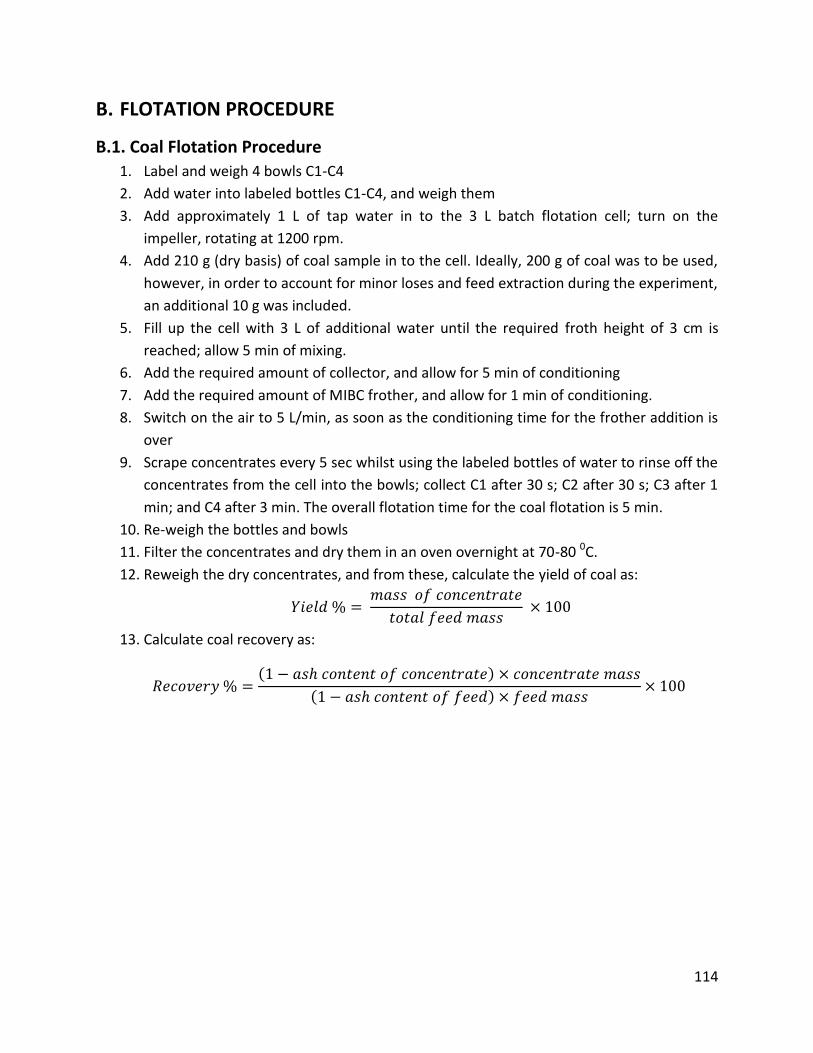
114
B. FLOTATION PROCEDURE
B.1. Coal Flotation Procedure
1. Label and weigh 4 bowls C1-C4
2. Add water into labeled bottles C1-C4, and weigh them
3. Add approximately 1 L of tap water in to the 3 L batch flotation cell; turn on the
impeller, rotating at 1200 rpm.
4. Add 210 g (dry basis) of coal sample in to the cell. Ideally, 200 g of coal was to be used,
however, in order to account for minor loses and feed extraction during the experiment,
an additional 10 g was included.
5. Fill up the cell with 3 L of additional water until the required froth height of 3 cm is
reached; allow 5 min of mixing.
6. Add the required amount of collector, and allow for 5 min of conditioning
7. Add the required amount of MIBC frother, and allow for 1 min of conditioning.
8. Switch on the air to 5 L/min, as soon as the conditioning time for the frother addition is
over
9. Scrape concentrates every 5 sec whilst using the labeled bottles of water to rinse off the
concentrates from the cell into the bowls; collect C1 after 30 s; C2 after 30 s; C3 after 1
min; and C4 after 3 min. The overall flotation time for the coal flotation is 5 min.
10. Re-weigh the bottles and bowls
11. Filter the concentrates and dry them in an oven overnight at 70-80 0C.
12. Reweigh the dry concentrates, and from these, calculate the yield of coal as:
𝑌𝑖𝑒𝑙𝑑 % = 𝑚𝑎𝑠𝑠 𝑜𝑓 𝑐𝑜𝑛𝑐𝑒𝑛𝑡𝑟𝑎𝑡𝑒
𝑡𝑜𝑡𝑎𝑙 𝑓𝑒𝑒𝑑 𝑚𝑎𝑠𝑠 × 100
13. Calculate coal recovery as:
𝑅𝑒𝑐𝑜𝑣𝑒𝑟𝑦 % =(1 − 𝑎𝑠ℎ 𝑐𝑜𝑛𝑡𝑒𝑛𝑡 𝑜𝑓 𝑐𝑜𝑛𝑐𝑒𝑛𝑡𝑟𝑎𝑡𝑒) × 𝑐𝑜𝑛𝑐𝑒𝑛𝑡𝑟𝑎𝑡𝑒 𝑚𝑎𝑠𝑠
(1 − 𝑎𝑠ℎ 𝑐𝑜𝑛𝑡𝑒𝑛𝑡 𝑜𝑓 𝑓𝑒𝑒𝑑) × 𝑓𝑒𝑒𝑑 𝑚𝑎𝑠𝑠× 100

115
B.2. Sulfide Flotation Procedure
1. Label and weigh 4 bowls C1-C4
2. Add water into labeled bottles C1-C4, and weigh them
3. Add approximately 1 L of tap water in to the 3 L batch flotation cell; turn on the
impeller, rotating at 1200 rpm.
4. Add 210 g of coal solids (dry basis).
5. Fill the cell to 3 L with additional water to reach a froth height of 3 cm, and allow for 5
min of mixing
6. Add the required amount of collector and allow for 5 min of conditioning
7. Add the required quantity of depressant and condition for 5 min
8. Add the required quantity of frother, and condition for 1 min
9. Switch on the air to 6 L/min, as soon as the conditioning time for the frother addition is
over
10. Scrape concentrates every 15 sec whilst using the labelled bottles of water to rinse off
the concentrates from the cell into the bowls; collect C1 after 2 min; C2 after 4 min; C3
after 6 min; and C4 after 8 min. The overall flotation time for the coal flotation is 20 min.
11. Re-weigh the bottles and bowls
12. Filter the concentrates and dry them in an oven overnight at 70-80 0C.
13. Reweigh the dry concentrates, and from these, calculate the yield of coal as:
𝑌𝑖𝑒𝑙𝑑 % = 𝑚𝑎𝑠𝑠 𝑜𝑓 𝑐𝑜𝑛𝑐𝑒𝑛𝑡𝑟𝑎𝑡𝑒
𝑡𝑜𝑡𝑎𝑙 𝑓𝑒𝑒𝑑 𝑚𝑎𝑠𝑠 × 100
14. Calculate recovery of coal as:
𝑅𝑒𝑐𝑜𝑣𝑒𝑟𝑦 % =𝑆𝑢𝑙𝑓𝑢𝑟 𝑐𝑜𝑛𝑡𝑒𝑛𝑡 𝑜𝑓 𝑐𝑜𝑛𝑐𝑒𝑛𝑡𝑟𝑎𝑡𝑒 × 𝑐𝑜𝑛𝑐𝑒𝑛𝑡𝑟𝑎𝑡𝑒 𝑚𝑎𝑠𝑠
𝑠𝑢𝑙𝑓𝑢𝑟 𝑐𝑜𝑛𝑡𝑒𝑛𝑡 𝑜𝑓 𝑓𝑒𝑒𝑑 × 𝑓𝑒𝑒𝑑 𝑚𝑎𝑠𝑠× 100

116
C. REFLUX CLASSIFICATION PROCEDURE 1. Inject dry feed samples of +53 µm particle size into the reflux classifier via the feed inlet
2. Arrange a stack of sieve on top of the tank in order to recover particles from the
overflow weir.
3. Arrange sieve from 150 µm to 25 µm
4. Fill the tank with water, while making sure all valves are closed
5. Open the recycle valve connecting the tank to the system (essential before switching on
the pump as it could lead to pump cavitation if closed).
6. Close valve 1 and open valve 2 half way
7. Switch on the pump, and adjust water flow rate by opening valve 1 and closing valve 2
simultaneously.
8. Allow system to run, while collecting overflow particles.
9. Switch off pump when required i.e. there are no more particles been collected to the
overflow, or when the sieve is full
10. Once the pump is switch off, close the valves connecting the tank to the system to avoid
water flow to the system.
11. Collect over flow particles and filter using a Buchner funnel, or a filter press, and dry
overnight in oven at 100 oC.
12. Run the system as described from 4-9. In this case, increase the water flow rate to the
maximum (100 L/min) in order to collect the underflow. Simultaneously open the
underflow valve to collect underflow particles.
13. Filter underflow particles and place in oven overnight at 100 oC.
14. Note: fractionation procedure is the same as described from 1-12, but the flow rate is
increased in increments of 10 or 20 L/min and allowed to run for 10 min.

117
C.1. Determination of Sample Density using pycnometer
1. Switch on system
2. Weigh a certain amount of sample in to the container feed, and place content in to the
system
3. Close feed knob tightly to avoid pressure loss
4. Allow system to stabilize for about 10 minutes
5. Open ‘cell vent’ and ‘cell vent control’. Allow system to reach ambient pressure
6. Allow for system stability
7. Close ‘cell vent’, and adjust system until digital display reads zero.
8. Switch selector valve to ‘VA OUT’ and open ‘FLOW’ toggle, while pressurizing to 17 PSIG
using ‘FLOW CONTROL’ knob to adjust pressure accordingly.
9. Close ‘FLOW’ toggle once the pressure reaches 17 PSIG, record the pressure.
10. Turn selector valve to ‘VA IN’, and record pressure once stable
11. Vent pressure in the system slowly by closing ‘cell vent control’ and then opening ‘cell
vent’. Slowly reopen ‘cell vent control’ to avoid splurging of samples in the container
feed.
12. Remove sample from container feed and clean for another test.
13. The pressure is calculated from:
𝑉𝑃 = 𝑉𝐶 +𝑉𝐴
1−𝑃2/𝑃3
where: {
𝑉𝑃 = 𝑆𝑜𝑙𝑖𝑑 𝑣𝑜𝑙𝑢𝑚𝑒𝑉𝐶 = 𝑔𝑎𝑠 𝑣𝑜𝑙𝑢𝑚𝑒
𝑉𝐴 = 𝑎𝑑𝑑𝑖𝑡𝑖𝑜𝑛𝑎𝑙 𝑣𝑜𝑙𝑢𝑚𝑒 𝑎𝑑𝑑𝑒𝑑 𝑡𝑜 𝑐𝑒𝑙𝑙 𝑤ℎ𝑒𝑛 𝑠𝑒𝑙𝑒𝑐𝑡𝑜𝑟 𝑣𝑎𝑙𝑣𝑒 𝑖𝑠 𝑡𝑢𝑛𝑟𝑛𝑒𝑑𝑃2, 𝑃3 = 𝑃𝑟𝑒𝑠𝑠𝑢𝑟𝑒 𝑎𝑡 𝑉𝐴 𝐼𝑁 𝑎𝑛𝑑 𝑉𝐴 𝑂𝑈𝑇 𝑟𝑒𝑠𝑝𝑒𝑐𝑡𝑖𝑣𝑒𝑙𝑦
The pressure of the sample is then calculated using: 𝜌𝑃 =𝑀𝑝
𝑉𝑝
Cut density is obtained using the pycnometer.

118
D. EXPERIMENTAL RESULTS

119
D.1. Flotation Results
D.1.1. Coal flotation results
Table D-1: Waterberg and Witbank coal flotation results using dodecane, Nalflote 9858 and oleic acid collector
Run no Reagents Sample
Time
(min) Mass (g) Ash % Total S % Cum Mass g
Cum Ash
%
Cum Coal Yield
% Cum S %
Total S
Recovery % Ash Recovery %
Coal Recovery
%
Waterberg Dodecane: 7 kg/t C1 0.5 3.68 43.04 1.67 3.68 43.04 1.80 1.67 2.25 1.61 2.21MIBC: 0.28 kg/t C2 1 0.31 20.00 3.99 41.25 1.96 0.06 2.47
Feed mass (g) 210 C3 2 0.35 27.27 4.34 40.12 2.13 0.10 2.77
Feed ash % 53.49 C4 5 0.55 52.83 4.89 41.55 2.40 0.30 3.13
Feed sulfur % 1.41 T 199.00 48.39 1.33
Recons. Feed 203.89 48.22 1.34
Waterberg Dodecane : 14 kg/t C1 0.5 5.02 32.47 1.24 5.02 32.47 2.46 1.24 1.85 1.47 3.54MIBC: 0.28kg/t C2 1 0.64 50.00 1.19 5.66 34.45 2.77 1.23 0.23 0.29 3.96
Feed mass (g) 210 C3 2 0.58 60.47 1.08 6.24 36.87 3.05 1.22 0.19 0.32 4.37
Feed ash % 55.17 C4 5 1.14 40.51 0.97 7.38 37.43 3.61 1.18 0.33 0.42 5.09
Feed sulfur % 1.63 T 197.10 54.84 1.66
Recons. Feed 204.48 54.21 1.64
Waterberg Dodecane : 18 kg/t C1 0.5 9.20 39.74 1.08 9.20 39.74 4.50 1.08 3.06 3.13 6.21MIBC: 0.28 kg/t C2 1 1.01 29.49 1.00 10.21 38.73 4.99 1.07 0.31 0.26 6.97
Feed mass (g) 210 C3 2 0.65 47.27 1.34 10.86 39.24 5.31 1.09 0.27 0.26 7.44
Feed ash % 57.47 C4 5 0.93 37.04 0.88 11.79 39.07 5.77 1.07 0.25 0.30 8.08
Feed sulfur % 1.45 T 192.70 58.16 1.62
Recons. Feed 204.49 57.06 1.59
Waterberg Dodecane : 27 kg/t C1 0.5 10.48 32.05 1.13 10.48 32.05 5.09 1.13 4.22 3.05 7.07MIBC: 0.28 kg/t C2 1 1.48 23.08 1.02 11.96 30.94 5.81 1.12 0.54 0.31 8.16
Feed mass (g) 210 C3 2 0.73 42.22 0.94 12.69 31.59 6.16 1.11 0.24 0.28 8.69
Feed ash % 53.49 C4 5 0.83 34.57 0.90 13.52 31.77 6.56 1.09 0.26 0.26 9.23
Feed sulfur % 1.41 T 192.44 54.95 1.38
Recons. Feed 205.96 53.42 1.36
1
2
3
4

120
Run no Reagents Sample
Time
(min) Mass (g) Ash % Total S % Cum Mass g
Cum Ash
%
Cum Coal Yield
% Cum S %
Total S
Recovery % Ash Recovery %
Coal Recovery
%
Witbank Dodecane: 7 kg/t C1 0.5 7.23 26.19 3.36 7.23 26.19 3.53 3.36 3.45 2.18 4.18
MIBC: 0.28 kg/t C2 1 1.04 6.17 3.39 8.27 23.67 4.04 3.36 0.50 0.07 4.91
Feed mass (g) 210 C3 2 0.78 23.81 2.96 9.05 23.68 4.43 3.33 0.33 0.21 5.40
Feed ash % 40 C4 5 1.42 21.43 2.63 10.47 23.37 5.12 3.23 0.53 0.35 6.27
Feed sulfur % 3.12 T 194.00 43.48 3.45
Recons. Feed 204.47 42.45 3.44
Witbank Dodecane: 14 kg/t C1 0.5 8.13 22.89 3.97 8.13 22.89 3.96 3.97 4.36 2.16 5.17MIBC: 0.28 kg/t C2 1 1.64 17.98 3.65 9.77 22.07 4.76 3.92 0.81 0.34 6.25
Feed mass (g) 210 C3 2 0.98 20.00 3.75 10.75 21.88 5.23 3.90 0.50 0.23 6.90
Feed ash % 39.18 C4 5 1.61 19.10 3.45 12.36 21.52 6.02 3.84 0.75 0.36 7.95
Feed sulfur % 3.47 T 193.00 43.33 3.59
Recons. Feed 205.36 42.02 3.61
Witbank Dodecane: 18 kg/t C1 0.5 8.81 20.24 3.24 8.81 20.24 4.29 3.24 4.00 1.95 6.14
MIBC: 0.28 kg/t C2 1 1.87 18.95 2.61 10.68 20.01 5.20 3.13 0.68 0.39 7.43
Feed mass (g) 210 C3 2 0.90 21.90 2.66 11.58 20.16 5.64 3.09 0.34 0.22 8.07
Feed ash % 43.12 C4 5 1.71 19.45 2.28 13.29 20.07 6.47 2.99 0.55 0.36 9.23
Feed sulfur % 3.51 T 192.11 46.24 3.51
Recons. Feed 205.40 44.54 3.48
Witbank Dodecane: 27.9 kg/t C1 0.5 8.37 24.71 3.61 8.37 24.71 4.07 3.61 4.62 2.34 5.27
MIBC: 0.28 kg/t C2 1 1.88 19.78 3.27 10.25 23.80 4.98 3.55 0.94 0.42 6.50
Feed mass (g) 210 C3 2 1.39 19.87 3.37 11.64 23.33 5.66 3.53 0.72 0.31 7.39
Feed ash % 40.67 C4 5 2.05 20.27 2.71 13.69 22.88 6.65 3.40 0.85 0.47 8.71
Feed sulfur % 3.24 T 192.04 44.44 3.16
Recons. Feed 205.73 43.01 3.18
6
5
7
8
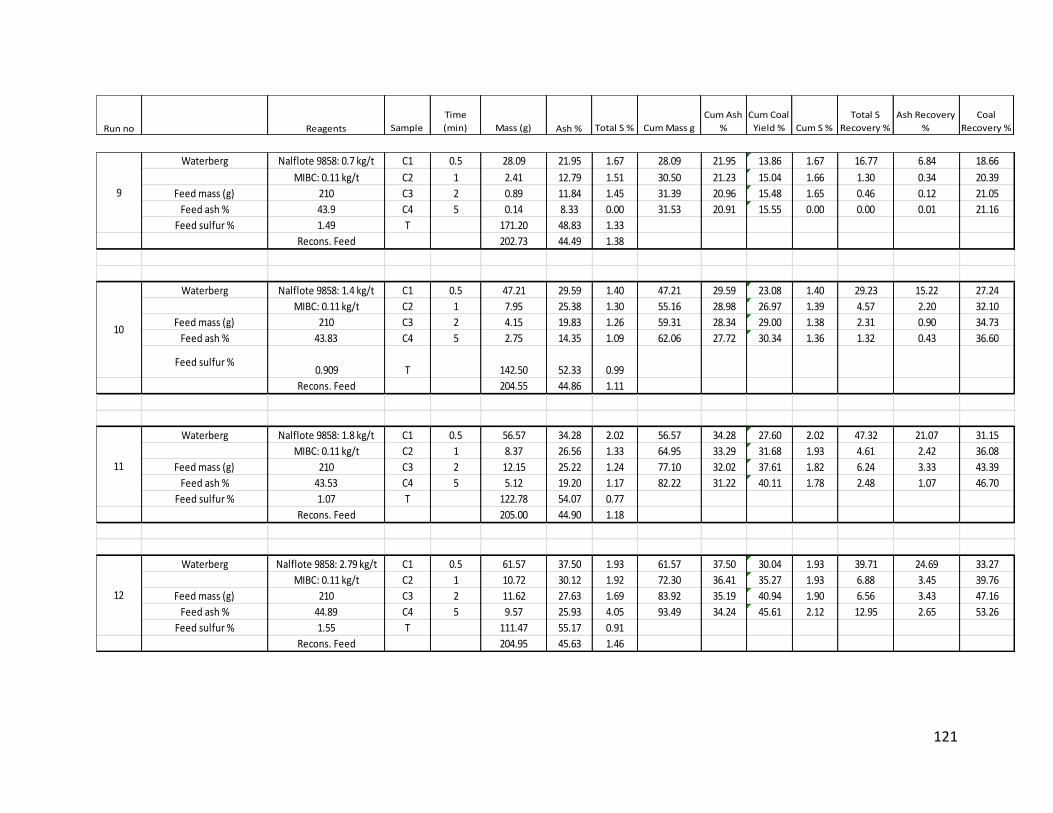
121
Run no Reagents Sample
Time
(min) Mass (g) Ash % Total S % Cum Mass g
Cum Ash
%
Cum Coal
Yield % Cum S %
Total S
Recovery %
Ash Recovery
%
Coal
Recovery %
Waterberg Nalflote 9858: 0.7 kg/t C1 0.5 28.09 21.95 1.67 28.09 21.95 13.86 1.67 16.77 6.84 18.66
MIBC: 0.11 kg/t C2 1 2.41 12.79 1.51 30.50 21.23 15.04 1.66 1.30 0.34 20.39
Feed mass (g) 210 C3 2 0.89 11.84 1.45 31.39 20.96 15.48 1.65 0.46 0.12 21.05
Feed ash % 43.9 C4 5 0.14 8.33 0.00 31.53 20.91 15.55 0.00 0.00 0.01 21.16
Feed sulfur % 1.49 T 171.20 48.83 1.33
Recons. Feed 202.73 44.49 1.38
Waterberg Nalflote 9858: 1.4 kg/t C1 0.5 47.21 29.59 1.40 47.21 29.59 23.08 1.40 29.23 15.22 27.24
MIBC: 0.11 kg/t C2 1 7.95 25.38 1.30 55.16 28.98 26.97 1.39 4.57 2.20 32.10
Feed mass (g) 210 C3 2 4.15 19.83 1.26 59.31 28.34 29.00 1.38 2.31 0.90 34.73
Feed ash % 43.83 C4 5 2.75 14.35 1.09 62.06 27.72 30.34 1.36 1.32 0.43 36.60
Feed sulfur %0.909 T 142.50 52.33 0.99
Recons. Feed 204.55 44.86 1.11
Waterberg Nalflote 9858: 1.8 kg/t C1 0.5 56.57 34.28 2.02 56.57 34.28 27.60 2.02 47.32 21.07 31.15
MIBC: 0.11 kg/t C2 1 8.37 26.56 1.33 64.95 33.29 31.68 1.93 4.61 2.42 36.08
Feed mass (g) 210 C3 2 12.15 25.22 1.24 77.10 32.02 37.61 1.82 6.24 3.33 43.39
Feed ash % 43.53 C4 5 5.12 19.20 1.17 82.22 31.22 40.11 1.78 2.48 1.07 46.70
Feed sulfur % 1.07 T 122.78 54.07 0.77
Recons. Feed 205.00 44.90 1.18
Waterberg Nalflote 9858: 2.79 kg/t C1 0.5 61.57 37.50 1.93 61.57 37.50 30.04 1.93 39.71 24.69 33.27
MIBC: 0.11 kg/t C2 1 10.72 30.12 1.92 72.30 36.41 35.27 1.93 6.88 3.45 39.76
Feed mass (g) 210 C3 2 11.62 27.63 1.69 83.92 35.19 40.94 1.90 6.56 3.43 47.16
Feed ash % 44.89 C4 5 9.57 25.93 4.05 93.49 34.24 45.61 2.12 12.95 2.65 53.26
Feed sulfur % 1.55 T 111.47 55.17 0.91
Recons. Feed 204.95 45.63 1.46
9
10
11
12

122
Run no Reagents Sample
Time
(min) Mass (g) Ash % Total S % Cum Mass g
Cum Ash
%
Cum Coal
Yield % Cum S %
Total S
Recovery %
Ash Recovery
%
Coal
Recovery %
Waterberg Nalflote 9858: 0.7 kg/t C1 0.5 43.09 27.77 1.68 43.09 27.77 20.96 1.68 28.57 13.28 24.69
MIBC: 0.28 kg/t C2 1 8.75 20.59 1.43 51.84 26.55 25.22 1.64 4.94 2.00 30.23
Feed mass (g) 210 C3 2 1.96 12.56 1.31 53.79 26.05 26.17 1.63 1.01 0.27 31.60
Feed ash % 44.06 C4 5 0.82 18.56 0.00 54.61 25.93 26.56 0.00 0.00 0.17 32.18
Feed sulfur % 1.21 T 150.96 50.30 1.09
Recons. Feed 205.57 43.83 1.23
Waterberg Nalflote 9858: 1.4 kg/t C1 0.5 56.16 30.39 1.42 56.16 30.39 27.45 1.42 38.64 18.43 35.62
MIBC: 0.28 kg/t C2 1 10.03 26.07 1.46 66.18 29.73 32.36 1.43 7.09 2.82 42.50
Feed mass (g) 210 C3 2 8.36 20.81 1.17 74.55 28.73 36.44 1.40 4.74 1.88 48.53
Feed ash % 47.09 C4 5 2.34 14.54 1.12 76.89 28.30 37.59 1.39 1.27 0.37 50.32
Feed sulfur % 1.05 T 127.66 55.50 0.78
Recons. Feed 204.55 45.28 1.01
Waterberg Nalflote 9858: 1.8 kg/t C1 0.5 58.56 32.32 1.80 58.56 32.32 28.54 1.80 44.17 21.67 32.44
MIBC: 0.28 kg/t C2 1 12.14 28.19 1.29 70.69 31.61 34.46 1.71 6.56 3.92 39.64
Feed mass (g) 210 C3 2 14.88 26.34 1.22 85.58 30.69 41.71 1.63 7.61 4.49 48.60
Feed ash % 44.02 C4 5 3.46 19.36 1.04 89.03 30.25 43.40 1.60 1.51 0.77 50.91
Feed sulfur % 1.15 T 116.11 52.03 0.83
Recons. Feed 205.14 42.58 1.16
Waterberg Nalflote 9858: 2.79 kg/t C1 0.5 70.48 34.75 1.86 70.48 34.75 34.35 1.86 42.73 26.85 41.94
MIBC: 0.28 kg/t C2 1 16.34 37.18 2.14 86.82 35.20 42.32 1.91 11.40 6.66 50.86
Feed mass (g) 210 C3 2 16.86 34.74 1.99 103.67 35.13 50.53 1.93 10.93 6.42 60.77
Feed ash % 43.92 C4 5 8.41 35.32 2.66 112.08 35.14 54.63 1.98 7.29 3.26 65.72
Feed sulfur % 1.47 T 93.07 55.69 0.91
Recons. Feed 205.16 44.47 1.50
WaterbergOleic acid: 1.4 kg/t C1 0.5 24.02 32.93 0.52 24.02 32.93 11.75 0.52 5.68 8.27 15.26
MIBC: 0.11 kg/t C2 1 1.02 36.07 0.00 25.04 33.05 12.24 0.00 0.00 0.38 15.91
Feed mass (g) 210 C3 2 0.13 38.38 0.00 25.17 33.08 12.31 0.00 0.00 0.05 15.99
Feed ash % 45.79 C4 5 0.28 44.80 0.00 25.45 33.21 12.44 0.00 0.00 0.13 16.19
Feed sulfur % 1.09 T 179.09 48.65 1.16
Recons. Feed 204.54 46.73 1.08
17
13
14
15
16

123
Run no Reagents Sample
Time
(min) Mass (g) Ash % Total S % Cum Mass g
Cum Ash
%
Cum Coal
Yield % Cum S %
Total S
Recovery %
Ash Recovery
%
Coal
Recovery %
Waterberg Oleic acid: 1.8 kg/t C1 0.5 27.13 41.37 1.03 27.13 41.37 13.17 1.03 10.62 11.72 14.63
MIBC: 0.11 kg/t C2 1 3.17 37.39 0.53 30.30 40.96 14.71 0.98 0.64 1.24 16.37
Feed mass (g) 210 C3 2 0.80 43.00 0.00 31.09 41.01 15.10 0.00 0.00 0.36 16.90
Feed ash % 47.67 C4 5 0.46 42.44 0.00 31.55 41.03 15.32 0.00 0.00 0.20 17.26
Feed sulfur % 1.15 T 174.38 47.51 1.33
Recons. Feed 205.93 46.51 1.28
Waterberg Oleioc acid: 2.79 kg/t C1 0.5 25.86 45.47 0.71 25.86 45.47 12.61 0.71 6.32 12.16 12.50
MIBC: 0.11 kg/t C2 1 4.17 45.34 1.29 30.03 45.45 14.65 0.79 1.85 1.96 14.53
Feed mass (g) 210 C3 2 1.15 39.75 0.76 31.17 45.24 15.21 0.79 0.30 0.47 15.43
Feed ash % 46.17 C4 5 0.53 45.51 0.00 31.70 45.25 15.46 0.00 0.00 0.25 15.85
Feed sulfur % 1.38 T 173.29 47.50 1.53
Recons. Feed 204.99 47.15 1.42
Waterberg Oleic acid: 0.7 kg/t C1 0.5 18.57 44.47 1.20 18.57 44.47 9.05 1.20 7.44 9.10 8.98
MIBC: 0.28 kg/t C2 1 0.78 41.86 0.00 19.35 44.36 9.43 0.00 0.00 0.36 9.40
Feed 210 C3 2 1.12 44.80 0.00 20.47 44.39 9.97 0.00 0.00 0.55 10.04
Feed ash % 43.20 C4 5 1.78 44.42 1.40 22.25 44.39 10.84 1.22 0.83 0.87 11.01
Feed sulfur % 1.48 T 182.98 44.17 1.49
Recons. Feed 205.24 44.20 1.46
Waterberg Oleic acid: 1.4 kg/t C1 0.5 29.80 39.70 0.86 29.80 39.70 14.56 0.86 9.12 12.97 15.58
MIBC: 0.28 kg/t C2 1 4.58 43.75 0.50 34.38 40.24 16.79 0.81 0.82 2.20 17.83
Feed mass (g) 210 C3 2 1.34 44.11 0.52 35.72 40.39 17.45 0.80 0.25 0.65 18.57
Feed ash % 45.45 C4 5 1.11 47.52 0.64 36.83 40.60 17.99 0.80 0.25 0.58 19.21
Feed sulfur % 1.25 T 167.90 45.44 1.50
Recons. Feed 204.73 44.57 1.37
Waterberg Oleic acid: 1.8 kg/t C1 0.5 30.86 46.86 0.73 30.86 46.86 15.06 0.73 8.16 15.11 15.22
MIBC: 0.28 kg/t C2 1 5.77 38.65 0.83 36.63 45.56 17.87 0.75 1.72 2.33 18.47
Feed mass (g) 210 C3 2 1.69 37.76 0.38 38.33 45.22 18.70 0.73 0.23 0.67 19.49
Feed ash % 48.24 C4 5 0.61 47.39 0.00 38.94 45.25 19.00 0.00 0.00 0.30 19.83
Feed sulfur % 1.23 T 166.01 47.03 1.50
Recons. Feed 204.95 46.70 1.35
18
19
20
21
22

124
Run no Reagents Sample
Time
(min) Mass (g) Ash % Total S % Cum Mass g
Cum Ash
%
Cum Coal
Yield % Cum S %
Total S
Recovery %
Ash Recovery
%
Coal
Recovery %
Waterberg Oleic acid: 2.79 kg/t C1 0.5 37.90 44.41 0.85 37.90 44.41 18.43 0.85 11.45 17.78 17.65
MIBC: 0.28 kg/t C2 1 7.93 33.98 1.33 45.83 42.61 22.29 0.93 3.76 2.84 22.10
Feed mass (g) 210 C3 2 8.94 41.78 1.52 54.77 42.47 26.64 1.43 4.84 3.94 26.52
Feed ash % 45.28 C4 5 1.76 45.84 0.00 56.53 42.58 27.49 0.00 0.00 0.85 27.41
Feed sulfur % 1.46 T 149.08 47.38 1.34
Recons. Feed 205.60 46.06 1.36
Waterberg Montanol800: 0.7 kg/t C1 0.5 65.90 32.22 1.61 65.90 32.22 32.40 1.61 49.24 22.79 38.66
MIBC: 0.11 kg/t C2 1 8.96 25.26 1.25 74.86 31.39 36.80 1.57 5.20 2.43 44.29
Feed mass (g) 210 C3 2 2.15 23.26 1.15 77.01 31.16 37.86 1.23 1.15 0.54 45.71
Feed ash % 46.55 C4 5 0.80 35.00 0.00 77.81 31.20 38.25 0.00 0.00 0.30 46.23
Feed sulfur % 1.18 T 125.60 54.84 0.95
Recons. Feed 203.41 45.80 1.06
23
24

125
Run no Reagents Sample
Time
(min) Mass (g) Ash % Total S %
Cum
Mass g
Cum Ash
%
Cum Coal
Yield % Cum S %
Total S
Recovery
%
Ash
Recovery
%
Coal
Recovery
%
Witbank Nalflote 9858: 0.7 kg/t C1 0.5 9.93 20.48 2.52 9.93 20.48 4.87 2.52 3.43 2.32 6.32
MIBC: 0.11 kg/t C2 1 2.34 19.35 2.89 12.27 20.27 6.02 2.59 0.93 0.52 7.79
Feed mass (g) 210 C3 2 1.46 16.67 3.02 13.73 19.89 6.73 2.64 0.60 0.28 8.80
Feed ash % 39.56 C4 5 1.37 14.29 2.91 15.10 19.38 7.40 2.66 0.55 0.22 9.78
Feed sulfur % 3.42 T 188.78 44.79 4.37
Recons. Feed 203.88 42.91 3.58
Witbank Nalflote 9858: 1.4 kg/t C1 0.5 23.54 25.05 2.50 23.54 25.05 11.51 2.50 9.54 6.46 14.14
MIBC: 0.11 kg/t C2 1 3.58 20.89 1.96 27.12 24.50 13.26 2.43 1.14 0.82 16.38
Feed mass (g) 210 C3 2 2.65 20.64 2.30 29.77 24.16 14.55 2.42 0.99 0.60 18.05
Feed ash % 42.49 C4 5 4.40 18.43 2.26 34.16 23.42 16.70 2.40 1.61 0.89 20.86
Feed sulfur % 2.59 T 170.37 48.89 3.14
Recons. Feed 204.54 44.63 3.02
Witbank Nalflote 9858: 1.8 kg/t C1 0.5 24.42 25.40 3.00 24.42 25.40 11.92 3.00 10.51 7.30 14.18MIBC: 0.11 kg/t C2 1 9.04 21.83 2.89 33.46 24.44 16.33 2.97 3.75 2.32 19.72
Feed mass (g) 210 C3 2 3.63 22.14 1.72 37.09 24.21 18.10 2.85 0.90 0.95 21.90
Feed ash % 42.37 C4 5 4.83 20.80 2.13 41.93 23.82 20.46 2.77 1.48 1.18 24.90
Feed sulfur % 3.23 T 163.01 46.02 3.94
Recons. Feed 204.94 41.47 3.40
Witbank Nalflote 9858: 2.79 kg/t C1 0.5 27.87 21.18 3.36 27.87 21.18 13.66 3.36 11.59 7.01 17.51
MIBC: 0.11 kg/t C2 1 11.00 20.48 3.56 38.86 20.98 19.06 3.42 4.85 2.68 24.50
Feed mass (g) 210 C3 2 6.28 19.32 3.28 45.14 20.75 22.14 3.40 2.55 1.44 28.49
Feed ash % 39.56 C4 5 6.40 17.98 2.04 51.54 20.40 25.27 3.23 1.62 1.37 32.61
Feed sulfur % 3.58 T 152.39 48.35 4.21
Recons. Feed 203.93 41.29 3.96
25
26
27
28
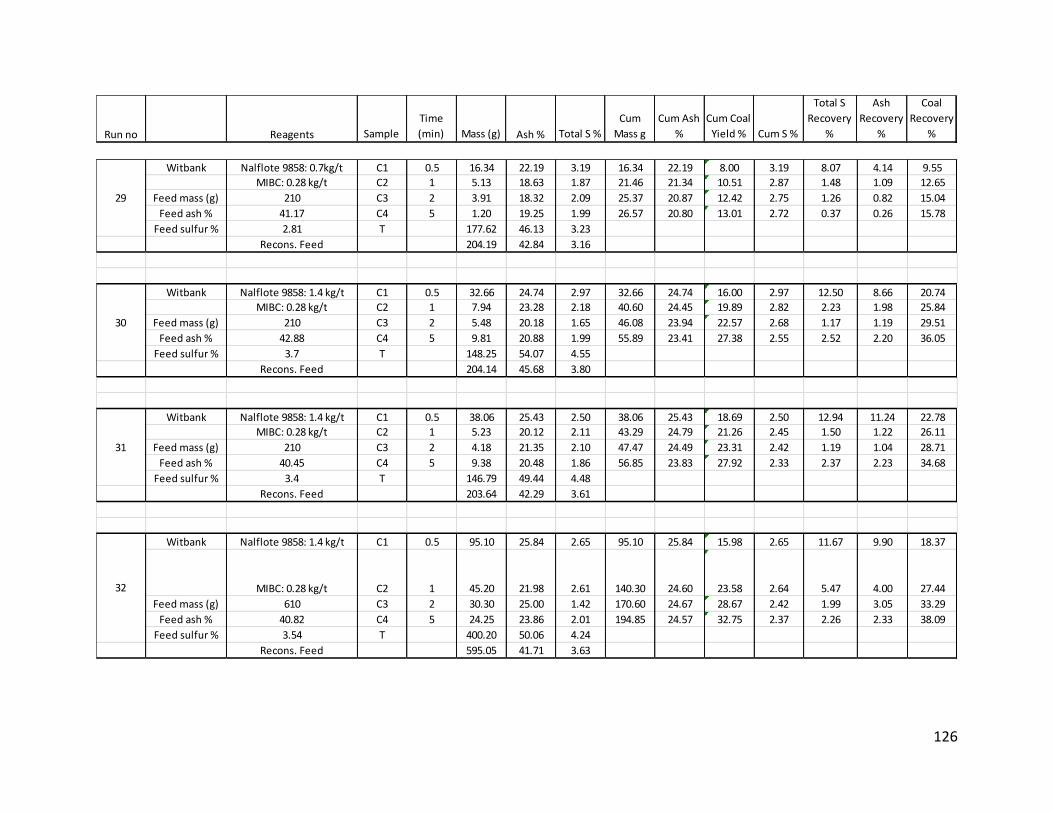
126
Run no Reagents Sample
Time
(min) Mass (g) Ash % Total S %
Cum
Mass g
Cum Ash
%
Cum Coal
Yield % Cum S %
Total S
Recovery
%
Ash
Recovery
%
Coal
Recovery
%
Witbank Nalflote 9858: 0.7kg/t C1 0.5 16.34 22.19 3.19 16.34 22.19 8.00 3.19 8.07 4.14 9.55
MIBC: 0.28 kg/t C2 1 5.13 18.63 1.87 21.46 21.34 10.51 2.87 1.48 1.09 12.65
Feed mass (g) 210 C3 2 3.91 18.32 2.09 25.37 20.87 12.42 2.75 1.26 0.82 15.04
Feed ash % 41.17 C4 5 1.20 19.25 1.99 26.57 20.80 13.01 2.72 0.37 0.26 15.78
Feed sulfur % 2.81 T 177.62 46.13 3.23
Recons. Feed 204.19 42.84 3.16
Witbank Nalflote 9858: 1.4 kg/t C1 0.5 32.66 24.74 2.97 32.66 24.74 16.00 2.97 12.50 8.66 20.74
MIBC: 0.28 kg/t C2 1 7.94 23.28 2.18 40.60 24.45 19.89 2.82 2.23 1.98 25.84
Feed mass (g) 210 C3 2 5.48 20.18 1.65 46.08 23.94 22.57 2.68 1.17 1.19 29.51
Feed ash % 42.88 C4 5 9.81 20.88 1.99 55.89 23.41 27.38 2.55 2.52 2.20 36.05
Feed sulfur % 3.7 T 148.25 54.07 4.55
Recons. Feed 204.14 45.68 3.80
Witbank Nalflote 9858: 1.4 kg/t C1 0.5 38.06 25.43 2.50 38.06 25.43 18.69 2.50 12.94 11.24 22.78
MIBC: 0.28 kg/t C2 1 5.23 20.12 2.11 43.29 24.79 21.26 2.45 1.50 1.22 26.11
Feed mass (g) 210 C3 2 4.18 21.35 2.10 47.47 24.49 23.31 2.42 1.19 1.04 28.71
Feed ash % 40.45 C4 5 9.38 20.48 1.86 56.85 23.83 27.92 2.33 2.37 2.23 34.68
Feed sulfur % 3.4 T 146.79 49.44 4.48
Recons. Feed 203.64 42.29 3.61
Witbank Nalflote 9858: 1.4 kg/t C1 0.5 95.10 25.84 2.65 95.10 25.84 15.98 2.65 11.67 9.90 18.37
MIBC: 0.28 kg/t C2 1 45.20 21.98 2.61 140.30 24.60 23.58 2.64 5.47 4.00 27.44
Feed mass (g) 610 C3 2 30.30 25.00 1.42 170.60 24.67 28.67 2.42 1.99 3.05 33.29
Feed ash % 40.82 C4 5 24.25 23.86 2.01 194.85 24.57 32.75 2.37 2.26 2.33 38.09
Feed sulfur % 3.54 T 400.20 50.06 4.24
Recons. Feed 595.05 41.71 3.63
32
29
30
31

127
Run no Reagents Sample
Time
(min) Mass (g) Ash % Total S %
Cum
Mass g
Cum Ash
%
Cum Coal
Yield % Cum S %
Total S
Recovery
%
Ash
Recovery
%
Coal
Recovery
%
Witbank Nalflote 9858: 1.4 kg/t C1 0.5 97.00 24.73 3.10 97.00 24.73 16.36 3.10 13.59 9.47 20.99
MIBC: 0.28 kg/t C2 1 44.70 23.75 3.20 141.70 24.42 23.90 3.13 6.47 4.19 31.17
Feed mass (g) 610 C3 2 31.50 23.33 2.10 173.20 24.22 29.21 2.94 2.99 2.90 38.16
Feed ash % 41.67 C4 5 22.80 25.27 1.89 196.00 24.35 33.05 2.82 1.95 2.27 43.06
Feed sulfur % 3.62 T 397.00 51.77 4.18
Recons. Feed 593.00 42.71 3.73
Witbank Nalflote 9858: 1.8 kg/t C1 0.5 34.03 22.90 2.69 34.03 22.90 16.73 2.69 12.00 9.26 21.75
MIBC: 0.28 kg/t C2 1 10.76 21.26 2.03 44.78 22.50 22.02 2.53 2.86 2.72 28.79
Feed mass (g) 210 C3 2 5.32 21.31 2.41 50.10 22.38 24.63 2.52 1.68 1.35 32.32
Feed ash % 42.32 C4 5 11.08 21.38 2.11 61.18 22.20 30.08 2.44 3.07 2.81 39.64
Feed sulfur % 3.46 T 142.20 49.63 4.31
Recons. Feed 203.38 41.38 3.75
Witbank Nalflote 9858: 2.79 kg/t C1 0.5 34.88 27.62 3.29 34.88 27.62 17.08 3.29 11.54 11.36 19.43
MIBC: 0.28 kg/t C2 1 9.09 23.79 2.27 43.97 26.83 21.53 3.08 2.07 2.55 24.58
Feed mass (g) 210 C3 2 9.43 23.51 4.51 53.40 26.24 26.14 3.33 4.27 2.61 29.92
Feed ash % 40.58 C4 5 17.19 24.16 3.35 70.59 25.73 34.56 3.34 5.79 4.90 39.37
Feed sulfur % 4.39 T 133.66 49.87 5.68
Recons. Feed 204.25 41.53 4.87
Witbank Oleic acid: 1.4 kg/t C1 0.5 29.05 24.76 2.99 29.05 24.76 14.55 2.99 13.86 8.73 17.42
MIBC: 0.11 kg/t C2 1 3.13 20.77 2.12 32.17 24.37 16.12 2.91 1.06 0.79 19.41
Feed mass (g) 210 C3 2 3.23 18.65 2.24 35.41 23.85 17.74 2.84 1.16 0.73 21.51
Feed ash % 42.20 C4 5 6.28 17.63 2.00 41.69 22.91 20.89 2.72 2.01 1.34 25.64
Feed sulfur % 3.01 T 157.89 46.12 3.25
Recons. Feed 199.57 41.27 3.14
Witbank Oleic acid: 1.8 kg/t C1 0.5 44.75 26.06 2.74 44.75 26.06 22.11 2.74 19.99 14.80 18.60
MIBC: 0.11 kg/t C2 1 6.40 22.66 2.65 51.15 25.53 25.27 2.73 2.77 1.84 22.22
Feed mass (g) 210 C3 2 5.68 22.55 2.95 56.83 25.17 28.08 2.75 2.73 1.63 25.50
Feed ash % 38.77 C4 5 9.08 18.13 2.18 65.90 24.03 32.57 2.66 3.23 2.09 30.84
Feed sulfur % 2.86 T 135.52 46.43 3.23
Recons. Feed 201.43 39.13 3.04
33
34
35
36
37

128
Run no Reagents Sample
Time
(min) Mass (g) Ash % Total S %
Cum
Mass g
Cum Ash
%
Cum Coal
Yield % Cum S %
Total S
Recovery %
Ash
Recovery
%
Coal
Recovery %
Witbank Oleic acid: 2.79 kg/t C1 0.5 46.75 27.03 2.85 46.75 27.03 22.84 2.85 18.03 15.45 27.98
MIBC: 0.11 kg/t C2 1 10.73 21.85 2.99 57.48 26.06 28.09 2.88 4.34 2.87 34.55
Feed mass (g) 210 C3 2 10.54 21.52 3.22 68.02 25.36 33.24 2.93 4.59 2.77 41.51
Feed ash % 40.47 C4 5 11.71 23.99 2.98 79.73 25.16 38.96 2.94 4.72 3.44 49.55
Feed sulfur % 3.48 T 124.91 49.42 4.04
Recons. Feed 204.64 39.96 3.61
Witbank Oleic acid: 0.7 kg/t C1 0.5 4.45 26.27 3.27 4.45 26.27 2.18 3.27 1.60 1.40 2.42
MIBC: 0.28 kg/t C2 1 0.85 20.06 0.00 5.30 25.27 2.60 0.00 0.00 0.21 2.96
Feed mass (g) 210 C3 2 3.73 17.79 2.27 9.03 22.18 4.42 2.81 0.93 0.80 5.23
Feed ash % 39.05 C4 5 2.73 21.53 3.07 11.76 22.03 5.76 2.88 0.92 0.71 6.79
Feed sulfur % 4.71 T 192.54 41.94 4.44
Recons. Feed 204.30 40.80 4.45
Witbank Oleic acid: 1.4kg/t C1 0.5 41.95 26.69 3.06 41.95 26.69 20.54 3.06 17.21 13.73 26.41
MIBC: 0.28 kg/t C2 1 8.77 19.66 2.90 50.72 25.48 24.83 3.03 3.41 2.11 32.51
Feed mass (g) 210 C3 2 7.85 18.69 2.04 58.57 24.57 28.67 2.90 2.15 1.80 37.98
Feed ash % 42.09 C4 5 5.81 18.02 1.91 64.37 23.98 31.52 2.81 1.49 1.28 42.05
Feed sulfur % 3.45 T 139.87 47.28 4.04
Recons. Feed 204.24 39.93 3.65
38
39
40
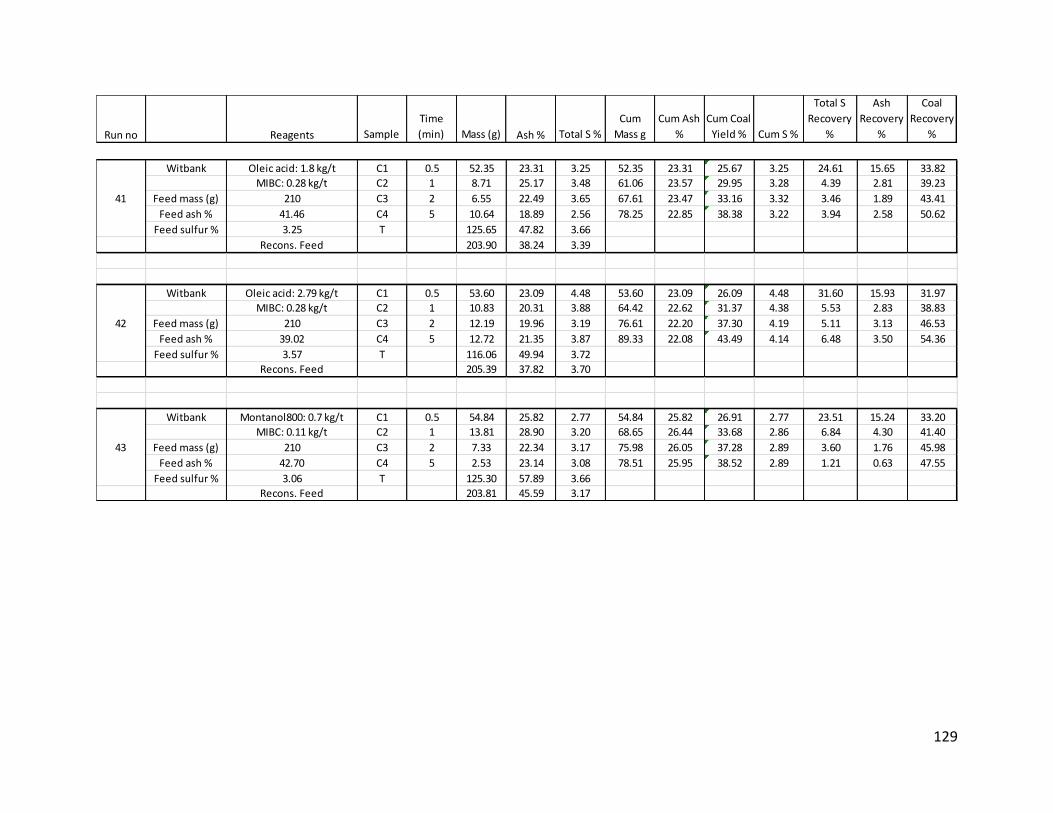
129
Run no Reagents Sample
Time
(min) Mass (g) Ash % Total S %
Cum
Mass g
Cum Ash
%
Cum Coal
Yield % Cum S %
Total S
Recovery
%
Ash
Recovery
%
Coal
Recovery
%
Witbank Oleic acid: 1.8 kg/t C1 0.5 52.35 23.31 3.25 52.35 23.31 25.67 3.25 24.61 15.65 33.82
MIBC: 0.28 kg/t C2 1 8.71 25.17 3.48 61.06 23.57 29.95 3.28 4.39 2.81 39.23
Feed mass (g) 210 C3 2 6.55 22.49 3.65 67.61 23.47 33.16 3.32 3.46 1.89 43.41
Feed ash % 41.46 C4 5 10.64 18.89 2.56 78.25 22.85 38.38 3.22 3.94 2.58 50.62
Feed sulfur % 3.25 T 125.65 47.82 3.66
Recons. Feed 203.90 38.24 3.39
Witbank Oleic acid: 2.79 kg/t C1 0.5 53.60 23.09 4.48 53.60 23.09 26.09 4.48 31.60 15.93 31.97
MIBC: 0.28 kg/t C2 1 10.83 20.31 3.88 64.42 22.62 31.37 4.38 5.53 2.83 38.83
Feed mass (g) 210 C3 2 12.19 19.96 3.19 76.61 22.20 37.30 4.19 5.11 3.13 46.53
Feed ash % 39.02 C4 5 12.72 21.35 3.87 89.33 22.08 43.49 4.14 6.48 3.50 54.36
Feed sulfur % 3.57 T 116.06 49.94 3.72
Recons. Feed 205.39 37.82 3.70
Witbank Montanol800: 0.7 kg/t C1 0.5 54.84 25.82 2.77 54.84 25.82 26.91 2.77 23.51 15.24 33.20
MIBC: 0.11 kg/t C2 1 13.81 28.90 3.20 68.65 26.44 33.68 2.86 6.84 4.30 41.40
Feed mass (g) 210 C3 2 7.33 22.34 3.17 75.98 26.05 37.28 2.89 3.60 1.76 45.98
Feed ash % 42.70 C4 5 2.53 23.14 3.08 78.51 25.95 38.52 2.89 1.21 0.63 47.55
Feed sulfur % 3.06 T 125.30 57.89 3.66
Recons. Feed 203.81 45.59 3.17
41
42
43

130
D.1.2. Process Improvement: 4 stage flotation process
Table D-2: 4-stage flotation results of the Waterberg and Witbank coal samples at selected reagent types and dosages
Run no Reagents Sample
Time
(min) Mass (g) Ash % Total S % Cum Mass g
Cum Ash
%
Cum Coal
Yield % Cum S %
Total S
Recovery %
Ash Recovery
%
Coal
Recovery %
Waterberg Nalflote 9858: 2.79 kg/t C1 0.5 17.89 23.66 1.32 17.89 23.66 8.87 1.32 9.26 4.71 11.73
Stagewise MIBC: 0.11 kg/t C2 1 38.47 26.97 1.66 56.36 25.92 27.94 1.55 25.04 11.55 36.29
Feed mass (g) 210 C3 2 36.18 35.11 1.55 92.54 29.51 45.88 1.61 21.99 14.14 56.66
Feed ash % 44.809 C4 5 25.19 46.81 1.57 117.73 33.21 58.37 1.56 15.51 13.13 68.52
Feed sulfur % 1.25 T 83.97 60.42 0.85
Recons. Feed 201.70 44.54 1.26
Waterberg Nalflote 9858: 1.4 kg/t C1 0.5 3.01 24.14 1.16 3.01 24.14 1.49 1.16 1.46 0.72 2.14
Stagewise MIBC: 0.11 kg/t C2 1 19.31 22.58 1.29 22.32 22.79 11.04 1.27 10.40 4.29 15.86
Feed mass (g) 210 C3 2 30.32 25.00 1.43 52.64 24.06 26.03 1.38 18.10 7.46 36.85
Feed ash % 48.39 C4 5 29.54 27.37 1.36 82.18 25.25 40.64 1.40 16.78 7.96 56.51
Feed sulfur % 1.1 T 120.02 67.37 1.04
Recons. Feed 202.20 50.25 1.18
Waterberg Nalflote 9858: 1.4 kg/t C1 0.5 5.50 19.28 1.21 5.50 19.28 2.71 1.21 2.73 1.05 4.07
Stagewise MIBC: 0.11 kg/t C2 1 23.96 21.47 1.20 29.46 21.06 14.54 1.20 11.82 5.09 21.18
Feed mass (g) 210 C3 2 31.37 23.86 1.52 60.83 22.51 30.02 1.37 19.60 7.41 43.02
Feed ash % 47.83 C4 5 23.88 29.19 1.28 84.71 24.39 41.81 1.34 12.56 6.90 58.39
Feed sulfur % 1.17 T 117.89 68.13 1.10
Recons. Feed 202.60 49.84 1.20
Waterberg Nalflote 9858: 1.4 kg/t C1 0.5 32.77 17.86 1.35 32.77 17.86 5.51 1.35 6.33 1.99 8.28
Stagewise MIBC: 0.11 kg/t C2 1 45.20 21.39 1.27 77.97 19.91 13.10 1.30 8.21 3.28 19.04
Feed mass (g) 610 C3 2 103.63 24.07 1.41 181.60 22.28 30.52 1.36 20.91 8.47 43.85
Feed ash % 49.15 C4 5 88.29 32.94 1.50 269.89 25.77 45.35 1.41 18.95 9.88 62.76
Feed sulfur % 1.21 T 325.18 69.15 0.98
Recons. Feed 595.07 49.47 1.17
Waterberg Nalflote 9858: 1.4 kg/t C1 0.5 22.49 19.67 1.30 22.49 19.67 3.80 1.30 4.04 1.52 5.56
Stagewise MIBC: 0.11 kg/t C2 1 51.87 21.23 1.34 74.36 20.76 12.55 1.33 9.60 3.79 18.22
Feed mass (g) 610 C3 2 89.12 23.40 1.48 163.48 22.20 27.59 1.41 18.22 7.18 39.17
Feed ash % 48.09 C4 5 90.30 28.74 1.45 253.78 24.53 42.83 1.42 18.08 8.93 59.58
Feed sulfur % 1.19 T 338.78 67.40 1.07
Recons. Feed 592.56 49.04 1.22
47
48
45
46
44

131
Run no Reagents Sample
Time
(min) Mass (g) Ash % Total S % Cum Mass g
Cum Ash
%
Cum Coal
Yield % Cum S %
Total S
Recovery %
Ash Recovery
%
Coal
Recovery %
Waterberg Oleic acid: 2.79 kg/t C1 0.5 19.46 27.89 1.27 19.46 27.89 9.57 1.27 9.09 5.67 12.02
Stagewise MIBC: 0.11 kg/t C2 1 37.03 34.66 1.45 56.49 32.33 27.77 1.39 19.74 13.41 33.64
Feed mass (g) 210 C3 2 38.33 39.25 1.60 94.82 35.13 46.61 1.47 22.55 15.72 54.09
Feed ash % 45.11 C4 5 39.06 50.54 1.94 133.88 39.62 65.80 1.61 27.86 20.63 71.49
Feed sulfur % 1.29 T 69.57 61.29 0.81
Recons. Feed 203.45 47.03 1.34
Waterberg Nalflote 9858: 0.7 kg/t C1 0.5 4.01 17.07 1.38 4.01 17.07 1.97 1.38 2.15 0.74 2.78
Stagewise MIBC: 0.11 kg/t C2 1 4.43 21.43 1.23 8.44 19.36 4.16 1.30 2.11 1.02 5.72
Feed mass (g) 210 C3 2 5.02 20.65 1.33 13.46 19.84 6.63 1.31 2.59 1.12 9.00
Feed ash % 43.33 C4 5 6.05 19.55 1.15 19.51 19.75 9.61 1.26 2.70 1.27 13.03
Feed sulfur % 1.22 T 183.60 48.49 1.27
Recons. Feed 203.11 45.73 1.27
Waterberg Nalflote 9858: 0.7 kg/t C1 0.5 11.90 21.11 1.29 11.90 21.11 5.87 1.29 6.37 2.54 8.06
Stagewise MIBC: 0.28 kg/t C2 1 9.56 20.11 1.41 21.46 20.66 10.59 1.34 5.59 1.94 14.57
Feed mass (g) 210 C3 2 6.73 22.04 1.22 28.19 20.99 13.91 1.31 3.41 1.50 19.05
Feed ash % 46.07 C4 5 7.20 27.78 1.15 35.39 22.37 17.46 1.28 3.43 2.02 23.56
Feed sulfur % 1.21 T 167.31 54.40 1.17
Recons. Feed 202.70 48.80 1.19
Waterberg Montanol800: 0.7 kg/t C1 0.5 14.24 27.59 1.24 14.24 27.59 6.99 1.24 7.51 4.09 9.15
Stagewise MIBC: 0.11 kg/t C2 1 10.54 26.74 1.44 24.78 27.23 12.17 1.33 6.45 2.94 16.01
Feed mass (g) 210 C3 2 9.11 29.73 1.15 33.89 27.90 16.64 1.28 4.46 2.82 21.59
Feed ash % 46.56 C4 5 10.07 32.98 1.13 43.96 29.06 21.58 1.24 4.84 3.46 27.46
Feed sulfur % 1.25 T 159.70 52.13 1.13
Recons. Feed 203.66 47.15 1.15
50
51
52
53

132
Run no Reagents Sample
Time
(min) Mass (g) Ash % Total S %
Cum
Mass g
Cum Ash
%
Cum Coal
Yield % Cum S %
Total S
Recovery %
Ash
Recovery
%
Coal
Recovery %
Witbank Nalflote 9858: 2.79 kg/t C1 0.5 14.64 23.91 2.27 14.64 23.91 7.19 2.27 4.33 4.28 9.19
Stagewise MIBC: 0.11 kg/t C2 1 28.09 22.58 3.24 42.73 23.04 20.98 2.91 11.87 7.76 27.05
Feed mass (g) 210 C3 2 36.66 27.60 3.05 79.39 25.15 38.98 2.97 14.58 12.38 48.74
Feed ash % 42.39 C4 5 28.50 24.73 4.54 107.89 25.04 52.97 3.39 16.87 8.62 66.40
Feed sulfur % 3.89 T 95.78 57.14 4.19
Recons. Feed 203.67 40.14 3.76
Witbank Nalflote 9858:1.4 kg/t C1 0.5 4.83 20.65 1.90 4.83 20.65 2.37 1.90 1.33 1.14 2.72
Stagewise MIBC: 0.11 kg/t C2 1 15.46 21.18 2.32 20.29 21.05 9.94 2.22 5.22 3.74 11.52
Feed mass (g) 210 C3 2 22.93 24.73 2.26 43.22 23.00 21.17 2.24 7.54 6.47 23.79
Feed ash % 40.41 C4 5 30.62 23.68 2.82 73.84 23.29 36.16 2.48 12.56 8.28 40.27
Feed sulfur % 2.92 T 130.36 54.00 3.87
Recons. Feed 204.20 42.89 3.37
Witbank Oleic acid: 2.79 kg/t C1 0.5 12.88 21.11 2.29 12.88 21.11 6.37 2.29 3.82 3.34 8.07
Stagewise MIBC: 0.11 kg/t C2 1 32.71 26.88 3.71 45.59 25.25 22.56 3.31 15.72 10.79 27.03
Feed mass (g) 210 C3 2 38.60 29.03 3.70 84.19 26.98 41.66 3.49 18.50 13.75 48.82
Feed ash % 39.56 C4 5 25.21 33.51 3.57 109.40 28.49 54.13 3.51 11.66 10.36 62.17
Feed sulfur % 3.91 T 92.71 54.30 4.19
Recons. Feed 202.11 40.33 3.82
54
56
55

133
Run no Reagents Sample
Time
(min) Mass (g) Ash % Total S %
Cum
Mass g
Cum Ash
%
Cum Coal
Yield % Cum S %
Total S
Recovery %
Ash
Recovery
%
Coal
Recovery %
Witbank Nalflote 9858: 0.7 kg/t C1 0.5 2.67 20.00 2.30 2.67 20.00 1.31 2.30 0.75 0.61 1.65
Stagewise MIBC: 0.11 kg/t C2 1 3.89 19.47 2.31 6.56 19.69 3.23 2.31 1.10 0.87 4.01
Feed mass (g) 210 C3 2 10.48 15.85 1.79 17.04 17.33 8.38 1.99 2.30 1.91 10.69
Feed ash % 39.08 C4 5 15.69 17.88 1.95 32.73 17.59 16.10 1.97 3.75 3.23 20.52
Feed sulfur % 3.6 T 170.56 47.57 4.41
Recons. Feed 203.29 42.74 4.02
Witbank Nalflote 9858: 0.7 kg/t C1 0.5 10.95 20.67 2.27 10.95 20.67 5.41 2.27 3.02 2.64 6.79
Stagewise MIBC: 0.28 kg/t C2 1 14.51 16.95 2.18 25.46 18.55 12.59 2.22 3.84 2.87 16.17
Feed mass (g) 210 C3 2 18.64 18.39 1.78 44.10 18.48 21.80 2.03 4.03 3.99 28.08
Feed ash % 40.23 C4 5 22.41 23.33 2.28 66.51 20.12 32.88 2.12 6.20 6.09 41.54
Feed sulfur % 3.82 T 135.75 53.37 5.03
Recons. Feed 202.26 42.44 4.07
Witbank Montanol800: 0.7 kg/t C1 0.5 7.82 26.16 3.12 7.82 26.16 3.84 3.12 2.91 2.37 4.69
Stagewise MIBC: 0.11 kg/t C2 1 8.40 22.78 3.24 16.22 24.41 7.97 3.18 3.24 2.22 9.86
Feed mass (g) 210 C3 2 14.94 21.39 2.95 31.16 22.96 15.31 3.07 5.25 3.70 19.11
Feed ash % 41.01 C4 5 17.68 21.35 3.46 48.84 22.38 24.00 3.21 7.29 4.37 30.19
Feed sulfur % 4.07 T 154.63 48.79 4.41
Recons. Feed 203.47 42.45 4.12
57
58
59

134
D.1.3. Sulfide Flotation Results
Table D-3: Sulfide flotation results of the Waterberg and Witbank coal samples
Run no Reagents Sample
Time
(min) Mass (g) Ash % Total S %
Cum
Mass g
Cum Ash
%
Cum Coal
Yield % Cum S %
Total S
Recovery
%
Ash
Recovery
%
Coal
Recovery
%
Waterberg SIBX: 2.33 kg/t C1 2 11.64 47.45 11.40 11.64 47.45 5.79 11.40 50.00 5.35 60.04
MIBC: 0.11 kg/t; Dextrin:
0.93 kg/t C2 6 6.86 34.14 2.61 18.50 42.52 9.21 8.14 6.75 2.27 68.14
Feed 210 C3 12 4.68 24.25 2.12 23.18 38.83 11.54 6.93 3.74 1.10 72.63
Feed ash % 48.65 C4 20 3.05 20.15 2.19 26.23 36.66 13.05 6.37 2.52 0.59 75.65
Feed sulfur % 1.1 T 174.69 53.62 0.56
Recons. Feed 200.92 51.41 1.32
Waterberg PAX: 2.33 kg/t C1 2 16.25 47.61 8.17 16.25 47.61 8.07 8.17 51.22 7.75 57.36
MIBC: 0.11 kg/t; Dextrin:
0.93 kg/t C2 6 8.22 31.11 1.96 24.47 42.07 12.16 6.08 6.22 2.56 64.32
Feed 210 C3 12 6.73 21.76 1.70 31.20 37.69 15.50 5.14 4.41 1.47 69.26
Feed ash % 49.66 C4 20 4.09 18.46 1.77 35.29 35.46 17.53 4.75 2.79 0.76 72.39
Feed sulfur % 1.15 T 165.99 52.62 0.55
Recons. Feed 201.28 49.61 1.29
Waterberg SIBX: 2.33 kg/t C1 2 16.82 48.63 6.88 16.82 48.63 8.33 6.88 44.58 8.18 52.13
MIBC: 0.28 kg/t; Dextrin:
0.93 kg/t C2 6 5.12 36.22 2.30 21.94 45.74 10.87 5.81 4.54 1.85 57.43
Feed 210 C3 12 2.42 25.24 2.09 24.36 43.70 12.07 5.44 1.95 0.61 59.71
Feed ash % 50.41 C4 20 1.47 20.29 2.63 25.83 42.37 12.80 5.28 1.49 0.30 61.45
Feed sulfur % 1.1 T 175.98 50.63 0.70
Recons. Feed 201.81 49.58 1.29
Waterberg SIBX: 2.33 kg/t C1 2 14.05 49.16 8.90 14.05 49.16 6.91 8.90 51.26 6.92 58.03
MIBC: 0.11 kg/t; Dextrin:
1.4 kg/t C2 6 2.64 30.72 2.61 16.69 46.24 8.21 7.91 2.82 0.81 61.22
Feed 210 C3 12 1.31 22.02 2.34 18.00 44.48 8.85 7.50 1.26 0.29 62.65
Feed ash % 48.18 C4 20 1.00 0.00 2.64 19.00 0.00 9.35 7.24 1.08 0.00 63.87
Feed sulfur % 1.06 T 184.30 49.56 0.65
Recons. Feed 203.30 49.08 1.20
60
61
62
63
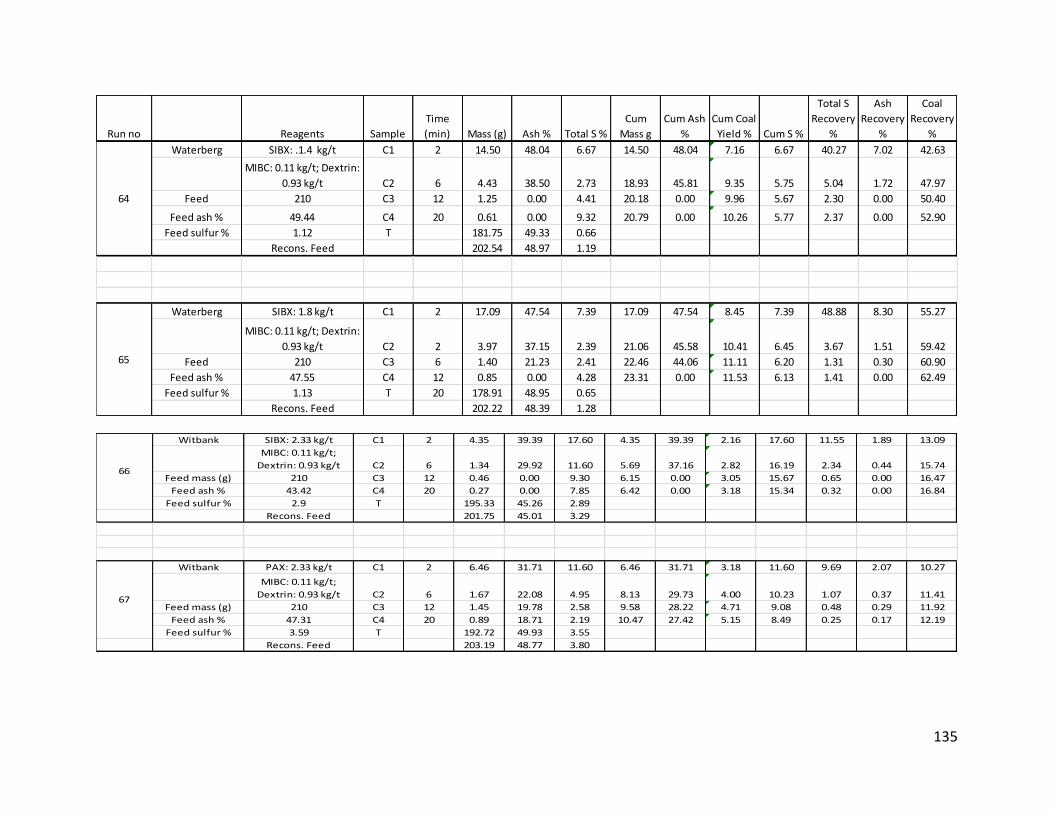
135
Run no Reagents Sample
Time
(min) Mass (g) Ash % Total S %
Cum
Mass g
Cum Ash
%
Cum Coal
Yield % Cum S %
Total S
Recovery
%
Ash
Recovery
%
Coal
Recovery
%
Waterberg SIBX: .1.4 kg/t C1 2 14.50 48.04 6.67 14.50 48.04 7.16 6.67 40.27 7.02 42.63
MIBC: 0.11 kg/t; Dextrin:
0.93 kg/t C2 6 4.43 38.50 2.73 18.93 45.81 9.35 5.75 5.04 1.72 47.97
Feed 210 C3 12 1.25 0.00 4.41 20.18 0.00 9.96 5.67 2.30 0.00 50.40
Feed ash % 49.44 C4 20 0.61 0.00 9.32 20.79 0.00 10.26 5.77 2.37 0.00 52.90
Feed sulfur % 1.12 T 181.75 49.33 0.66
Recons. Feed 202.54 48.97 1.19
Waterberg SIBX: 1.8 kg/t C1 2 17.09 47.54 7.39 17.09 47.54 8.45 7.39 48.88 8.30 55.27
MIBC: 0.11 kg/t; Dextrin:
0.93 kg/t C2 2 3.97 37.15 2.39 21.06 45.58 10.41 6.45 3.67 1.51 59.42
Feed 210 C3 6 1.40 21.23 2.41 22.46 44.06 11.11 6.20 1.31 0.30 60.90
Feed ash % 47.55 C4 12 0.85 0.00 4.28 23.31 0.00 11.53 6.13 1.41 0.00 62.49
Feed sulfur % 1.13 T 20 178.91 48.95 0.65
Recons. Feed 202.22 48.39 1.28
64
65
Witbank SIBX: 2.33 kg/t C1 2 4.35 39.39 17.60 4.35 39.39 2.16 17.60 11.55 1.89 13.09
MIBC: 0.11 kg/t;
Dextrin: 0.93 kg/t C2 6 1.34 29.92 11.60 5.69 37.16 2.82 16.19 2.34 0.44 15.74
Feed mass (g) 210 C3 12 0.46 0.00 9.30 6.15 0.00 3.05 15.67 0.65 0.00 16.47
Feed ash % 43.42 C4 20 0.27 0.00 7.85 6.42 0.00 3.18 15.34 0.32 0.00 16.84
Feed sulfur % 2.9 T 195.33 45.26 2.89
Recons. Feed 201.75 45.01 3.29
Witbank PAX: 2.33 kg/t C1 2 6.46 31.71 11.60 6.46 31.71 3.18 11.60 9.69 2.07 10.27
MIBC: 0.11 kg/t;
Dextrin: 0.93 kg/t C2 6 1.67 22.08 4.95 8.13 29.73 4.00 10.23 1.07 0.37 11.41
Feed mass (g) 210 C3 12 1.45 19.78 2.58 9.58 28.22 4.71 9.08 0.48 0.29 11.92
Feed ash % 47.31 C4 20 0.89 18.71 2.19 10.47 27.42 5.15 8.49 0.25 0.17 12.19
Feed sulfur % 3.59 T 192.72 49.93 3.55
Recons. Feed 203.19 48.77 3.80
66
67

136
Run no Reagents Sample
Time
(min) Mass (g) Ash % Total S %
Cum
Mass g
Cum Ash
%
Cum Coal
Yield % Cum S %
Total S
Recovery
%
Ash
Recovery
%
Coal
Recovery
%
Witbank SIBX: 2.33 kg/t C1 2 19.13 33.83 16.40 19.13 33.83 9.57 16.40 41.55 7.29 43.59
MIBC: 0.28 kg/t;
Dextrin: 0.93 kg/t C2 6 3.73 27.79 7.51 22.86 32.85 11.44 14.95 3.71 1.17 47.49
Feed mass (g) 210 C3 12 2.20 21.72 3.22 25.06 31.87 12.54 13.92 0.94 0.54 48.47
Feed ash % 42.88 C4 20 1.83 17.25 1.68 26.89 30.87 13.45 13.09 0.41 0.36 48.90
Feed sulfur % 3.6 T 173.02 46.18 2.33Recons. Feed 199.91 44.39 3.78
Witbank SIBX: 2.33 kg/t C1 2 7.34 38.61 17.00 7.34 38.61 3.66 17.00 18.42 3.01 20.52
MIBC: 0.11 kg/t;
Dextrin: 1.4 kg/t C2 6 1.48 24.35 8.47 8.82 36.22 4.40 15.57 1.85 0.38 22.58
Feed mass (g) 210 C3 12 0.67 0.00 5.09 9.49 0.00 4.73 14.83 0.50 0.00 23.15
Feed ash % 45.77 C4 20 0.33 0.00 7.61 9.82 0.00 4.89 14.59 0.37 0.00 23.56
Feed sulfur % 3.03 T 190.84 47.43 2.80
Recons. Feed 200.66 46.88 3.38
Witbank SIBX: .1.4 kg/t C1 2 12.94 34.38 12.00 12.94 34.38 6.45 12.00 20.93 4.82 20.37
MIBC: 0.28 kg/t;
Dextrin: 0.93 kg/t C2 6 4.97 28.75 7.69 17.91 32.82 8.93 10.80 5.15 1.55 25.38
Feed mass (g) 210 C3 12 3.03 21.98 3.17 20.94 31.25 10.44 9.70 1.29 0.72 26.64
Feed ash % 46.9 C4 20 2.46 18.27 1.41 23.40 29.88 11.66 8.83 0.47 0.49 27.09
Feed sulfur % 3.8 T 177.25 48.08 3.02
Recons. Feed 200.65 45.96 3.70
Witbank SIBX: 1.8 kg/t C1 2 16.26 32.10 13.40 16.26 32.10 8.11 13.40 28.49 5.48 27.78
MIBC: 0.28 kg/t;
Dextrin: 0.93 kg/t C2 6 4.58 29.02 7.74 20.84 31.42 10.39 12.16 4.64 1.40 32.30
Feed mass (g) 210 C3 12 2.71 21.26 2.99 23.55 30.25 11.74 11.10 1.06 0.61 33.34
Feed ash % 45.29 C4 20 2.33 17.87 1.60 25.88 29.14 12.90 10.25 0.49 0.44 33.81
Feed sulfur % 3.91 T 174.70 50.17 2.86
Recons. Feed 200.58 47.46 3.81
70
71
68
69

137
D.1.4. Two stage flotation
Table D-4: Two-stage flotation results of the Waterberg and Witbank coal samples
Run no Reagents Sample
Time
(min) Mass (g) Ash % Total S %
Cum
Mass g
Cum Ash
%
Cum Coal
Yield % Cum S %
Total S
Recovery
%
Ash
Recovery
%
Coal
Recovery
%
Waterberg Nalflote 9858: 1.4 kg/t C1 0.5 3.31 31.78 0.91 3.31 31.78 1.07 0.91 0.99 0.73 0.86
Coal flotation
(Stagewise) MIBC: 0.11 kg/t C2 1 19.28 23.09 1.25 22.59 24.36 7.29 1.20 7.95 3.09 7.78
Feed 310 C3 2 32.76 22.75 1.29 55.35 23.41 17.85 1.25 13.93 5.17 19.91
Feed ash % 49.87 C4 5 38.36 26.01 1.35 93.71 24.47 30.23 1.29 17.07 6.92 34.78
Feed sulfur % 1.13 T 198.02 60.21 0.93
Recons. Feed 291.73 49.41 1.04
Waterberg SIBX: 2.33 kg/t C1 2 4.23 59.73 22.30 4.23 59.73 2.16 22.30 40.81 2.06 42.92
Sulfide flotationMIBC: 0.11 kg/t; Dextrin:
0.93 kg/t C2 6 0.55 0.00 8.88 4.78 0.00 2.44 20.76 2.11 0.00 45.14
Feed 210 C3 12 0.38 0.00 7.71 5.16 0.00 2.63 19.80 1.27 0.00 46.48
Feed ash % 62.07 C4 20 0.88 0.00 8.24 6.04 0.00 3.08 18.11 3.14 0.00 49.77
Feed sulfur % 1.12 T 190.19 62.56 0.64
Recons. Feed 196.23 62.47 1.18
Waterberg Nalflote 9858: 1.4 kg/t C1 0.5 4.09 21.93 0.99 4.09 21.93 1.32 0.99 1.34 0.61 1.27
Coal flotation
(Stagewise) MIBC: 0.11 kg/t C2 1 18.24 23.60 1.25 22.33 23.30 7.20 1.20 7.54 2.95 8.41
Feed 310 C3 2 32.68 22.02 1.26 55.01 22.54 17.75 1.24 13.63 4.92 21.31
Feed ash % 48.97 C4 5 38.39 27.42 1.35 93.40 24.54 30.13 1.28 17.15 7.20 37.54
Feed sulfur % 1.05 T 202.16 60.19 0.91
Recons. Feed 295.56 49.45 1.02
Waterberg SIBX: 2.33 kg/t C1 2 5.69 59.76 18.10 5.69 59.76 2.81 18.10 42.59 2.68 51.84
Sulfide flotation MIBC: 0.11 kg/t; Dextrin:
0.93 kg/t C2 4 0.51 0.00 12.40 6.20 0.00 3.06 17.63 2.62 0.00 55.02
Feed 210 C3 6 0.28 0.00 0.00 6.48 0.00 3.20 0.00 0.00 0.00 55.02
Feed ash % 60.19 C4 8 0.00 0.00 0.00 0.00 0.00 0.00 0.00 0.00 0.00 0.00
Feed sulfur % 0.98 T 196.25 62.75 0.65
Recons. Feed 202.73 62.65 1.19
73
74
75
72
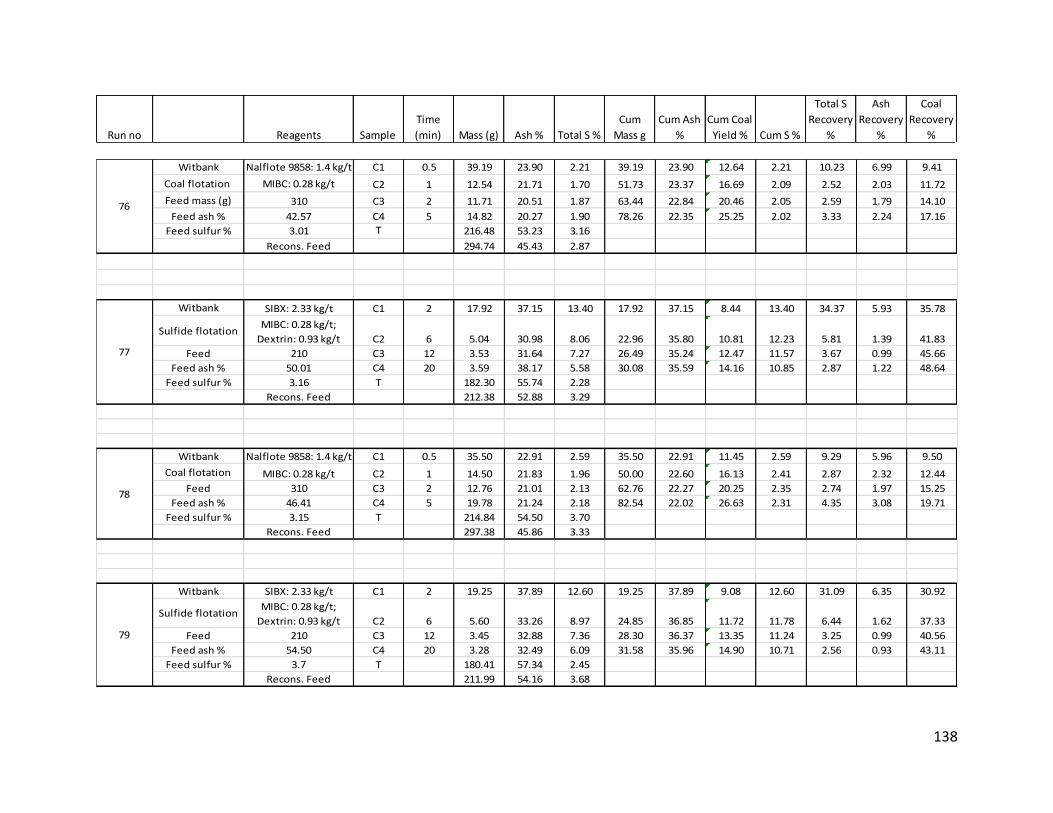
138
Run no Reagents Sample
Time
(min) Mass (g) Ash % Total S %
Cum
Mass g
Cum Ash
%
Cum Coal
Yield % Cum S %
Total S
Recovery
%
Ash
Recovery
%
Coal
Recovery
%
Witbank Nalflote 9858: 1.4 kg/t C1 0.5 39.19 23.90 2.21 39.19 23.90 12.64 2.21 10.23 6.99 9.41
Coal flotation MIBC: 0.28 kg/t C2 1 12.54 21.71 1.70 51.73 23.37 16.69 2.09 2.52 2.03 11.72
Feed mass (g) 310 C3 2 11.71 20.51 1.87 63.44 22.84 20.46 2.05 2.59 1.79 14.10
Feed ash % 42.57 C4 5 14.82 20.27 1.90 78.26 22.35 25.25 2.02 3.33 2.24 17.16
Feed sulfur % 3.01 T 216.48 53.23 3.16
Recons. Feed 294.74 45.43 2.87
Witbank SIBX: 2.33 kg/t C1 2 17.92 37.15 13.40 17.92 37.15 8.44 13.40 34.37 5.93 35.78
Sulfide flotationMIBC: 0.28 kg/t;
Dextrin: 0.93 kg/t C2 6 5.04 30.98 8.06 22.96 35.80 10.81 12.23 5.81 1.39 41.83
Feed 210 C3 12 3.53 31.64 7.27 26.49 35.24 12.47 11.57 3.67 0.99 45.66
Feed ash % 50.01 C4 20 3.59 38.17 5.58 30.08 35.59 14.16 10.85 2.87 1.22 48.64
Feed sulfur % 3.16 T 182.30 55.74 2.28
Recons. Feed 212.38 52.88 3.29
Witbank Nalflote 9858: 1.4 kg/t C1 0.5 35.50 22.91 2.59 35.50 22.91 11.45 2.59 9.29 5.96 9.50
Coal flotation MIBC: 0.28 kg/t C2 1 14.50 21.83 1.96 50.00 22.60 16.13 2.41 2.87 2.32 12.44
Feed 310 C3 2 12.76 21.01 2.13 62.76 22.27 20.25 2.35 2.74 1.97 15.25
Feed ash % 46.41 C4 5 19.78 21.24 2.18 82.54 22.02 26.63 2.31 4.35 3.08 19.71
Feed sulfur % 3.15 T 214.84 54.50 3.70
Recons. Feed 297.38 45.86 3.33
Witbank SIBX: 2.33 kg/t C1 2 19.25 37.89 12.60 19.25 37.89 9.08 12.60 31.09 6.35 30.92
Sulfide flotationMIBC: 0.28 kg/t;
Dextrin: 0.93 kg/t C2 6 5.60 33.26 8.97 24.85 36.85 11.72 11.78 6.44 1.62 37.33
Feed 210 C3 12 3.45 32.88 7.36 28.30 36.37 13.35 11.24 3.25 0.99 40.56
Feed ash % 54.50 C4 20 3.28 32.49 6.09 31.58 35.96 14.90 10.71 2.56 0.93 43.11
Feed sulfur % 3.7 T 180.41 57.34 2.45
Recons. Feed 211.99 54.16 3.68
76
77
78
79

139
D.1.5. Coal flotation of reflux classification feed overflow product
Table D-5: RC feed overflow coal flotation results of the Waterberg and Witbank coal samples
Run no Reagents SampleTime
(min)Mass (g) Ash % Total S %
Cum
Mass g
Cum Ash
%
Cum Coal
Yield %Cum S %
Total S
Recovery
%
Ash
Recovery
%
Coal
Recovery
%
Waterbeeg Nalflote 9858: 1.4 kg/t C1 0.5 2.34 9.52 1.07 2.34 9.52 1.14 1.07 1.15 0.63 1.22
Stagewise MIBC: 0.11 kg/t C2 1 25.73 14.89 0.98 28.07 14.45 13.68 0.99 11.60 10.88 13.76
Feed mass (g) 210 C3 2 45.47 14.61 1.02 73.54 14.55 35.85 1.01 21.33 18.86 36.19
Feed ash % 15.22 C4 5 49.66 17.37 1.06 123.20 15.68 60.06 1.03 24.09 24.50 59.69
Feed sulfur % 1.03 T 81.94 19.39 1.11
Recons. Feed 205.14 17.16 1.06
Witbank Nalflote 9858: 1.4.kg/t C1 0.5 63.84 22.99 0.92 63.84 22.99 31.06 0.92 28.46 30.73 31.86
MIBC: 0.28 kg/t C2 1 4.92 21.28 0.80 68.76 22.87 33.46 0.91 1.91 2.19 34.31
Feed mass (g) 210 C3 2 8.98 20.69 0.79 77.74 22.61 37.83 0.90 3.44 3.89 38.91
Feed ash % 22.68 C4 5 10.82 20.88 0.84 88.56 22.40 43.09 0.89 4.40 4.73 44.38
Feed sulfur % 0.99 T 116.96 23.86 1.09
Recons. Feed 205.52 23.23 1.00
80
81
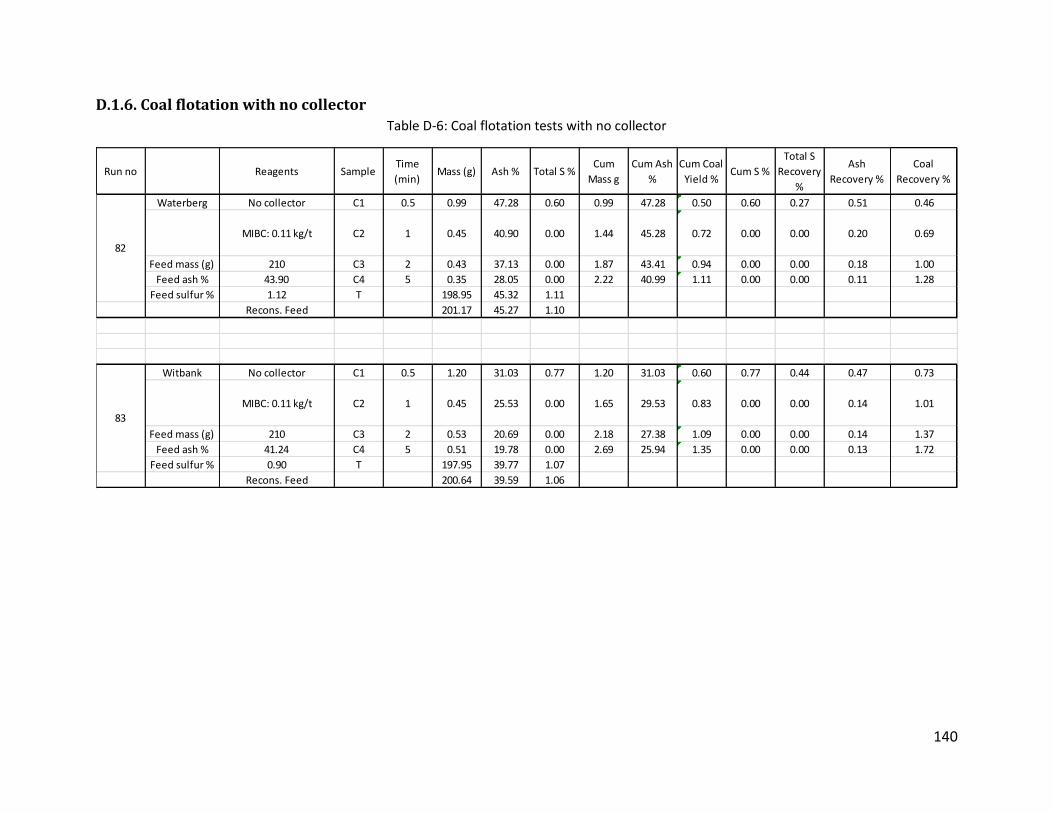
140
D.1.6. Coal flotation with no collector
Table D-6: Coal flotation tests with no collector
Run no Reagents SampleTime
(min)Mass (g) Ash % Total S %
Cum
Mass g
Cum Ash
%
Cum Coal
Yield %Cum S %
Total S
Recovery
%
Ash
Recovery %
Coal
Recovery %
Waterberg No collector C1 0.5 0.99 47.28 0.60 0.99 47.28 0.50 0.60 0.27 0.51 0.46
MIBC: 0.11 kg/t C2 1 0.45 40.90 0.00 1.44 45.28 0.72 0.00 0.00 0.20 0.69
Feed mass (g) 210 C3 2 0.43 37.13 0.00 1.87 43.41 0.94 0.00 0.00 0.18 1.00
Feed ash % 43.90 C4 5 0.35 28.05 0.00 2.22 40.99 1.11 0.00 0.00 0.11 1.28
Feed sulfur % 1.12 T 198.95 45.32 1.11
Recons. Feed 201.17 45.27 1.10
Witbank No collector C1 0.5 1.20 31.03 0.77 1.20 31.03 0.60 0.77 0.44 0.47 0.73
MIBC: 0.11 kg/t C2 1 0.45 25.53 0.00 1.65 29.53 0.83 0.00 0.00 0.14 1.01
Feed mass (g) 210 C3 2 0.53 20.69 0.00 2.18 27.38 1.09 0.00 0.00 0.14 1.37
Feed ash % 41.24 C4 5 0.51 19.78 0.00 2.69 25.94 1.35 0.00 0.00 0.13 1.72
Feed sulfur % 0.90 T 197.95 39.77 1.07
Recons. Feed 200.64 39.59 1.06
83
82

141
D.2. Reflux Classification Results Table D-7: Witbank feed fractionation results
Water flow rate
L/min
Density
g/cc Ash (%) Mass of
sample (g) Sulfur % Cumulative
ash % Cumulative
sulfur % Mass yield % Sulfur
recovery %
20 1.43 ± 0.02 8.72 ± 1.3 9.2 ± 0.07 1.84 ± 0.22 8.72 ± 1.33 1.84 ± 0.23 1.5 ± 0.12 0.9 ± 0.07
40 1.54 ± 0.014 15.18 ± 0.4 220.5 ± 1.4 1.19 ± 0.08 14.93 ± 0.32 1.22 ± 0.07 35.0 ± 2.47 13.8 ± 1.40
60 1.89 ± 0.01 46.59 ± 4.7 175.8 ± 6.7 1.15 ± 0.09 28.53 ± 0.68 1.18 ± 0.08 27.7 ± 2.1 10.5 ± 0.37
80 2.54 ± 0.03 69.87 ± 6.2 131.3 ± 2.2 2.56 ± 0.74 38.60 ± 0.32 1.53 ± 0.27 20.8 ±1.96 17.7 ± 6.05
100 2.73 ± 0.044 76.09 ± 1.7 75.5 ± 16.3 6.84 ± 1.93 43.21 ± 1.16 2.16 ± 0.37 11.9 ± 1.65 26.24 ± 2.77
underflow 3.37 ± 0.26 70.56 ± 2.1 19.9 ± 6.5 29.75 ± 0.78 44.07 ± 1.41 3.03 ± 0.12 3.1 ± 0.79 31.0 ± 9.77
Table D-8: Witbank tails fractionation results
Water flow rate
L/min
Density
g/cc Ash (%) Mass of
sample (g) Sulfur % Cumulative
ash % Cumulative
sulfur % Mass yield % Sulfur
recovery %
20 1.44 ± 0.01 9.8 ± 1.13 2.8 ± 0.24 1.86 ± 0.07 9.8 ± 0.56 1.86 ± 0.078 0.5 ± 0.056 0.3 ± 0.03
40 1.54 ± 0.03 13.4 ± 1.25 68.7 ± 2.7 0.98 ± 0.16 13.2 ± 1.19 1.02 ± 0.22 12.4 ± 2.56 3.6 ± 0.51
60 2.02 ± 0.04 49.9 ± 5.5 136.2 ± 7.3 0.95 ± 0.04 37.3 ± 3.4 0.98 ± 0.013 24.6 ± 5.46 7.1 ± 2.12
80 2.52 ± 0.15 62.5 ±3.4 179.2 ± 28.9 1.22 ± 0.23 49.0 ± 3.2 1.09 ± 0.1 32.4 ± 5.9 12.1 ± 4.9
100 2.76 ± 0.145 75.5 ±6.2 121.6 ± 74.8 1.65 ± 0.34 55.1 ± 0.08 1.25 ± 0.09 21.8 ± 13.0 11.2 ± 8.16
underflow 3.06 ± 0.73 70.6 ±1.6 45.5 ± 6.4 26.30 ± 1.41 56.3 ± 0.05 3.3 ± 0.2 8.2 ± 0.97 64.2 ±1.5
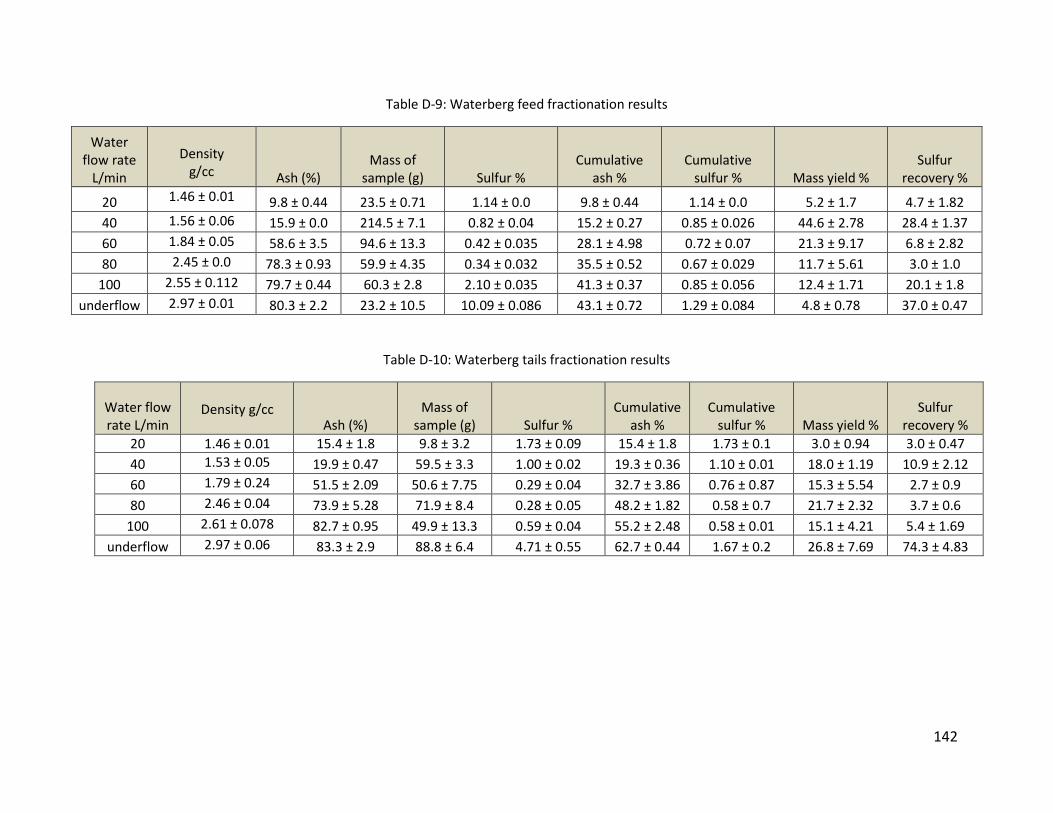
142
Table D-9: Waterberg feed fractionation results
Water flow rate
L/min
Density
g/cc Ash (%) Mass of
sample (g) Sulfur % Cumulative
ash % Cumulative
sulfur % Mass yield % Sulfur
recovery %
20 1.46 ± 0.01 9.8 ± 0.44 23.5 ± 0.71 1.14 ± 0.0 9.8 ± 0.44 1.14 ± 0.0 5.2 ± 1.7 4.7 ± 1.82
40 1.56 ± 0.06 15.9 ± 0.0 214.5 ± 7.1 0.82 ± 0.04 15.2 ± 0.27 0.85 ± 0.026 44.6 ± 2.78 28.4 ± 1.37
60 1.84 ± 0.05 58.6 ± 3.5 94.6 ± 13.3 0.42 ± 0.035 28.1 ± 4.98 0.72 ± 0.07 21.3 ± 9.17 6.8 ± 2.82
80 2.45 ± 0.0 78.3 ± 0.93 59.9 ± 4.35 0.34 ± 0.032 35.5 ± 0.52 0.67 ± 0.029 11.7 ± 5.61 3.0 ± 1.0
100 2.55 ± 0.112 79.7 ± 0.44 60.3 ± 2.8 2.10 ± 0.035 41.3 ± 0.37 0.85 ± 0.056 12.4 ± 1.71 20.1 ± 1.8
underflow 2.97 ± 0.01 80.3 ± 2.2 23.2 ± 10.5 10.09 ± 0.086 43.1 ± 0.72 1.29 ± 0.084 4.8 ± 0.78 37.0 ± 0.47
Table D-10: Waterberg tails fractionation results
Water flow rate L/min
Density g/cc
Ash (%) Mass of
sample (g) Sulfur % Cumulative
ash % Cumulative
sulfur % Mass yield % Sulfur
recovery %
20 1.46 ± 0.01 15.4 ± 1.8 9.8 ± 3.2 1.73 ± 0.09 15.4 ± 1.8 1.73 ± 0.1 3.0 ± 0.94 3.0 ± 0.47
40 1.53 ± 0.05 19.9 ± 0.47 59.5 ± 3.3 1.00 ± 0.02 19.3 ± 0.36 1.10 ± 0.01 18.0 ± 1.19 10.9 ± 2.12
60 1.79 ± 0.24 51.5 ± 2.09 50.6 ± 7.75 0.29 ± 0.04 32.7 ± 3.86 0.76 ± 0.87 15.3 ± 5.54 2.7 ± 0.9
80 2.46 ± 0.04 73.9 ± 5.28 71.9 ± 8.4 0.28 ± 0.05 48.2 ± 1.82 0.58 ± 0.7 21.7 ± 2.32 3.7 ± 0.6
100 2.61 ± 0.078 82.7 ± 0.95 49.9 ± 13.3 0.59 ± 0.04 55.2 ± 2.48 0.58 ± 0.01 15.1 ± 4.21 5.4 ± 1.69
underflow 2.97 ± 0.06 83.3 ± 2.9 88.8 ± 6.4 4.71 ± 0.55 62.7 ± 0.44 1.67 ± 0.2 26.8 ± 7.69 74.3 ± 4.83

143
20 L/min 40 L/min 60 L/min
Underflow100 L/min80 L/min
Figure D-1: Microscopic view of reflux classification runs performed on the Witbank tails
20 L/min 40 L/min 60 L/min
Underflow100 L/min80 L/min
Figure D-2: Microscopic view of reflux classification runs performed on the Waterberg tails

144
D.3. Characterization Test Results
D.3.1. Acid Base Accounting test results
Table D-11: Stream abbreviations
Legend Samples Sulfur content %
Waterberg Witbank
Process route 1
F Feed 1.2 3.6
1C Coal flotation concentrate 1.4 2.6
1T Coal flotation tailing 1.02 4.21
1T (+53 µm) Coal flotation deslimed tailing (+53 µm) 1.44 3.2
1T (-53 µm) Coal flotation deslimed tailing (-53 µm) 0.71 7.5
1T - OF RC tailing overflow 0.6 1.01
1T - UF RC tailing overflow 3.3 8.3
Process route 2
F Feed 2.04 4.18
F (+53 µm) Deslimed feed (+53 µm) 1.3 3.9
F (-53 µm) Deslimed feed (-53 µm) 4.1 5.6
F - UF RC deslimed feed underflow 2.0 8.7
F - OF RC deslimed feed overflow 1.01 1.05
2C RC deslimed feed overflow, coal flotation concentrate 1.03 0.9
2T RC deslimed feed overflow, coal flotation tailing 1.1 1.09
UCT two-stage process
F Feed 1.11 3.1
3C Coal flotation concentrate (same as C1) 1.28 2.16
3T Coal flotation tailing (same as 1T) 0.92 3.43
4C UCT two-stage: sulfide flotation concentrate 17.6 10.7
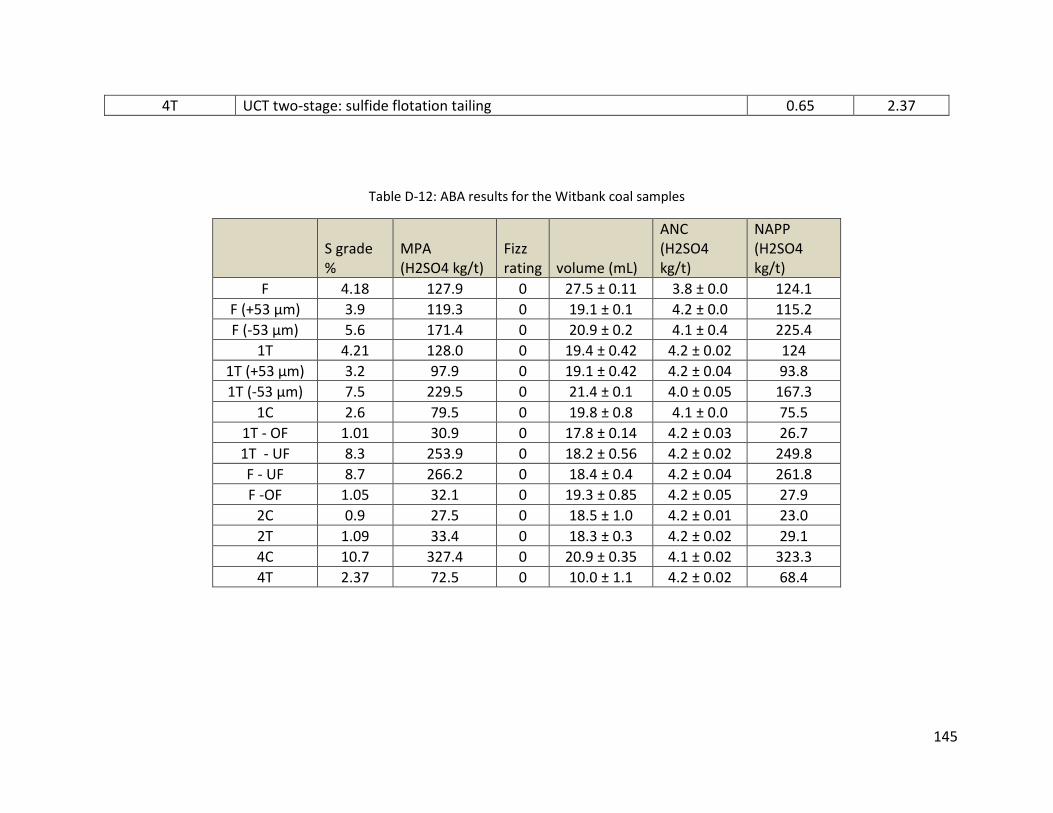
145
4T UCT two-stage: sulfide flotation tailing 0.65 2.37
Table D-12: ABA results for the Witbank coal samples
S grade %
MPA (H2SO4 kg/t)
Fizz rating volume (mL)
ANC (H2SO4 kg/t)
NAPP (H2SO4 kg/t)
F 4.18 127.9 0 27.5 ± 0.11 3.8 ± 0.0 124.1
F (+53 µm) 3.9 119.3 0 19.1 ± 0.1 4.2 ± 0.0 115.2
F (-53 µm) 5.6 171.4 0 20.9 ± 0.2 4.1 ± 0.4 225.4
1T 4.21 128.0 0 19.4 ± 0.42 4.2 ± 0.02 124
1T (+53 µm) 3.2 97.9 0 19.1 ± 0.42 4.2 ± 0.04 93.8
1T (-53 µm) 7.5 229.5 0 21.4 ± 0.1 4.0 ± 0.05 167.3
1C 2.6 79.5 0 19.8 ± 0.8 4.1 ± 0.0 75.5
1T - OF 1.01 30.9 0 17.8 ± 0.14 4.2 ± 0.03 26.7
1T - UF 8.3 253.9 0 18.2 ± 0.56 4.2 ± 0.02 249.8
F - UF 8.7 266.2 0 18.4 ± 0.4 4.2 ± 0.04 261.8
F -OF 1.05 32.1 0 19.3 ± 0.85 4.2 ± 0.05 27.9
2C 0.9 27.5 0 18.5 ± 1.0 4.2 ± 0.01 23.0
2T 1.09 33.4 0 18.3 ± 0.3 4.2 ± 0.02 29.1
4C 10.7 327.4 0 20.9 ± 0.35 4.1 ± 0.02 323.3
4T 2.37 72.5 0 10.0 ± 1.1 4.2 ± 0.02 68.4
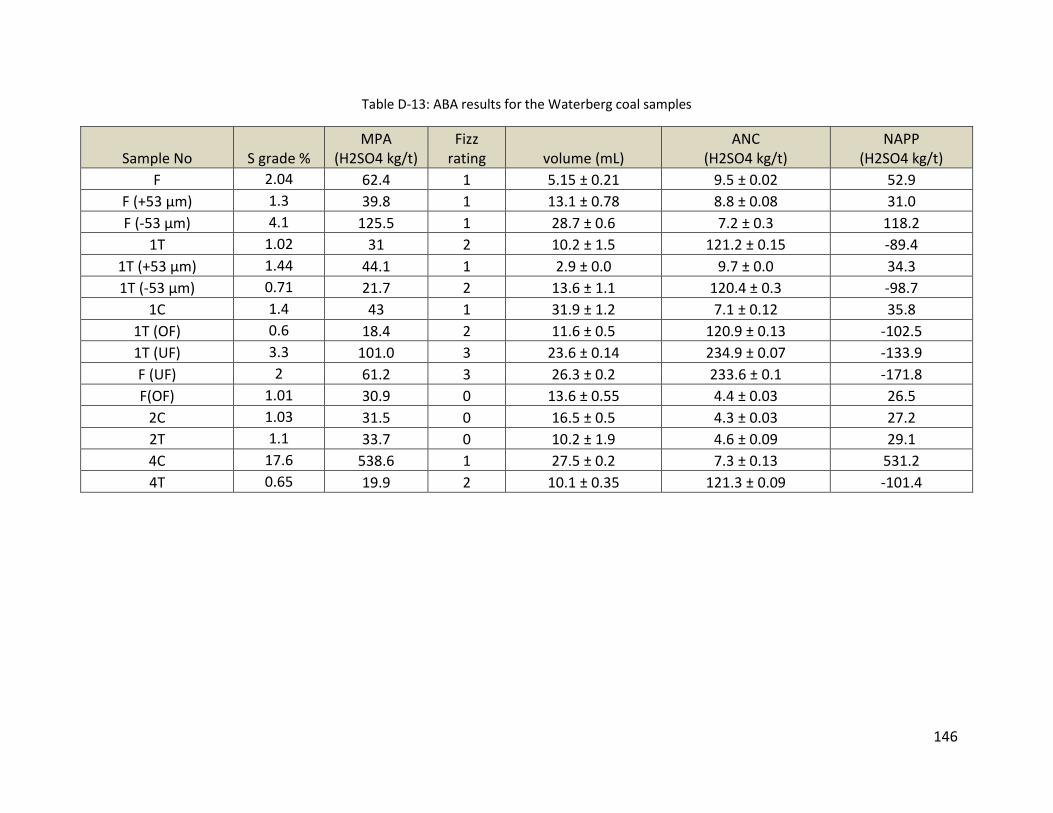
146
Table D-13: ABA results for the Waterberg coal samples
Sample No S grade % MPA
(H2SO4 kg/t) Fizz
rating volume (mL) ANC
(H2SO4 kg/t) NAPP
(H2SO4 kg/t)
F 2.04 62.4 1 5.15 ± 0.21 9.5 ± 0.02 52.9
F (+53 µm) 1.3 39.8 1 13.1 ± 0.78 8.8 ± 0.08 31.0
F (-53 µm) 4.1 125.5 1 28.7 ± 0.6 7.2 ± 0.3 118.2
1T 1.02 31 2 10.2 ± 1.5 121.2 ± 0.15 -89.4
1T (+53 µm) 1.44 44.1 1 2.9 ± 0.0 9.7 ± 0.0 34.3
1T (-53 µm) 0.71 21.7 2 13.6 ± 1.1 120.4 ± 0.3 -98.7
1C 1.4 43 1 31.9 ± 1.2 7.1 ± 0.12 35.8
1T (OF) 0.6 18.4 2 11.6 ± 0.5 120.9 ± 0.13 -102.5
1T (UF) 3.3 101.0 3 23.6 ± 0.14 234.9 ± 0.07 -133.9
F (UF) 2 61.2 3 26.3 ± 0.2 233.6 ± 0.1 -171.8
F(OF) 1.01 30.9 0 13.6 ± 0.55 4.4 ± 0.03 26.5
2C 1.03 31.5 0 16.5 ± 0.5 4.3 ± 0.03 27.2
2T 1.1 33.7 0 10.2 ± 1.9 4.6 ± 0.09 29.1
4C 17.6 538.6 1 27.5 ± 0.2 7.3 ± 0.13 531.2
4T 0.65 19.9 2 10.1 ± 0.35 121.3 ± 0.09 -101.4

147
D.3.2. Net Acid Generating test results
Table D-14: NAG test results for the Waterberg coal samples
Sample No S grade
% pH before
boil pH after boil NAG pH Volume to pH 4.5 mL
Volume to pH 7 mL NAG pH 4.5 NAG pH 7
F 2.04 5.19 ± 0.03 6.23 ± 0.08 6.48 ± 0.2 - 0.3 ± 0.0 - 0.59 ± 0.0
F(+53 µm) 1.3 5.24 ± 0.1 5.23 ± 0.04 5.25 ± 0.2 - 4.65 ± 1.0 - 9.11 ± 1.8
F(-53 µm) 4.1 5.13 ± 0.05 5.04 ± 0.1 5.33 ± 0.06 - 7.7 ± 0.5 - 15.1 ± 1.2
1C 1.44 5.39 ± 0.04 5.33 ± 0.03 5.55 ± 0.07 - 3.6 ± 0.4 - 7.06 ± 0.83
1T(+53 µm) 1.4 5.89 ± 0.04 6.14 ± 0.13 6.55 ± 0.06 - 0.5 ± 0.0 - 0.98 ± 0.0
1T(-53 µm) 0.71 5.01 ± 0.08 5.1 ± 0.1 5.3 ± 0.2 - 6 ± 0.4 - 11.76 ± 1.1
1T 1.02 5.05 ± 0.0 4.94 ± 0.13 5.25 ± 0.06 - 6.15 ± 1.8 - 12.05 ± 3.5
IT - OF 0.6 5.74 ± 0.1 5.39 ± 0.01 5.6 ± 0.02 - 6.6 ± 1.4 - 12.94 ± 2.8
1T - UF 3.3 6.47 ± 0.01 6.54 ± 0.05 7.19 ± 0.03 -
- -
F - UF 2 6.73 ± 0.04 7.1 ± 0.04 7.09 ± 0.32 - - - -
F- OF
1.01 Stage 1 Stage 2
4.73 ± 0.0 4.37±0.23
4.24 ± 0.11 3.99±0.64
4.23 ± 0.06 4.57±0.56
0.95 ± 0.35 -
11.95 ± 2.6 11.05±1.06
4.60 ± 3.2 -
23.42 ± 4.1 21.66±2.07
2C 1.03 5.15 ± 0.07 4.84 ± 0.12 5.2 ± 0.04
7.45 ± 1.34
73.01 ± 3.8
2T 1.1 4.5 ± 0.1 3.8 ± 0.22 3.93 ± 0.1 2.9 ± 1.0 13.65 ± 1.5 5.68 ± 1.94 26.75 ± 2.9
4C 17.6 2.17 ± 0.12 2.14 ± 0.1 2.18 ± 0.01 60.95 ± 2.1 11.15 ± 1.0 119.5 ± 3.4 21.85 ± 1.8
4T 0.65 5.445 ± 0.01 6.14 ± 0.03 6.26 ± 0.13 - 0.25 ± 0.07 - 0.49 ± 0.14

148
Table D-15: Sequential NAG test results for Waterberg 2T
Stage no pH before boil pH after boil NAG pH Volume to pH 4.5 mL Volume to pH 7 mL NAG pH 4.5 NAG pH 7
2 3.67 ± 0.18 3.38±0.1 3.48 ±0.04 3.50 ± 0.42 11.90 ± 0.0 6.86 ± 0.83 23.32 ± 0.0
3 4.35 ± 0.07 3.96 ± 0.3 4.21 ± 0.5 0.70 ± 1.0 8.75 ± 1.6 1.37 ± 1.7 17.15 ± 0.9
4 4.48 ± 0.1 4.08 ± 0.2 4.27 ± 0.4 0.40 ± 0.8 10.10 ± 1.3 0.78 ± 0.8 19.80 ± 1.5
5 4.56 ± 0.3 4.15 ± 0.4 4.52 ± 0.7 0.00 11.90 ± 1.5 0.00 23.32 ± 1.2
Table D-16: Sequential NAG test results for Waterberg 4C
Stage no pH before boil pH after boil NAG pH Volume to pH 4.5 mL Volume to pH 7 mL NAG pH 4.5 NAG pH 7
2 2.20 ± 0.17 2.16 ± 0.04 2.23 ± 0.0 34.10 ± 0.42 7.40 ± 0.0 66.84 ± 0.84 14.50 ± 0.0
3 3.10 ± 0.1 2.69 ± 0.7 2.84 ±0.9 5.70 ± 1.3 9.50 ± 1.1 11.17 ± 0.9 18.62 ± 2.1
4 3.80 ± 0.2 3.40 ± 0.6 3.50 ± 1.1 2.10 ± 1.4 9.20 ± 1.2 4.12 ± 0.7 18.03 ±1.5
5 4.05 ± 0.5 3.80 ± 0.9 3.60 ± 0.8 2.00 ± 0.9 10.90 ± 1.5 3.92 ± 2.5 21.36 ± 2.6
6 4.35 ± 0.7 4.25 ± 0.5 4.30 ± 0.08 0.30 ± 1.9 9.80 ± 2.2 0.59 ± 1.5 19.21 ± 1.1
7 4.62 ± 0.02 4.48 ± 0.1 4.52 ± 0.6 0.00 9.20 ± 1.0 0.00 18.03 ±1.4
Table D-17: Sequential NAG test results for Witbank Feed (F)
Stage no pH before boil pH after
boil NAG pH Volume to pH 4.5 mL Volume to pH 7
mL NAG pH 4.5 NAG pH 7
1 2.19 ± 0.04 2.26± 0.05 2.29± 0.08 32.8± 0.3 5.2± 0.2 64.29± 1.02 10.2± 2.8
2 2.65 ± 0.07 2.44 ± 0.06 2.57 ± 0.5 8.20 ± 0.7 11.00 ± 0.3 16.07 ± 1.8 21.56 ± 2.2
3 3.60 ± 0.02 3.04 ± 0.1 3.25 ± 0.01 3.50 ± 0.1 9.40 ± 0.7 6.86 ± 1.1 18.42 ± 1.2
4 3.75 ± 0.01 3.72 ± 0.8 3.85 ± 0.2 1.40 ± 0.06 8.80 ± 1.1 2.74 ±0.5 17.25 ± 1.0
5 3.97 ± 0.1 3.40 ± 0.3 3.62 ± 0.3 2.00 ± 0.2 9.40 ± 1.0 3.92 ± 1.3 18.42 ± 1.4
6 4.20 ± 0.11 3.80 ± 0.06 3.91 ± 0.6 0.30 ± 1.4 9.50 ± 2.1 0.59 ± 1.6 18.62 ± 2.5
7 4.60 ± 0.05 4.21 ± 0.8 4.53 ± 0.07 0.00 9.60 ± 2.2 0.00 18.82 ± 2.9

149
Table D-18: Sequential NAG test results for Witbank feed +53 µm
Stage no pH before
boil pH after
boil NAG pH Volume to pH 4.5 mL
Volume to pH 7 mL NAG pH 4.5 NAG pH 7
1 2.17 ± 0.03 2.17 ± 0.02 2.15 ± 0.01 35.9 ± 0.4 4.4 ± 0.71 70.36 ± 0.83 8.6 ± 1.4
2 2.84 ± 0.27 2.64 ± 0.37 2.73 ± 0.34 6.65 ± 1.17 11.20 ± 0.14 13.03 ±3.16 21.95 ± 0.27
3 3.36 ± 0.04 2.77 ± 0.1 2.95 ± 0.2 4.90 ± 0.5 10.00 ± 0.1 9.60 ± 1.2 19.60 ± 2.4
4 3.50 ± 0.32 2.97 ± 0.03 3.10 ± 0.22 3.70 ± 1.2 10.60 ± 0.3 7.25 ± 2.2 20.78 ± 1.6
5 3.72 ± 0.2 3.09 ± 0.05 3.21 ± 0.1 3.30 ± 0.8 12.00 ± 0.9 6.47 ± 1.1 23.52 ± 1.7
6 3.90 ± 0.1 3.40 ± 0.11 3.81 ± 0.15 2.00 ± 0.9 11.00 ±1.5 3.92 ± 1.5 21.56 ± 2.1
7 4.30 ± 0.06 4.10 ± 0.14 4.22 ± 0.28 0.35 ±1.2 10.00 ± 1.1 0.69 ± 1.2 19.60 ± 2.2
8 4.70 ± 0.1 4.20 ± 0.04 4.58 ± 0.07 0.00 10.50 ± 1.0 0.00 20.58 ±2.0
Table D-19: Sequential NAG test results for Witbank feed -53 µm
Stage no pH before
boil pH after
boil NAG pH Volume to pH 4.5 mL
Volume to pH 7 mL NAG pH 4.5 NAG pH 7
1 1.96 ± 0.01 2.0 ± 0.02 2.04 ± 0.05 21.9 ± 0.03 9.1 ± 0.8 42.9 ± 0.1 17.8 ± 1.3
2 2.41 ± 0.3 2.35 ± 0.3 2.31 ± 0.2 8.3 ± 0.5 12.1 ± 0.09 16.3 ± 1.5 23.7 ± 0.7
3 3.51 ± 0.05 3.44 ± 0.01 3.4 ± 0.2 3 ± 1.1 10.4 ± 0.1 5.88 ± 0.9 20.4 ± 1.1
4 4.72 ± 0.1 4.6 ± 0.05 4.55 ± 0.15 0.00 9.3 ± 0.2 0.00 18.2 ± 0.8

150
Table D-20: Sequential NAG test results for Witbank tails (1T)
Stage no pH before
boil pH after
boil NAG pH Volume to pH 4.5 mL
Volume to pH 7 mL NAG pH 4.5 NAG pH 7
1 2.25 ± 0.11 2.19 ± 0.11 2.13 ± 0.03 36.7 ± 0.42 4.55 ± 0.21 71.93 ± 0.83 8.92 ± 0.4
2 2.93 ± 0.22 2.76 ± 0.31 2.80 ± 0.35 5.95 ± 3.9 12.20 ± 0.56 11.66 ± 7.6 23.91 ± 1.1
3 3.50 ± 0.23 3.00 ± 0.1 3.22 ± 0.02 3.50 ± 0.77 10.40 ± 0.22 6.86 ± 1.0 20.38 ± 0.6
4 3.64 ± 0.1 3.15 ± 0.08 3.39 ± 0.11 2.70 ± 1.1 9.60 ± 0.15 5.29 ± 1.8 18.82 ± 0.5
5 4.04 ± 0.15 3.46 ± 0.14 3.73 ± 0.12 1.00 ± 2.5 10.90 ± 0.73 1.96 ± 3.1 21.36 ± 1.5
6 4.55 ± 0.31 4.32 ± 0.1 4.61 ± 0.5 0.00 9.60 ± 0.8 0.00 18.82 ± 1.4
Table D-21: Sequential NAG test results for Witbank tails +53 µm
Stage no pH before
boil pH after
boil NAG pH Volume to pH
4.5 mL Volume to pH
7 mL NAG pH 4.5 NAG pH 7
1 2.19 ± 0.07 2.13 ± 0.07 2.12 ± 0.01 43.1 ± 1.1 10.45 ± 3.1 84.48 ± 2.2 20.5 ± 3.9
2 2.47 ± 0.16 2.39 ± 0.2 2.43 ± 0.18 8.55 ± 3.2 11.40 ± 1.0 16.76 ± 3.8 22.34 ± 2.0
3 2.36 ± 0.02 2.28 ± 0.04 2.30 ± 0.6 10.80 ± 2.1 10.70 ± 1.3 21.17 ± 2.7 20.97 ± 2.2
4 3.48 ± 0.1 2.97 ± 0.3 3.11 ± 0.7 3.80 ± 0.9 9.40 ± 2.0 7.45 ± 1.5 18.42 ± 2.5
5 3.81 ± 0.2 3.33 ± 0.9 3.59 ± 1.0 2.10 ± 1.2 8.30 ± 0.9 4.12 ± 1.7 16.27 ± 1.4
6 4.08 ± 0.3 3.55 ± 0.4 3.81 ± 0.5 1.30 ± 0.7 11.80 ± 1.1 2.55 ± 1.2 23.13 ± 1.2
7 4.55 ± 0.03 4.34 ± 0.08 4.68 ± 0.3 0.00 10.50 ± 1.3 0.00 20.58 ± 2.1
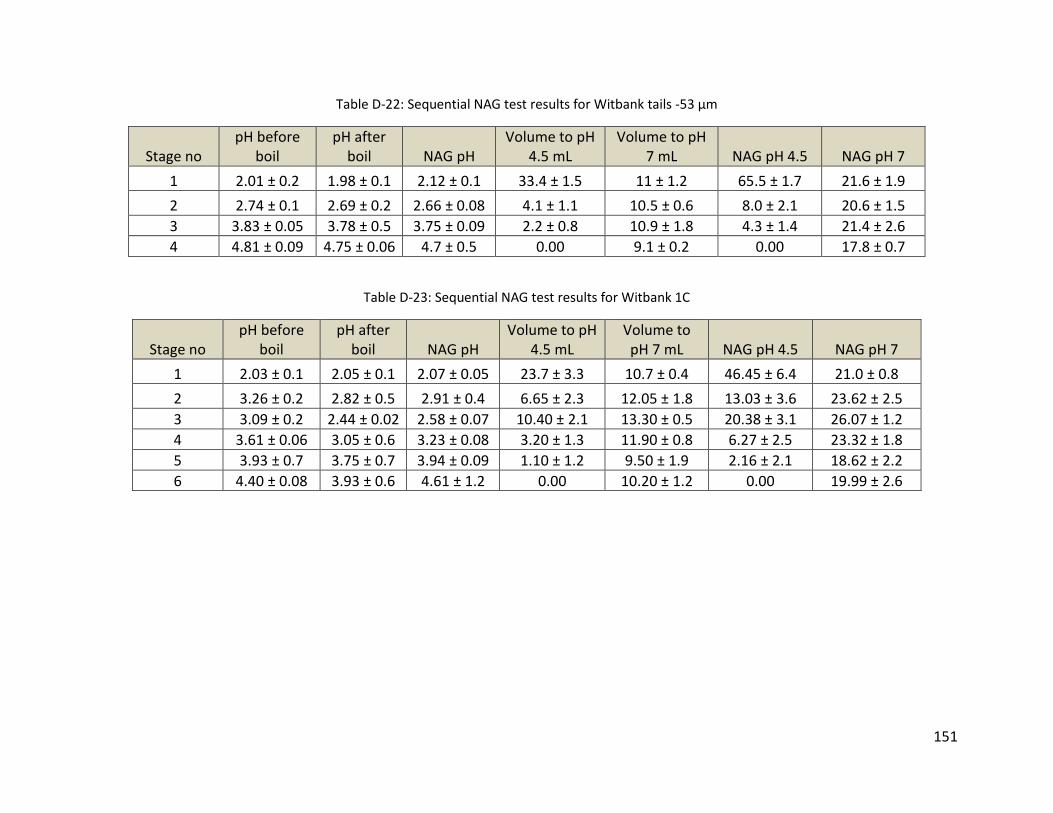
151
Table D-22: Sequential NAG test results for Witbank tails -53 µm
Stage no pH before
boil pH after
boil NAG pH Volume to pH
4.5 mL Volume to pH
7 mL NAG pH 4.5 NAG pH 7
1 2.01 ± 0.2 1.98 ± 0.1 2.12 ± 0.1 33.4 ± 1.5 11 ± 1.2 65.5 ± 1.7 21.6 ± 1.9
2 2.74 ± 0.1 2.69 ± 0.2 2.66 ± 0.08 4.1 ± 1.1 10.5 ± 0.6 8.0 ± 2.1 20.6 ± 1.5
3 3.83 ± 0.05 3.78 ± 0.5 3.75 ± 0.09 2.2 ± 0.8 10.9 ± 1.8 4.3 ± 1.4 21.4 ± 2.6
4 4.81 ± 0.09 4.75 ± 0.06 4.7 ± 0.5 0.00 9.1 ± 0.2 0.00 17.8 ± 0.7
Table D-23: Sequential NAG test results for Witbank 1C
Stage no pH before
boil pH after
boil NAG pH Volume to pH
4.5 mL Volume to pH 7 mL NAG pH 4.5 NAG pH 7
1 2.03 ± 0.1 2.05 ± 0.1 2.07 ± 0.05 23.7 ± 3.3 10.7 ± 0.4 46.45 ± 6.4 21.0 ± 0.8
2 3.26 ± 0.2 2.82 ± 0.5 2.91 ± 0.4 6.65 ± 2.3 12.05 ± 1.8 13.03 ± 3.6 23.62 ± 2.5
3 3.09 ± 0.2 2.44 ± 0.02 2.58 ± 0.07 10.40 ± 2.1 13.30 ± 0.5 20.38 ± 3.1 26.07 ± 1.2
4 3.61 ± 0.06 3.05 ± 0.6 3.23 ± 0.08 3.20 ± 1.3 11.90 ± 0.8 6.27 ± 2.5 23.32 ± 1.8
5 3.93 ± 0.7 3.75 ± 0.7 3.94 ± 0.09 1.10 ± 1.2 9.50 ± 1.9 2.16 ± 2.1 18.62 ± 2.2
6 4.40 ± 0.08 3.93 ± 0.6 4.61 ± 1.2 0.00 10.20 ± 1.2 0.00 19.99 ± 2.6

152
Table D-24: Sequential NAG test results for Witbank 1T-OF
Stage no pH before
boil pH after
boil NAG pH Volume to pH
4.5 mL Volume to pH 7 mL NAG pH 4.5 NAG pH 7
1 2.41 ± 0.078 2.25 ± 0.08 2.35 ± 0.04 13.8 ± 2.4 12.8 ± 1.4 27.05 ± 4.7 25.1 ± 2.8
2 3.77 ± 0.43 3.32 ± 0.08 3.45 ± 0.21 2.15 ± 0.07 12.00 ± 1.13 4.21 ± 0.13 23.52 ± 2.2
3 4.22 ± 0.08 3.60 ± 0.06 3.77 ± 0.04 1.30 ± 0.5 9.40 ± 0.07 2.55 ± 1.3 18.42 ± 1.2
4 4.32 ± 0.1 3.92 ± 0.01 4.26 ± 0.14 0.50 ± 0.2 9.40 ± 0.06 0.98 ± 0.9 18.42 ±1.0
5 4.51 ± 0.12 4.12 ± 0.1 4.53 ± 0.2 0.00 8.40 ± 0.1 0.00 16.46 ± 0.7
Table D-25: Sequential NAG test results for Witbank 1T-UF
Stage no pH before
boil pH after
boil NAG pH Volume to pH 4.5
mL Volume to
pH 7 mL NAG pH 4.5 NAG pH 7
1 2.09 ± 0.04 2.01 ± 0.04 2.1 ± 0.06 68.45 ± 0.8 7.55 ± 1.1 134.16 ± 1.5 14.8 ± 2.1
2 2.07 ± 0.01 2.11 ± 0.1 2.16 ± 0.1 16.35 ± 0.1 6.75 ± 2.1 32.05 ± 0.13 13.23 ± 2.8
3 2.01 ± 0.02 1.97 ± 0.05 2.02 ± 0.7 18.40 ± 0.8 5.50 ± 0.5 36.06 ± 1.2 10.78 ± 1.7
4 3.77 ± 0.05 3.08 ± 0.8 3.23 ± 0.9 2.90 ± 0.7 10.60 ± 1.2 5.68 ± 1.3 20.78 ± 2.5
5 4.33 ± 0.03 3.73 ± 0.06 3.95 ± 0.02 0.90 ± 0.5 10.50 ± 2.2 1.76 ± 1.0 20.58 ± 2.7
6 4.40 ± 0.7 3.81 ± 0.1 4.10 ± 0.05 0.80 ± 0.7 9.30 ± 1.9 1.57 ± 2.1 18.23 ± 2.2
7 4.63 ±0.07 4.41 ± 0.3 4.53 ± 0.2 0.00 9.40 ± 1.1 0.00 18.42 ± 1.6

153
Table D-26: Sequential NAG test results for Witbank F - UF
Stage no pH before
boil pH after
boil NAG pH Volume to pH 4.5
mL Volume to
pH 7 mL NAG pH 4.5 NAG pH 7
1 2.1 ± 0.06 2.05 ± 0.06 2.26 ± 0.05 49.3 ± 3.1 5.15 ± 1.34 96.63 ± 3.5 10.1 ± 2.6
2 2.16 ± 0.21 2.08 ±0.16 2.17 ±0.21 14.30 ±1.7 7.10 ±2.3 28.03 ± 2.4 13.92 ± 3.4
3 3.77 ± 0.07 3.08 ± 0.08 3.23 ± 1.1 2.90 ± 1.5 10.60 ± 2.2 5.68 ± 1.9 20.78 ± 2.4
4 4.33 ± 0.08 3.73 ± 0.1 3.95 ± 0.9 0.90 ± 1.5 10.50 ± 1.4 1.76 ± 1.6 20.58 ± 2.6
5 4.40 ± 0.1 3.81 ± 0.3 4.10 ± 0.8 0.80 ± 2.1 9.30 ± 2.5 1.57 ± 2.7 18.23 ± 3.2
6 4.63 ± 0.15 4.41 ± 0.2 4.53 ±1.2 0.00 9.40 ± 1.8 0.00 18.42 ± 1.9
Table D-27: Sequential NAG test results for Witbank F - OF
Stage no pH before
boil pH after
boil NAG pH Volume to pH
4.5 mL Volume to pH
7 mL NAG pH 4.5 NAG pH 7
1 2.43 ± 0.11 2.29 ± 0.11 2.46 ± 0.06 13.1 ± 3.8 12.8 ± 1.56 25.68 ± 3.4 25.09 ± 3.04
2 3.60 ± 0.35 3.14 ± 0.01 3.27 ± 0.06 2.98 ± 0.38 11.40 ±1.13 5.83 ± 0.76 22.34 ±2.2
3 3.96 ± 0.2 3.28 ± 0.04 3.45 ± 0.7 2.20 ± 1.3 9.80 ± 1.2 4.31 ± 2.2 19.21 ± 1.1
4 4.17 ± 0.5 3.66 ± 0.6 3.89 ± 0.8 1.00 ± 2.8 9.60 ± 1.5 1.96 ± 1.8 18.82 ± 1.9
5 4.41 ± 0.4 3.83 ± 0.3 4.06 ± 0.5 0.70 ± 1.7 11.40 ± 0.8 1.37 ± 2.1 22.34 ± 2.5
6 4.69 ± 0.2 4.43 ± 0.1 4.58 ± 0.6 0.00 10.50 ± 1.3 0.00 20.58 ± 2.0

154
Table D-28: Sequential NAG test results for Witbank 2C
Stage no pH before
boil pH after
boil NAG pH Volume to pH
4.5 mL Volume to
pH 7 mL NAG pH 4.5 NAG pH 7
1 2.55 ± 0.1 2.4 ± 0.1 2.53 ± 0.02 10.95 ± 2.75 12.75 ± 1.2 21.5 ± 4.4 25.0 ± 2.4
2 3.51 ± 0.28 3.19 ± 0.02 3.35 ± 0.01 2.35 ± 0.21 10.75 ± 0.35 4.61 ± 0.42 21.07 ± 0.7
3 3.70 ± 0.31 3.20 ± 0.03 3.34 ± 0.04 2.50 ± 1.5 11.00 ± 1.7 4.90 ± 2.5 21.56 ± 2.2
4 4.08 ± 0.11 3.23 ± 0.4 3.43 ± 0.07 2.40 ± 1.7 10.60 ± 2.5 4.70 ± 1.6 20.78 ± 3.7
5 4.26 ± 0.13 3.82 ± 0.66 4.11 ± 0.6 1.20 ± 2.1 10.10 ± 1.9 2.35 ± 2.8 19.80 ± 2.8
6 4.54 ± 0.06 4.28 ±0.7 4.58 ± 0.5 0.00 8.10 ± 2.2 0.00 15.88 ± 2.6
Table D-29: Sequential NAG test results for Witbank 2T
Stage no pH before
boil pH after
boil NAG pH Volume to pH
4.5 mL Volume to pH 7 mL NAG pH 4.5 NAG pH 7
1 2.5 ± 0.07 2.36 ± 0.07 2.53 ± 0.01 11.8 ± 3.8 13.2 ± 1.56 23.13 ± 4.2 25.87 ± 3.04
2 3.67 ± 0.43 3.30 ±0.08 3.42 ± 0.16 2.40 ± 0.14 11.70 ±1.7 4.70 ± 0.28 22.93 ± 2.27
3 4.20 ± 0.01 2.64 ± 0.1 2.80 ± 0.16 6.90 ± 0.2 11.00 ± 1.6 13.52 ± 1.1 21.56 ± 2.2
4 4.21 ± 0.1 3.76 ± 0.2 3.87 ± 0.22 1.10 ± 0.4 9.90 ± 0.9 2.16 ± 1.8 19.40 ± 2.4
5 4.52 ± 0.24 4.38 ± 0.35 4.75 ± 0.4 0.00 7.10 ± 1.5 0.00 13.92 ± 2.8

155
Table D-30: Sequential NAG test results for Witbank 4C
Stage no pH before
boil pH after
boil NAG pH Volume to pH
4.5 mL Volume to pH 7 mL NAG pH 4.5 NAG pH 7
1 1.89 ± 0.07 1.83 ± 0.01 1.93 ± 0.08 20.7 ± 0.84 2.85 ± 0.92 202.86 ± 3.1 27.93 ± 3.00
2 1.97±0.01 1.95±0.0 2.03±0.02 29.50±1.0 9.55±1.2 57.82 ± 1.9 18.72 ± 2.4
3 3.20 ± 0.02 2.58 ± 0.05 2.70 ± 0.05 7.10 ± 0.1 12.00 ± 0.7 13.92 ± 1.0 23.52 ± 2.5
4 3.45 ± 0.05 2.92 ± 0.1 3.10 ± 0.07 4.20 ± 0.2 11.20 ± 0.95 8.23 ± 1.1 21.95 ± 2.8
5 3.82 ± 0.02 3.30 ± 0.11 3.68 ± 0.3 2.10 ± 0.5 9.20 ± 1.3 4.12 ± 2.2 18.03 ± 3.1
6 4.05 ± 0.06 4.00 ± 0.02 3.93 ± 0.15 1.00 ± 0.35 9.80 ± 1.5 1.96 ± 1.8 19.21 ± 3.5
7 4.60 ± 0.1 4.41 ± 0.06 4.57 ± 0.21 0.00 10.00 ± 1.1 0.00 19.60 ± 2.5
Table D-31: Sequential NAG test results for Witbank 4T
Stage no pH before
boil pH after
boil NAG pH Volume to pH 4.5
mL Volume to
pH 7 mL NAG pH 4.5 NAG pH 7
1 2 ± 0.06 2.03 ± 0.06 2.15 ± 0.05 28.1 ± 0.14 8.9 ± 1.56 55.08 ± 0.27 17.44 ± 3.05
2 3.69 ± 0.02 3.26 ±0.24 3.35 ±0.22 2.70 ± 1.13 11.35 ± 1.5 5.29 ± 2.2 22.25 ± 2.9
3 3.76 ± 0.03 2.53 ± 0.07 2.64 ± 0.1 7.80 ± 0.3 11.30 ± 0.75 15.29 ± 1.0 22.15 ± 2.5
4 4.00 ± 0.07 3.63 ± 0.11 3.85 ± 0.2 1.30 ± 0.8 8.90 ± 1.1 2.55 ± 1.2 17.44 ± 3.2
5 4.25 ± 0.021 3.65 ± 0.15 4.05 ± 0.22 1.00 ± 0.54 9.00 ± 0.6 1.96 ± 0.95 17.64 ± 1.5
6 4.60 ± 0.05 4.40 ± 0.32 4.55 ±0.4 0.00 9.00 ± 0.8 0.00 17.64 ± 1.2