combined x- and l-band psi analyses for assessment of land ... · java which shares boundaries with...
TRANSCRIPT
Combined X- and L-band PSI analyses for assessment of land subsidence in Jakarta
Fifamè N. Koudogbo*a, Javier Duroa, Alain Arnauda, Philippe Ballyb, Hasanuddin Z. Abidinc, Heri Andreasc
a ALTAMIRA INFORMATION, C/ Còrsega, 381-387, E-08037 Barcelona b European Space Agency, Via Galileo Galilei snc, I-00044 Frascati (Roma)
c Geodesy Research Division, Institute of Technology Bandung, Jl. Ganesha 10, Bandung, Indonesia
ABSTRACT
Jakarta is the capital of Indonesia and is home to approximately 10 million people on the coast of the Java Sea. The subsidence due to groundwater extraction, increased development, natural consolidation of soil and tectonics in Jakarta has been known since the early part of the 20th century. Evidence of land subsidence exists through monitoring with GPS, level surveys and preliminary InSAR investigations [1].
World Bank studies conservatively estimate land subsidence in Jakarta occurring at an average rate of 5 cm per year, and in some areas, over 1 meter was already observed. Recent studies of land subsidence found that while typical subsidence rates were 7.5-10 cm a year, in localized areas of North Jakarta subsidence in the range 15-25 cm a year was occurring, which if sustained, would result in them sinking to 4 to 5 meters below sea level by 2025. Land subsidence will require major interventions, including increased pumping, dikes and most likely introducing major infrastructure investment for sea defence [1].
With the increasing prevalence of Earth Observation (EO), the World Bank and the European Space Agency (ESA) have set up a partnership that aims at highlighting the potential of EO information to support the monitoring and management of World Bank projects. It in this framework that was defined the EOWorld projects [2]. Altamira Information, company specialized in ground motion monitoring, has managed one of those projects, focusing on the assessment of land subsidence in Jakarta.
Keywords: Jakarta, Flooding, Land subsidence, SAR interferometry, Stable Point Network
1. INTRODUCTION
1.1 Geographic location of the area of interest
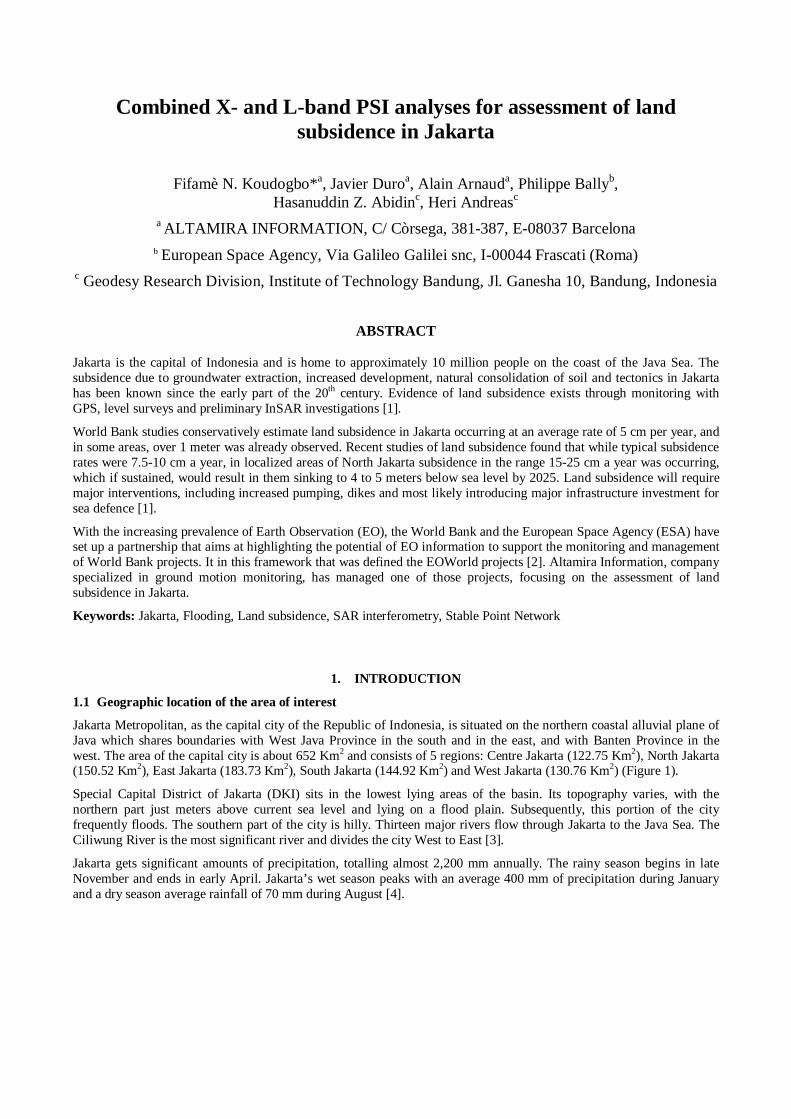
Jakarta Metropolitan, as the capital city of the Republic of Indonesia, is situated on the northern coastal alluvial plane of Java which shares boundaries with West Java Province in the south and in the east, and with Banten Province in the west. The area of the capital city is about 652 Km2 and consists of 5 regions: Centre Jakarta (122.75 Km2), North Jakarta (150.52 Km2), East Jakarta (183.73 Km2), South Jakarta (144.92 Km2) and West Jakarta (130.76 Km2) (Figure 1).
Special Capital District of Jakarta (DKI) sits in the lowest lying areas of the basin. Its topography varies, with the northern part just meters above current sea level and lying on a flood plain. Subsequently, this portion of the city frequently floods. The southern part of the city is hilly. Thirteen major rivers flow through Jakarta to the Java Sea. The Ciliwung River is the most significant river and divides the city West to East [3].
Jakarta gets significant amounts of precipitation, totalling almost 2,200 mm annually. The rainy season begins in late November and ends in early April. Jakarta’s wet season peaks with an average 400 mm of precipitation during January and a dry season average rainfall of 70 mm during August [4].
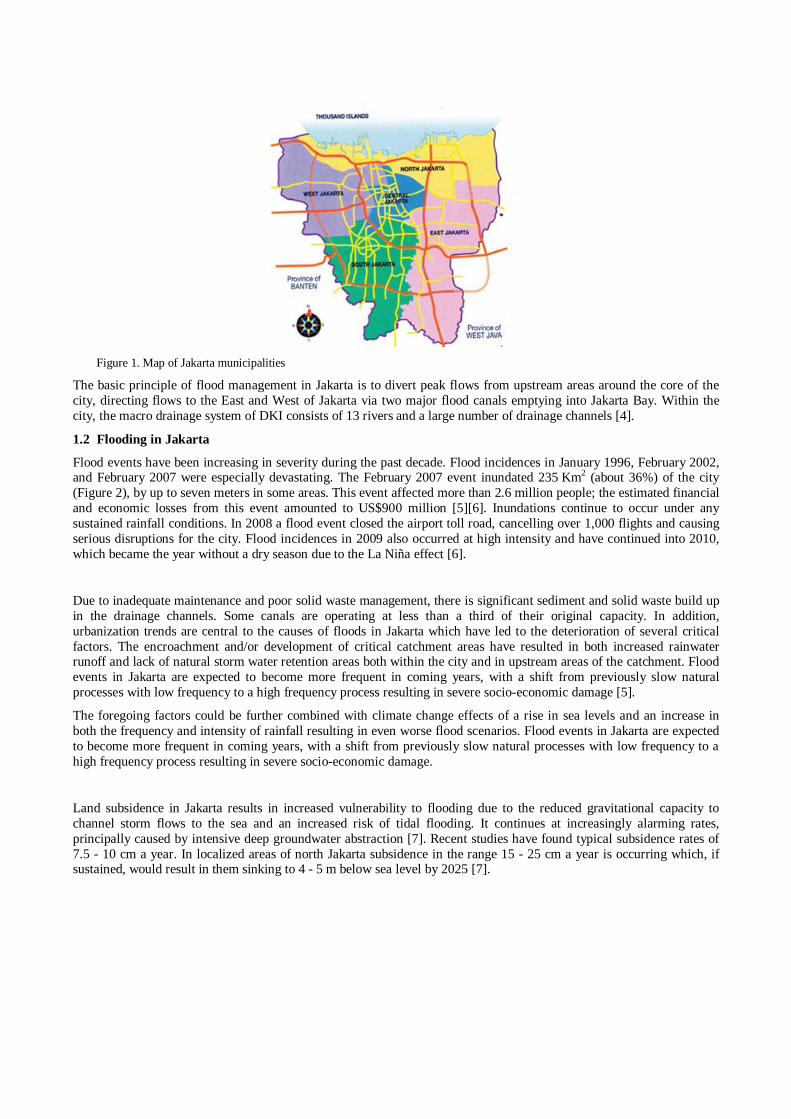
Figure 1. Map of Jakarta municipalities
The basic principle of flood management in Jakarta is to divert peak flows from upstream areas around the core of the city, directing flows to the East and West of Jakarta via two major flood canals emptying into Jakarta Bay. Within the city, the macro drainage system of DKI consists of 13 rivers and a large number of drainage channels [4].
1.2 Flooding in Jakarta
Flood events have been increasing in severity during the past decade. Flood incidences in January 1996, February 2002, and February 2007 were especially devastating. The February 2007 event inundated 235 Km2 (about 36%) of the city (Figure 2), by up to seven meters in some areas. This event affected more than 2.6 million people; the estimated financial and economic losses from this event amounted to US$900 million [5][6]. Inundations continue to occur under any sustained rainfall conditions. In 2008 a flood event closed the airport toll road, cancelling over 1,000 flights and causing serious disruptions for the city. Flood incidences in 2009 also occurred at high intensity and have continued into 2010, which became the year without a dry season due to the La Niña effect [6].
Due to inadequate maintenance and poor solid waste management, there is significant sediment and solid waste build up in the drainage channels. Some canals are operating at less than a third of their original capacity. In addition, urbanization trends are central to the causes of floods in Jakarta which have led to the deterioration of several critical factors. The encroachment and/or development of critical catchment areas have resulted in both increased rainwater runoff and lack of natural storm water retention areas both within the city and in upstream areas of the catchment. Flood events in Jakarta are expected to become more frequent in coming years, with a shift from previously slow natural processes with low frequency to a high frequency process resulting in severe socio-economic damage [5].
The foregoing factors could be further combined with climate change effects of a rise in sea levels and an increase in both the frequency and intensity of rainfall resulting in even worse flood scenarios. Flood events in Jakarta are expected to become more frequent in coming years, with a shift from previously slow natural processes with low frequency to a high frequency process resulting in severe socio-economic damage.
Land subsidence in Jakarta results in increased vulnerability to flooding due to the reduced gravitational capacity to channel storm flows to the sea and an increased risk of tidal flooding. It continues at increasingly alarming rates, principally caused by intensive deep groundwater abstraction [7]. Recent studies have found typical subsidence rates of 7.5 - 10 cm a year. In localized areas of north Jakarta subsidence in the range 15 - 25 cm a year is occurring which, if sustained, would result in them sinking to 4 - 5 m below sea level by 2025 [7].
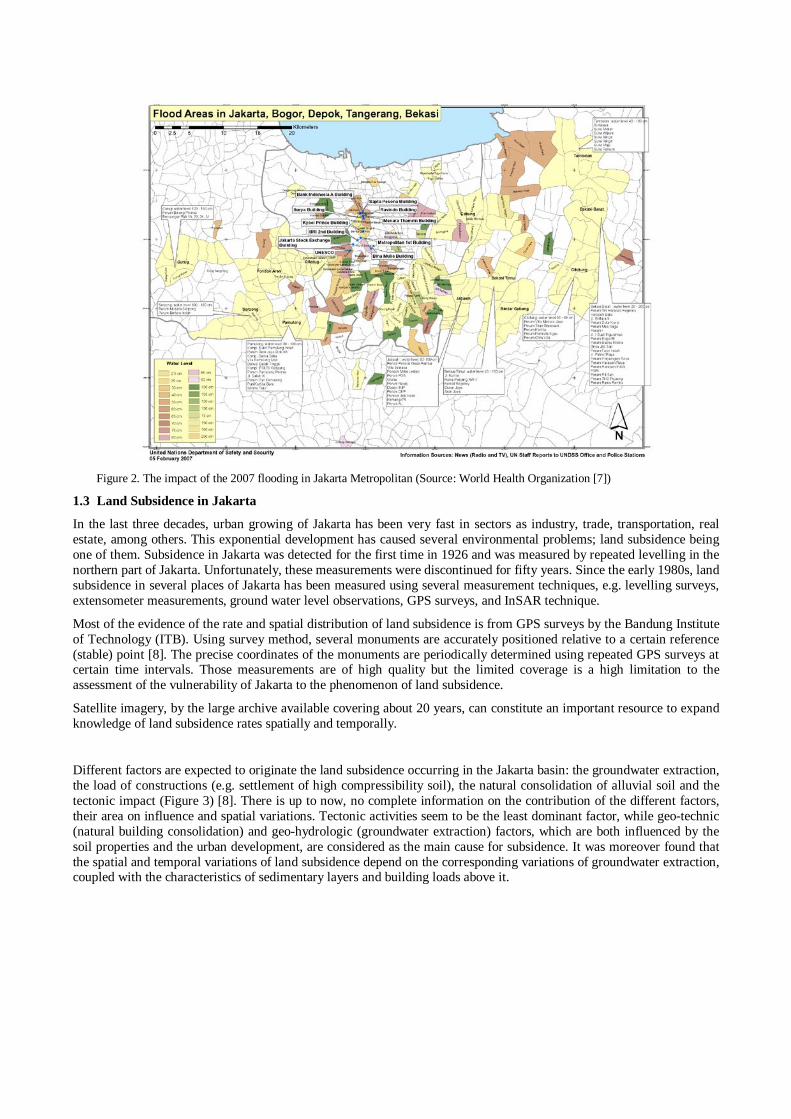
Figure 2. The impact of the 2007 flooding in Jakarta Metropolitan (Source: World Health Organization [7])
1.3 Land Subsidence in Jakarta
In the last three decades, urban growing of Jakarta has been very fast in sectors as industry, trade, transportation, real estate, among others. This exponential development has caused several environmental problems; land subsidence being one of them. Subsidence in Jakarta was detected for the first time in 1926 and was measured by repeated levelling in the northern part of Jakarta. Unfortunately, these measurements were discontinued for fifty years. Since the early 1980s, land subsidence in several places of Jakarta has been measured using several measurement techniques, e.g. levelling surveys, extensometer measurements, ground water level observations, GPS surveys, and InSAR technique.
Most of the evidence of the rate and spatial distribution of land subsidence is from GPS surveys by the Bandung Institute of Technology (ITB). Using survey method, several monuments are accurately positioned relative to a certain reference (stable) point [8]. The precise coordinates of the monuments are periodically determined using repeated GPS surveys at certain time intervals. Those measurements are of high quality but the limited coverage is a high limitation to the assessment of the vulnerability of Jakarta to the phenomenon of land subsidence.
Satellite imagery, by the large archive available covering about 20 years, can constitute an important resource to expand knowledge of land subsidence rates spatially and temporally.
Different factors are expected to originate the land subsidence occurring in the Jakarta basin: the groundwater extraction, the load of constructions (e.g. settlement of high compressibility soil), the natural consolidation of alluvial soil and the tectonic impact (Figure 3) [8]. There is up to now, no complete information on the contribution of the different factors, their area on influence and spatial variations. Tectonic activities seem to be the least dominant factor, while geo-technic (natural building consolidation) and geo-hydrologic (groundwater extraction) factors, which are both influenced by the soil properties and the urban development, are considered as the main cause for subsidence. It was moreover found that the spatial and temporal variations of land subsidence depend on the corresponding variations of groundwater extraction, coupled with the characteristics of sedimentary layers and building loads above it.
Figure 3. Illustration of the different factors originating subsidence in Jakarta (Source: ITB)
2. METHODOLOGY FOR TERRAIN DEFORMATION MEASUREMENTS
2.1 Radar interferometry
The InSAR SPN (Stable Point Network) technique is able to detect ground movements on the Earth’s surface with millimetric precision over very large areas by using radar satellite images. The range of movement that can be measured using this technique depends on the satellite and number of images used for the period of the study.
InSAR is an English acronym meaning “Interferometric Synthetic Aperture Radar”. Synthetic Aperture Radars are high resolution radar satellite systems and “Interferometric” refers to the superimposition of radar waves to detect differences through time.
The principle of interferometry is based on comparing the distance between the satellite and the ground in consecutive satellite passes over the same area or point on the Earth’s surface. Radar satellites images record, with very high precision, the distance travelled by the radar signal that is emitted by the satellite is registered. When the distance between the satellite and a certain point is compared through time, InSAR technology can provide highly accurate ground deformation measurements.
2.2 The SPN processing technique
SPN stands for “Stable Point Network”. It is a PSI processing technique developed by Altamira Information in 2002 [9] [10] that considered a system of points that reflect the radar signal from the satellite continuously through the time. It makes use of differential interferometric phase measurements to generate long term terrain deformation and digital surface model maps. The estimation is performed pixel-by-pixel without the use of any spatial interpolation. The algorithm is capable of using all the phase information even in conditions of large baseline or platform instabilities, these effects being handled by precise estimation of the location of the equivalent mean phase centre within the SAR pixel.
The measure of deformation is based on the phase of the radar image, which is directly related to the distance between the satellite and the object located on the Earth surface. The evolution of the phase of each pixel is analysed and compared across all available images. All phase changes could be related to ground motion. There are several effects that can alter the measure of distance between sensor and ground surface. During processing, those effects are identified and separated. The extent to which they are contributing to the change in phase value is estimated in order to be able to compensate them to derive the actual ground motion phase component. Those artefacts are mainly due to:
− Height different from the digital elevation model: The real height of the considered point can differ from what indicated by the Digital Elevation Model (SRTM, ASTER GDEM). This height differential has an effect on the phase shift that must be filtered.
− Impact of the atmospheric conditions: The variability of atmospheric conditions during data acquisition has a direct impact on the phase. Due to atmospheric variability the delay that occurs when an electromagnetic wave passes through the different layers of the atmosphere could be variable from one image to another, and within the same image depending on the location. For this reason, those effects must be estimated and compensated in order to obtain a precise measurement of the actual motion.
− Thermal effects: Temperature changes can cause thermal dilation of infrastructures. The magnitude of this deformation mainly depends on the gradient of temperature and the type of material composing the structure. It is therefore possible to sometimes detect deformations that are not due to ground motions on different structures; those thermal effects are mainly visible on artificial large structures such as buildings or bridges. These deformations could be estimated and filtered if information about the temperature variations during the monitoring period is available.
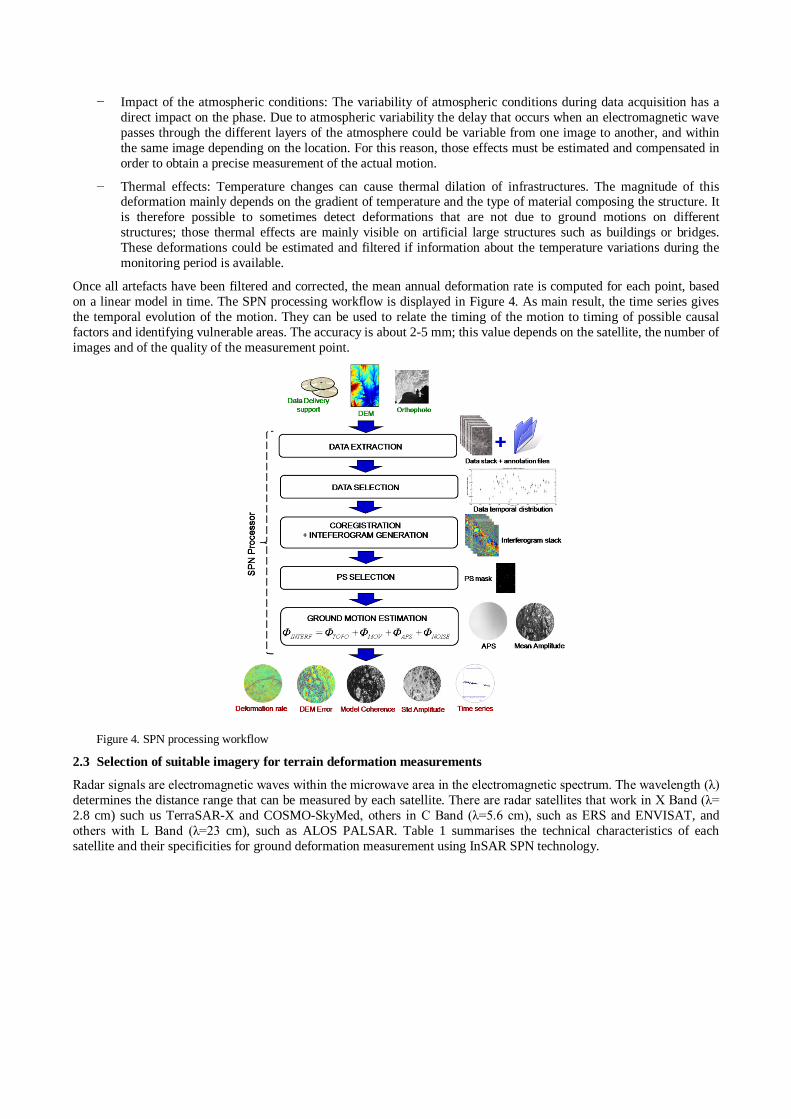
Once all artefacts have been filtered and corrected, the mean annual deformation rate is computed for each point, based on a linear model in time. The SPN processing workflow is displayed in Figure 4. As main result, the time series gives the temporal evolution of the motion. They can be used to relate the timing of the motion to timing of possible causal factors and identifying vulnerable areas. The accuracy is about 2-5 mm; this value depends on the satellite, the number of images and of the quality of the measurement point.
Figure 4. SPN processing workflow
2.3 Selection of suitable imagery for terrain deformation measurements
Radar signals are electromagnetic waves within the microwave area in the electromagnetic spectrum. The wavelength (λ) determines the distance range that can be measured by each satellite. There are radar satellites that work in X Band (λ= 2.8 cm) such us TerraSAR-X and COSMO-SkyMed, others in C Band (λ=5.6 cm), such as ERS and ENVISAT, and others with L Band (λ=23 cm), such as ALOS PALSAR. Table 1 summarises the technical characteristics of each satellite and their specificities for ground deformation measurement using InSAR SPN technology.
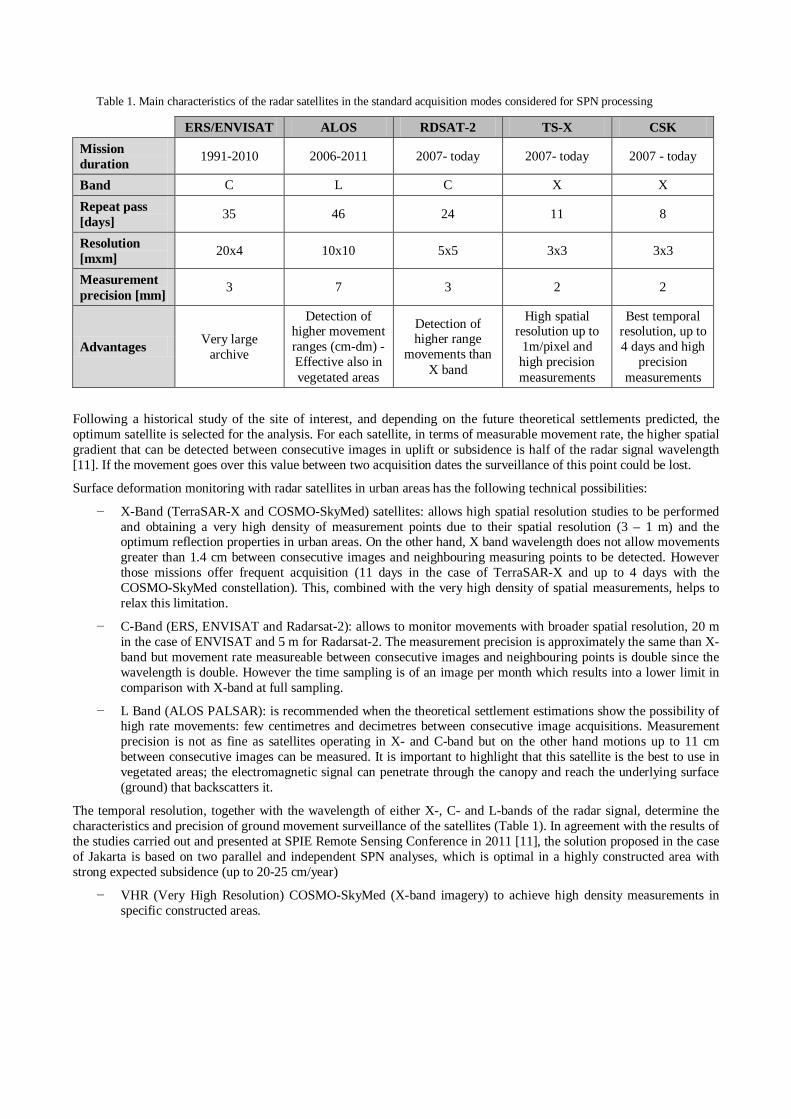
Table 1. Main characteristics of the radar satellites in the standard acquisition modes considered for SPN processing
ERS/ENVISAT ALOS RDSAT-2 TS-X CSK Mission duration 1991-2010 2006-2011 2007- today 2007- today 2007 - today
Band C L C X X Repeat pass [days] 35 46 24 11 8
Resolution [mxm] 20x4 10x10 5x5 3x3 3x3
Measurement precision [mm] 3 7 3 2 2
Advantages Very large archive
Detection of higher movement ranges (cm-dm) - Effective also in vegetated areas
Detection of higher range
movements than X band
High spatial resolution up to
1m/pixel and high precision measurements
Best temporal resolution, up to 4 days and high
precision measurements
Following a historical study of the site of interest, and depending on the future theoretical settlements predicted, the optimum satellite is selected for the analysis. For each satellite, in terms of measurable movement rate, the higher spatial gradient that can be detected between consecutive images in uplift or subsidence is half of the radar signal wavelength [11]. If the movement goes over this value between two acquisition dates the surveillance of this point could be lost.
Surface deformation monitoring with radar satellites in urban areas has the following technical possibilities:
− X-Band (TerraSAR-X and COSMO-SkyMed) satellites: allows high spatial resolution studies to be performed and obtaining a very high density of measurement points due to their spatial resolution (3 – 1 m) and the optimum reflection properties in urban areas. On the other hand, X band wavelength does not allow movements greater than 1.4 cm between consecutive images and neighbouring measuring points to be detected. However those missions offer frequent acquisition (11 days in the case of TerraSAR-X and up to 4 days with the COSMO-SkyMed constellation). This, combined with the very high density of spatial measurements, helps to relax this limitation.
− C-Band (ERS, ENVISAT and Radarsat-2): allows to monitor movements with broader spatial resolution, 20 m in the case of ENVISAT and 5 m for Radarsat-2. The measurement precision is approximately the same than X-band but movement rate measureable between consecutive images and neighbouring points is double since the wavelength is double. However the time sampling is of an image per month which results into a lower limit in comparison with X-band at full sampling.
− L Band (ALOS PALSAR): is recommended when the theoretical settlement estimations show the possibility of high rate movements: few centimetres and decimetres between consecutive image acquisitions. Measurement precision is not as fine as satellites operating in X- and C-band but on the other hand motions up to 11 cm between consecutive images can be measured. It is important to highlight that this satellite is the best to use in vegetated areas; the electromagnetic signal can penetrate through the canopy and reach the underlying surface (ground) that backscatters it.
The temporal resolution, together with the wavelength of either X-, C- and L-bands of the radar signal, determine the characteristics and precision of ground movement surveillance of the satellites (Table 1). In agreement with the results of the studies carried out and presented at SPIE Remote Sensing Conference in 2011 [11], the solution proposed in the case of Jakarta is based on two parallel and independent SPN analyses, which is optimal in a highly constructed area with strong expected subsidence (up to 20-25 cm/year)
− VHR (Very High Resolution) COSMO-SkyMed (X-band imagery) to achieve high density measurements in specific constructed areas.
− ALOS PALSAR (L-band imagery) in order to measure motion of higher amplitude and increase time period of measured ground motion up to 4 years.
3. TERRAIN DEFORMATION RESULTS
3.1 Data availability over the Agglomeration of Jakarta
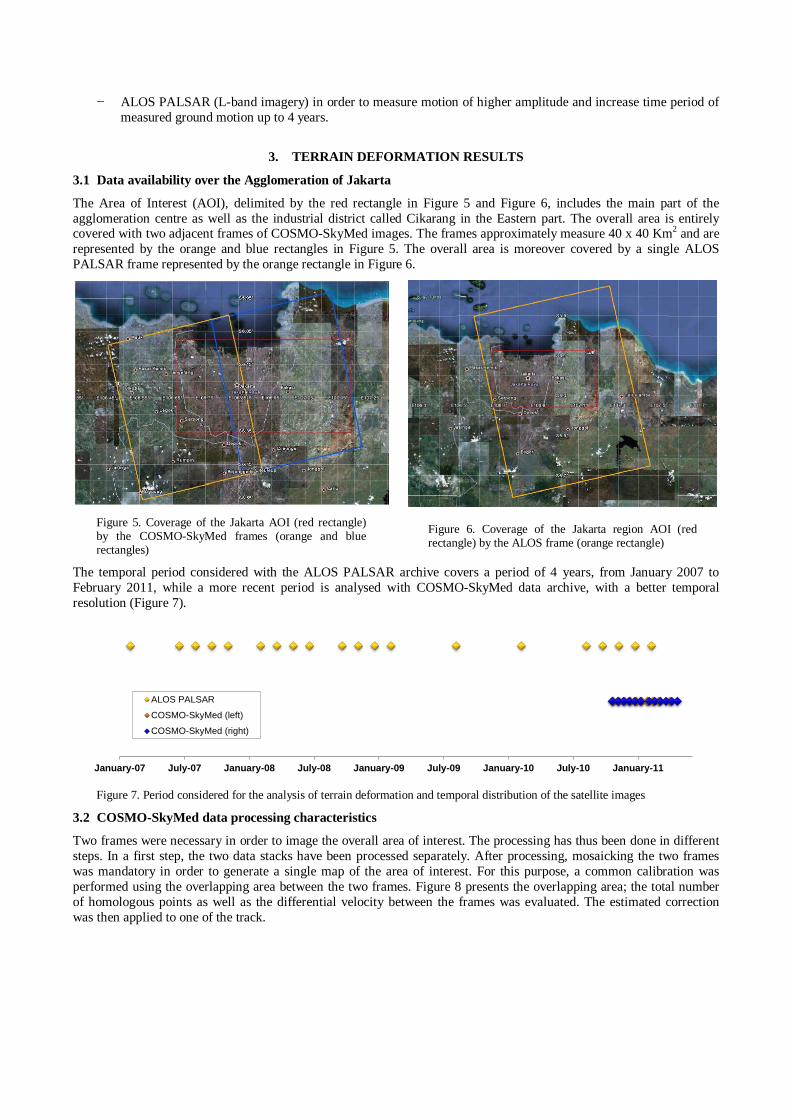
The Area of Interest (AOI), delimited by the red rectangle in Figure 5 and Figure 6, includes the main part of the agglomeration centre as well as the industrial district called Cikarang in the Eastern part. The overall area is entirely covered with two adjacent frames of COSMO-SkyMed images. The frames approximately measure 40 x 40 Km2 and are represented by the orange and blue rectangles in Figure 5. The overall area is moreover covered by a single ALOS PALSAR frame represented by the orange rectangle in Figure 6.
Figure 5. Coverage of the Jakarta AOI (red rectangle) by the COSMO-SkyMed frames (orange and blue rectangles)
Figure 6. Coverage of the Jakarta region AOI (red rectangle) by the ALOS frame (orange rectangle)
The temporal period considered with the ALOS PALSAR archive covers a period of 4 years, from January 2007 to February 2011, while a more recent period is analysed with COSMO-SkyMed data archive, with a better temporal resolution (Figure 7).
Figure 7. Period considered for the analysis of terrain deformation and temporal distribution of the satellite images
3.2 COSMO-SkyMed data processing characteristics
Two frames were necessary in order to image the overall area of interest. The processing has thus been done in different steps. In a first step, the two data stacks have been processed separately. After processing, mosaicking the two frames was mandatory in order to generate a single map of the area of interest. For this purpose, a common calibration was performed using the overlapping area between the two frames. Figure 8 presents the overlapping area; the total number of homologous points as well as the differential velocity between the frames was evaluated. The estimated correction was then applied to one of the track.
January-07 July-07 January-08 July-08 January-09 July-09 January-10 July-10 January-11
ALOS PALSAR
COSMO-SkyMed (left)
COSMO-SkyMed (right)
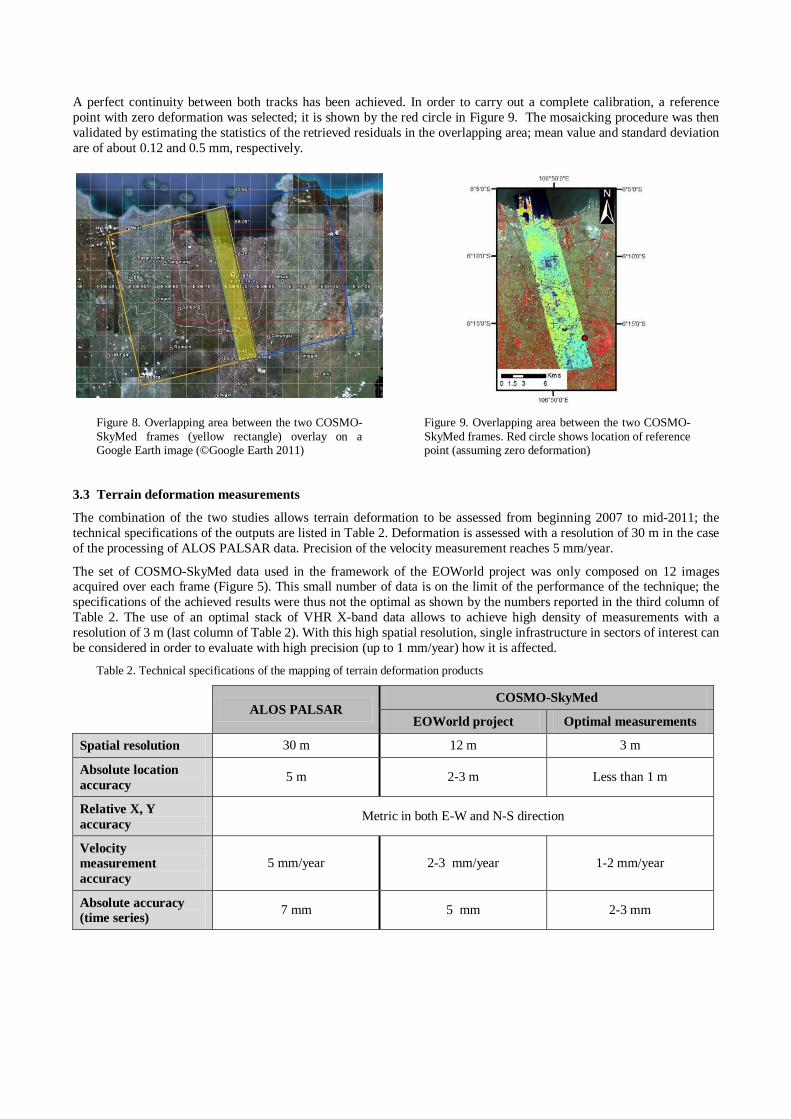
A perfect continuity between both tracks has been achieved. In order to carry out a complete calibration, a reference point with zero deformation was selected; it is shown by the red circle in Figure 9. The mosaicking procedure was then validated by estimating the statistics of the retrieved residuals in the overlapping area; mean value and standard deviation are of about 0.12 and 0.5 mm, respectively.
Figure 8. Overlapping area between the two COSMO-SkyMed frames (yellow rectangle) overlay on a Google Earth image (©Google Earth 2011)
Figure 9. Overlapping area between the two COSMO-SkyMed frames. Red circle shows location of reference point (assuming zero deformation)
3.3 Terrain deformation measurements
The combination of the two studies allows terrain deformation to be assessed from beginning 2007 to mid-2011; the technical specifications of the outputs are listed in Table 2. Deformation is assessed with a resolution of 30 m in the case of the processing of ALOS PALSAR data. Precision of the velocity measurement reaches 5 mm/year.
The set of COSMO-SkyMed data used in the framework of the EOWorld project was only composed on 12 images acquired over each frame (Figure 5). This small number of data is on the limit of the performance of the technique; the specifications of the achieved results were thus not the optimal as shown by the numbers reported in the third column of Table 2. The use of an optimal stack of VHR X-band data allows to achieve high density of measurements with a resolution of 3 m (last column of Table 2). With this high spatial resolution, single infrastructure in sectors of interest can be considered in order to evaluate with high precision (up to 1 mm/year) how it is affected.
Table 2. Technical specifications of the mapping of terrain deformation products
ALOS PALSAR
COSMO-SkyMed
EOWorld project Optimal measurements
Spatial resolution 30 m 12 m 3 m
Absolute location accuracy 5 m 2-3 m Less than 1 m
Relative X, Y accuracy Metric in both E-W and N-S direction
Velocity measurement accuracy
5 mm/year 2-3 mm/year 1-2 mm/year
Absolute accuracy (time series) 7 mm 5 mm 2-3 mm

The results of the processing carried out with the ALOS PALSAR dataset are displayed in Figure 10 (see following page). The deformation measured over the AOI is colour-coded for visualization purposes. The colours gradually vary from red, which indicates motions away from the sensor, through orange, green, and finally to blue (motions towards the sensor). The velocity classes are uniform in size while the maximum and minimum values depend on the range of velocities actually measured. The measurements points have been classified in eleven categories; the colour table considers deformation values varying from more than -75 (red) to more than +75 (blue) mm/year.
More than 1.3 million of measurement points have been detected during this SPN processing. Terrain deformation measurement has been assessed over about 1700 Km2, resulting in a density of about 757 measurement points per Km2. Note the very high density of measurement points over the urban area and its surroundings. The use of L-band electromagnetic signal of ALOS allows the impact of temporal decorrelation to be minimized, also over rural areas.
The sub-districts of Penjaringan, Cengkarang, the South Centre of Jakarta and the suburban district of Cikarang are affected by strong subsidence rates. Largest subsidence has been detected in Pantai Mutiara housing complex, where accumulated subsidence measured with ALOS PALSAR reaches 40 cm, from January 2007 to February 2011. Other subsidence patterns have been observed, as in the sub-district of Tanjunk Prior. The mean subsidence rate detected in this area between 2007 and 2011 is of about 45 to 60 mm/year.
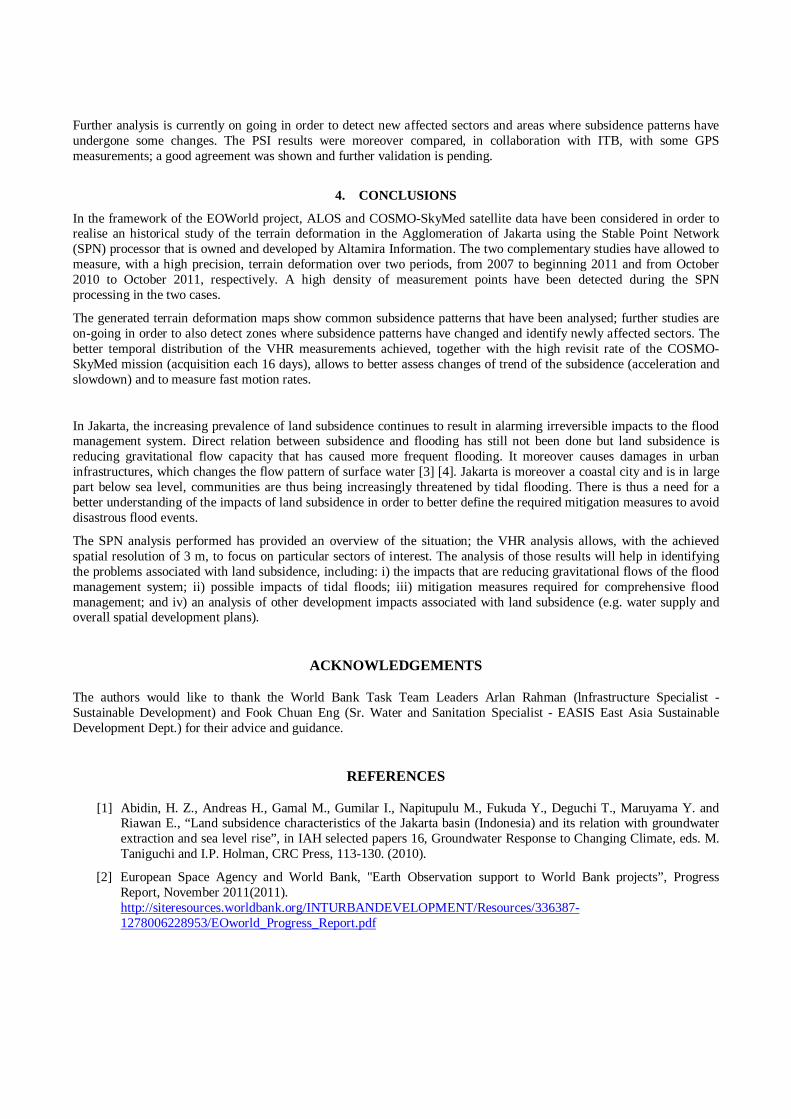
Figure 11 presents terrain deformation assessed with COSMO-SkyMed data. In order to achieve high precision measurements, SAR images acquired between April and October 2011 have also been used to complete the initial data stack (Figure 7) and be able to consider an overall year. This extension of the monitoring period allowed to process a consequent stack of data and achieve outputs satisfying the specifications summarized in Table 2. Note that only part of the AOI is covered; a similar velocity display scale is used for visualisation in order to allow direct comparison with Figure 10.
A much higher number of measurement points have been detected with the processing of the VHR data. The area considered in Figure 11 is of about 230 Km2 and the density of measurement points reaches 9950 points per Km2.
The same subsidence patterns than in Figure 10 can be highlighted in the Northern part of Jakarta, as it can be seen in the in Pantai Mutiara housing complex or in the Tanjunk Prior sub-district.A comparison between ALOS and COSMO-SkyMed results has been performed in zones of high subsidence in order to check the consistency of the measurements.
The districts of Penjaringan and Tanjunk Prior, where subsidence rates reaching up to -15 cm per year have been detected are considered. Figure 12 and Figure 13 show the combined deformation patterns of subsidence points, covering the whole temporal period of both satellites. Calibration has been done over COSMO-SkyMed time series to adjust the offset between both products.
Figure 12 concerns a point located in the area of Penjaringan (Pantai Mutiara). The ALOS time series, displayed in red, shows that over the 4 years, the considered point subsides of about 380 mm. The subsidence being from end of September 2010 to February 2011 is of about 28 mm. This result is in agreement with the measurements achieved using COSMO-SkyMed data that show an accumulated subsidence of about -35 mm up to end of April for a measurement point placed at the same location.
The second sector of interest considered in Figure 13. The measurement point of the ALOS processing undergoes a subsidence of -138 mm from end January 2007 to February 2011. The subsidence trend looks to slow down at the end of the monitoring period (last 4 red points in Figure 13). In this case, the use of COSMO-SkyMed data presents a great advantage. The high sampling of measurement, due to the fast repeat cycle, gives more precise information on the subsidence rate evolution. A point located at the proximity of the ALOS processing measurement point is considered. Its time series is presented in blue in Figure 13. The stabilization process of the subsidence is still visible; the point subsides of 6.8 mm between October 2010 and April 2011. More information on this stabilization of the subsidence could be assessed by extending the monitoring period. The high revisit time and resolution of the COSMO-SkyMed data will thus allow to monitor displacement trends and analyse the evolution of single building in the sector.
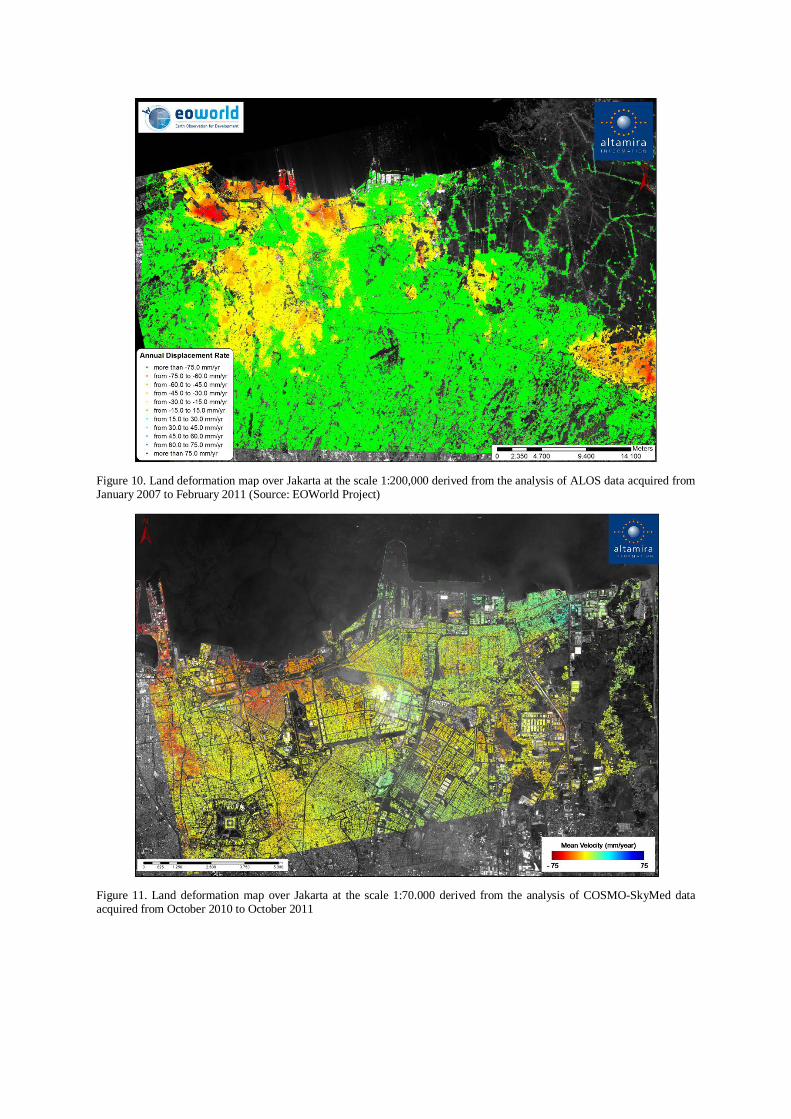
Figure 10. Land deformation map over Jakarta at the scale 1:200,000 derived from the analysis of ALOS data acquired from January 2007 to February 2011 (Source: EOWorld Project)
Figure 11. Land deformation map over Jakarta at the scale 1:70.000 derived from the analysis of COSMO-SkyMed data acquired from October 2010 to October 2011

Figure 12. Time series comparison between ALOS (point B612_1604_096_E in red) and COSMO-SkyMed (point B2503_5100_100_A in blue) in Pantai Mutiara – There is a good agreement between the two time series
Figure 13. Time series comparison between ALOS (point B635_1416_105_C in red) and COSMO-SkyMed (point B2593_4522_107_A in blue) in Tanjunk Prior – The stabilization of the subsidence from the end of 2010 is shown in the two time series
Further analysis is currently on going in order to detect new affected sectors and areas where subsidence patterns have undergone some changes. The PSI results were moreover compared, in collaboration with ITB, with some GPS measurements; a good agreement was shown and further validation is pending.
4. CONCLUSIONS
In the framework of the EOWorld project, ALOS and COSMO-SkyMed satellite data have been considered in order to realise an historical study of the terrain deformation in the Agglomeration of Jakarta using the Stable Point Network (SPN) processor that is owned and developed by Altamira Information. The two complementary studies have allowed to measure, with a high precision, terrain deformation over two periods, from 2007 to beginning 2011 and from October 2010 to October 2011, respectively. A high density of measurement points have been detected during the SPN processing in the two cases.
The generated terrain deformation maps show common subsidence patterns that have been analysed; further studies are on-going in order to also detect zones where subsidence patterns have changed and identify newly affected sectors. The better temporal distribution of the VHR measurements achieved, together with the high revisit rate of the COSMO-SkyMed mission (acquisition each 16 days), allows to better assess changes of trend of the subsidence (acceleration and slowdown) and to measure fast motion rates.
In Jakarta, the increasing prevalence of land subsidence continues to result in alarming irreversible impacts to the flood management system. Direct relation between subsidence and flooding has still not been done but land subsidence is reducing gravitational flow capacity that has caused more frequent flooding. It moreover causes damages in urban infrastructures, which changes the flow pattern of surface water [3] [4]. Jakarta is moreover a coastal city and is in large part below sea level, communities are thus being increasingly threatened by tidal flooding. There is thus a need for a better understanding of the impacts of land subsidence in order to better define the required mitigation measures to avoid disastrous flood events.
The SPN analysis performed has provided an overview of the situation; the VHR analysis allows, with the achieved spatial resolution of 3 m, to focus on particular sectors of interest. The analysis of those results will help in identifying the problems associated with land subsidence, including: i) the impacts that are reducing gravitational flows of the flood management system; ii) possible impacts of tidal floods; iii) mitigation measures required for comprehensive flood management; and iv) an analysis of other development impacts associated with land subsidence (e.g. water supply and overall spatial development plans).
ACKNOWLEDGEMENTS
The authors would like to thank the World Bank Task Team Leaders Arlan Rahman (lnfrastructure Specialist - Sustainable Development) and Fook Chuan Eng (Sr. Water and Sanitation Specialist - EASIS East Asia Sustainable Development Dept.) for their advice and guidance.
REFERENCES
[1] Abidin, H. Z., Andreas H., Gamal M., Gumilar I., Napitupulu M., Fukuda Y., Deguchi T., Maruyama Y. and Riawan E., “Land subsidence characteristics of the Jakarta basin (Indonesia) and its relation with groundwater extraction and sea level rise”, in IAH selected papers 16, Groundwater Response to Changing Climate, eds. M. Taniguchi and I.P. Holman, CRC Press, 113-130. (2010).
[2] European Space Agency and World Bank, "Earth Observation support to World Bank projects”, Progress Report, November 2011(2011). http://siteresources.worldbank.org/INTURBANDEVELOPMENT/Resources/336387-1278006228953/EOworld_Progress_Report.pdf
[3] Djaja, R., Rais, J., Abidin H. Z. and Wedyanto, K., “Land Subsidence of Jakarta Metropolitan Area”, 3rd FIG Regional Conference, Jakarta – Indonesia, (2004).
[4] World Wide Fund For Nature, “Mega-Stress for Mega-Cities A Climate Vulnerability Ranking of Major Coastal Cities in Asia”, (2009).
[5] “News and Broadcast: Jakarta Urgent Flood Mitigation Project/Jakarta Emergency Dredging Initiative Project (JUFMP/JEDI Project)”, http://web.worldbank.org/WBSITE/EXTERNAL/NEWS/0,,contentMDK:23087004~menuPK:141310~pagePK:34370~piPK:34424~theSitePK:4607,00.html .
[6] http://www.who.int/hac/crises/idn/sitreps/indonesia_floods_map_affected_areas_5feb2007.pdf .
[7] Abidin, H. Z., Andreas, H., Gumilar, I., Gamal, M., Fukuda, Y. and Deguchi, T., “Land Subsidence and Urban Development in Jakarta (Indonesia)”, Proceedings of 7th FIG Regional Conference Spatial Data Serving People: Land Governance and the Environment – Building the Capacity (2009).
[8] Abidin, H. Z., Andreas, H., Djaja, R., Darmawan, D. and Gamal, M. “Land subsidence characteristics of Jakarta between 1997 and 2005, as estimated using GPS surveys”. GPS Solut 2(1):23–32, (2008).
[9] Duro, J., Inglada, J., Closa, J., Adam, N. and Arnaud, A., “High resolution differential interferometry using time series of ERS and ENVISAT SAR data”, Proceedings FRINGE 2003 Workshop, (2003).
[10] Arnaud, A., Adam, N., Hanssen, R., Inglada, J., Duro, J., Closa, J. and Eineder, M., “ASAR ERS interferometric phase continuity”, Proceedings of International Geoscience and Remote Sensing Symposium 2003 (IGARSS), (2003).
[11] Sabater, J. R., Duro, J., Arnaud, A., Albiol, D. and Koudogbo, F. N., “Comparative analyses of multi-frequency PSI ground deformation measurements”, Proceedings of SPIE 2011, (2011).