combined heat and power (chp) practicum › sites › energy › files › combined... ·...
TRANSCRIPT

33
Combined Heat and Power (CHP) Practicum
Western Missouri CHP Summit: Resiliency for Critical Infrastructure
Ben Campbell & Cliff HaefkeOctober 16, 2018

Agenda
• What are the CHP TAPs?
• CHP Project Development Process
• CHP TAP Screening – Step-by-Step Walk-Through
• Additional Considerations that can Impact CHP Economics
2

CHP Project Development Flow Process and CHP TAP Technical Assistance

• High level assessment to determine if site shows potential for a CHP project
• Quantitative Analysis• Energy Consumption & Costs
• Estimated Energy Savings & Payback
• CHP System Sizing
• Qualitative Analysis• Understanding project drivers
• Understanding site peculiarities
Overview of DOE TAP CHP Screening Analysis
Annual Energy Consumption
Base Case CHP Case
Purchased Electricty, kWh 88,250,160 5,534,150
Generated Electricity, kWh 0 82,716,010
On-site Thermal, MMBtu 426,000 18,872
CHP Thermal, MMBtu 0 407,128
Boiler Fuel, MMBtu 532,500 23,590
CHP Fuel, MMBtu 0 969,845
Total Fuel, MMBtu 532,500 993,435
Annual Operating Costs
Purchased Electricity, $ $7,060,013 $1,104,460
Standby Power, $ $0 $0
On-site Thermal Fuel, $ $3,195,000 $141,539
CHP Fuel, $ $0 $5,819,071
Incremental O&M, $ $0 $744,444
Total Operating Costs, $ $10,255,013 $7,809,514
Simple Payback
Annual Operating Savings, $ $2,445,499
Total Installed Costs, $/kW $1,400
Total Installed Costs, $/k $12,990,000
Simple Payback, Years 5.3
Operating Costs to Generate
Fuel Costs, $/kWh $0.070
Thermal Credit, $/kWh ($0.037)
Incremental O&M, $/kWh $0.009
Total Operating Costs to Generate, $/kWh $0.042
6

CHP TAP Qualification Screening Steps (covered on subsequent slides)
1. Site Specific Information
2. Utility Costs
3. CHP System Specifications
4. Energy Consumption / CHP Operation
5. Annual Operating Costs
6. CHP System Economics
7. Operating Costs per kWh
7
Collected Data• 12 months of utility data
• Blended cost of utilities
• Thermal and electric demand of the facilities (average, peak, seasonal)
• Annual natural gas and electricity consumption
• Facility operating hours
• Existing equipment info• Heating and cooling capacities, efficiency,
age, etc.
• Additional helpful info• Resiliency needs, climate goals, utility
contract ending

1. Site Specific Information
• 12 months of utility
data
• Thermal and electric
demand of the
facilities (average,
peak, seasonal)
• Annual natural gas
and electricity
consumption
• Facility operating
hours
8
Gas Fueled CHP - Recip Engine, Microturbine, Fuel Cell or Gas Turbine Systems / natural gas, LFG, biogas
Note: The results of this screening analysis use average values and assumptions and should not be utilized as an investment grade analysis.
Facility Information
Facility Name
Location (City, State)
Application
Loads
Site Operating Schedule 24/7
Annual Operating Hours of Site 8,760
Baseload Electric Demand, kW 3,416
Annual Site Electricity Consumption, kWh 41,924,572
Total Annual Thermal Demand, MMBtu/yr 142,869
Baseload Thermal Demand, MMBtu/hr 11.00 22.0 16.2 11.0 Avg Load
CHP Operating Schedule 12 Months 2,160 4,392 2,208 Hours
Annual Hours of CHP Operation 8,760
Baseload Power Demand during CHP Operation, kW 3,416
Electricity Consumption during CHP Operation, kWh 41,924,572
Thermal Demand during CHP Operation, MMBtu/yr 142,869
CHP Baseload Thermal Demand, MMBtu/hr 11.00
Annual CHP Addressable Thermal Demand, MMBtu/yr 142,869
DOE TAP CHP Screening Technical Assistance
Hospital
500-600 Bed Hospital
MissouriCity
Date:
Addressable Thermal Load (MMBtu/hr)
Winter ThermalShoulder
ThermalSummer Thermal
16-Oct-18

2. Utility Costs
Energy Costs Base Case CHP Case
Boiler/Thermal Fuel Costs, $/MMBtu $4.20 $4.20
CHP Fuel Costs, $MM/Btu $4.20
Average Electricity Costs, $/kWh $0.065
Percent Average per kWh Electric Cost Avoided 90%
Standby Rate, $/kW
Excess Power Sales Price, $/kWh
Existing System
Displaced Thermal Equipment Efficiency, % 83.0%
9
• 12 months of utility data
• Electricity and natural gas
• Blended costs of utilities
• Avoided Rate / Standby Rate
• Existing equipment info
• Heating and cooling capacities, efficiency, age, etc.
Percent Average per kWh Electric Cost Avoided: Assesses how utility rates (i.e. fixed charges and standby rates) affect the blended rate savings (total kWh price for electricity) by comparing a customer's utility bills before and after a CHP installation. For example, an avoided rate of 100% means that one kWh generated onsite reduces the utility bill by the full blended cost of one kWh of purchased power. This is rarely the case in most tariff structures. This example incorporates an avoided rate of 90%, meaning one kWh of electricity generated from CHP reduces utility purchases by 90% of the blended rate prior to CHP.

3. CHP System Specs
10
• Initial sizing of CHP system
• Utilizes typical CHP performance operating and cost data from U.S. DOE CHP Technology Fact Sheets
CHP System CHP Case 1
Sales of Excess Power (Yes/No) No
Net CHP Power, kW 3,138 3,402
CHP Electric Efficiency, % (HHV) 40.9%
CHP Thermal Output, Btu/kWh 3,233
CHP Thermal Output, MMBtu/hr 11.00
CHP Fuel Nat Gas
CHP Availability, % 98%
Incremental O&M Costs, $/kWh $0.011
Thermal Utilization, % 100%
Total Installed Costs, $/kW $1,800
(Fact Sheet: https://www.energy.gov/eere/amo/downloads/reciprocating-engines-doe-chp-technology-fact-sheet-series-fact-sheet-2016)

Comparison of CHP Characteristics for Typical Systems
11Source: U.S. DOE CHP Technology Fact Sheet Series, https://www.energy.gov/sites/prod/files/2017/12/f46/CHP%20Overview-120817_compliant_0.pdf

4. Energy Consumption – CHP Operation
12
• Estimated annual energy performance is compared between the Base Case (no CHP) and the CHP Case (with CHP)
• CHP efficiencies and the Power-to-Heat Ratio are calculated
Annual Energy Consumption Base Case CHP Case
Purchased Electricity, kWh 41,924,572 12,719,082 29,205,490 CHP Electrici ty, kWh
Generated Electricity, kWh 0 29,205,490 99,649 MMBtu Electrici ty
Generated Electricity Used on Site, kWh 0 29,205,490 94,421 MMBtu Used Thermal
Generated Electricity Sold, kWh 0 0 243,641 MMBtu CHP Fuel
On-site Boiler/Heater Thermal, MMBtu/yr 142,869 48,447 79.7% CHP Fuel Use Efficiency (HHV)
CHP Thermal Used, MMBtu/yr 0 94,421 1.06 Power to Heat Ratio
Boiler/Heater Fuel, MMBtu/yr 172,131 58,370
CHP Fuel, MMBtu/yr 0 243,641
Total Fuel, MMBtu/yr 172,131 302,011
CHP Fuel Use Efficiency

5. Annual Operating Costs/Savings
13
• Annual operating costs are compared between the Base Case (no CHP) and the CHP Case (with CHP)
• In this scenario, standby charges are accounted for in the purchased electricity in the terms of avoided costs
Annual Operating Costs Base Case CHP Case
Purchased Electricity $2,725,097 $1,016,576
Standby Charges (Option 2) $0 $0
On-site Boiler/Heater Fuel $722,950 $245,155
CHP Fuel $0 $1,023,292
Incremental O&M $0 $321,260
Total Operating Costs $3,448,047 $2,606,283
Excess Power Sales $0
Operating Savings $841,764

6. CHP System Economics
14
• Simple payback is determined with typical CHP installed costs and operating savings
• A variety of factors can be incorporated to analyze the financial impacts on a potential CHP project (next section)
Simple Payback CHP Case 1
CHP Installed Costs $6,123,600
Additional Costs $0
Federal Investment Tax Credit (Yes/No) No $0
Avoided Equipment Credits* $0
Total Installed Costs with Equipment Credit $6,123,600
Value of Resiliency $0
Total Installed Costs less Incentives $6,123,600
Annual Operating Savings $841,764
Simple Payback, Years (w/o incentives) 7.3
Simple Payback, Years (with incentives) 7.3

7. Operating Costs per kWh
15
• Operating costs are calculated to determine the costs to generate in terms of $/kWh
• Fuel costs, thermal credit from offset boiler fuel, and incremental O&M are incorporated
Operating Costs to Generate
Fuel Costs, $/kWh 0.0350
Thermal Credit, $/kWh ($0.0164)
Incremental O&M, $/kWh 0.0110
Total Operating Costs to Generate, $/kWh $0.030
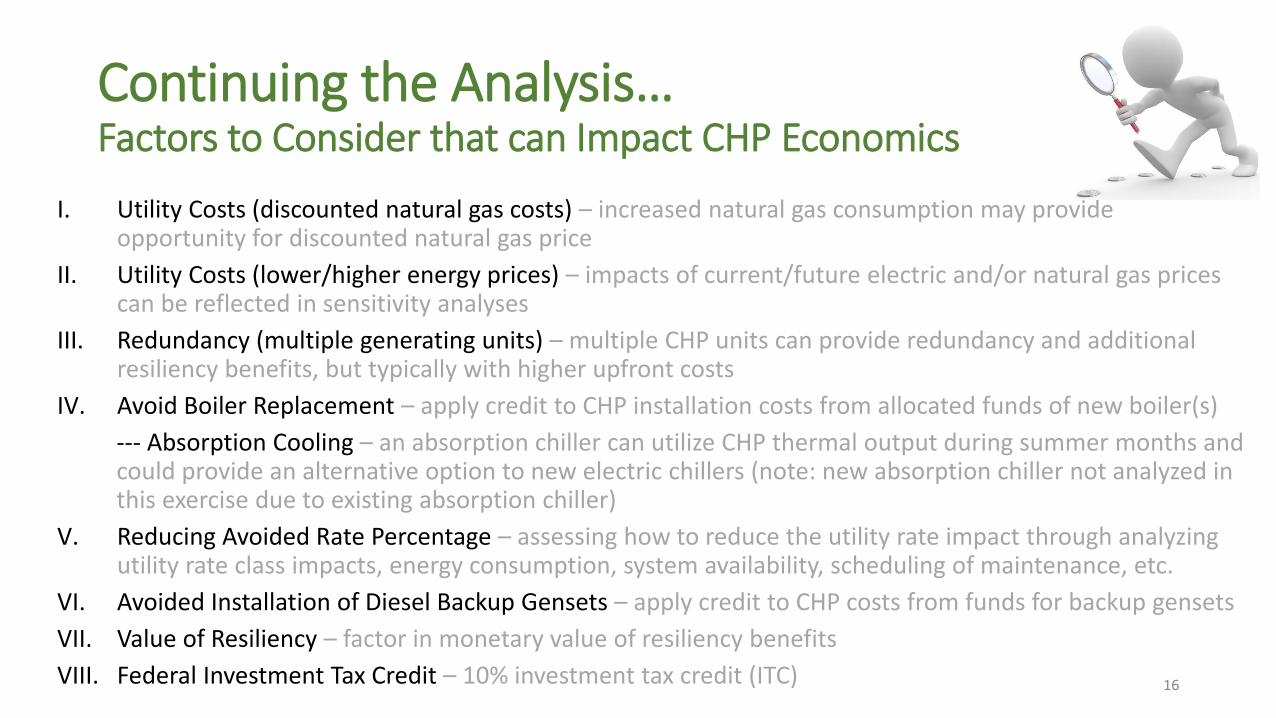
Continuing the Analysis… Factors to Consider that can Impact CHP Economics
I. Utility Costs (discounted natural gas costs) – increased natural gas consumption may provide opportunity for discounted natural gas price
II. Utility Costs (lower/higher energy prices) – impacts of current/future electric and/or natural gas prices can be reflected in sensitivity analyses
III. Redundancy (multiple generating units) – multiple CHP units can provide redundancy and additional resiliency benefits, but typically with higher upfront costs
IV. Avoid Boiler Replacement – apply credit to CHP installation costs from allocated funds of new boiler(s)
--- Absorption Cooling – an absorption chiller can utilize CHP thermal output during summer months and could provide an alternative option to new electric chillers (note: new absorption chiller not analyzed in this exercise due to existing absorption chiller)
V. Reducing Avoided Rate Percentage – assessing how to reduce the utility rate impact through analyzing utility rate class impacts, energy consumption, system availability, scheduling of maintenance, etc.
VI. Avoided Installation of Diesel Backup Gensets – apply credit to CHP costs from funds for backup gensets
VII. Value of Resiliency – factor in monetary value of resiliency benefits
VIII. Federal Investment Tax Credit – 10% investment tax credit (ITC) 16

I. Impact of Discounted Natural Gas Price
• Increased natural gas consumption may provide opportunity for discounted natural gas price
• Annual savings increase from $842K to $969K• Simple Payback reduces from 7.3 years to 6.3 years
17

Simple Payback CHP Case 1 CHP Case 2
CHP Installed Costs $6,123,600 $6,123,600
Additional Costs $0 $0
Federal Investment Tax Credit (Yes/No) No $0 $0
Avoided Equipment Credits* $0 $0
Total Installed Costs with Equipment Credit $6,123,600 $6,123,600
Value of Resiliency $0 $0
Total Installed Costs less Incentives $6,123,600 $6,123,600
Annual Operating Savings $841,764 $968,608
Simple Payback, Years (w/o incentives) 7.3 6.3
Simple Payback, Years (with incentives) 7.3 6.3
• Decreased marginal rate due to increased natural gas consumption
• Annual savings increase from $842K to $969K• Simple Payback reduces from 7.3 years to 6.3 years
I. Impact of Discounted Natural Gas Price (cont.)
18

II. Utility Rates – Sensitivity AnalysesImpact of Natural Gas Rate Increases/Decreases
0
2
4
6
8
10
$3.2 $3.7 $4.2 $4.7 $5.2
Payb
ack
(yrs
)
Natural Gas Rate Cost ($/MMBtu)
Natural Gas Rate Sensitivity Analysis
• Natural gas prices (current/future) can impact economics of a CHP project• With a 10% ($0.42/MMBtu) decreased price of natural gas (both in the Base
Case and CHP Case), the simple payback reduces from 7.3 years to 6.8 years19

0
5
10
15
20
$0.055 $0.065 $0.075 $0.085 $0.095
Payb
ack
(yrs
)
Electric Blended Rate Cost ($/kWh)
Electric Blended Rate Sensitivity Analysis
II. Utility Rates – Sensitivity Analyses (cont.)Impact of Electricity Rate Increases/Decreases
• Natural gas prices (current/future) can impact economics of a CHP project• With a 15% (1¢/kWh) rate increase in the price of electricity (both in the Base Case
and CHP Case), the simple payback reduces from 7.3 years to 5.5 years20
0
5
10
15
$0.055 $0.065 $0.075 $0.085 $0.095
Payb
ack
(yrs
)
Electric Blended Rate Cost ($/kWh)
Payback Sensitivity Electric/Natural Gas Rates
$3.2/MMBtu
$3.7/MMBtu
$4.2/MMBtu
$4.7/MMBtu
$5.2/MMBtu
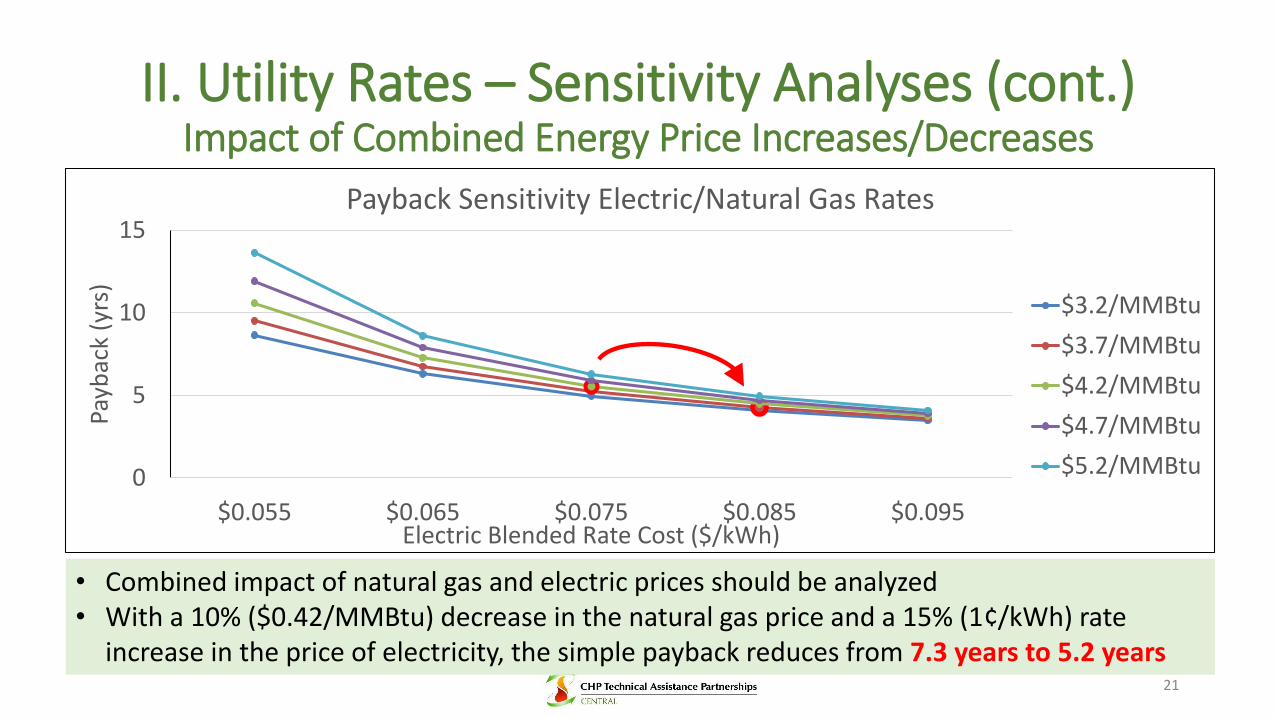
II. Utility Rates – Sensitivity Analyses (cont.)Impact of Combined Energy Price Increases/Decreases
• Combined impact of natural gas and electric prices should be analyzed• With a 10% ($0.42/MMBtu) decrease in the natural gas price and a 15% (1¢/kWh) rate
increase in the price of electricity, the simple payback reduces from 7.3 years to 5.2 years21

III. Redundancy (multiple generating units)
22
• Installing multiple generating units provides redundancy and increases resiliency benefits
• Maintenance can be staggered for multiple generating units
• Unplanned outage may only affect one unit while second unit can maintain operation
• Simple Payback increases from 7.3 years to 11 years
CHP System CHP Case 1 CHP Case 2
Sales of Excess Power (Yes/No) No No
Net CHP Power, kW ## 3,402 3,402 2 x 1,700 kW Engines
CHP Electric Efficiency, % (HHV) 40.9% 37.5%
CHP Thermal Output, Btu/kWh 3,233 3,979
CHP Thermal Output, MMBtu/hr 11.00 13.54
CHP Fuel Nat Gas Nat Gas
CHP Availability, % 98% 98%
Incremental O&M Costs, $/kWh $0.011 $0.015
Thermal Utilization, % 100% 100%
Total Installed Costs, $/kW $1,800 $2,300

Simple Payback CHP Case 1 CHP Case 2
CHP Installed Costs $6,123,600 $6,123,600
Additional Costs $0 $0
Federal Investment Tax Credit (Yes/No) No $0 $0
Avoided Equipment Credits* $240,110 $0 ($240,110)
Total Installed Costs with Equipment Credit $6,123,600 $5,883,490
Value of Resiliency $0 $0
Total Installed Costs less Incentives $6,123,600 $5,883,490
Annual Operating Savings $841,764 $841,764
Simple Payback, Years (w/o incentives) 7.3 7.0
Simple Payback, Years (with incentives) 7.3 7.0
IV. Avoided Boiler Replacement Costs
• CHP can offset the need for a facility to purchase new boiler equipment
• For this example, the CHP system can provide 11 MMBtu/hr offsetting the cost of purchasing a boiler of equivalent size (source: boiler cost from previous study)
• Total Installed Costs reduced from $6.1M to $5.9M
• Simple Payback reduces from 7.3 years to 7.0 years23

0
2
4
6
8
10
80% 85% 90% 95% 100%
Payb
ack
(yrs
)
Percent Average per kWh Electric Cost Avoided
Average Electric Cost Avoided Sensitivity Analysis
V. Percent Average per kWh Electric Cost Avoided
24
• Assessing how to reduce the utility rate impact through analyzing utility rate class impacts, energy consumption, system availability, scheduling of maintenance, etc.
• With a 5% increase in avoided cost percentage of kWh, the simple payback reduces from 7.3 years to 6.5 years

Simple Payback CHP Case 1 CHP Case 2
CHP Installed Costs $6,123,600 $6,123,600
Additional Costs $0 $0
Federal Investment Tax Credit (Yes/No) No $0 $0
Avoided Equipment Credits* $714,000 $0 ($714,000)
Total Installed Costs with Equipment Credit $6,123,600 $5,409,600
Value of Resiliency $0 $0
Total Installed Costs less Incentives $6,123,600 $5,409,600
Annual Operating Savings $841,764 $841,764
Simple Payback, Years (w/o incentives) 7.3 6.4
Simple Payback, Years (with incentives) 7.3 6.4
VI. Avoided Installation Credit of Diesel Backup Gensets
• CHP can offset the need for a facility to purchase backup diesel generator sets• For this example, 3.4 MW of backup diesel gensets are avoided due to the 3.4 MW CHP System
(calculated at an installed cost of $/kW analyzing 500 kW units, Source: RS Means 2015)• Total Installed Costs reduced from $6.1M to $5.4M• Simple Payback reduces from 7.3 years to 6.4 years
25

-
2
4
6
8
10
$0 $100,000 $250,000 $500,000 $750,000 $1,000,000 $1,500,000 $2,000,000
$0/kW $29/kW $73/kW $147/kW $220/kW $294/kW $441/kW $588/kW
Payb
ack
(yrs
)VII. Impact of Value of Resiliency
• Value of resiliency can impact CHP economics (value determined on case-by-case basis)
• For an example resiliency value of ~$150/kW (i.e. $500K), the Simple Payback reduces from 7.3 years to 6.7 years
26

Simple Payback CHP Case 1 CHP Case 2
CHP Installed Costs $6,123,600 $6,123,600
Additional Costs $0 $0
Federal Investment Tax Credit (Yes/No) Yes $0 ($612,360)
Avoided Equipment Credits* $0 $0
Total Installed Costs with Equipment Credit $6,123,600 $5,511,240
Value of Resiliency $0 $0
Total Installed Costs less Incentives $6,123,600 $5,511,240
Annual Operating Savings $841,764 $841,764
Simple Payback, Years (w/o incentives) 7.3 6.5
Simple Payback, Years (with incentives) 7.3 6.5
VIII. Impact of 10% Federal Investment Tax Credit
• A federal investment tax credit (ITC) of 10% is available for a for-profit organization and/or a 3rd party owned/operated CHP system
• Total Installed Costs reduced from $6.1M To $5.5M
• Simple Payback reduces from 7.3 years to 6.5 years27

# Impacting Factor Individual Measure Impact onSimple Payback (years)
Cumulative Measure Impact on Simple Payback (years)
1 Discounted Natural Gas Rate of 10% (CHP Case Only)
6.3 years 6.3 years
2a Decreased Natural Gas Price of 10% (both in Base Case and CHP Case)
6.8 years 6.1 years
2b Increased Electric Price of 15% (in both Base Case and CHP Case)
5.5 years 4.8 years
3 Redundancy (multiple CHP units) 11 years Not Included
4 Avoided Boiler Replacement Credit 7.0 years 4.6 years
5 Avoided Rate Percentage Increase of 5% 6.5 years 4.3 years
6 Avoided Installation Credit of Diesel Backup Emergency Genset
6.4 years 3.7 years
7 Adding Value of Resiliency (~$150/kW or ~$500K) 6.7 years 3.4 years
8 10% Federal Investment Tax Credit 6.5 years 2.9 years
Factoring All Considerations (Initial Simple Payback of 7.3 years… when All Factors Applied, Resulting Simple Payback is 2.9 years)
28

o Following a qualification screening review with a client, the US DOE CHP TAP can provide advanced technical assistance to address site specific criteria
o If the analysis shows favorable potential, the site is recommended to move forward with a feasibility study
o The CHP TAP is available to provide no-cost, unbiased 3rd party reviews on behalf of the clients moving forward for all stages of implementing combined heat and power
Typical Next Steps Following CHP Qualification Screening by the CHP TAP
29

o Collecting data and implementing a screening analysis are the first steps towards evaluating the initial economics of a CHP project
o Emerging drivers are creating new opportunities to evaluate CHP
o Factors in addition to spark spread need to be accounted for and can significantly impact the economics of a potential CHP project
o Resources are available through the US DOE CHP TAP to discuss CHP project opportunities and to receive technical assistance
Summary
30

o Contact the US DOE CHP TAP:
o To receive a complementary CHP qualification screening or
other technical assistance
o If you already have an existing CHP plant and interested in
expanding it
o If you need an unbiased 3rd Party Review of a proposal
Next Steps
31

Thank You
www.energy.gov/chp 32
Cliff Haefke Ben Campbell David BakerDirector Lead Engineer Assistant Director(312) 355-3476 (312) 996-2781 (312) [email protected] [email protected] [email protected]
Energy Resources Center University of Illinois at Chicago