combined cooling, heat and power (trigeneration) at...
TRANSCRIPT

ENVIRONMENTAL BIOTECHNOLOGY 9 (1) 2013, 25-37
described. Special emphasis was given to the operationschemes and control strategies of the operation modes:winter mode, transition mode and summer mode. Thecomponents used in the energy facility were also outlined.Monitoring and data analysis of the energy system wascarried out after the commissioning of trigeneration in theperiod from 2008 to 2011. Thus, valuable performance datawas obtained.
Combined cooling, heat and power (Trigeneration)at Offenburg University of Applied Sciences
Satya Gopisetty, Peter Treffinger
Offenburg University of Applied Sciences, Offenburg, Germany
Corresponding author: Satya Gopisetty, Offenburg University of Applied Sciences, Badstrasse 24, 77652 Offenburg, Germany; Phone 0049 7812054610; E-mail: [email protected]
Key words: control strategy, energy analysis, modes of operation, trigeneration.
Received in December 2012. Published in November 2013.
ABBREVIATIONS
AbsChi Absorption ChillerBOI_1 Boiler 1BOI_2 Boiler 2CHP Combined Heat and PowerCoHX_1 Condensing Heat Exchanger of Boiler 1CoHX_2 Condensing Heat Exchanger of Boiler 2CoHX_3 Condensing Heat Exchanger of Micro Gas TurbineCoHX_4 Condensing Heat Exchanger of Internal Combustion EngineCOP Coefficient of PerformanceCoT Cooling TowerCWS Cold Water StorageEER Energy Efficiency RatioEUF Energy Utilization FactorHS OG Hochschule OffenburgHVAC Heating, Ventilation and Air-ConditioningHWS Hot Water Storage
ABSTRACT
The energy supply of Offenburg University of AppliedSciences (HS OG) was changed from separate generation totrigeneration in 2007/2008. Trigeneration was installed forsupplying heat, cooling and electrical power at HS OG. In thispaper, trigeneration process and its modes of operationalong with the layout of the energy facility at HS OG were
© UNIVERSITY OF WARMIA AND MAZURY IN OLSZTYN
26 ENVIRONMENTAL BIOTECHNOLOGY 9 (1) 2013
ICE Internal Combustion EngineICEHX Exhaust Gas Heat Exchanger of Internal Combustion EngineIEA International Energy AgencyMGT Micro Gas TurbineMGTHX Exhaust Gas Heat Exchanger of Micro Gas TurbinePER Primary Energy RatioPES Primary Energy SavingVDI Verein Deutscher Ingenieure
Gi Degree days for the year i K·dPN Nominal electrical capacity kWQN Nominal thermal capacity kWQ Thermal energy kWhthTaN Utilization period at maximum capacity hV Volume m3
W Electrical energy kWhel
cw Cooling wateri Index of yeark Index of month
Introduction ........................................................................................................... 26
Energy facility at Offenburg University .................................................................27
Components ........................................................................................................... 28
Design of plant ....................................................................................................... 30
Control strategy .......................................................................................... 30
Modes of operation .................................................................................... 30
Winter mode ............................................................................................... 30
Transition mode .......................................................................................... 30
Summer mode ............................................................................................31
Results and discussion .......................................................................................... 31
Summary and conclusions ................................................................................... 37
References ..............................................................................................................37
INTRODUCTION
Trigeneration is an evolution of cogeneration (Chicco andMancarella 2006). Universities, hospitals, airports, coldstorage facilities, industrial plants especially food industrysuch as dairy, pasta industry, sugar factories, etc. require a supply of electricity, heat and cold (Chicco and Mancarella2007; Compernolle et al. 2011). Therefore, in the recentyears, systems for combined power, heat and coldproduction, so-called trigeneration systems, have beenapplied in increasing numbers. Trigeneration systems expandconventional Combined Heat and Power (CHP) systems(also called as cogeneration systems) with thermally activatedchillers or air conditioning systems. In moderate climates, thetypical load profile of the residential and non-residential
sector comprises heat demand in winter and air-conditioningin summer. In hot climates, trigeneration system preferablyprovides cold water or air conditioning and possibly some hotwater. Thus, in both cases by means of trigeneration, theutilization period at full load (full-load hours) as well as themean utilization factor of the CHP prime mover increases.
As of 2007 statistics from International Energy Agency(IEA), CHP share of 9% was estimated in global powergeneration. The same source had estimated a significantcontribution of combined heat and power generation toreduce CO2 emissions. For the year 2015 it was given 4%(170Mt·a-1), and for the year 2030 it was given 10% (950Mt·a-1)(Kerr 2008). Usually, the following advantages were listed

Gopisetty and Treffinger Trigeneration at Offenburg University 27
Figure 1. Simplified scheme of energy facility.
of a gas boiler, a 4-stroke internal combustion engine, anda thermal-chemical absorption system. It was reported thatcarbon emissions were reduced by about 26% with thisconfiguration.
Many authors determined performance figures oftrigeneration plant such as Energy Utilization Factor (EUF),Primary Energy Saving (PES), Primary Energy Ratio (PER),carbon emissions and fuel cost (Angrisani et al. 2012;Cervone et al. 2011; Kavvadias et al. 2010; Rocha et al. 2012).However, these investigations are often based on very globalconsiderations. On the other hand, it is very important tounderstand performance and control strategies oftrigeneration sub-systems to judge the potential oftrigeneration systems. This paper describes a trigenerationsystem employing an absorption chiller. Further, it containsresults on sub-system level for the period from 2008 to 2011.
ENERGY FACILITY AT OFFENBURG UNIVERSITY
The trigeneration system at HS OG was built in the years2006 and 2007, and the trigeneration process was set intooperation from the year 2008. Figure 1 shows a scheme of the
when discussing about trigeneration systems: higherefficiency, smaller transmission losses, and lesserenvironmental impacts (Zhou et al. 2012). Further, someauthors had mentioned very globally about socio-economicand environmental benefits such as reduction in operationcosts and reduced carbon emissions resulting in efficient useof energy resources (Carvalho et al. 2012).
There were many tests and experimental analysisconducted on trigeneration systems in the recent past. Itcan be distinguished between two main categories oftrigeneration, each of them having many subcategories.Firstly, trigeneration systems which employ a mechanicalcompressor, and secondly, systems which employ thermallyactivated heat pumps. For instance, Easaw and Mulley(2010) had reported about the experimental analysis oftrigeneration system in micro-scale. A LPG driven 4-strokeinternal combustion engine was coupled to an electricalgenerator as well as to a compressor of an air-conditioningunit. The results showed that 60% of the fuel input wasrecovered as exhaust heat which was then used for heatingwater. More typical installations employ thermallyactivated heat pumps. For instance, an experimentallyevaluated configuration in Angrisani et al. (2012) consists

28 ENVIRONMENTAL BIOTECHNOLOGY 9 (1) 2013
stations, e.g. fluid machinery lab, machine tools lab,plastics processing lab, Heating, Ventilation and Air-Conditioning (HVAC) facilities, process engineeringlaboratories including the energy facility for supplyingheat, cold and electricity. The chimney of the energyfacility can be seen on the left side of Building C. BuildingD is also equipped with laboratories, offices and lecturehalls of the faculty of media and information engineering.Building M is a cafeteria lounge. The total installedcapacity of the energy facility is 3442.5kW thermal powerfor heat, 150kW cooling power and 115kW electrical power(Gopisetty and Treffinger 2013).
Table 1 shows the demand structure for the buildingcomplexes at HS OG. The main energy demand is due tospace heating and process heat. The cooling energy demandand electricity is primarily used for information andcommunication technology, lighting, and machines inlaboratories, etc. It should be emphasized that the demandstructure of the HS OG had been frequently changing. Themain reasons are renovations of buildings and at least in therecent years a steady increase in the number of occupants.The heat demand and cooling demand are the maximumvalues which were estimated using the DIN standards(DIN 2003), VDI standards (VDIA 1996), buildingspecifications (Ulrich Kuttruff; Martin Gass, personalcommunication, Offenburg University of Applied Sciences2012) and manual measurements. Electrical demand off-peak and peak is the minimum and maximum value recordedbetween the period November 2011 and August 2012.
COMPONENTS
Table 2 lists the components of the energy facility and itscorresponding capacities. In order to meet the peakdemand for space heating at HS OG, there are two boilershaving in sum a capacity of 3000kW. Absorption chillerhas a capacity of 150kW. This lower capacity is indicatedby the lower cooling demand compared to the heatingdemand. Similarly, MGT and ICE capacities are ratherlow as compared to the demand. Thus, only a part of theelectrical load can be covered through the CHP units. The
trigeneration system at HS OG. Several combinations oftrigeneration systems exist and there is no standardarchitecture for the selection of sub-systems (Easaw andMuley 2010). In the case of HS OG, it consists of energyconverters such as Boiler 1 (BOI_1), Boiler 2 (BOI_2), MicroGas Turbine (MGT) and Internal Combustion Engine (ICE);unit operators such as Absorption Chiller (AbsChi), CoolingTower (CoT), Condensing Heat Exchanger of Boiler 1(CoHX_1), Condensing Heat Exchanger of Boiler 2(CoHX_2), Condensing Heat Exchanger of Micro GasTurbine (CoHX_3), Condensing Heat Exchanger of InternalCombustion Engine (CoHX_4), Exhaust Gas HeatExchanger of Micro Gas Turbine (MGTHX) and ExhaustGas Heat Exchanger of Internal Combustion Engine(ICEHX); and storages such as Hot Water Storage (HWS)and Cold Water Storage (CWS). Natural gas is used as a fuelto drive the energy converters. This energy facility is used tomeet the thermal energy demands and a part of electricalenergy demand at HS OG.
Figure 2. University building complexes (Gopisetty andTreffinger 2013).
HS OG consists of Building A, B, C, D and M as shownin Figure 2. Building A consists of administration andlecture halls. Building B has library, laboratories and alsolecture halls. Building C is equipped with pilot plant
Table 1. Demand structure of the building complexes at Offenburg University (Gopisetty and Treffinger 2013).
Building A and M B C D Total
Heated surface area in m2
Heat demand in kW
Cooling demand in kW
Electrical demand in kW
4763
866
n.a.
9278
1381
93
5879
788
168
4633
259
144
24553
3294
405
70 (off-peak) - 530 (peak)
n.a.=not applicable.

Gopisetty and Treffinger Trigeneration at Offenburg University 29
condensing heat exchangers improve heat extraction fromthe exhaust gas and also increase the thermal efficiency ofthe plant. The cooling tower is required to reject heat atmedium temperature from the absorption chiller toambient air. Hot water storage and cold water storagehave a capacity of 13000L each. They shall reduce thenumber of start-ups of CHP units.
The cooling demand mentioned in Table 1 is higher thanthe installed capacity of AbsChi shown in Table 2. Thecooling load at HS OG is often very low compared to thecooling demand because of less occupants and occupancyin the months of July, August and September. Thus,electric air-conditioners are used in the event of additionalcooling requirements.
Table 2. Components of energy facility.
Component Manufacturer, Type Capacity
Boilers (BOI_1 & BOI_2)
Micro Gas Turbine
Internal Combustion Engine
Condensing Heat Exchangersfollowing BOI_1 and BOI_2
Condensing Heat Exchangerfollowing MGT
Condensing Heat Exchangerfollowing ICE
Absorption Chiller
Cooling Tower
Hot Water Storage
Cold Water Storage
Viessmann, Vitoplex 300 TX3 (Burner, Weishaupt)
Capstone, C65
Buderus,BHKW Modul E 0834 DN-50
ViessmannVitotrans 300
Verdesis/Enalco,390A-TE RVS
Verdesis/Enalco,390A-TE RVS
Broad, BDH13IX71/86-32/27-9/15-20
Gohl, VK 77/6
Delta Solar GmbH, PS 13000 Liter
Delta Solar GmbH, PS 13000 Liter
QN=1500kW each
PN=65kWQN=120kW (winter)QN=127kW (summer)
PN=50kWQN=81kW
QN=105kW each
QN=16.8kW
QN=14.7kW
QN=150kW
QN=350kW
V=13000L
V=13000L
Table 3. Comparison of utilization periods (TTaN·h-1) (Gopisetty and Treffinger 2013).
Year BOI_1 and BOI_2 MGT ICE AbsChi
2008
2009
2010
2011
WinterSummer
WinterSummer
WinterSummer
WinterSummer
64514
72310
96927
6500
49391437
47851242
51001315
3910774
2143634
2816905
37931238
3430673
54787
114812
46693
27374

30 ENVIRONMENTAL BIOTECHNOLOGY 9 (1) 2013
DESIGN OF PLANT
Figure 3. Winter mode - simplified scheme of energy facility.
for about 10h to 12h on a daily average of 3 consecutivedays (Abuiyada 2009; König 2006). Then, the systems suchas MGT, ICE, BOI_1 and BOI_2 are set in operation asshown in Figure 3. They are continuously operated duringthe winter mode. The return temperatures from the heatload to the energy facility are 60°C and 45°C, respectively.Correspondingly, the supply temperature to the building is80°C. In this mode, MGT and ICE run throughout thewinter season and the peak demand is met by BOI_1 andBOI_2. During the winter mode, the room temperature isconditioned to be set at a constant value of 22°C. In thismode, AbsChi along with CoT is shut down and CWS is notin operation (König 2006).
Transition mode The switchover to transition mode occurs when theoutside air temperature is in between 15°C and 18°C forabout 10h to 12h on a daily average of 3 consecutive days(König 2006). In general there are two transition zoneperiods in a year, the winter transition mode and the
Control strategy
The control strategy for the operation of energy facility isbased on the thermal energy demand in the buildingcomplexes. Subsequently, the electricity generated by theCHP units is mainly used for self-supply. Due to relativelylow electrical power of CHP units, electricity is fed only inrare situations in the grid. CHP units form the base load ofthe energy facility. Boilers are used during the peak loadperiod in winters. In summer, the AbsChi is put intooperation to supply the cooling energy demand. In all themodes, storages are used for peak shaving.
Modes of operation
Winter modeThe operating modes of the energy facility are typicallyclassified as follows: winter mode, transition mode, andsummer mode. The control strategy for winter mode isapplied when the outside air temperature is less than 15°C

Gopisetty and Treffinger Trigeneration at Offenburg University 31
summer transition mode. The winter transition modeoccurs mostly during the months of April and Maywhereas the summer transition mode occurs during themonths of September and October. The boilers are shutdown and only the CHP units operate throughout thisperiod. The peak shaving during this period is done bymeans of HWS and CWS. A simplified scheme of thetransition mode operation is illustrated in Figure 4.During the transition mode, the room temperature is alsodesigned to be 22°C (König 2006).
Summer modeThe control strategy for summer mode is applied whenthe outside air temperature is more than 18°C for about10h to 12h on a daily average of 3 consecutive days. Thesummer mode's cooling demand is met with the help ofAbsChi. The AbsChi is driven by thermal energygenerated at about 80°C by the CHP units, i.e., MGT andICE. Additionally, some portion of thermal energy is usedfor supplying hot water demand to the buildings inparallel to the AbsChi operation. During the off-peakload period or in the case of demand fluctuations, theexcess thermal energy produced from CHP units andAbsChi is stored in the HWS and the CWS. The summeroperation mode is shown in Figure 5. In this mode, only
AbsChi and CHP units along with the HWS, CWS, CoTare in operation. During the summer mode, the roomtemperature is designed to be considerably lower than theoutside air temperature. For example, when the outsideair temperature is 32°C then the room temperature wouldbe 28°C (König 2006).
RESULTS AND DISCUSSION
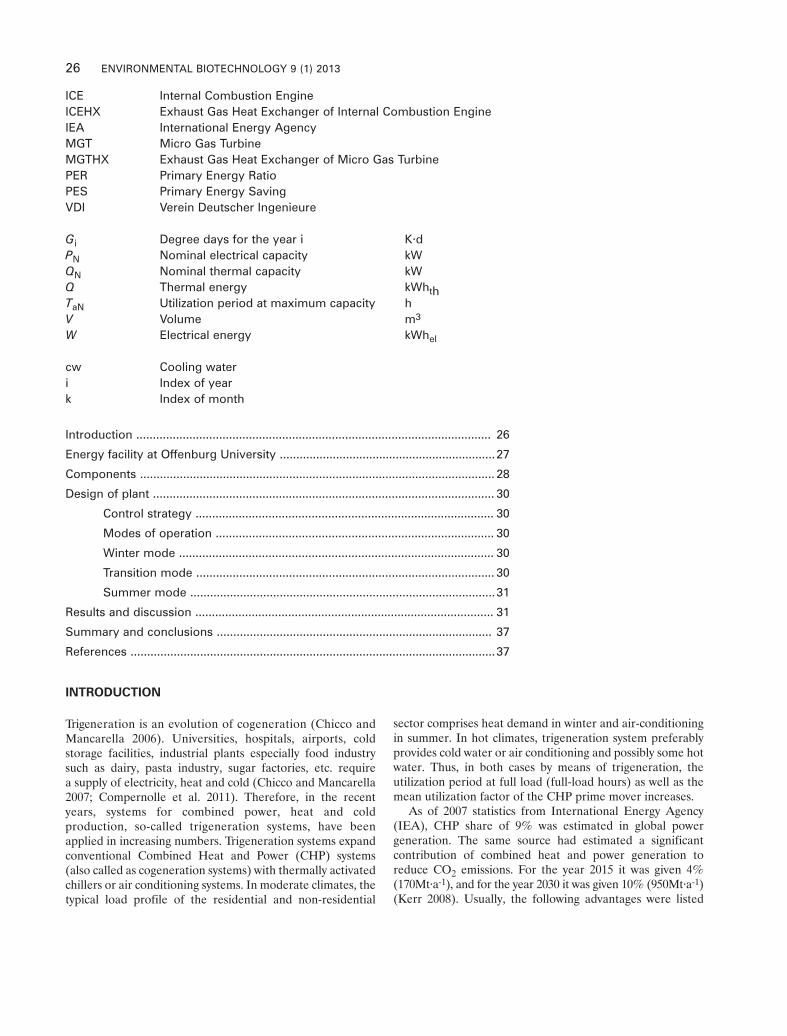
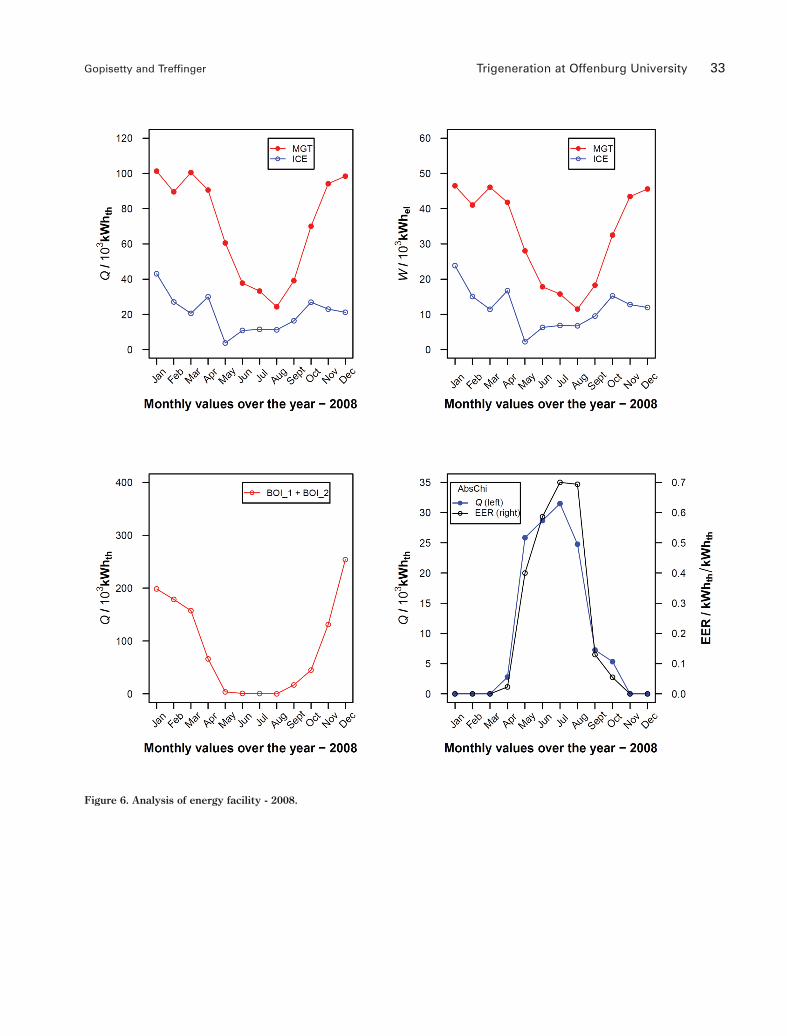
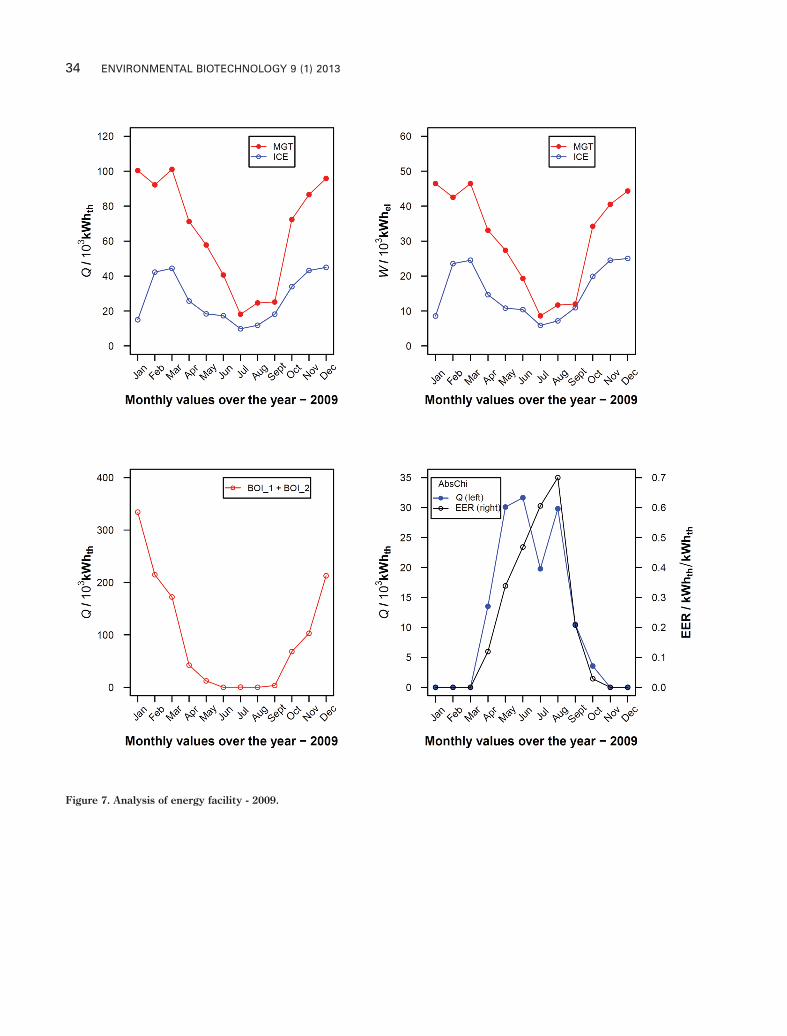
Table 3 shows the utilization periods of BOI_1, BOI_2, MGT,ICE and AbsChi. In this case, winter was considered fromJanuary until April and from October until December andsummer from May until September. Equation 1 definesdefinition of the utilization period at nominal capacity. In asimilar way, Equation 1 was formulated for BOI_2, MGT andICE. According to VDI 4608 Part 1 (VDI 2005) the utilizationperiod at nominal capacity is defined as the ratio of the quantityof energy output over a period of time to the nominal capacityof the installation. From the Table 3 it can be interpreted thatCHP units, namely, MGT and ICE had operated for longerhours. Detailed information on the operation of thecomponents on a monthly basis is shown in Figure 6, 7, 8, and9 for the years 2008 to 2011. The operation pattern during thesefour years had similarities. The CHP units were almost
Figure 4. Transition mode - simplified scheme of energy facility.

boiler load at HS OG. However, the utilization periods forBOI_1 and BOI_2 were very low as compared to the CHP unitsas the boilers were used only during the middle and peak loadconditions (see Table 3).
The lower right diagrams of Figure 6, 7, 8, and 9 showthe chilled water capacity provided by the AbsChi andalso its Energy Efficiency Ratio (EER). The EER wasestimated using the Equation 2. The EER of absorptionchiller is the ratio of usable cooling energy to the drivingthermal energy (Herold et al. 1996). It is also called asCoefficient of Performance (COP).
Qcw,i,kCOPi,k = (2)
QAbsChi,i,k
The utilization period of AbsChi was highly dependent onthe operation of building B and C until 2009, and from 2010onwards it was also dependent on operation of building D. TheAbsChi was employed only during summer and transition modedriven by thermal energy (operated with less capacity) fromMGT and ICE. The EER of AbsChi during the 4 year periodhad ranged between 0.10 and 0.84. The peak EER for this
32 ENVIRONMENTAL BIOTECHNOLOGY 9 (1) 2013
operated with higher thermal energy output in winter and withlower thermal output in summer and transition periods (seeupper left diagrams in Figure 6, 7, 8, and 9), and accordingly,the generation of electricity varies (compare upper rightdiagrams in Figure 6, 7, 8, and 9).
12
ΣQBOI_1,i,kk=1
TaN = (1)QN,BOI_1
The thermal output of the boilers is shown in the lower leftdiagrams of Figure 6, 7, 8, and 9. The operation of boilers washigh during peak winters and peak heat demand in buildings.The year 2010 had a very high peak (thermal energy output) forBOI_1 and BOI_2, it was about 400MWhth for month ofDecember. It can be attributed to very high heating degree days(G2010) of 3431 K·d and the start of complete operation ofbuilding D in 2010. BOI_1 and BOI_2 operate mostly on partload with 50% to 60% of gas input. The gas input, i.e., theamount of natural gas supply is one of the control variables for
Figure 5. Summer mode - simplified scheme of energy facility.
Gopisetty and Treffinger Trigeneration at Offenburg University 33
Figure 6. Analysis of energy facility - 2008.
34 ENVIRONMENTAL BIOTECHNOLOGY 9 (1) 2013
Figure 7. Analysis of energy facility - 2009.

Gopisetty and Treffinger Trigeneration at Offenburg University 35
Figure 8. Analysis of energy facility – 2010.
36 ENVIRONMENTAL BIOTECHNOLOGY 9 (1) 2013
Figure 9. Analysis of energy facility – 2011.

Gopisetty and Treffinger Trigeneration at Offenburg University 37
energy plant of Hochschule Offenburg. Master Sc. Thesis. 97 p.Offenburg University of Applied Sciences, Germany.
Angrisani, G., A. Rosato, C. Roselli, M. Sasso, C. Sibilio. 2012.Experimental results of a micro-trigeneration installation.Applied Thermal Engineering 38: 78-90.
Cervone, A., D.Z. Romito, E. Santini. 2011. Technical and economicanalysis of a Micro-Tri/Cogeneration system with reference to theprimary power source in a shopping center. InternationalConference on Clean Electrical Power. IEEE ConferencePublications: 439-445.
Carvalho, M., M.A. Loranzo, L.M. Serra, V. Wohlgemuth. 2012.Modeling simple trigeneration systems for the distribution ofenvironmental loads. Environmental Modeling and Software 30:71-80.
Chicco, G., P. Mancarella. 2006. From cogeneration to trigeneration:profitable alternatives in a competitive market. IEEETransactions on Energy Conversion 1: 265-272.
Chicco, G., P. Mancarella. 2007. Trigeneration primary energy savingevaluation for energy planning and policy development. EnergyPolicy 35: 6132-6144.
Compernolle, T., N. Witters, S. Van Passel, T. Thewys. 2011. Analyzinga self-managed CHP system for greenhouse cultivation as a protable way to reduce CO2-emissions. Energy 36: 1940-1947.
DIN. 2003. Heating systems in buildings - method for calculation ofthe design heat load. DIN 12831. German Institute forStandardization (DIN): 1-73.
Easaw, R., P. Muley. 2010a. Micro-Trigeneration: the best way fordecentralized power, cooling and heating. InnovativeTechnologies for an Efficient and Reliable Electricity Supply(CITRES). IEEE Conference Publications: 459-466.
Easaw, R., P. Muley. 2010b. Comparative study of energyperformance for two mCCHP systems used in domesticresidence. International Symposium on Electrical and ElectronicsEngineering. IEEE Conference Publications: 321-326.
Gopisetty, S., P. Treffinger. 2013. Energy analysis of Trigenerationbased on scarce data. 10th International Conference on theEuropean Energy Market (EEM). Stockholm, Sweden: IEEE,Inc.: 1-7.
Herold, K.E., R. Radermacher, S.A. Klein. 1996. Absorption Chillersand Heat Pumps. 350 p. CRC Press, Inc.
Kavvadias, K.C., A.P. Tosios, Z.B. Maroulis. 2010. Design of acombined, heating, cooling and power system: sizing, operationstrategy selection and parametric analysis. Energy Conversionand Management 51: 833-845.
Kerr, T. 2008. Combined Heat and Power: Evaluating the Benefits ofGreater Global Investment. 34 p. International Energy AgencyPublications. Paris, France.
König, W. 2006. Funktionsbeschreibung der Regelung undSteuerung: Fachhochschule Offenburg Sanierung Heizung/Kälte,Lüftung, Regelung. 122 p. Ing.-Büro Wolgang König.
Rocha, M.S., R. Andreos, J.R. Simões-Moreira. 2012. Performancetests of two small trigeneration pilot plants. Applied ThermalEngineering 41: 84-91.
Santo, D.B.E. 2012. Energy and energy efficiency of a buildinginternal combustion engine trigeneration system under twodifferent operational strategies. Energy and Buildings 53: 28-38.
VDI. 1996. Cooling load calculation of air-conditioned rooms. VDI2078. 159 p. Association of German Engineers.
VDI. 2005. Energy systems - combined heat and power - Terms,definitions, examples. VDI 4608, Part 1. 19 p. Association ofGerman Engineers.
Zhou, Z., P. Liu, Z. Li, W. Ni. 2012. An engineering approach to theoptimal design of distributed energy systems in China. AppliedThermal Engineering 53: 387-396.
period was obtained during the months of July and Augustwhich happens to be the hottest period of summer in Germany.During the 4 year analysis period, the EER trend was relativelydifferent in the year 2010 which can be seen in the lower rightdiagram of Figure 8. Typically, the cooling started from themonths of March/April and ended by September/October. Inthe year 2010, it was quite different as there was a steepincreasing slope from May which had reached maximum in Julyfollowed by an immediate decreasing slope. This effect couldpossibly be the influence of the cooling control strategies of thenew building D which has to be studied and analyzed more indetail corresponding to external and internal parameters.However, the utilization period for the year 2010 was 693hwhich is quite high.
SUMMARY AND CONCLUSIONS
Monitoring and data analysis for the trigeneration system wascarried out for a 4 year period to gain understanding regardingthe behavior and performance of the energy facility underdynamic conditions such as increasing number of students,dynamic climate and continuous retrofitting of buildings. Theplant was working properly during this period, that is, theenergy facility was able to provide necessary thermal energyand a part of electrical energy for the building complexes atHS OG with high utilization periods. Also, the reliability of theplant had been quite satisfying so far. Employing trigenerationprocess helps in promoting the concept of decentralizedenergy system and also renewable energy production near thedemand site. HS OG had implemented the trigenerationsystem at its university campus to promote the concept ofdecentralized energy system.
The next step is to extend the monitoring and data analysisto develop a method for energy analysis based on scarce dataas the data available to conduct detailed analysis is limited inthe case of HS OG (Gopisetty and Treffinger 2013). It is alsointended to carry out an energy and economic analysis for thetrigeneration system to understand energy and economicsavings in detail.
ACKNOWLEDGEMENTS
This study is a part of “KleE” project which was funded by theBaden-Württemberg Ministry of Science, Research and Arts(MWK). More information at https://www.klee.uni-freiburg.de/.
RE FE REN CES
Abuiyada, G.S.S. 2009. Verification of design and system operationmodes by elaborating a detailed technical description of the