combined anaerobic and aerobic digestion for increased solids reduction and nitrogen removal
TRANSCRIPT
wat e r r e s e a r c h 4 5 ( 2 0 1 1 ) 6 1 8e6 2 4
Avai lab le at www.sc iencedi rect .com
journa l homepage : www.e lsev ier . com/ loca te /wat res
Combined anaerobic and aerobic digestion for increasedsolids reduction and nitrogen removal
John T. Novak a,*, Sarita Banjade a, Sudhir N. Murthy b
aDepartment of Civil & Environmental Engineering, Virginia Tech, Blacksburg, VA 24061, United StatesbDC Water & Sewer Authority, Washington DC 20032, United States
a r t i c l e i n f o
Article history:
Received 5 April 2010
Received in revised form
13 July 2010
Accepted 10 August 2010
Available online 17 August 2010
Keywords:
Sludge treatment
Nitrogen removal
Anaerobic digestion
Aerobic digestion
* Corresponding author. Tel.: þ1 540 231 613E-mail address: [email protected] (J.T. Novak)
0043-1354/$ e see front matter ª 2010 Elsevdoi:10.1016/j.watres.2010.08.014
a b s t r a c t
A unique sludge digestion system consisting of anaerobic digestion followed by aerobic
digestion and then a recycle step where thickened sludge from the aerobic digester was
recirculated back to the anaerobic unit was studied to determine the impact on volatile
solids (VS) reduction and nitrogen removal. It was found that the combined anaerobic/
aerobic/anaerobic (ANA/AER/ANA) system provided 70% VS reduction compared to 50% for
conventional mesophilic anaerobic digestion with a 20 day SRT and 62% for combined
anaerobic/aerobic (ANA/AER) digestion with a 15 day anaerobic and a 5 day aerobic SRT.
Total Kjeldahl nitrogen (TKN) removal for the ANA/AER/ANA system was 70% for sludge
wasted from the aerobic unit and 43.7% when wasted from the anaerobic unit. TKN
removal was 64.5% for the ANA/AER system.
ª 2010 Elsevier Ltd. All rights reserved.
1. Introduction reduction and coliform destruction with the combined system
Minimization of sludge generated fromwastewater treatment
plants is of interest because of the cost, health concerns and
environmental factors associated with the transport and
disposal of biosolids. Under 40 CFR 503 Part (b) sludge reuse
and disposal regulations (U.S EPA, 1992), specific levels of
treatment of sludge are required for pathogen deactivation
prior to land application. One of the major processes for
achieving acceptability for land application is anaerobic
digestion. While this process is effective for reducing patho-
gens and destroying organic matter, solids reduction above
50% is often difficult to achieve. For this reason, advanced
digestion processes have gained interest in recent years.
Combined anaerobic and aerobic digestion has been
investigated by several researchers. Pagilla et al., (2000)
investigated the use of a thermophilic aerobic pretreatment
stage prior to anaerobic digestion and found improved solids
2; fax: þ1 540 231 7916.ier Ltd. All rights reserve
compared to anaerobic digestion alone. They also saw better
dewatering properties for the pretreated sludges. Akunna
et al., (1994) investigated the combined anaerobiceaerobic
treatment of synthetic wastewater and found that the COD in
anaerobic effluent from an upflow filter could be degraded an
additional 30% by aerobic treatment. Subramanian et al.,
(2007) conducted batch aerobic digestion studies for anaero-
bically digested sludges’ and found that, in addition to
increased solids reduction, sludge dewatering properties
improved.
Recent research in our laboratory has focused on combined
anaerobic/aerobic sludge digestion. There are many advan-
tages to combined anaerobic/aerobic sludge digestion and
these include better solids reduction, improved sludge dew-
atering properties and reduction of nitrogen (Kumar et al.,
2006). The combination of both an anaerobic and an aerobic
step seems to provide for additional solids reduction that is
d.
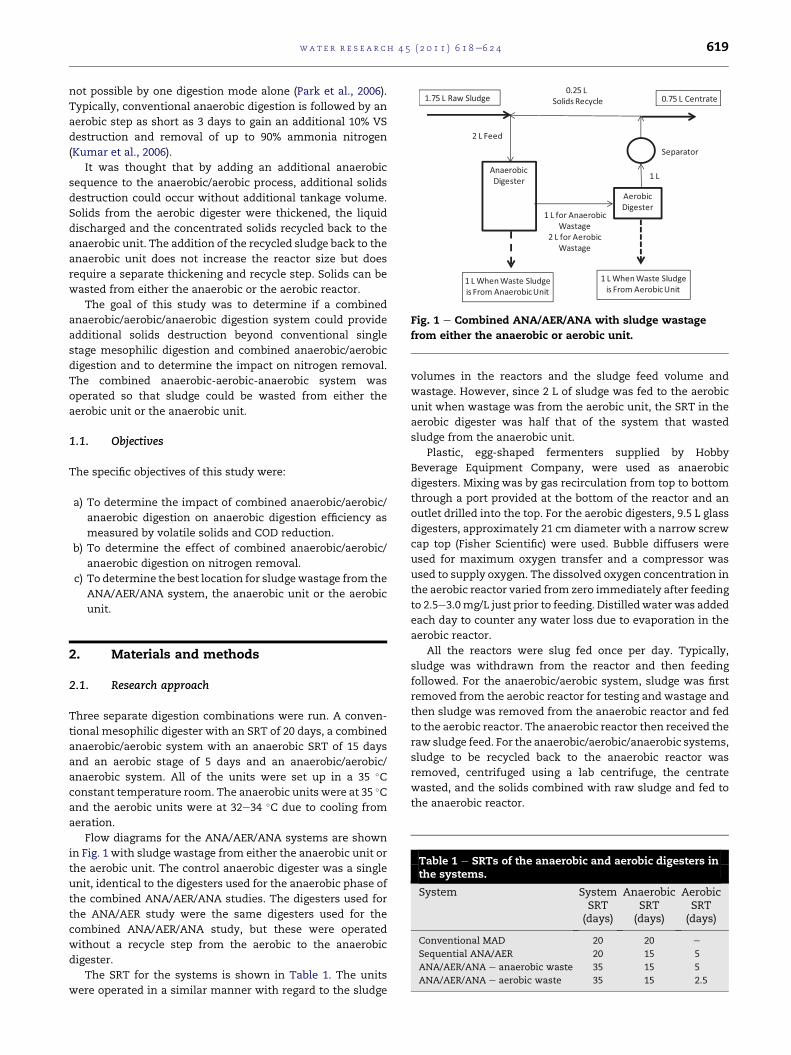
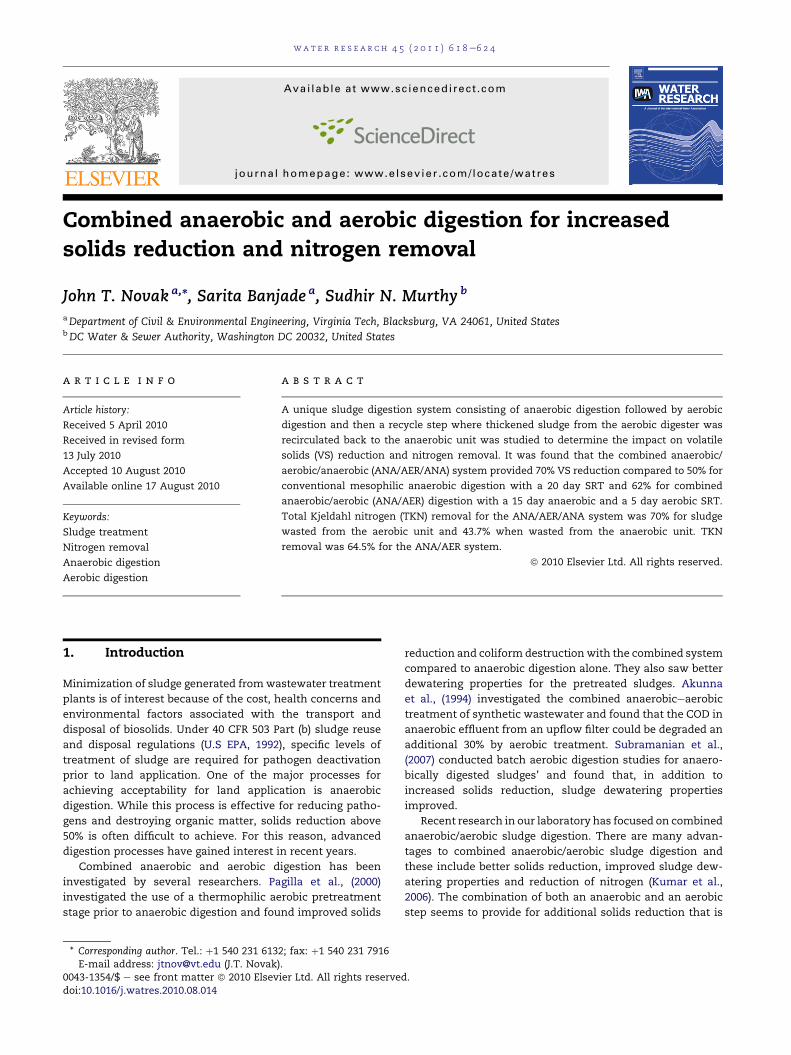
Fig. 1 e Combined ANA/AER/ANA with sludge wastage
from either the anaerobic or aerobic unit.
wat e r r e s e a r c h 4 5 ( 2 0 1 1 ) 6 1 8e6 2 4 619
not possible by one digestion mode alone (Park et al., 2006).
Typically, conventional anaerobic digestion is followed by an
aerobic step as short as 3 days to gain an additional 10% VS
destruction and removal of up to 90% ammonia nitrogen
(Kumar et al., 2006).
It was thought that by adding an additional anaerobic
sequence to the anaerobic/aerobic process, additional solids
destruction could occur without additional tankage volume.
Solids from the aerobic digester were thickened, the liquid
discharged and the concentrated solids recycled back to the
anaerobic unit. The addition of the recycled sludge back to the
anaerobic unit does not increase the reactor size but does
require a separate thickening and recycle step. Solids can be
wasted from either the anaerobic or the aerobic reactor.
The goal of this study was to determine if a combined
anaerobic/aerobic/anaerobic digestion system could provide
additional solids destruction beyond conventional single
stage mesophilic digestion and combined anaerobic/aerobic
digestion and to determine the impact on nitrogen removal.
The combined anaerobic-aerobic-anaerobic system was
operated so that sludge could be wasted from either the
aerobic unit or the anaerobic unit.
1.1. Objectives
The specific objectives of this study were:
a) To determine the impact of combined anaerobic/aerobic/
anaerobic digestion on anaerobic digestion efficiency as
measured by volatile solids and COD reduction.
b) To determine the effect of combined anaerobic/aerobic/
anaerobic digestion on nitrogen removal.
c) To determine the best location for sludgewastage from the
ANA/AER/ANA system, the anaerobic unit or the aerobic
unit.
Table 1 e SRTs of the anaerobic and aerobic digesters inthe systems.
System SystemSRT(days)
AnaerobicSRT(days)
AerobicSRT(days)
Conventional MAD 20 20 e
Sequential ANA/AER 20 15 5
ANA/AER/ANA e anaerobic waste 35 15 5
ANA/AER/ANA e aerobic waste 35 15 2.5
2. Materials and methods
2.1. Research approach
Three separate digestion combinations were run. A conven-
tional mesophilic digester with an SRT of 20 days, a combined
anaerobic/aerobic system with an anaerobic SRT of 15 days
and an aerobic stage of 5 days and an anaerobic/aerobic/
anaerobic system. All of the units were set up in a 35 �Cconstant temperature room. The anaerobic units were at 35 �Cand the aerobic units were at 32e34 �C due to cooling from
aeration.
Flow diagrams for the ANA/AER/ANA systems are shown
in Fig. 1 with sludge wastage from either the anaerobic unit or
the aerobic unit. The control anaerobic digester was a single
unit, identical to the digesters used for the anaerobic phase of
the combined ANA/AER/ANA studies. The digesters used for
the ANA/AER study were the same digesters used for the
combined ANA/AER/ANA study, but these were operated
without a recycle step from the aerobic to the anaerobic
digester.
The SRT for the systems is shown in Table 1. The units
were operated in a similar manner with regard to the sludge
volumes in the reactors and the sludge feed volume and
wastage. However, since 2 L of sludge was fed to the aerobic
unit when wastage was from the aerobic unit, the SRT in the
aerobic digester was half that of the system that wasted
sludge from the anaerobic unit.
Plastic, egg-shaped fermenters supplied by Hobby
Beverage Equipment Company, were used as anaerobic
digesters. Mixing was by gas recirculation from top to bottom
through a port provided at the bottom of the reactor and an
outlet drilled into the top. For the aerobic digesters, 9.5 L glass
digesters, approximately 21 cm diameter with a narrow screw
cap top (Fisher Scientific) were used. Bubble diffusers were
used for maximum oxygen transfer and a compressor was
used to supply oxygen. The dissolved oxygen concentration in
the aerobic reactor varied from zero immediately after feeding
to 2.5e3.0mg/L just prior to feeding. Distilledwater was added
each day to counter any water loss due to evaporation in the
aerobic reactor.
All the reactors were slug fed once per day. Typically,
sludge was withdrawn from the reactor and then feeding
followed. For the anaerobic/aerobic system, sludge was first
removed from the aerobic reactor for testing and wastage and
then sludge was removed from the anaerobic reactor and fed
to the aerobic reactor. The anaerobic reactor then received the
raw sludge feed. For the anaerobic/aerobic/anaerobic systems,
sludge to be recycled back to the anaerobic reactor was
removed, centrifuged using a lab centrifuge, the centrate
wasted, and the solids combined with raw sludge and fed to
the anaerobic reactor.
wat e r r e s e a r c h 4 5 ( 2 0 1 1 ) 6 1 8e6 2 4620
For mixing in the anaerobic digesters, peristaltic pumps
(Cole Parmer 6e600 rpm)were used to recirculate gas from the
headspace to the bottom of the digesters. The pumps were
operated at 50% of their maximum speed. To ensure greater
mixing of the digesters before and after feeding, gas recircu-
lation in the digesters was increased by increasing the speed
of the pumps to 100% for 10 min before sampling and also for
10 min after feeding.
The anaerobic digesters were seeded with mesophilic
anaerobically digested sludge taken from Pepper’s Ferry
Regional Wastewater Treatment Facility, Radford, Virginia,
USA. The digesters were monitored for steady-state. Steady-
state was determined to have been reached when the VS
reduction and gas production showed less than 5% variation.
Once steady-state occurred, complete sampling and analysis
took place.
The feed for the anaerobic digester was a mixture of
primary and secondary sludge (gravity thickened sludge and
air flotation thickened waste activated sludge). The sludge
was supplied weekly by DCWASA Blue Plains Advanced
Wastewater Treatment Facility and shipped overnight. Total
solids percentages of both the sludges’ were measured and
a mixture of 1:1 by weight of the sludges with a total solid
percentage of 5% was made by dilution. The sludge was
blended and was stored in a 4 �C room until used. Tomaintain
the SRT of both the anaerobic and aerobic digesters, constant
volume was maintained and same amount of sludge was fed
and wasted daily from the digesters. The daily biogas
production by the anaerobic digesters was measured using
a RebelTM wet-tip gas flow meters.
2.2. Analytical methods
Liquid samples were analyzed for total solids (TS), volatile
solids (VS), pH, total Kjeldahl nitrogen (TKN), and ammonium
(NH3-N), according to Standard Methods (APHA, 1998). An ORP
probe (Model 96-78-BN) was used to measure oxida-
tionereduction potential of the aerobic digesters.
The oxidationereduction potential (ORP) was measured
using an ORP probe (Model 96-78-BN).
40
45
50
55
60
0 25 50 75 100 125 150 175 200
)%(
noitcudeR
sdiloSelitalo
V
Time (days after reaching steady state)
MAD (20d SRT) Average VSR 20d SRT (50%)
Fig. 2 e Volatile solids removal data for the control
digester.
3. Results and discussion
3.1. Performance of the digesters
Lab-scale anaerobic and aerobic digestion systems were
operated to determine the performance of anaerobic digestion
followed by aerobic digestion and aerobic/anaerobic diges-
tion. The analyses were performed after determination of
steady-state conditions andwere evaluated bymonitoring pH,
biogas production and solids removal. Different performance
parameters such as volatile solids destruction, COD removal,
nitrogen removal, biogas production and VFA production and
destruction were measured. VFA and biogas data are not
included in this paper, but were consistent with the volatile
solids removal data. All the digesters performed well during
the steady-state phases.
3.1.1. Volatile solids reductionA mixture of primary and secondary sludge in a ratio of 1 to 1
by dry solids from the DC Water and Sewer Authority was
anaerobically digested in a constant temperature room at
35 �C to determine the volatile solids reduction. The single
stage mesophilic (control) digester data operated at a 20 day
SRT is shown in Fig. 2. It can be seen that the average volatile
solids reduction (VSR) was 50% over a period of approximately
6 months of operation. Variations were expected because of
variations in the feed solids.
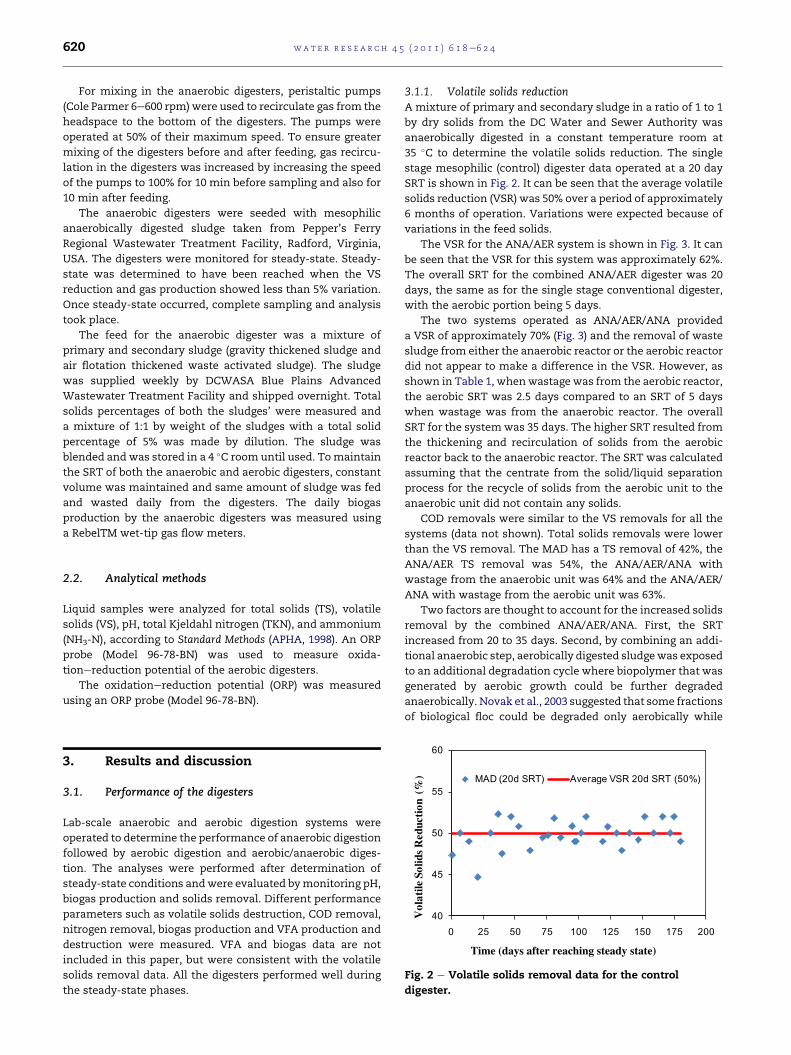
The VSR for the ANA/AER system is shown in Fig. 3. It can
be seen that the VSR for this system was approximately 62%.
The overall SRT for the combined ANA/AER digester was 20
days, the same as for the single stage conventional digester,
with the aerobic portion being 5 days.
The two systems operated as ANA/AER/ANA provided
a VSR of approximately 70% (Fig. 3) and the removal of waste
sludge from either the anaerobic reactor or the aerobic reactor
did not appear to make a difference in the VSR. However, as
shown in Table 1, whenwastage was from the aerobic reactor,
the aerobic SRT was 2.5 days compared to an SRT of 5 days
when wastage was from the anaerobic reactor. The overall
SRT for the systemwas 35 days. The higher SRT resulted from
the thickening and recirculation of solids from the aerobic
reactor back to the anaerobic reactor. The SRT was calculated
assuming that the centrate from the solid/liquid separation
process for the recycle of solids from the aerobic unit to the
anaerobic unit did not contain any solids.
COD removals were similar to the VS removals for all the
systems (data not shown). Total solids removals were lower
than the VS removal. The MAD has a TS removal of 42%, the
ANA/AER TS removal was 54%, the ANA/AER/ANA with
wastage from the anaerobic unit was 64% and the ANA/AER/
ANA with wastage from the aerobic unit was 63%.
Two factors are thought to account for the increased solids
removal by the combined ANA/AER/ANA. First, the SRT
increased from 20 to 35 days. Second, by combining an addi-
tional anaerobic step, aerobically digested sludgewas exposed
to an additional degradation cycle where biopolymer that was
generated by aerobic growth could be further degraded
anaerobically. Novak et al., 2003 suggested that some fractions
of biological floc could be degraded only aerobically while
0
1000
2000
3000
4000
5000
6000
7000
Operating Time (days)
)L/
N-
gm
(N
KT
0
20
40
60
80
100
la
vo
me
RN
KT
%
TKN in Anaerobic Digester
TKN in Aerobic Digester
% TKN Removal
0 605040302010
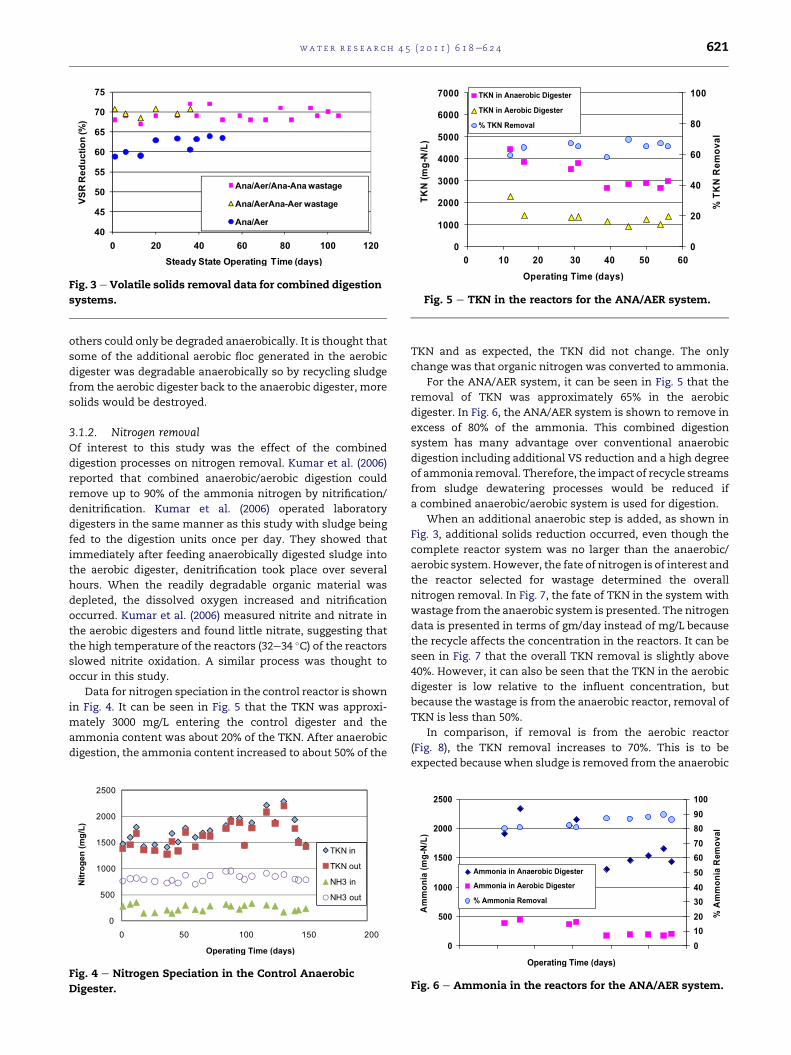
Fig. 5 e TKN in the reactors for the ANA/AER system.
40
45
50
55
60
65
70
75
0 20 40 60 80 100 120
)%
( n
oit
cu
de
R R
SV
Steady State Operating Time (days)
Ana/Aer/Ana-Ana wastage
Ana/AerAna-Aer wastage
Ana/Aer
Fig. 3 e Volatile solids removal data for combined digestion
systems.
wat e r r e s e a r c h 4 5 ( 2 0 1 1 ) 6 1 8e6 2 4 621
others could only be degraded anaerobically. It is thought that
some of the additional aerobic floc generated in the aerobic
digester was degradable anaerobically so by recycling sludge
from the aerobic digester back to the anaerobic digester, more
solids would be destroyed.
3.1.2. Nitrogen removalOf interest to this study was the effect of the combined
digestion processes on nitrogen removal. Kumar et al. (2006)
reported that combined anaerobic/aerobic digestion could
remove up to 90% of the ammonia nitrogen by nitrification/
denitrification. Kumar et al. (2006) operated laboratory
digesters in the same manner as this study with sludge being
fed to the digestion units once per day. They showed that
immediately after feeding anaerobically digested sludge into
the aerobic digester, denitrification took place over several
hours. When the readily degradable organic material was
depleted, the dissolved oxygen increased and nitrification
occurred. Kumar et al. (2006) measured nitrite and nitrate in
the aerobic digesters and found little nitrate, suggesting that
the high temperature of the reactors (32e34 �C) of the reactors
slowed nitrite oxidation. A similar process was thought to
occur in this study.
Data for nitrogen speciation in the control reactor is shown
in Fig. 4. It can be seen in Fig. 5 that the TKN was approxi-
mately 3000 mg/L entering the control digester and the
ammonia content was about 20% of the TKN. After anaerobic
digestion, the ammonia content increased to about 50% of the
0
500
1000
1500
2000
2500
0 50 100 150 200
Nitro
gen
(m
g/L
)
Operating Time (days)
TKN in
TKN out
NH3 in
NH3 out
Fig. 4 e Nitrogen Speciation in the Control Anaerobic
Digester.
TKN and as expected, the TKN did not change. The only
change was that organic nitrogen was converted to ammonia.
For the ANA/AER system, it can be seen in Fig. 5 that the
removal of TKN was approximately 65% in the aerobic
digester. In Fig. 6, the ANA/AER system is shown to remove in
excess of 80% of the ammonia. This combined digestion
system has many advantage over conventional anaerobic
digestion including additional VS reduction and a high degree
of ammonia removal. Therefore, the impact of recycle streams
from sludge dewatering processes would be reduced if
a combined anaerobic/aerobic system is used for digestion.
When an additional anaerobic step is added, as shown in
Fig. 3, additional solids reduction occurred, even though the
complete reactor system was no larger than the anaerobic/
aerobic system. However, the fate of nitrogen is of interest and
the reactor selected for wastage determined the overall
nitrogen removal. In Fig. 7, the fate of TKN in the system with
wastage from the anaerobic system is presented. The nitrogen
data is presented in terms of gm/day instead of mg/L because
the recycle affects the concentration in the reactors. It can be
seen in Fig. 7 that the overall TKN removal is slightly above
40%. However, it can also be seen that the TKN in the aerobic
digester is low relative to the influent concentration, but
because the wastage is from the anaerobic reactor, removal of
TKN is less than 50%.
In comparison, if removal is from the aerobic reactor
(Fig. 8), the TKN removal increases to 70%. This is to be
expected because when sludge is removed from the anaerobic
0
500
1000
1500
2000
2500
Operating Time (days)
)L/
N-
gm
(ai
no
mm
A
0
10
20
30
40
50
60
70
80
90
100
la
vo
me
Rai
no
mm
A%
Ammonia in Anaerobic Digester
Ammonia in Aerobic Digester
% Ammonia Removal
Fig. 6 e Ammonia in the reactors for the ANA/AER system.

0
500
1000
1500
2000
2500
3000
3500
4000
4500
Operating Time (days)
)d
ee
f f
o L/
d/g
m(
ne
go
rti
N
Influent TKN (mg/d/L)
Effluent TKN (mg/d/L)
Influent Amm (mg/d/L)
Effluent Amm (mg/d/L)
0 10080604020
Fig. 9 e Influent TKN and ammonia from the systemwith
wastage fromtheanaerobic reactor inunits ofmg/d/L of feed.
0
1000
2000
3000
4000
5000
6000
Operating Time (days)
)y
ad/
N-
gm
(N
KT
0
20
40
60
80
100
la
vo
me
RN
KT
%
TKN in feed
TKN in Ana Dig
TKN in Aer Dig
% TKN Removal
0 80604020 100
Fig. 7 e TKN removal from ANA/AER/ANA system with
sludge wastage from the anaerobic reactor.
wat e r r e s e a r c h 4 5 ( 2 0 1 1 ) 6 1 8e6 2 4622
digester, feed sludge that has not undergone aerobic digestion
is part of the material that is wasted. When sludge is wasted
from the aerobic digester, all sludge in the waste stream has
undergone some degree of aeration. In addition, more TKN is
converted to ammonia andmore of the ammonia is converted
to nitrogen gas.
It can also be seen from the data in Figs. 7 and 8 that the
concentration of TKN in the aerobic reactor is lower in the
system which has wastage from the anaerobic reactor while
the TKN is higher in the system where wastage occurs from
the aerobic reactor. In Table 1, it can be seen that the SRT in
the aerobic reactor is lower for the system which undergoes
wastage from the aerobic system. It may be that additional
TKN removal could occur if the aerobic reactor was operated
at 5 days instead of 2.5 days. No attempt was made to assess
the impact of varying SRT’s for the systems that were studied
in this research. The approach in this study was to make the
overall volume of the reactors the same, although the
combined systems used two reactors instead of one.
The data in Figs. 9 and 10 also provide for a comparison of
the wastage from the two systems. In Fig. 9, the nitrogen data
is shown for wastage from the anaerobic unit and in Fig. 10,
nitrogen in the wastage from the aerobic unit can be seen. The
major difference in is the effluent TKN and effluent ammonia.
Recent data from out lab suggests that the removal of
ammonia in the aerobic digester can be improved by
0
1000
2000
3000
4000
5000
6000
7000
Operating Time (days)
)y
ad/
gm
(N
KT
0
20
40
60
80
100
la
vo
me
RN
KT
%
TKN in feed
TKN in Aer Dig
% TKN Removal
0 10 3020 40
Fig. 8 e TKN removal from ANA/AER/ANA system with
sludge wastage from the aerobic reactor.
continuous feeding and by cycling air on and off. Ammonia
concentrations of 100e150mg/L have been obtained using this
approach. If the ammonia removal process was optimized,
TKN concentrations of 600e700 mg/L could be expected and
this would increase the overall TKN removal from the system
with wastage from the aerobic digester to 80% andmost of the
remaining TKNwould be relatively non-biodegradable organic
nitrogen. Nitrate and nitrite were measured several times in
the aerobic reactor just before feeding from the anaerobic unit
andwere always below the detection limit of 0.1mg/Lwhich is
consistent with the data of Kumar et al., 2006.
The oxidationereduction potential (ORP) over one cycle of
the aerobic digester was measured and the data are shown in
Table 2. These data are for the system with wastage from the
aerobic unit. It can be seen from the data that the ORP declines
for the first 7 h after feeding and then increases to amaximum
at 24 h when feeding again takes place. Nitrogen data indicate
that ammonia is converted to nitrite and then to nitrogen gas.
Nitrate production is minimal. The data in Table 2 also indi-
cate that readily degradable organic matter enters the aerobic
digester and is rapidly degraded over the first 4e8 h.
The unique characteristics of the combined anaerobic/
aerobic system provided optimal conditions for both nitrogen
0
500
1000
1500
2000
2500
3000
3500
4000
4500
Operating Time (days)
)d
ee
ff
oL
/d
/g
m(
ne
go
rt
iN
Influent TKN (mg/d/L)
Effluent TKN (mg/d/L)
Influent Amm (mg/d/L)
Efflent Amm (mg/d/L)
0 10 20 30
Fig. 10 e Influent TKN and ammonia from the system with
wastage from the aerobic reactor in units of mg/d/L of feed.

Table 2 e Oxidationereduction potential in the aerobicdigester after feeding from the anaerobic digester.
Time after Feeding (h) ORP (mV)
0 240
1 �114
2 �173
3 �200
4 �270
5 �288
6 �287
7 �87
8 �25
9 �58
17 15
18 20
19 24
20 40
21 83
22 188
23 238
24 230
wat e r r e s e a r c h 4 5 ( 2 0 1 1 ) 6 1 8e6 2 4 623
and solids removal. With regard to nitrogen removal, the
increased solids destruction resulted in more conversion of
organic nitrogen to ammonia. The ammonia was oxidized to
nitrite effectively in the aerobic digester, but conversion to
nitratewas slowed by the operational temperature of 32e34 �Cwhich has been shown to limit nitrite oxidation (Hellinga
et al., 1998). It is thought that combined nitrification/denitri-
fication occurs in the aerobic digester in the 6e8 h after the
feeding cycle when the ORP drops to less than �100 mv (Zeng
et al., 2004).
3.2. Summary
Anaerobic digesters were operated using three anaerobic/
aerobic combinations and these were compared to a conven-
tional mesophilic anaerobic digester. The parameters of
interestwere volatile solids reduction and nitrogen removal. It
was found that conventional anaerobic digestionwith a 20 day
SRT resulted in 50%VS reduction for sludge from theDCWater
and Sewer Authority. When a combined anaerobic/aerobic
digestion system was used, the Vs destruction increased to
62%. When a recycle step was added in which sludge from the
aerobic digester was concentrated and returned to the anaer-
obic unit, VS destruction increased to 70%.
TKN removal in the anaerobic/aerobic unit was approxi-
mately 65%. For the ANA/AER/ANA systems, nitrogen removal
depended on the unit fromwhich sludgewaswasted. If sludge
was wasted from the anaerobic unit, TKN removal was
approximately 45%, but if wastage was from the aerobic unit,
it was approximately 70%. Data from other studies suggest
that nitrogen removal can be improved in the ANA/AER/ANA
system by increasing the SRT in the aerobic unit, providing
continuous feeding and cycling air on and off. Additional
research is needed to optimize this process.
Overall, the combination of ANA/AER/ANA digestion
appears to be a cost effective approach to achieve high VS
destruction and effective ammonia removal from digested
sludge. In addition, data from Banjade, (2008) indicates that
the sludge dewatering properties for this system are better
than for conventional anaerobic digestion and odors are
greatly reduced.
4. Conclusions
This study was conducted to compare the performance of
combined anaerobic/aerobic digestion systems to conven-
tional mesophilic anaerobic digestion. In particular, it was of
interest to evaluate a digestion subsystem in which anaerobic
digestion was followed by aerobic digestion and then some of
the aerobically digested sludge was thickened and recycled
back to the anaerobic unit. Based on the data collected, the
following conclusions are drawn:
1. Combined anaerobic/aerobic digestion increased VS
reduction from 50% to 62% using the same overall SRT and
the conventional digester. TKN removal was approximately
65%.
2. For the combined anaerobic/aerobic/anaerobic digestion
system, VS destruction was 70% compared to the conven-
tional digester at 50%.
3. For the ANA/AER/ANA system with wastage from the anaer-
obic unit, TKN removalwas approximately 45%but increased
to 70%when sludge was wasted from the aerobic unit.
Acknowledgements
Support for this study was provided by the District of
ColumbiaWater and Sewer Authority. The assistance of Chris
Wilson and Charan Tanneru with laboratory operation and
analysis is gratefully acknowledged.
r e f e r e n c e s
Akunna, J., Bizeau, C., Moletta, R., Bernet, N., Heduit, A., 1994.Combined organic carbon and complete nitrogen removalusing anaerobic and aerobic upflow filters. Water Sci. Technol.30 (12), 297e306.
American Public Health Association, 1998. In: Clesceri, L.S.,Greenberg, A.E., Eaton, A.D. (Eds.), Standard Methods forExamination of Water and Wastewater, twentieth ed.American Public Health Association, Washington, D.C.
Banjade, S., 2008. Anaerobic/Aerobic Digestion for EnhancedSolids and Nitrogen Removal. M.S. Thesis. Virginia PolytechnicInstitute & State University, Blacksburg, VA, USA.
Hellinga, C., Mulder, J.W., van Loosdrecht, M.C.M., Schellen, A.A.J.C., 1998. The SHARON process: an innovative method fornitrogen removal from ammonium-rich waste water. WaterSci. Technol. 37 (9), 135e142.
Kumar, N., Novak, J.T., Murthy, S.N., 2006. Sequential Anaerobic-Aerobic Digestion for Enhanced Volatile Solids Reduction andNitrogen Removal WEF Residuals and Biosolids ManagementConference 2006, Cincinnati, OH, March 12e14, 2006.
Novak, J.T., Sadler, M.E., Murthy, S.N., 2003. Mechanisms of flocdestruction during anaerobic and aerobic digestion and the
wat e r r e s e a r c h 4 5 ( 2 0 1 1 ) 6 1 8e6 2 4624
effect on conditioning and dewatering of biosolids. Water Res.37 (13), 3136e3144.
Pagilla, K.R., Kim, H., Cheunbarn, T., 2000. Aerobic thermophilicand anaerobic mesophilic treatment of swine waste. WaterRes. 34 (10), 2747e2753.
Park, C., Abu-Orf, M.M., Novak, J.T., 2006. Predicting thedigestability of waste activated sludges. Water Environ. Res.78 (1), 59e68.
Subramanian, S., Kumar, N., Murthy, S., Novak, J.T., 2007. Effect ofanaerobic digestion and anaerobic/aerobic digestion
processes on sludge dewatering. J. Residuals Sci. Technol. 4 (1),17e24.
US EPA, 1992. Environmental Regulations and Technology:Control of Pathogens and Vector Attraction in SewageSludge Under 40 Cfr Part 503. EPA/625/R-92/013,Washington, DC.
Zeng, R.J., Lemaire, R., Yuan, Z., Keller, J., 2004. A novelwastewater treatment process: simultaneous nitrification,denitrification and phosphorus removal. Water Sci. Technol.50 (10), 163e170.