combined alkaline and ultrasound pre-treatment of thickened pulp mill waste activated sludge for...
TRANSCRIPT

ww.sciencedirect.com
b i om a s s an d b i o e n e r g y 4 6 ( 2 0 1 2 ) 7 5 0e7 5 6
Available online at w
ht tp: / /www.elsevier .com/locate/biombioe
Combined alkaline and ultrasound pre-treatment of thickenedpulp mill waste activated sludge for improved anaerobicdigestion
Nathan D. Park, Steve S. Helle, Ronald W. Thring*
Department of Environmental Science and Engineering, UNBC, 3333 University Way, Prince George, British Columbia, Canada V2N 4Z9
a r t i c l e i n f o
Article history:
Received 3 December 2011
Received in revised form
15 May 2012
Accepted 17 May 2012
Available online 11 August 2012
Keywords:
Anaerobic digestion
Pulp and paper
Alkaline
Ultrasonic
Pre-treatment
Waste activated sludge
* Corresponding author. Tel.: þ1 250 960 580E-mail addresses: [email protected] (N.D. Par
0961-9534/$ e see front matter ª 2012 Elsevhttp://dx.doi.org/10.1016/j.biombioe.2012.05.0
a b s t r a c t
Samples of pulp mill waste activated sludge were thickened by centrifugation, from
approximately 25 g kg�1 TS to approximately 65 g kg�1 TS, and subjected to combined
alkaline (NaOH dosage of 0.206 and 0.261 g g�1 TS respectively) and ultrasonic (39.6 and
16.8 MJ kg�1 TS, respectively) pre-treatment. Pre-treatment increased the soluble TS, VS,
and COD of the pulp sludge 3e14 times over non-treated sludge. Batch anaerobic digestions
were used to compare the effects of sludge pre-treatment. Pre-treatment did not signifi-
cantly improve biogas production over 28 d, but did increase VS reduction (21 � 3 to
30 � 0.8% for the 25 g kg�1 TS sludge and 23 � 0.5 to 27 � 0.7% for 65 g kg�1 TS sludge). Pre-
treatment increased the initial rate of methane production. 80% of the total methane
production was reached 5e6 d earlier when pre-treated. Overall methane production was
found to be 404 � 205 and 222 � 123 mL g�1 VSconsumed for 25 g kg�1 TS sludge non-treated
and pre-treated sludge and 384 � 183 and 354 � 93 mL g�1 VSconsumed for 65 g kg�1 TS non-
treated and pre-treated sludge. Pre-treatment reduced the dewaterability of both sludges.
Thickening by centrifugation reduced the total S content of the dried sludge. Overall,
biogas production from pulp sludge was unstable and inconsistent. Further research is
required to determine the cause of inhibition.
ª 2012 Elsevier Ltd. All rights reserved.
1. Introduction One method that is often used to reduce sludge volume is
The production of wood pulp for paper manufacturing uses
large amounts of water. Pulp and paper effluents are mostly
treated at the primary and secondary treatment levels
producing large amounts of secondary sludge. Disposal of
secondary sludge is costly due to its poor dewaterability [1].
The production of secondary sludge will continue to increase
as wood pulp production increases and as environmental
regulations pertaining to effluent quality become more strin-
gent [1]. Sludge disposal and management can amount to 60%
of the total cost of pulp mill wastewater treatment; for this
reason theminimization of sludge production is important [2].
4; fax: þ1 250 960 5845.k), [email protected] (S.S. Hier Ltd. All rights reserve14
anaerobic digestion (AD). Anaerobic digestion is the biological
breakdownof organicwaste in the absence of oxygen. Some of
the benefits of anaerobic digestion include; reduced sludge
volume, sludge stabilization, sludge disinfection, and energy
recovery in the form of methane. There have only been four
anaerobic treatment system utilized in Canada for the treat-
ment of pulp and paper sludge [3]. Of these four instillations
only two are currently operational [3]. Sludge produced from
the pulp and paper industry is mainly composed of microbial
cell mass that forms during secondary treatment and lignin
and chemical residuals from the pulping process [4]. These
substrates are difficult to degrade by AD. Consequently, AD of
elle), [email protected] (R.W. Thring).d.

b i om a s s a n d b i o e n e r g y 4 6 ( 2 0 1 2 ) 7 5 0e7 5 6 751
pulp sludge requires long retention times, has a low degra-
dation efficiency, and poor economics. For these reasons, AD
is not widely used in the pulp and paper industry [3,5].
Increasing sludge digestion through sludge disintegration
can increase methane production, decrease sludge volume,
reduce sludge retention time, and thereby improve the overall
economics of the process. Disintegration helps to increase the
sludge hydrolysis rate by mechanically, chemically, thermally,
or biologically aiding in the solubilization of the sludge by
reducing floc particle size and rupturing cell walls/membranes.
Alkaline addition has been shown to increase solubiliza-
tion of pulp and paper sludge and improve biogas yield [5,6].
Sodium hydroxide is most often used over other chemicals
such as KOH and Ca(OH)2 due to its high rate of COD solubi-
lization [7]. Hydroxy anionsweaken cell walls and break a part
floc structure rendering the sludge amenable to further
treatment. Alkaline pre-treatment has been combined with
ultrasound, microwave, thermal, high pressure gradients, to
further sludge breakdown [8e11].
Ultrasound treatment of wastewater sludge has been
studied at length due to its ease of operation and effectiveness
[12]. Ultrasound treatment involves using high frequency
sound waves generated by a vibrating probe. As the sound
waves travel through the liquid, gas bubbles are formed and
collapse violently producing localized high temperatures and
pressures. Cell walls and floc structures are destroyed making
their contents’ susceptible to anaerobic digestion. Combina-
tions of both ultrasound and alkali pre-treatment have been
shown to improve sludge digestion over either treatment alone
[13,8]. Improvement of sludge sonication efficiency has been
improved by increasing the solids content of the sludge [14,15].
Much of the research conducted on the pre-treatment of
secondary sludges has been utilizing municipal wastewater
sludge. Much less has been reported on the pre-treatment of
sludges produced from pulp mill wastewater treatment [3].
Some pre-treatment of pulp sludge have been reported in the
literature, however; few have reported combined treatment
methods, or have pre-treated thickened pulp sludge [5,16,17].
The objective of this experiment was to determine the
methane potential of secondary sludge produced by the
Quesnel River Pulp (QRP) mill. Thickened (65 g kg�1 TS) and
non-thickened sludges (25 g kg�1 TS) were subject to alkaline
pre-treatment followed by ultrasonication in order to improve
sludge AD efficiency and compared to non pre-treated sludge.
Pre-treatment effectiveness was analysed by comparing the
soluble COD, soluble TS and soluble VS fraction in treated and
non-treated sludges. AD efficiency was based on methane
production and VS reduction. Hydrogen sulphide production
was also calculated by comparing sludge sulphur content
before and after digestion. QRP sludge is known to be high in S
due to sulphite addition during the pulping process.
2. Materials and methods
2.1. Pulp sludge sample
Secondary sludge was collected from the Quesnel River Pulp
mill, in Quesnel, B.C. Canada. The QRPmill produces bleached
chemi-thermo-mechanical pulp (BCTMP) and thermo
mechanical pulp (TMP). Wastewater is composed of approxi-
mately 2:1 BCTMP: TMP effluent. The plant typically uses 60%
white spruce and 40% lodgepole pine. Wastewater is treated
using a moving bed biological reactor followed by activated
sludge treatment. Pulp mill sludge (PMS) samples were stored
at 4 �C and used within 24 h of sampling.
2.2. Pre-treatment
Sludge was used at initial solids content and was thickened to
approximately 65 g kg�1 TS by centrifugation at 2415 g for
5 min. Non-thickened sludge was dosed with NaOH at
500 mg L�1 (0.206 g g�1 TS) and thickened pulp sludge was
dosed with NaOH at 1700mg L�1 (0.261 g g�1 TS). Samples were
then mixed for 10 min using a Hamilton Beach� handheld
mixer, and allowed to sit for 2 h. 200 mL portions of treated
sludge were then sonicated using a 40 kHz Fisher Scientific�model 150T ultrasonic dismembrator. Sludge samples were
packed in ice to prevent overheating and sonicated for 2 h, 10 s
on 5 s off, for a total of 80min, at 60% amplitude, with a 3.2mm
micro-tip titanium probe. Specific energy was defined as,
Es ¼ ðPÞðtÞ=ðvÞðTSÞ;where, P ¼ ultrasonic power (W), t ¼ ultrasonic time (s),
v ¼ sample volume (L), TS ¼ total solids concentration (kg L�1).
Values were calculated to be 39.6MJ kg�1 TS for the 25 g kg�1 TS
sample and 16.8 MJ kg�1 TS for the 65 g kg�1 TS sample.
2.3. Sludge characterisation
Approximately 15 L of pulp sludge was sampled for use in
batch experiments. Sludge samples were characterised for TS
and VS in duplicate by standard methods [18]. COD was
determined in triplicate on diluted sludge samples by the
closed reflux method outlined by the Hach method 8000 [19].
Sludge samples were centrifuged at 22,360 g for 10 min and
decanted to determine the soluble TS, soluble VS, and soluble
COD. Supernatant pH was determined using an Orion pH
probe. Pulp sludge samples where dried at 104 �C for 48 h and
analysed for total C, N, and S content using <100-mesh
samples (ground in a Model MM200 ball mill; Retsch, Haan,
Germany) via dry combustion method in a Model 1500
Elemental Analyser (Fisons, Milan, Italy).
2.4. Inoculum sludge
Sludge was collected from the primary anaerobic digester at
the Lansdowne wastewater treatment plant (LWWTP) in
Prince George, B.C., Canada, for use as inoculum. Anaerobic
digesters are fed semi-continuously with sludge from two
primary clarifiers as well as solids collected from final clarifi-
cation. The primary digester is operated at mesophilic
(36 � 1 �C) temperature. More information on the wastewater
treatment process at the Lansdowne Wastewater Treatment
Plant can be found in Park et al. [20].
2.5. Batch digestions
250 mL amber glass bottles were filled with 75 g of LWWTP
sludge inoculum and 75 g of pulp mill sludge. Control
b i om a s s an d b i o e n e r g y 4 6 ( 2 0 1 2 ) 7 5 0e7 5 6752
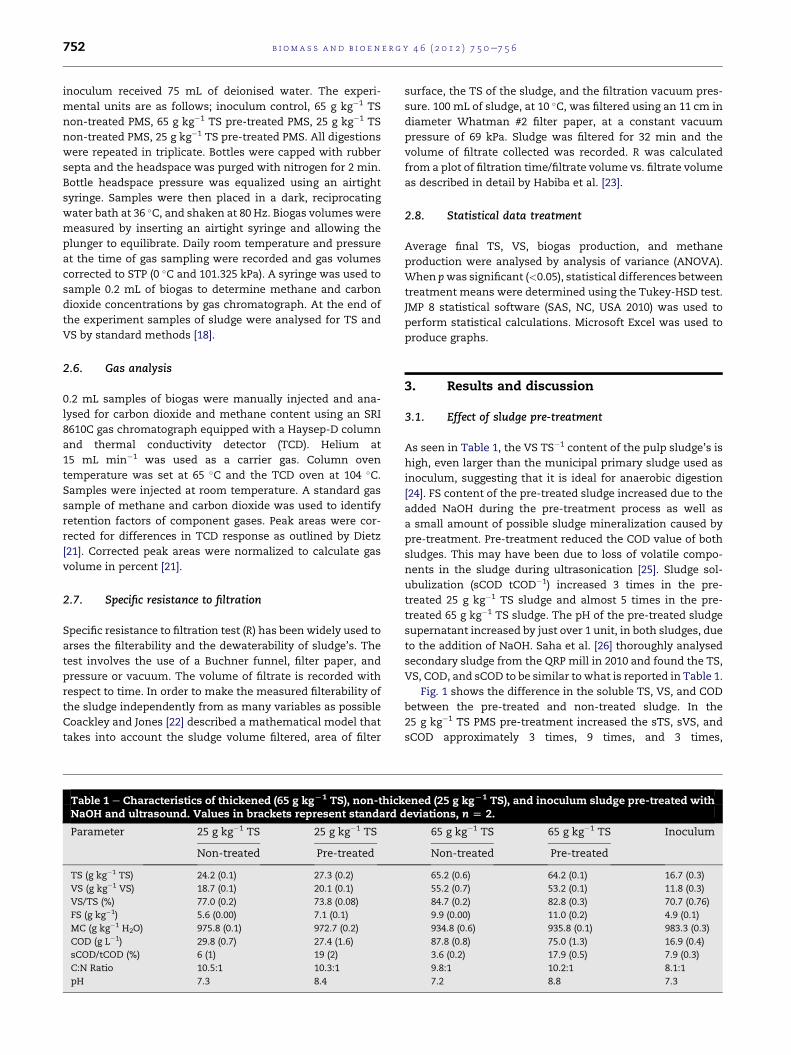
inoculum received 75 mL of deionised water. The experi-
mental units are as follows; inoculum control, 65 g kg�1 TS
non-treated PMS, 65 g kg�1 TS pre-treated PMS, 25 g kg�1 TS
non-treated PMS, 25 g kg�1 TS pre-treated PMS. All digestions
were repeated in triplicate. Bottles were capped with rubber
septa and the headspace was purged with nitrogen for 2 min.
Bottle headspace pressure was equalized using an airtight
syringe. Samples were then placed in a dark, reciprocating
water bath at 36 �C, and shaken at 80 Hz. Biogas volumes were
measured by inserting an airtight syringe and allowing the
plunger to equilibrate. Daily room temperature and pressure
at the time of gas sampling were recorded and gas volumes
corrected to STP (0 �C and 101.325 kPa). A syringe was used to
sample 0.2 mL of biogas to determine methane and carbon
dioxide concentrations by gas chromatograph. At the end of
the experiment samples of sludge were analysed for TS and
VS by standard methods [18].
2.6. Gas analysis
0.2 mL samples of biogas were manually injected and ana-
lysed for carbon dioxide and methane content using an SRI
8610C gas chromatograph equipped with a Haysep-D column
and thermal conductivity detector (TCD). Helium at
15 mL min�1 was used as a carrier gas. Column oven
temperature was set at 65 �C and the TCD oven at 104 �C.Samples were injected at room temperature. A standard gas
sample of methane and carbon dioxide was used to identify
retention factors of component gases. Peak areas were cor-
rected for differences in TCD response as outlined by Dietz
[21]. Corrected peak areas were normalized to calculate gas
volume in percent [21].
2.7. Specific resistance to filtration
Specific resistance to filtration test (R) has been widely used to
arses the filterability and the dewaterability of sludge’s. The
test involves the use of a Buchner funnel, filter paper, and
pressure or vacuum. The volume of filtrate is recorded with
respect to time. In order to make the measured filterability of
the sludge independently from as many variables as possible
Coackley and Jones [22] described a mathematical model that
takes into account the sludge volume filtered, area of filter
Table 1 e Characteristics of thickened (65 g kgL1 TS), non-thickNaOH and ultrasound. Values in brackets represent standard d
Parameter 25 g kg�1 TS 25 g kg�1 TS
Non-treated Pre-treated
TS (g kg�1 TS) 24.2 (0.1) 27.3 (0.2)
VS (g kg�1 VS) 18.7 (0.1) 20.1 (0.1)
VS/TS (%) 77.0 (0.2) 73.8 (0.08)
FS (g kg�1) 5.6 (0.00) 7.1 (0.1)
MC (g kg�1 H2O) 975.8 (0.1) 972.7 (0.2)
COD (g L�1) 29.8 (0.7) 27.4 (1.6)
sCOD/tCOD (%) 6 (1) 19 (2)
C:N Ratio 10.5:1 10.3:1
pH 7.3 8.4
surface, the TS of the sludge, and the filtration vacuum pres-
sure. 100 mL of sludge, at 10 �C, was filtered using an 11 cm in
diameter Whatman #2 filter paper, at a constant vacuum
pressure of 69 kPa. Sludge was filtered for 32 min and the
volume of filtrate collected was recorded. R was calculated
from a plot of filtration time/filtrate volume vs. filtrate volume
as described in detail by Habiba et al. [23].
2.8. Statistical data treatment
Average final TS, VS, biogas production, and methane
production were analysed by analysis of variance (ANOVA).
When pwas significant (<0.05), statistical differences between
treatment means were determined using the Tukey-HSD test.
JMP 8 statistical software (SAS, NC, USA 2010) was used to
perform statistical calculations. Microsoft Excel was used to
produce graphs.
3. Results and discussion
3.1. Effect of sludge pre-treatment
As seen in Table 1, the VS TS�1 content of the pulp sludge’s is
high, even larger than the municipal primary sludge used as
inoculum, suggesting that it is ideal for anaerobic digestion
[24]. FS content of the pre-treated sludge increased due to the
added NaOH during the pre-treatment process as well as
a small amount of possible sludge mineralization caused by
pre-treatment. Pre-treatment reduced the COD value of both
sludges. This may have been due to loss of volatile compo-
nents in the sludge during ultrasonication [25]. Sludge sol-
ubulization (sCOD tCOD�1) increased 3 times in the pre-
treated 25 g kg�1 TS sludge and almost 5 times in the pre-
treated 65 g kg�1 TS sludge. The pH of the pre-treated sludge
supernatant increased by just over 1 unit, in both sludges, due
to the addition of NaOH. Saha et al. [26] thoroughly analysed
secondary sludge from the QRP mill in 2010 and found the TS,
VS, COD, and sCOD to be similar to what is reported in Table 1.
Fig. 1 shows the difference in the soluble TS, VS, and COD
between the pre-treated and non-treated sludge. In the
25 g kg�1 TS PMS pre-treatment increased the sTS, sVS, and
sCOD approximately 3 times, 9 times, and 3 times,
ened (25 g kgL1 TS), and inoculum sludge pre-treated witheviations, n [ 2.
65 g kg�1 TS 65 g kg�1 TS Inoculum
Non-treated Pre-treated
65.2 (0.6) 64.2 (0.1) 16.7 (0.3)
55.2 (0.7) 53.2 (0.1) 11.8 (0.3)
84.7 (0.2) 82.8 (0.3) 70.7 (0.76)
9.9 (0.00) 11.0 (0.2) 4.9 (0.1)
934.8 (0.6) 935.8 (0.1) 983.3 (0.3)
87.8 (0.8) 75.0 (1.3) 16.9 (0.4)
3.6 (0.2) 17.9 (0.5) 7.9 (0.3)
9.8:1 10.2:1 8.1:1
7.2 8.8 7.3

0
2000
4000
6000
8000
10000
12000
14000
16000
18000
Non Treated 25 Pre-treated 25 Non-treated 65 Pre-treated 65
Solu
ble
Con
cent
ratio
ns (m
g L
)-1 sTSsVSsCOD
Fig. 1 e Difference in soluble TS, VS, and COD between pre-
treated and non-treated sludge (g kgL1 TS). Error bars
represent the standard deviation of 2 (TS and VS), or 3
(COD) measurements.
0.0
100.0
200.0
300.0
400.0
500.0
600.0
700.0
0.0 3.0 6.0 9.0 12.0 15.0 18.0 21.0 24.0 27.0 30.0
Time (d)
Cum
ulat
ive
Net
Bio
gas
Prod
uctio
n (m
L, S
TP)
Fig. 2 e Net cumulative biogas generation. , 65 g kgL1 TS
pre-treated D 65 g kgL1 TS non-treated B 25 g kgL1 TS pre-
treated > 25 g kgL1 TS non-treated. Error bars represent
the standard deviation of three replicates. Biogas
generated from inoculum only blanks was subtracted from
the data.
b i om a s s a n d b i o e n e r g y 4 6 ( 2 0 1 2 ) 7 5 0e7 5 6 753
respectively. Pre-treatment of 65 g kg�1 TS PMS increased the
sTS, sVS, and sCOD approximately 4 times, 13 times, and 4
times, respectively. The 65 g kg�1 TS sludge was dewatered by
centrifugation prior to use. This would have lowered the
initial soluble organic content of the sludge making effects of
pre-treatment seem larger. Also, the 65 g kg�1 TS sludge was
dosed with a higher concentration of NaOH (initial sludge
tests indicated a TS content of 82 g kg�1 TS when centrifuged
at 2415 g for 5 min, but the subsequent batch of sludge used in
this test was more difficult to dewater). Pre-treatment of
65 g kg�1 TS sludge may have also improved due to increased
ultrasound efficiency at higher TS levels [14,15].
Wood et al. [17] treated sulfite mill secondary sludge and
Kraft mill secondary sludge with ultrasound at 20 kHz. COD
solubilisation was low compared to other pre-treatment
methods. Similarly to this study, the sulfite mill secondary
sludge increased from 11% sCOD to 23% sCOD and the Kraft
mill sludge increased from 1% to approximately 5% sCOD after
treatment. Saha et al. [26] have also treated pulp mill
secondary sludge originating from the QRPwith ultrasound (at
20 kHz) and found sCOD increased with increasing treatment
time. The sCOD tCOD�1 values were slightly higher than re-
ported in this study. Values increased from 5 to 7.8 times over
the control depending on the treatment time. Yunquin et al.
[5] treated a combination of primary and secondary pulp and
paper sludge with lower dose (NaOH dosage of 0.16 g g�1 TS)
for a longer time (6 h). sCOD increased approximately 12 times
when compared to the control.
3.2. Biogas production
Initially, biogas production increased in both of the sludge’s
compared to the non pre-treated sludge’s (Fig. 2). Around d 20
(for the 65 g kg�1 TS sludge) and d 13 (for the 25 g kg�1 TS
sludge) the cumulative biogas volume of the non-treated
sludge surpassed the pre-treated sludge. After 28 d both of
the non-treated sludge’s had produced more biogas than the
pre-treated sludge (Fig. 2). Statistically pre-treatment of
sludge did not increase biogas production.Wood et al. [17] also
reported that pre-treatment with sonication did not signifi-
cantly increase biogas yield in either Kraft or sulphite pulp
mill sludges, yet an initial improvement in the rate of gas
production was observed. 80% of the total biogas production
was reached by d 8.5 for the pre-treated 25 g kg�1 TS sludge
compared to d 14.5 for the non pre-treated 25 g kg�1 TS sludge
(data not shown). This is an increase of 6 d. For the 65 g kg�1 TS
sludge, 80% of total biogas production was reached by d 8 for
the pre-treated sludge compared to d 13 for the non pre-
treated sludge (data not shown). This was an improvement
of 5 d.
3.3. Methane production
Initially, methane production increased in both of the sludge’s
compared to the non-treated sludge’s (Fig. 3). On approxi-
mately d 23 (for the 65 g kg�1 TS sludge) and d 12 (for the
25 g kg�1 TS sludge) the cumulativemethane production of the
non pre-treated sludge surpassed the pre-treated sludge. After
28 d both of the non-treated sludges had produced more
methane than the pre-treated sludge (Fig. 2). However, pre-
treatment did not significantly improve methane produc-
tion. 80% of the total methane production was reached by
approximately d 7.5 for the pre-treated 25 g kg�1 TS sludge
compared to d 14 for the non pre-treated 25 g kg�1 TS sludge
(data not shown), an increase of 6.5 d. For the 65 g kg�1 TS
sludge, 80% of total biogas production was reached by d 7.5 for
the pre-treated sludge compared to d 13 for the non pre-
treated sludge (data not shown). This was an improvement
of 5.5 d. Karlsson et al. [27] also reported very similar trends in
methane production after pre-treating WAS, emanating from
two different pulp mills, with ultrasound. Initial methane
production rates increased, but the effects were diminished
over time [27].
Overall methane and biogas production decreased slightly
when sludge was pre-treated. The results obtained by Wood
et al. [17] suggested that addition of NaOH may solubilize

0.0
50.0
100.0
150.0
200.0
250.0
300.0
350.0
400.0
0.0 3.0 6.0 9.0 12.0 15.0 18.0 21.0 24.0 27.0 30.0
Time (d)
Cum
ulat
ive
Net
Met
hane
Pro
duct
ion
(mL,
STP
)
Fig. 3 e Net cumulative methane generation. ,
65 g kgL1 TS pre-treated D 65 g kgL1 TS non-treated B
25 g kgL1 TS pre-treated > 25 g kgL1 TS non-treated. Error
bars represent the standard deviation of three replicates.
Methane generated from inoculum only blanks was
subtracted from the data.
b i om a s s an d b i o e n e r g y 4 6 ( 2 0 1 2 ) 7 5 0e7 5 6754
recalcitrant compounds, or generate inhibitory compounds
thus lowering the methane yield. Mineralization of sludge
components may have caused the slightly lower methane
output from the pre-treated sludge. Ultrasonication may have
also liberated volatile components in the sludge. As seen in
Table 1, the FS content of both sludges increased, and the VS/
TS ratio decreased after pre-treatment.
3.4. Sludge characteristics post digestion
The net VSconsumed in the pre-treated sludge’s was signifi-
cantly greater than non-treated sludge’s (Table 2). This cor-
responded to a greater VS reduction efficiency in pre-treated
sludge (Table 2). Improvements were similar to those re-
ported by Saha et al. [27] who at after 90 min of sonication at
20 kHz and 45 d of AD, using QRP sludge, improved VS
reduction from 23� 3 to 30� 4%. Net production of biogas was
statistically the same whether or not sludge was pre-treated
Table 2 e Sludge characteristics post anaerobic digestion. Valuwith different letters indicate significant treatment effects with
Parameter 25 g kg�1 TS 2
Non-treated P
Initial VS (g) 1.397 (0.044) 1
Final VS (g) 1.108 (0.042) a 1
VS consumed (g) 0.290 (0.042) a 0
VS reduction (%) 21 (3) a 3
Net biogas (mL) 180 (99) a 1
Biogas (mL g�1 VSConsumed) 603 (299) a 3
Net methane (mL) 122 (69) a 1
Methane (mL g�1 VSConsumed) 404 (205) a 2
% CH4 in biogas 64 � 70 6
Final pH 7.4 7
R (m kg�1) 5.61E þ 14 9
[27]. Due to the higher VS reduction efficiency, biogas
produced (mL g�1 VSconsumed) was lower in the pre-treated
sludge. Biogas production was 3e4 times greater in the
65 g kg�1 TS sludge than the 25 g kg�1 TS sludge due to the
increased VS content of the thickened sludge. Net methane
production was also the same and did not change with pre-
treatment. Methane content of the biogas was slightly
higher for pre-treated sludges. Methane production was
consistent with the values reported (320mL g�1 VSconsumed) for
batch digestions of PMS, pre-treated with NaOH, by Yunqin
et al. [5]. Puhakka [28] reported similar values for biogas
generation, 570 mL g�1 VSconsumed, using a pilot scale reactor
to digest Kraft pulp mill WAS.
It should be noted that overall biogas production was
unstable. At least one batch digestion out of three (in some
cases two) had a significantly lower biogas production
compared to the other two samples. This can bee seen in the
high standard deviations reported for net methane and biogas
production. More research is required to determine the cause
of inhibition.
Final pH of supernatant from digested sludge was found to
be near the optimum range of 6.7e7.5 for methane-forming
bacteria [29]. This suggests that addition of sodium
hydroxide did not adversely affect the AD process.
Pre-treatment almost doubled the specific resistance to
filtration of both the digested sludges as seen by the larger R
values reported in Table 2. Saha et al. [26] also reported
a reduction of the pre-digestion sludge dewaterability after
ultrasonication.
3.5. Sulphur reduction
Initial total sulphur content was lower in the thickened sludge
than the non-thickened. This suggests that themajority of the
sulphur is in soluble forms (most likely SO2�4 ) and dewatering
by centrifugation decreases the sulphur content considerably.
Pre-treatment had no discernable effect on the sulphur
concentration of the sludge. Non-thickened sludge had
increased sulphur consumption (Table 3) when compared to
thickened sludge due to the overall higher soluble sulphur
component. Maximum H2S content was calculated by
es in brackets represent standard deviations, n [ 3. Meansin plant type (p < 0.05).
5 g kg�1 TS 65 g kg�1 TS 65 g kg�1 TS
re-treated Non-treated Pre-treated
.511 (0.046) 4.142 (0.080) 3.990 (0.044)
.057 (0.012) a 3.189 (0.019) b 2.932 (0.029) c
.454 (0.012) b 0.952 (0.019) c 1.058 (0.029) d
0 (1) b 23 (1) ab 27 (1) bc
43 (90) a 582 (280) a 549 (153) a
13 (195) a 610 (290) a 518 (137) a
02 (58) a 366 (176) a 375 (105) a
22 (123) a 384 (183) a 354 (93) a
6 � 70 62 � 66 65 � 69
.5 7.5 7.6
.61E þ 14 7.91E þ 14 14.6E þ 14

Table 3 e Sulphur reduction.
Parameter 25 g kg�1 TS 25 g kg�1 TS 65 g kg�1 TS 65 g kg�1 TS Inoculum
Non-treated Pre-treated Non-treated Pre-treated
Sulphur (g kg�1 TS) 19.7 (0.2) 19.8 (0.3) 13.9 (0.2) 13.7 (0.2) 9.9 (0.2)
Initial S (mg batch�1) 52.7 (0.6) 48.3 (0.7) 79.0 (1.1) 79.1 (1.0) 12.3 (0.3)
Final S (mg batch�1) 40.5 (0.6) 30.3 (0.7) 67.4 (1.2) 68.8 (0.4) 10.8 (0.7)
Net diff (mg batch�1) 10.8 (1.2) 16.6 (1.3) 10.2 (1.8) 8.9 (1.3) 1.46 (0.8)
H2S max (% volume biogas) 4.0 (2.2) 7.7 (4.9) 1.2 (0.6) 1.1 (0.3) 0.7 (0.4)
b i om a s s a n d b i o e n e r g y 4 6 ( 2 0 1 2 ) 7 5 0e7 5 6 755
assuming that all net sulphur lost (initial S mg batch�1 e final
S mg batch�1 e inoculum sulphur lost mg batch�1) was in the
form of H2S. This was not the case as some sulphur may have
been liberated as other reduced sulphur compounds such as
methylsulphide and dimethlysulphide. Therefore the values
stated in Table 3 are high estimates. Standard deviations are
also high due to the variability in biogas production. The
estimated volume fraction of hydrogen sulphide produced
from the thickened sludge was in the necessary range for
proper operation, 0.5e6% [30]. Dufresne et al. [31] reported
excellent biogas production, and COD removal, anaerobically
digesting Kraft pulp mill condensates at a biogas hydrogen
sulphide volume fraction close to 4%. Non-thickened sludge
was near the upper limit for H2S headspace concentration
suggesting that sludge thickening may be necessary to reduce
the soluble sulphur component, and lower the H2S content of
the biogas in order to prevent problems with H2S inhibition.
3.6. Economics
Pre-treatment using a lab scale ultrasound device requires
approximately 297kWhm�3 for the25gkg�1 TSand65gkg�1 TS
sludge each. At 70 $ MWh�1 it would cost approximately
21.00 $ m�3 for ultrasonic pre-treatment. Sodium hydroxide
addition at 350 $ Mg�1 would cost 1.75 $ for the 25 g kg�1 TS
sludge and 5.95 $ for the 65 g kg�1 TS sludge per m3 making the
overall cost for pre-treatment 22.75 $ m�3 (25 g kg�1 TS) and
26.95 $m�3 (65 g kg�1 TS). Capital investment, ultrasound probe
replacement (every 1.5e2 years), operational, andmaintenance
costs would also have to be considered. Also, decreased dew-
aterabilitywould increase costs associatedwithdewateringand
disposal. With no significant increase in methane production
thecostofpre-treatmentwouldnotbeeconomical.Onepossible
benefit would be the increased VS reduction, and a shorter
digestion time. This could savemoney by allowing for a smaller
digester tobeconstructed,orperhapspostponetheconstruction
of a new digester if the current digester was near capacity.
Theoretically, even if the VS destruction rate had increased 2
fold (from 23 to 46%) and biogas was sold at a premium
(10.00 $ GJ�1) total revenuewould amount to an extra 1.40 $m�3
of sludge treated at 65 g kg�1 TS. Estimating disposal costs at
250 $ Mg�1 TS savings due to sludge pre-treatment would be
3.10 $m�3. This is a total savings of 4.50 $ m�3 due to increased
biogas production and decreased sludge disposal costs. Muller
et al. [32] estimate that for a municipal wastewater treatment
plant theoretically using pre-treatment to improve VS destruc-
tion by 20%, at 50 g kg�1 TS, with a 250,000 PE sized plant, with
much lower pre-treatment energy demand (0.3 kWh Mg�1 TS)
pre-treatmentwouldonlybeeconomical if sludgedisposal costs
were greater than 670 $ Mg�1 TS. Specific data for achieved
level of disintegration, costs for sludge disposal, and volume of
wastewater treated must be examined thoroughly to decide
if thepre-treatment isworthwhile ineachindividualsetting [32].
4. Conclusions
� Methane production (average of pre-treated and non-
treated) from QRP sludge produced 340 � 150 mL g�1
VSconsumed.
� Pre-treatment increased volatile solids removal in both the
thickened (by 4%) and non-thickened sludge (by 9%).
� Pre-treatment did not increase the overall methane yield,
but did increase the initial rate of methane production.
� 80% of total methane/biogas production was reached
5.5e6.5 d faster when pre-treated.
� Pre-treatment decreased the dewaterability of the sludge.
� Thickening of sludge reduced the total S content of the
sludge and subsequently reduced the amount of sulphur
lost during anaerobic digestion.
� Overall, biogas production from pulp sludge was unstable
and inconsistent.
� Further research is required to determine the cause of
inhibition.
Acknowledgements
The authors of this paper would like to thankWest Fraser, the
Quesnel River Pulp Mill, and Nick Finch for supplying sludge
samples. The City of Prince George helped to supply sludge
inoculum samples. Also, we would like to thank Clive Dawson
at the British Columbia Ministry of Forests laboratory in
Victoria, B.C. for completing some of the analysis. This
research was funded by the National Sciences and Engi-
neering Research Council of Canada.
r e f e r e n c e s
[1] Mahmood T, Elliot A. A review of secondary sludge reductiontechnologies for the pulp and paper industry. Water Res2006;40(11):2093e112.
[2] Canales A, Pareilleux A, Rols JL, Goma G, Huyard A.Decreased sludge production strategy for domesticwastewater treatment. Water Sci Technol 1994;30(8):97e106.

b i om a s s an d b i o e n e r g y 4 6 ( 2 0 1 2 ) 7 5 0e7 5 6756
[3] Elliot A, Mahmood T. Pretreatment technologies foradvancing anaerobic digestion of pulp and paperbiotreatment residues. Water Res 2007;41(19):4273e86.
[4] Kyllonen HL, Lappi MK, Thun RT, Musteanta AH.Treatment and characterisation of biological sludges fromthe pulp and paper industry. Water Sci Technol 1998;20(1):183e92.
[5] Yunqin L, Dehan W, Shaoquan W, Chunmin W. Alkali pre-treatment enhances biogas production in the anaerobicdigestion of pulp and paper sludge. J Hazard Mater 2009;170(1):366e73.
[6] Heo N, Park S, Kang H. Solubilization of waste activatedsludge by alkaline pre-treatment and biochemical methanepotential (BMP) test for anaerobic co- digestion ofmunicipal organic waste. Water Sci Technol 2003;48(8):211e9.
[7] Kim J, Park C, Kim T, Lee M, Kim S, Lee J. Effects of variouspretreatments for enhanced anaerobic digestion with wasteactivated sludge. J Biosci Bioeng 2003;95(3):271e5.
[8] Yiying J, Huan L. Combined alkaline and ultrasonic pre-treatment of sludge before anaerobic digestion. J Environ Sci2009;21(3):279e84.
[9] Dogan I, Sanin DF. Alkaline solubilization and microwaveirradiation as a combined sludge disintegration andminimization method. Water Res 2009;43(8):2139e48.
[10] Neyens E, Baeyens J. A review of thermal sludge pre-treatment processes to improve dewaterability. J HazardMater 2003;98(1e3):51e67.
[11] Daniel G, Morton R, Chi-Chung T, Horvath R. The effect of themicrosludgeTM treatment process on anaerobic digestionperformance. Proc WEF 2007;21-30:1724e38.
[12] Khanal SK, Grewell D, Sung S, van Leeuwen HJ. Ultrasoundapplications in wastewater sludge pre-treatment: a review.Crit Rev Env Sci Technol 2007;37(4):277e313.
[13] Chiu Y, Chang C, Lin J, Huang S. Alkaline and ultrasonic pre-treatment of sludge before anaerobic digestion. Water SciTechnol 1997;36(11):155e62.
[14] Wang F, Shan L, Ji M. Components of released liquid fromultrasonic waste activated sludge disintegration. UltrasonSonochem 2006;13(4):334e8.
[15] Khanal SK, Isik H, Sung S, van Leeuwen HJ. Effects ofultrasound pre- treatment on aerobic digestibility ofthickened waste activated sludge. In: Gonzalez Martinez S,editor. Proceedings of 7th specialized conference on smallwater and wastewater systems; 7e10 March 2006. MexicoCity, Mexico: IWA Publishing; 2007.
[16] Yunqin L, Dehan W, Lishang W. Biological pre-treatmentenhances biogas production in the anaerobic digestion ofpulp and paper sludge. Waste Manag Res 2010;29(6):800e10.
[17] Wood N, Tran H, Master E. Pretreatment of pulp millsecondary sludge for high-rate anaerobic conversion tobiogas. Bioresour Technol 2009;100(23):5729e35.
[18] Lenore S, Clesceri AE, Greenberg AD, Eaton MH, editors.Standard methods for the examination of water andwastewater. 20th ed. Washington: APHA AWWA WEF; 1998.
[19] Hachproceduremethod8000, oxygendemand, chemical, highrange. Water analysis handbook [Internet]. Loveland: HachCompany; 2011, [cited 09.12.11]. Available from: http://www.hach.com/product.detail-downloads.jsa?id¼7640185976.
[20] Park N, Thring RW, Garton R, Rutherford M, Helle S. Increasedbiogas production in a wastewater treatment plant byanaerobic co-digestion of fruit and vegetable waste and sewersludge-a full scale study. Water Sci Technol 2011;64(9):1851e6.
[21] Dietz W. Response factors for gas chromatographic analyses.J Gas Chromatogr 1967;5(2):68e71.
[22] Coackley P, Jones BRS. Vacuum sludge filtration: 1.Interpretation of results by the concept of specific filtration.Sewage Ind 1956;28(8):963e76.
[23] Habiba L, Hassib B, Moktar H. Improvement of activatedsludge stabilisation and filterability during anaerobicdigestion by fruit and vegetable waste addition. BioresourTechnol 2009;100(4):1555e60.
[24] Zhang R, El-Mashad H, Hartman K, Wang F, Lui G, Choate C,et al. Characterisation of food waste as feedstock foranaerobic digestion. Bioresour Technol 2007;98(4):929e35.
[25] Santos HM, Lodeiro C, Capelo-Martinez JL. The power ofultrasound. In: Ultrasound in chemistry: analyticalapplications. Weinheim: Wiley; 2009. p. 1e15.
[26] Saha M, Eskicioglu C, Marin J. Microwave, ultrasonic andchemo-mechanical pre-treatments for enhancing methanepotential of pulp mill wastewater treatment sludge.Bioresour Technol 2011;102(17):7815e26.
[27] Karlsson A, Truong X, Gustavsson J, Svensson B, Nilsson F,Ejlertsson J. Anaerobic treatment of activated sludge fromSwedish pulp and paper mills-biogas production andpotential limitations. Environ Technol 2011;32(14):1559e71.
[28] Puhakka J, Alavakeri M, Shieh W. Anaerobic treatment ofKraft pulp-mill waste activated-sludge: gas production andsolids reduction. Bioresour Technol 1992;39(1):61e8.
[29] Deublein D, Steinhauser A. Biogas from waste and renewableresources. Wheinheim: Wiley; 2008.
[30] Chynoweth D, Isaacson R. Anaerobic digestion of biomass.New York: Elsevier Applied Science; 1987.
[31] Dufresne R, Liard A, Blum M. Anaerobic treatment ofcondensates: trial at a Kraft pulp and paper mill. WaterEnviron Res 2001;73(1):103e9.
[32] Muller JA, Winter A, Strunkmann G. Investigation andassessment of sludge pre-treatment processes. Water SciTechnol 2004;49(10):97e104.